Machine Learning to Ensure Data Integrity in Power System ...
17
electronics Article Machine Learning to Ensure Data Integrity in Power System Topological Network Database Adnan Anwar 1, * ,† , Abdun Mahmood 2 , Biplob Ray 3 , Md Apel Mahmud 4 and Zahir Tari 5 1 School of IT, Deakin University, Geelong, VIC 3216, Australia 2 Department of Computer Science and Information Technology, La Trobe University, Bundoora, VIC 3086, Australia; [email protected] 3 Centre for Intelligent Systems (CIS), Central Queensland University, Rockhampton, QLD 4701, Australia; [email protected] 4 School of Engineering, Deakin University, Geelong, VIC 3216, Australia; [email protected] 5 Department of Computer Science and Software Engineering, RMIT University, Melbourne, VIC 3000, Australia; [email protected] * Correspondence: [email protected] † Current address: 75 Pigdons Rd, Waurn Ponds VIC 3216, Australia. Received: 29 March 2020; Accepted: 20 April 2020; Published: 24 April 2020 Abstract: Operational and planning modules of energy systems heavily depend on the information of the underlying topological and electric parameters, which are often kept in database within the operation centre. Therefore, these operational and planning modules are vulnerable to cyber anomalies due to accidental or deliberate changes in the power system database model. To validate, we have demonstrated the impact of cyber-anomalies on the database model used for operation of energy systems. To counter these cyber-anomalies, we have proposed a defence mechanism based on widely accepted classification techniques to identify the abnormal class of anomalies. In this study, we find that our proposed method based on multilayer perceptron (MLP), which is a special class of feedforward artificial neural network (ANN), outperforms other exiting techniques. The proposed method is validated using IEEE 33-bus and 24-bus reliability test system and analysed using ten different datasets to show the effectiveness of the proposed method in securing the Optimal Power Flow (OPF) module against data integrity anomalies. This paper highlights that the proposed machine learning-based anomaly detection technique successfully identifies the energy database manipulation at a high detection rate allowing only few false alarms. Keywords: smart grid; energy system; database; MLP; machine learning; OPF; anomaly 1. Introduction In recent years, reassurance of information integrity in the energy sector has become crucial as several cyber security vulnerabilities on the complex energy system infrastructure have proven to be related to data anomalies. In 2010, the invention of “the Stuxnet worm” [1] has made the industrial and research communities more concerned about the data integrity, privacy and confidentiality of the real-time operation of control centres. In a recent report of the “Industrial Control Systems Cyber Emergency Response Team (ICS-CERT)”, it has been mentioned that among the 200 cyber security incidents that happened across all the critical infrastructure in 2013, the maximum number of attacks (111 in incidents) are observed in the energy sector (53%) [2]. Due to smartisation of the grid, physical energy systems are highly coupled with the Information and Communication Technology (ICT)-based cyber systems. These introduced new security Electronics 2020, 9, 693; doi:10.3390/electronics9040693 www.mdpi.com/journal/electronics
Transcript of Machine Learning to Ensure Data Integrity in Power System ...
electronics
Article
Machine Learning to Ensure Data Integrity in PowerSystem Topological Network Database
Adnan Anwar 1,*,† , Abdun Mahmood 2 , Biplob Ray 3 , Md Apel Mahmud 4 andZahir Tari 5
1 School of IT, Deakin University, Geelong, VIC 3216, Australia2 Department of Computer Science and Information Technology, La Trobe University,
Bundoora, VIC 3086, Australia; [email protected] Centre for Intelligent Systems (CIS), Central Queensland University, Rockhampton, QLD 4701, Australia;
[email protected] School of Engineering, Deakin University, Geelong, VIC 3216, Australia; [email protected] Department of Computer Science and Software Engineering, RMIT University,
Melbourne, VIC 3000, Australia; [email protected]* Correspondence: [email protected]† Current address: 75 Pigdons Rd, Waurn Ponds VIC 3216, Australia.
Received: 29 March 2020; Accepted: 20 April 2020; Published: 24 April 2020�����������������
Abstract: Operational and planning modules of energy systems heavily depend on the informationof the underlying topological and electric parameters, which are often kept in database withinthe operation centre. Therefore, these operational and planning modules are vulnerable to cyberanomalies due to accidental or deliberate changes in the power system database model. To validate,we have demonstrated the impact of cyber-anomalies on the database model used for operation ofenergy systems. To counter these cyber-anomalies, we have proposed a defence mechanism based onwidely accepted classification techniques to identify the abnormal class of anomalies. In this study,we find that our proposed method based on multilayer perceptron (MLP), which is a special class offeedforward artificial neural network (ANN), outperforms other exiting techniques. The proposedmethod is validated using IEEE 33-bus and 24-bus reliability test system and analysed using tendifferent datasets to show the effectiveness of the proposed method in securing the Optimal PowerFlow (OPF) module against data integrity anomalies. This paper highlights that the proposed machinelearning-based anomaly detection technique successfully identifies the energy database manipulationat a high detection rate allowing only few false alarms.
Keywords: smart grid; energy system; database; MLP; machine learning; OPF; anomaly
1. Introduction
In recent years, reassurance of information integrity in the energy sector has become crucial asseveral cyber security vulnerabilities on the complex energy system infrastructure have proven to berelated to data anomalies. In 2010, the invention of “the Stuxnet worm” [1] has made the industrialand research communities more concerned about the data integrity, privacy and confidentiality ofthe real-time operation of control centres. In a recent report of the “Industrial Control Systems CyberEmergency Response Team (ICS-CERT)”, it has been mentioned that among the 200 cyber securityincidents that happened across all the critical infrastructure in 2013, the maximum number of attacks(111 in incidents) are observed in the energy sector (53%) [2].
Due to smartisation of the grid, physical energy systems are highly coupled with the Informationand Communication Technology (ICT)-based cyber systems. These introduced new security
Electronics 2020, 9, 693; doi:10.3390/electronics9040693 www.mdpi.com/journal/electronics
Electronics 2020, 9, 693 2 of 17
vulnerabilities and threats that need to be addressed using appropriate advanced techniques. As thecurrent security approaches are developed focusing on the physical grid only, they are either notapplicable or incompatible or simply inadequate to protect today’s power grids [3].
While physical energy system research has a long history, research focusing on cyber-security of asmart energy system is passing its early age. The new class of cyberattacks named “False Data Injection(FDI) Attack” targeting smart energy systems presented in [4] shows that the malicious modification ofthe measurement data may make DC state estimation vulnerable to malicious modification. Generally,the utility control centres are used to calculate the energy system’s states by minimising the errorsbetween the calculated and measurement data. The authors in [4] have proposed heuristic approachesto counter both random attacks and targeted attacks in the DC state estimation. Further enhancementof this work can be found in [5]. While the research works in [4,5] focus on the unidentified attackconstruction, other research works are focused on developing the attack defence model [6,7] to counterthose attacks. Another subclass of the FDI attack is named “Load Redistribution (LR)” attack, which canartificially increase or decrease in demand at load buses by keeping total change of load as zero [8,9].It is important to note that the aforementioned FDI and LR attacks assume that the compromisedmeasurement data are used to introduce an attack into the grid, although attacks can be generated byother means.
A survey on different types of cyberattacks designed for the smart grid is presented in [10,11].Although some research works have been conducted on cyberattacks in Energy Systems [4–7,10],only a few considered Database Manipulation (DM) attacks. In [12], authors have proposed ananomaly based Intrusion Detection System (IDS) using Principle Component Analysis (PCA) to protectthe database that stores the power system model. The IDS is then employed to detect anomalies in thenetwork power flows due to database manipulation. However, the performance of the PCA basedtechnique in [12] is highly dependent on the empirical tuning of the threshold value, which is used foranomaly detection. Another anomaly detection method is proposed in [13] to solve a similar type ofproblem as in [12]. The output power from a pre-trained Artificial Neural Network (ANN) and OPFmodule are compared to detect an intrusion in [13].
In this work, we implement an efficient multilayer perceptron (MLP) based classification approachto detect DB intrusions of a power system. With extensive experimental evaluation, we have observedthat MLP is very good fit to detect the intrusions that exist in a power system database. As there is noactual data of power system database attacks [12], this paper creates its possible scenarios to simulateboth the normal profile and attack profile (labelled data). In order to consider a wide range of possiblescenarios, we consider the attack cases discussed in [12] and in [13] as well as additional potentialattack cases. These attack cases include database parameters alteration, insertion or deletion by variousmeans. Once we obtain the labelled dataset, we train it using MLP type feed-forward ANN. Next,we test the performance of the detection model against both normal data (no attack present) and attackdata (different types of modification in the database). Our test result shows that the classification basedIDS technique can identify the normal instances and attack instances very accurately. We also comparedthe proposed method with the results reported in [12,13]. The comparison shows the proposed methodhas better accuracy compared with the existing state of the art ML based models.
In this work, practical load data is obtained from the repository of the Electric Power ResearchInstitute’s (EPRI) the Smart Grid tool OpenDSS [14]. We simulate the attack scenario using IEEEbenchmark power systems using MatPower [15]. The proposed method has superior accuracyand efficiency over the existing methods for a similar test setup. The detail results, presented inthis manuscript, show promising prospect towards a practical implementation to secure the powersystem database.
2. Background and Related Work
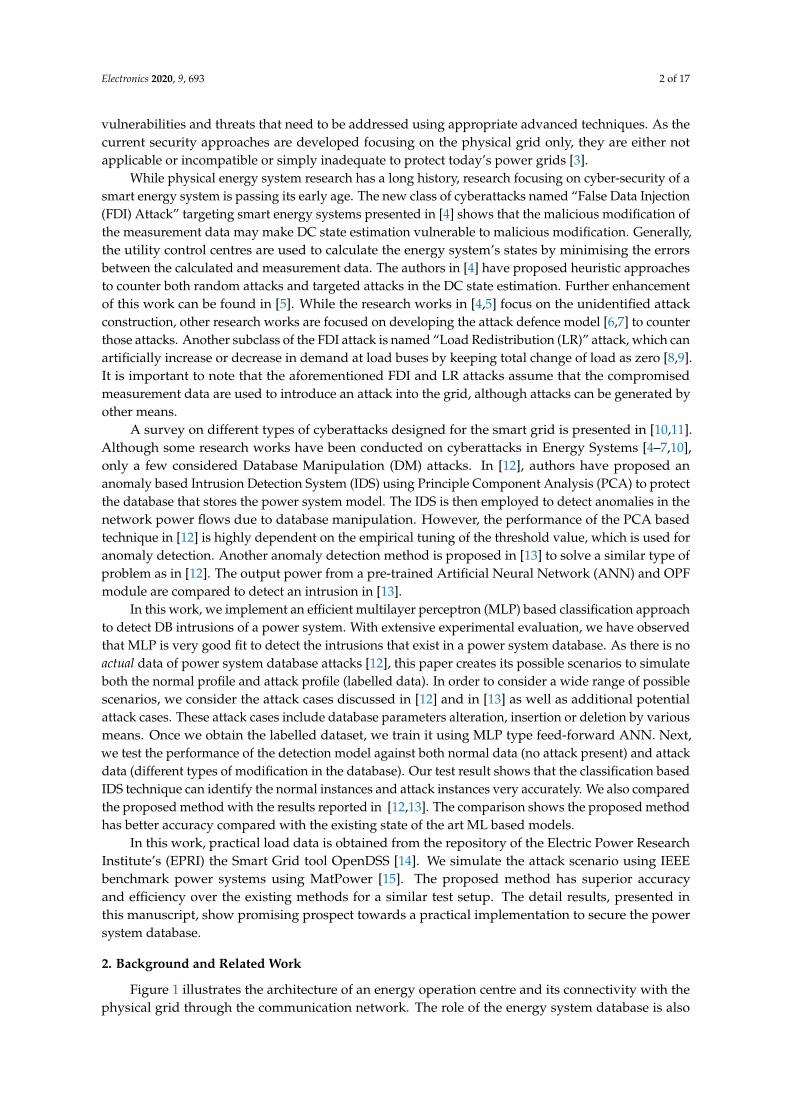
Figure 1 illustrates the architecture of an energy operation centre and its connectivity with thephysical grid through the communication network. The role of the energy system database is also
Electronics 2020, 9, 693 3 of 17
depicted in this figure. The operation of the modern power system heavily relies on field measurementsfor improved monitoring and control. However, field measurements are prone to measurement errorsdue to device accuracy, communication noises and device malfunctions [16]. Therefore, to check themeasurement data integrity, modules like state estimators and bad data detectors are used. Thesemodules not only suppress the measurement noises and identify the corrupted measurements but alsodetermine the system states. Importantly, modules like state estimator and bad data detector workare based on the principle that the underlying energy system topological and parameter informationstored in the energy system database is correct. However, if the ground truth is wrong, it wouldaffect the whole procedure [12,13]. More importantly, a good number of planning decisions is madebased on the power system electric database information. As a result, falsified database informationwould lead to misleading planning decisions. DB manipulation can be performed internally orexternally. According to Jin et al. “Insider attacks are launched by malicious users who are entrustedwith authorised (i.e., insider) access of a system” [17]. Authors in [17] also highlight that theinsider attack comprises around 29% of all cyber crimes and may lead to severe loss or damage.On 23 December 2015, a Ukrainian power grid attack happened where the adversary hacked theenergy SCADA system and remotely controlled the operation centre to deliberately shut down theenergy supply [18]. Similarly, the database can be manipulated by gaining access to the system,and consequently, this would affect the physical operation of the grid. Realising the importance,several research works highlighted detection techniques for energy database anomalies [12,13,19,20].
Figure 1. Functionality of energy database within energy management system database architecture.
Authors in [12] developed an anomaly detection technique for energy system databases to monitorpower flow results detecting the anomalies in the database with changes in the power flow results.Authors in [12] used PCA-based method and tested the performance of their work by consideringattacks like line removal, single line parameter and rating alterations. Some additional types ofattacks are demonstrated in [13] where the line connectivity information, e.g., origin node of anyline, is modified, to demonstrate as an attack case. To detect the changes, authors in [13] appliedANN-based models. Authors in [19] proposed a forecasting and threshold-based approach to detectthe intrusions within the database. Authors in [19] used a vector autoregressive (VAR) model todevelop a multivariate forecasting model and three-sigma rule is applied to detect anomalies. In [20],authors used a graph matching approach where the problem is modelled as a Quadratic AssignmentProblem (QAP) and utilised the Graduated Assignment algorithm to solve the matching problem.All of the above methods demonstrate capabilities by considering a subset of attack types. Moreover,it is important to verify the success rate of these methods against a wide range of possible attackscenarios. Besides, the behaviour of the combined attack scenarios also needs to be addressed.
Electronics 2020, 9, 693 4 of 17
3. Problem Statement
During a topological database attack, the attacker may or may not have prior knowledge of thetopological connectivity or associated configuration information. For example, an insider with theknowledge of the power system DB connectivity, structure of the database and electric parameterinformation [21] may launch an attack . In the case when the attacker is not an insider, the adversarymay gain the access externally and launch structured (has domain knowledge) or unstructured attacks(lack of domain knowledge). One relevant example is the 2015 Ukraine power grid cyber-attack [18]where attackers took the control of the SCADA network and intentionally shut down the switchesof some distribution areas. Whether the attack is structured or unstructured, a significant or notableamount of database manipulation would be clearly identified as it would not provide converged systemoperation or would exhibit significant deviations in operating conditions. As a result, the responsibleoperators or automated processes would be alerted easily and rectify the issue. However, an intelligentattacker may strategically corrupt the information of the database in such a way that the operationalmodules of energy management system (e.g., OPF and State Estimator modules) converge, but theiroutputs violate the normal operating limits, which may cause unintended harmful actions to be initiated bythe operator [12,13]; Due to such attacks, the automated process or the human operator takes operationaldecisions relying on the misleading outputs from corrupted databases. Even any planning decision basedon the corrupted information of DB would lead to a misleading planning solution [20].
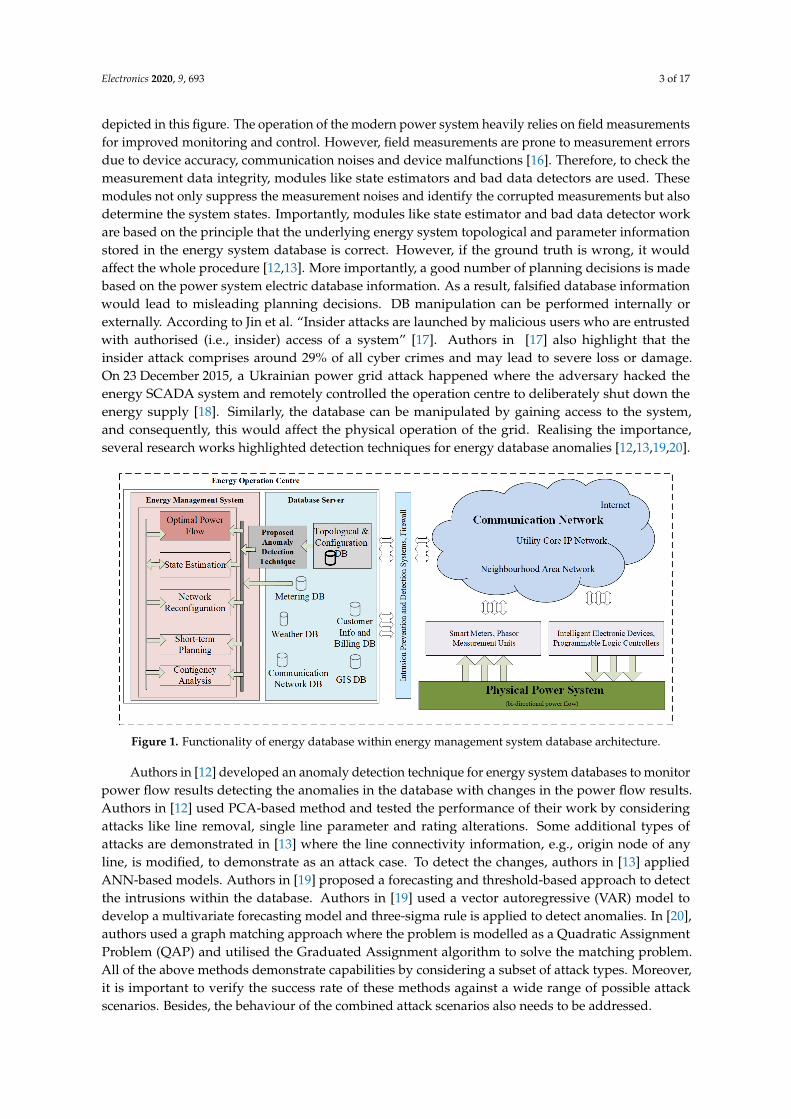
To explain, we consider the example of the three-bus power system [20], shown in Figure 2.The figure represents the topology of a three-bus power system with two generators and one loadcentre. The electric parameter information are represented in the figure. Typically, all topologicalconnectivity information (e.g., which bus is connected with whom, which switch is on and whichswitch is off, etc) and electric parameter information (e.g., line resistance and reactance, generator andload capacities and ratings, line ratings, etc.) are stored in an energy system database. The secondcolumn (from left) of the Table 1 titled “Vmag (before)” shows the voltage profile of each individualnode of the three-bus test system after a converged power-flow solution. Now, assume an insider oran external adversary manipulates the line parameter information between the bus 1 to 2 of the DB.The corrupted line parameter reactance increases from 0.4 pu to 0.8 pu, also highlighted red in theFigure 2. The voltage profile from the converged power-flow output considering the manipulated DBinformation is presented in the third column (from left) of Table 1. A slight mismatch is observed in theresults due to DB information manipulation. As IEEE/ANSI recommended practice for voltage stabilitylimit is 1.05 pu, the system operator may take some remedial actions (say, change in generation/load orreactive power support) to mitigate the problem. However, it was not necessary as the actual physicalsystem is running at 1.05 pu whereas the realisation of from the OPF is 1.052 due to wrong topologicalinformation. Any further actions based on the manipulated DB would misguide the operation andmay affect on the system stability and reliability.I1 I2Node 1 Node 2Node 3z01= -j1 pu z02= -j0.8 puz12= -j0.4 pu (-j0.8 pu)z13= -j0.2 pu z23= -j0.2 puz34= -j0.08 puNode 4
Figure 2. Three bus test system [20].

Electronics 2020, 9, 693 5 of 17
Table 1. Node voltages before and after DB manipulation.
Node Name Vmag (Before) Vmag (After) Comments
Node 1 1.0500 pu 1.052 pu limit exceededNode 2 1.0400 pu 1.039 pu within limitNode 3 1.0450 pu 1.045 pu within limit
Therefore, it is important to monitor the energy system DB for any change. The aim of theproposed work is to detect the anomalies in a power system’s topological and configuration DB byleveraging powerful machine learning tools.
4. Attack Generation
Typically, operational decisions of power systems are conducted based on the measurement dataand the stored data of network assets (for example, conductors, transformers, loads, generators, etc.,and their conductivities). This stored database is the blueprint of the physical power grid. In thiswork, we consider eight types of DB attacks as listed in Table 2. These attack classes include the casesdiscussed in [12,13] as well as some extra possible cases of database manipulation.
Table 2. Attack scenarios.
Attack Case Description of Attacks
Case 1 Modify connectivity of a single lineCase 2 Modify connectivity of multiple linesCase 3 Remove a lineCase 4 Line parameter alteration of a single lineCase 5 Line parameter alteration of multiple linesCase 6 Modify line reactance and ratingsCase 7 Alter the PCC of generator nodeCase 8 Modify origins of multiple lines
Case 9 Combination of Cases 2, 3 and 4.This case includes modification of multiple line parameters and removal of a line
4.1. Attack Scenario 1
The first attack scenario (case 1) deals with the modification of the connectivity of a single powersystem line. That means the source node and the destination node of a power line are changed inthe database. For example, in IEEE 24-bus reliability test system [22], there are 24 nodes and 38 lines.For this type of attacks, source and destination node information related to one single line will bechanged. Say, the original source and destination of line 1 are nodes 1 and 3, respectively. As a resultof such consideration, the source of line 1 can be any node other than 1 and the destination can be anynode other than 3. All information related to IEEE benchmark 24 bus reliability test system can beobtained from [15]. In this attack case, we generate attack by manipulating the source and destinationnodes of any individual line once at a time to consider an attack scenario.
4.2. Attack Scenario 2
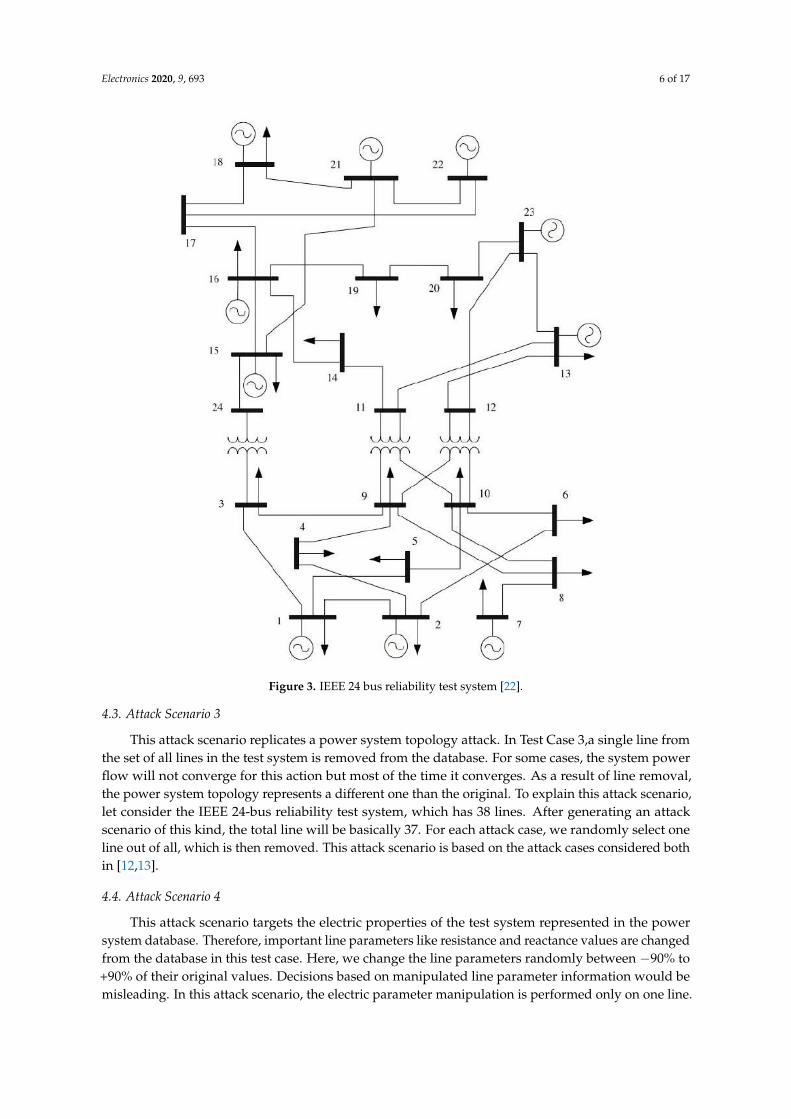
This scenario is extended from attack scenario 1. In this attack scenario, we consider the alterationof connectivity nodes among multiple lines. As IEEE 24 bus reliability test system, shown in Figure 3,has 38 lines, we randomly select the number of targeted lines to be attacked and randomly select lineIDs against those numbers. Next, the source and destination nodes of those lines are modified. If morelines are modified, it may be trivial to detect the presence of the attack as power flow solution may notconverge. Therefore, we have limited the number of manipulated lines to maximum five.
Electronics 2020, 9, 693 6 of 17
Figure 3. IEEE 24 bus reliability test system [22].
4.3. Attack Scenario 3
This attack scenario replicates a power system topology attack. In Test Case 3,a single line fromthe set of all lines in the test system is removed from the database. For some cases, the system powerflow will not converge for this action but most of the time it converges. As a result of line removal,the power system topology represents a different one than the original. To explain this attack scenario,let consider the IEEE 24-bus reliability test system, which has 38 lines. After generating an attackscenario of this kind, the total line will be basically 37. For each attack case, we randomly select oneline out of all, which is then removed. This attack scenario is based on the attack cases considered bothin [12,13].
4.4. Attack Scenario 4
This attack scenario targets the electric properties of the test system represented in the powersystem database. Therefore, important line parameters like resistance and reactance values are changedfrom the database in this test case. Here, we change the line parameters randomly between −90% to+90% of their original values. Decisions based on manipulated line parameter information would bemisleading. In this attack scenario, the electric parameter manipulation is performed only on one line.

Electronics 2020, 9, 693 7 of 17
4.5. Attack Scenario 5
This attack scenario is similar to Attack Scenario 4, except here we consider manipulation ofmultiple line parameters instead of a single line. Here, multiple lines are selected randomly where lineparameters are modified randomly from −90% to +90% of their original values.
4.6. Attack Scenario 6
Beside line reactance, the maximum and minimum power ratings of different lines are altered inCase 6. Note, the maximum and minimum power ratings of different lines are used as constraints inthe optimum power flow solution. Hence, modifying those ratings in the database would lead to anoptimal solution, which is not the true optimal and would produce misleading operational decisions.This attack scenario is also reported in [12].
4.7. Attack Scenario 7
In this attack case, the point of common coupling (PCC) of the generator nodes is altered.That means, power generation source nodes are manipulated in the database. For example, as per IEEE24 bus reliability test system, generator 3 is connected at node 7. In this attack scenario, the PCC node(which is actually node 7) will be replaced by another node. Similar attack scenarios are generated forall generator PCC nodes.
4.8. Attack Scenario 8
This attack case is very similar to Attack Scenario 2 but considers the manipulation of sourcenodes only. This means, sources nodes of multiple lines are manipulated to construct this attack case.
4.9. Attack Scenario 9
This attack case demonstrates a combined attack behaviour. In this experiment, we have combinedthe above discussed attack cases 2, 3 and 4. Therefore, the execution of the attacks would modifymultiple line parameter values and remove a line connectivity information from the database.
In Table 3, a comparison of attack cases is presented. Out of nine different attack scenarios,Valenzuela et al. consider three attack scenarios in [12], which are attack scenarios 3, 4 and 6. On theother hand, Mousavian et al. in [13] consider three attack scenarios, which are 1, 3 and 8 in the abovementioned test cases. From Table 3, it is evident that our proposed model considers all sets of attackspresented in [12,13] as well as a new set of potential attack cases.
Table 3. Comparison of test scenarios in existing and proposed work.
Attack Scenarios PCA Based Method in [12] ANN-Based Method in [13] Proposed Method
Attack Scenario 1 - ! !
Attack Scenario 2 - - !
Attack Scenario 3 ! ! !
Attack Scenario 4 ! - !
Attack Scenario 5 - - !
Attack Scenario 6 ! - !
Attack Scenario 7 - - !
Attack Scenario 8 - ! !
Attack Scenario 9 - - !
5. Attack Detection
Attack detection in power system database requires close to real-time operation. Hence,we provide an efficient detection architecture where intrusions are not detected directly from thedatabase; rather, it uses a detection mechanism that involves database and determines the existence ofintrusions, as discussed elaborately in the following section.
Electronics 2020, 9, 693 8 of 17
The optimal power flow (OPF) module is a vital module that is used in the energy managementsystem of a power system operation centre for decision making purposes. This operational moduleneeds the information of power system conductivity and component parameter information to makeits decisions. Therefore, any change or modification in the database will impact on the output of theOPF module. Here, we consider the output of OPF module (power flow data of different lines of atest system) for data preparation. We consider both normal and attack instances to train the model.The normal profile is created based on the load data obtained from the repository of Electric PowerResearch Institute’s (EPRI) Smart Grid tool OpenDSS [14] and from the Global Energy ForecastingCompetition 2012 [23]. We simulate the attack scenarios on IEEE benchmark power transmissionsystems using MatPower [15] by considering the attack cases discussed in Section 4. We considerhourly load data to generate 33,720 normal instances (for around 4 years of data) and same load profilewith different attack strategies to generate another 33,720 attack instances. All normal and attackinstances are used to train a model using multilayer perceptron (MLP).
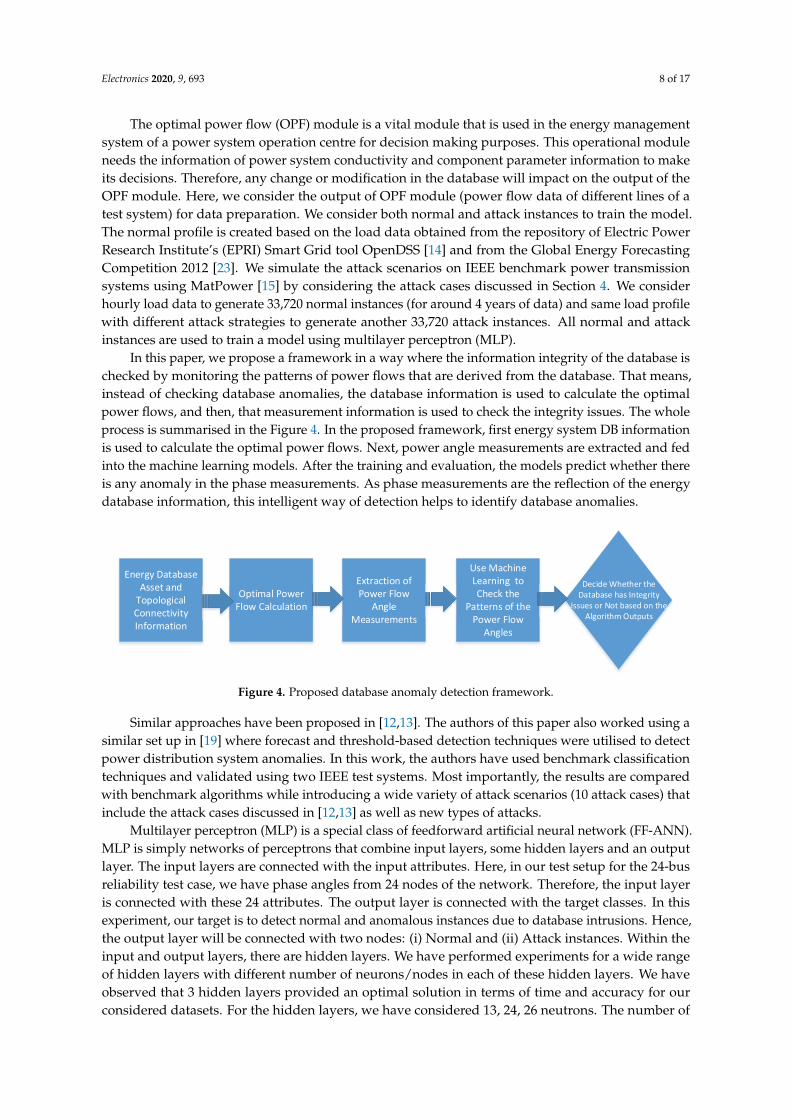
In this paper, we propose a framework in a way where the information integrity of the database ischecked by monitoring the patterns of power flows that are derived from the database. That means,instead of checking database anomalies, the database information is used to calculate the optimalpower flows, and then, that measurement information is used to check the integrity issues. The wholeprocess is summarised in the Figure 4. In the proposed framework, first energy system DB informationis used to calculate the optimal power flows. Next, power angle measurements are extracted and fedinto the machine learning models. After the training and evaluation, the models predict whether thereis any anomaly in the phase measurements. As phase measurements are the reflection of the energydatabase information, this intelligent way of detection helps to identify database anomalies.Energy Database Asset and Topological Connectivity Information Optimal Power Flow Calculation Extraction of Power Flow Angle Measurements Use Machine Learning to Check the Patterns of the Power Flow Angles Decide Whether the Database has Integrity Issues or Not based on the Algorithm OutputsF IsIs
Figure 4. Proposed database anomaly detection framework.
Similar approaches have been proposed in [12,13]. The authors of this paper also worked using asimilar set up in [19] where forecast and threshold-based detection techniques were utilised to detectpower distribution system anomalies. In this work, the authors have used benchmark classificationtechniques and validated using two IEEE test systems. Most importantly, the results are comparedwith benchmark algorithms while introducing a wide variety of attack scenarios (10 attack cases) thatinclude the attack cases discussed in [12,13] as well as new types of attacks.
Multilayer perceptron (MLP) is a special class of feedforward artificial neural network (FF-ANN).MLP is simply networks of perceptrons that combine input layers, some hidden layers and an outputlayer. The input layers are connected with the input attributes. Here, in our test setup for the 24-busreliability test case, we have phase angles from 24 nodes of the network. Therefore, the input layeris connected with these 24 attributes. The output layer is connected with the target classes. In thisexperiment, our target is to detect normal and anomalous instances due to database intrusions. Hence,the output layer will be connected with two nodes: (i) Normal and (ii) Attack instances. Within theinput and output layers, there are hidden layers. We have performed experiments for a wide rangeof hidden layers with different number of neurons/nodes in each of these hidden layers. We haveobserved that 3 hidden layers provided an optimal solution in terms of time and accuracy for ourconsidered datasets. For the hidden layers, we have considered 13, 24, 26 neutrons. The number of
Electronics 2020, 9, 693 9 of 17
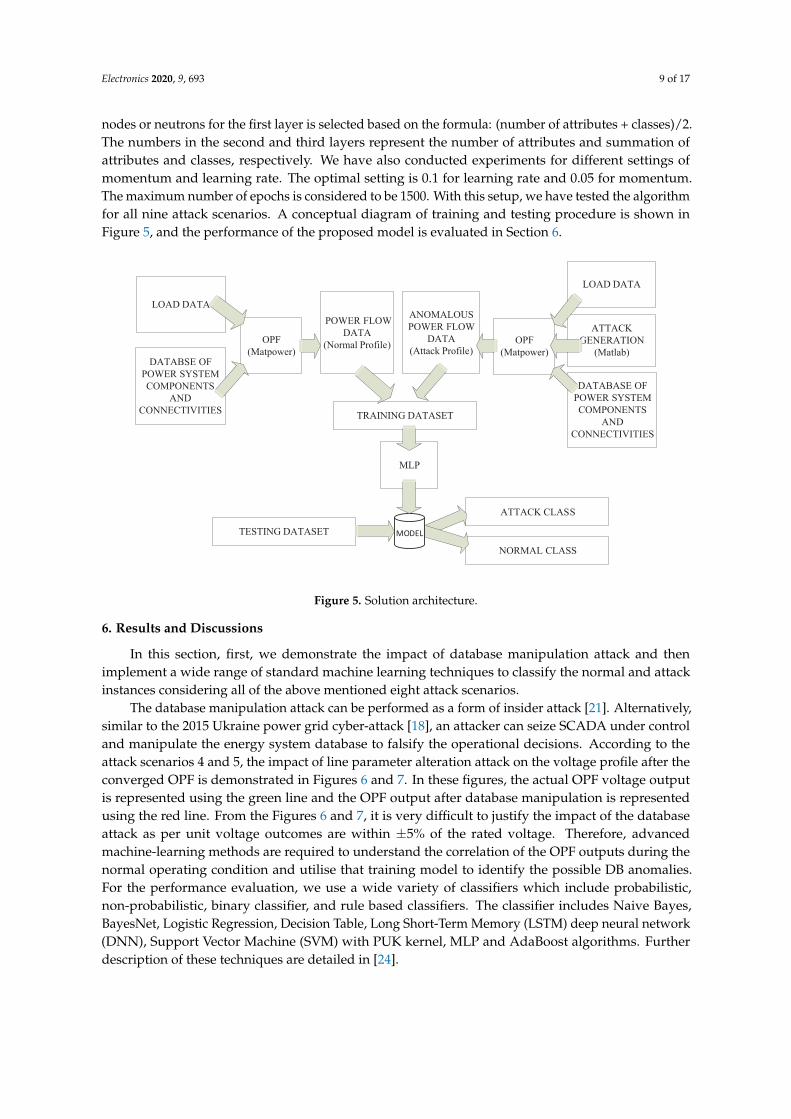
nodes or neutrons for the first layer is selected based on the formula: (number of attributes + classes)/2.The numbers in the second and third layers represent the number of attributes and summation ofattributes and classes, respectively. We have also conducted experiments for different settings ofmomentum and learning rate. The optimal setting is 0.1 for learning rate and 0.05 for momentum.The maximum number of epochs is considered to be 1500. With this setup, we have tested the algorithmfor all nine attack scenarios. A conceptual diagram of training and testing procedure is shown inFigure 5, and the performance of the proposed model is evaluated in Section 6.
LOAD DATA
DATABSE OF POWER SYSTEM COMPONENTS
AND CONNECTIVITIES
OPF(Matpower)
POWER FLOW DATA
(Normal Profile)
LOAD DATA
DATABASE OF POWER SYSTEM COMPONENTS
AND CONNECTIVITIES
OPF(Matpower)
ANOMALOUS POWER FLOW
DATA(Attack Profile)
ATTACK GENERATION
(Matlab)
TRAINING DATASET
MLP
TESTING DATASET
ATTACK CLASS
NORMAL CLASS
MODEL
Figure 5. Solution architecture.
6. Results and Discussions
In this section, first, we demonstrate the impact of database manipulation attack and thenimplement a wide range of standard machine learning techniques to classify the normal and attackinstances considering all of the above mentioned eight attack scenarios.
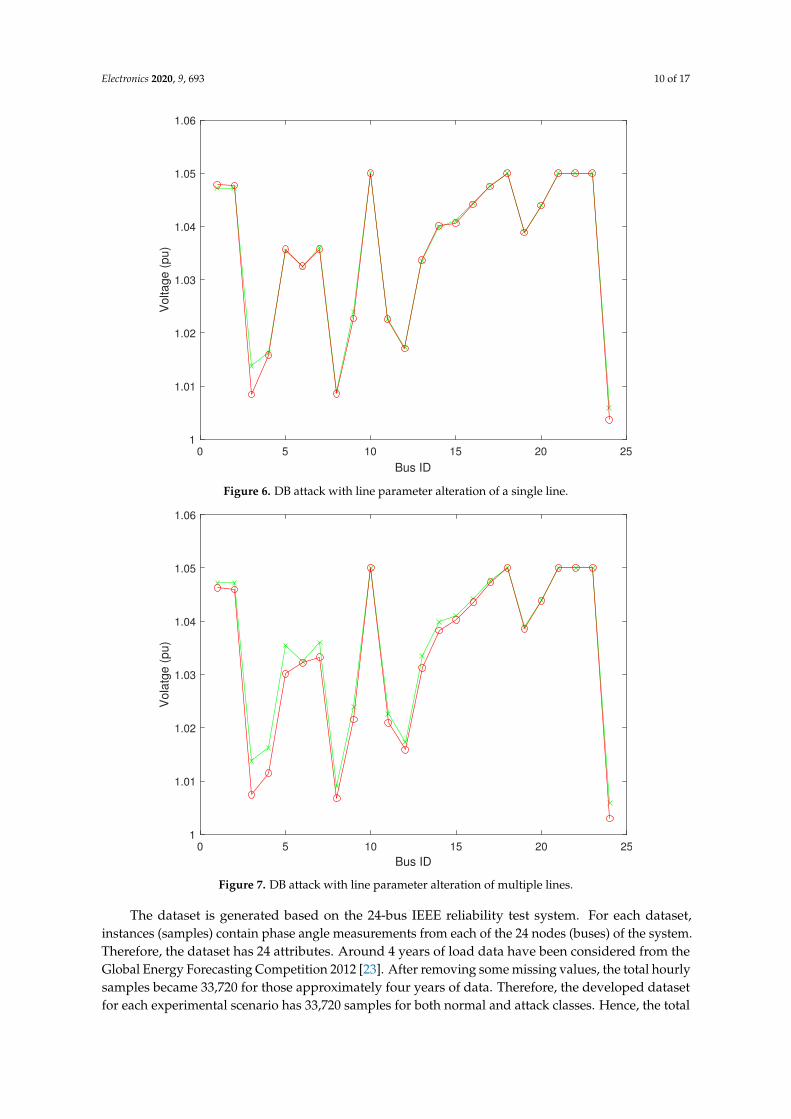
The database manipulation attack can be performed as a form of insider attack [21]. Alternatively,similar to the 2015 Ukraine power grid cyber-attack [18], an attacker can seize SCADA under controland manipulate the energy system database to falsify the operational decisions. According to theattack scenarios 4 and 5, the impact of line parameter alteration attack on the voltage profile after theconverged OPF is demonstrated in Figures 6 and 7. In these figures, the actual OPF voltage outputis represented using the green line and the OPF output after database manipulation is representedusing the red line. From the Figures 6 and 7, it is very difficult to justify the impact of the databaseattack as per unit voltage outcomes are within ±5% of the rated voltage. Therefore, advancedmachine-learning methods are required to understand the correlation of the OPF outputs during thenormal operating condition and utilise that training model to identify the possible DB anomalies.For the performance evaluation, we use a wide variety of classifiers which include probabilistic,non-probabilistic, binary classifier, and rule based classifiers. The classifier includes Naive Bayes,BayesNet, Logistic Regression, Decision Table, Long Short-Term Memory (LSTM) deep neural network(DNN), Support Vector Machine (SVM) with PUK kernel, MLP and AdaBoost algorithms. Furtherdescription of these techniques are detailed in [24].
Electronics 2020, 9, 693 10 of 17
0 5 10 15 20 25
Bus ID
1
1.01
1.02
1.03
1.04
1.05
1.06
Vo
lta
ge
(p
u)
Figure 6. DB attack with line parameter alteration of a single line.
0 5 10 15 20 25
Bus ID
1
1.01
1.02
1.03
1.04
1.05
1.06
Vola
tge (
pu)
Figure 7. DB attack with line parameter alteration of multiple lines.
The dataset is generated based on the 24-bus IEEE reliability test system. For each dataset,instances (samples) contain phase angle measurements from each of the 24 nodes (buses) of the system.Therefore, the dataset has 24 attributes. Around 4 years of load data have been considered from theGlobal Energy Forecasting Competition 2012 [23]. After removing some missing values, the total hourlysamples became 33,720 for those approximately four years of data. Therefore, the developed datasetfor each experimental scenario has 33,720 samples for both normal and attack classes. Hence, the total
Electronics 2020, 9, 693 11 of 17
samples for each experimental scenario is 67,440, which make the dimension of the dataset 67,440 by24. Here, the dataset has equal samples for each class in order to avoid the class imbalance problem.
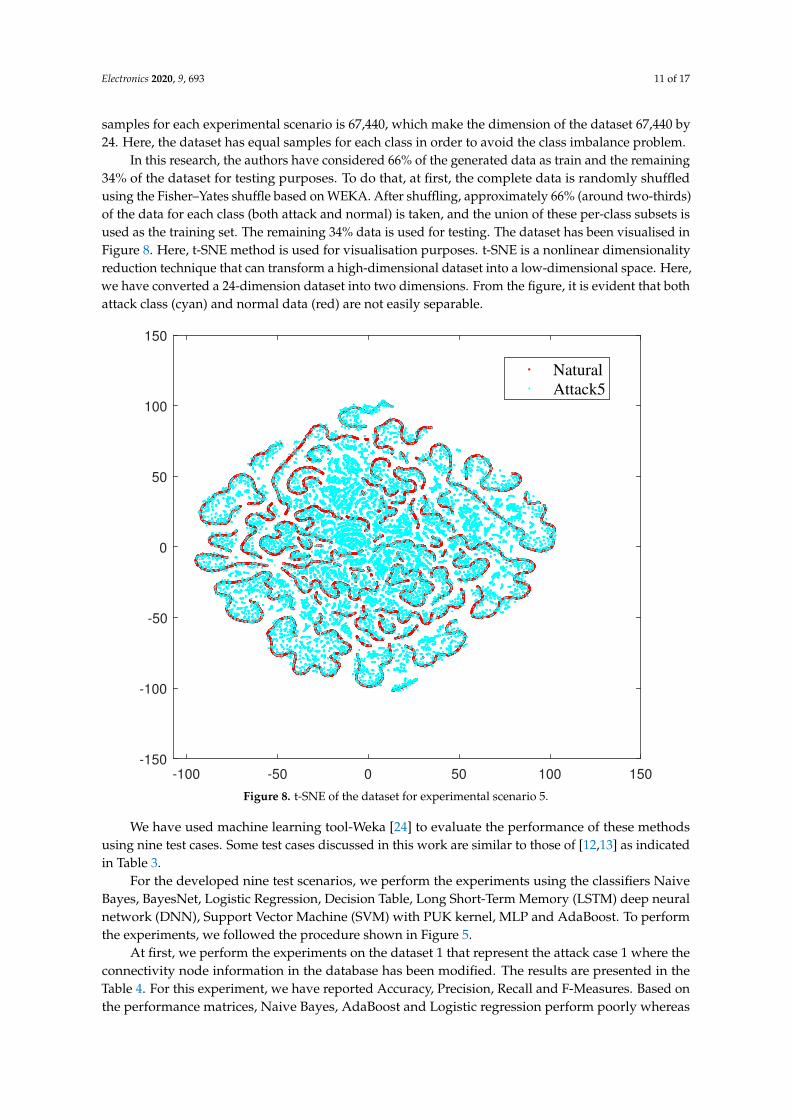
In this research, the authors have considered 66% of the generated data as train and the remaining34% of the dataset for testing purposes. To do that, at first, the complete data is randomly shuffledusing the Fisher–Yates shuffle based on WEKA. After shuffling, approximately 66% (around two-thirds)of the data for each class (both attack and normal) is taken, and the union of these per-class subsets isused as the training set. The remaining 34% data is used for testing. The dataset has been visualised inFigure 8. Here, t-SNE method is used for visualisation purposes. t-SNE is a nonlinear dimensionalityreduction technique that can transform a high-dimensional dataset into a low-dimensional space. Here,we have converted a 24-dimension dataset into two dimensions. From the figure, it is evident that bothattack class (cyan) and normal data (red) are not easily separable.
-100 -50 0 50 100 150
-150
-100
-50
0
50
100
150
Natural
Attack5
Figure 8. t-SNE of the dataset for experimental scenario 5.
We have used machine learning tool-Weka [24] to evaluate the performance of these methodsusing nine test cases. Some test cases discussed in this work are similar to those of [12,13] as indicatedin Table 3.
For the developed nine test scenarios, we perform the experiments using the classifiers NaiveBayes, BayesNet, Logistic Regression, Decision Table, Long Short-Term Memory (LSTM) deep neuralnetwork (DNN), Support Vector Machine (SVM) with PUK kernel, MLP and AdaBoost. To performthe experiments, we followed the procedure shown in Figure 5.
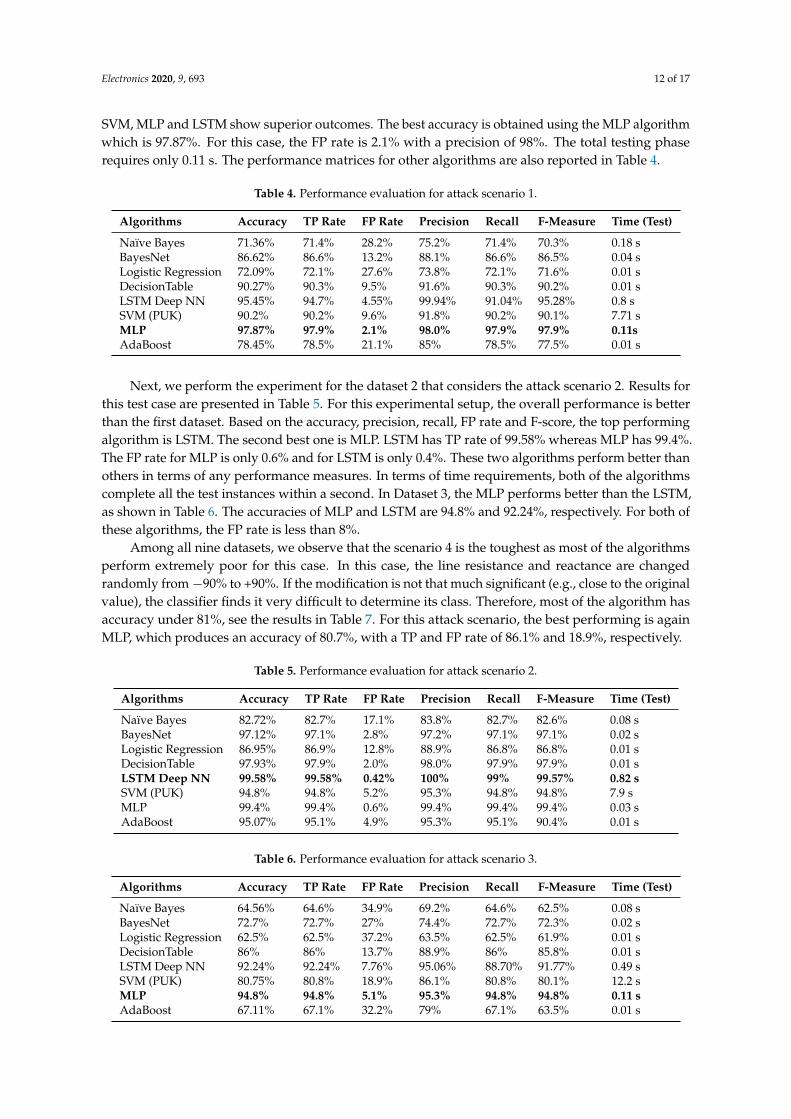
At first, we perform the experiments on the dataset 1 that represent the attack case 1 where theconnectivity node information in the database has been modified. The results are presented in theTable 4. For this experiment, we have reported Accuracy, Precision, Recall and F-Measures. Based onthe performance matrices, Naive Bayes, AdaBoost and Logistic regression perform poorly whereas
Electronics 2020, 9, 693 12 of 17
SVM, MLP and LSTM show superior outcomes. The best accuracy is obtained using the MLP algorithmwhich is 97.87%. For this case, the FP rate is 2.1% with a precision of 98%. The total testing phaserequires only 0.11 s. The performance matrices for other algorithms are also reported in Table 4.
Table 4. Performance evaluation for attack scenario 1.
Algorithms Accuracy TP Rate FP Rate Precision Recall F-Measure Time (Test)
Naïve Bayes 71.36% 71.4% 28.2% 75.2% 71.4% 70.3% 0.18 sBayesNet 86.62% 86.6% 13.2% 88.1% 86.6% 86.5% 0.04 sLogistic Regression 72.09% 72.1% 27.6% 73.8% 72.1% 71.6% 0.01 sDecisionTable 90.27% 90.3% 9.5% 91.6% 90.3% 90.2% 0.01 sLSTM Deep NN 95.45% 94.7% 4.55% 99.94% 91.04% 95.28% 0.8 sSVM (PUK) 90.2% 90.2% 9.6% 91.8% 90.2% 90.1% 7.71 sMLP 97.87% 97.9% 2.1% 98.0% 97.9% 97.9% 0.11sAdaBoost 78.45% 78.5% 21.1% 85% 78.5% 77.5% 0.01 s
Next, we perform the experiment for the dataset 2 that considers the attack scenario 2. Results forthis test case are presented in Table 5. For this experimental setup, the overall performance is betterthan the first dataset. Based on the accuracy, precision, recall, FP rate and F-score, the top performingalgorithm is LSTM. The second best one is MLP. LSTM has TP rate of 99.58% whereas MLP has 99.4%.The FP rate for MLP is only 0.6% and for LSTM is only 0.4%. These two algorithms perform better thanothers in terms of any performance measures. In terms of time requirements, both of the algorithmscomplete all the test instances within a second. In Dataset 3, the MLP performs better than the LSTM,as shown in Table 6. The accuracies of MLP and LSTM are 94.8% and 92.24%, respectively. For both ofthese algorithms, the FP rate is less than 8%.
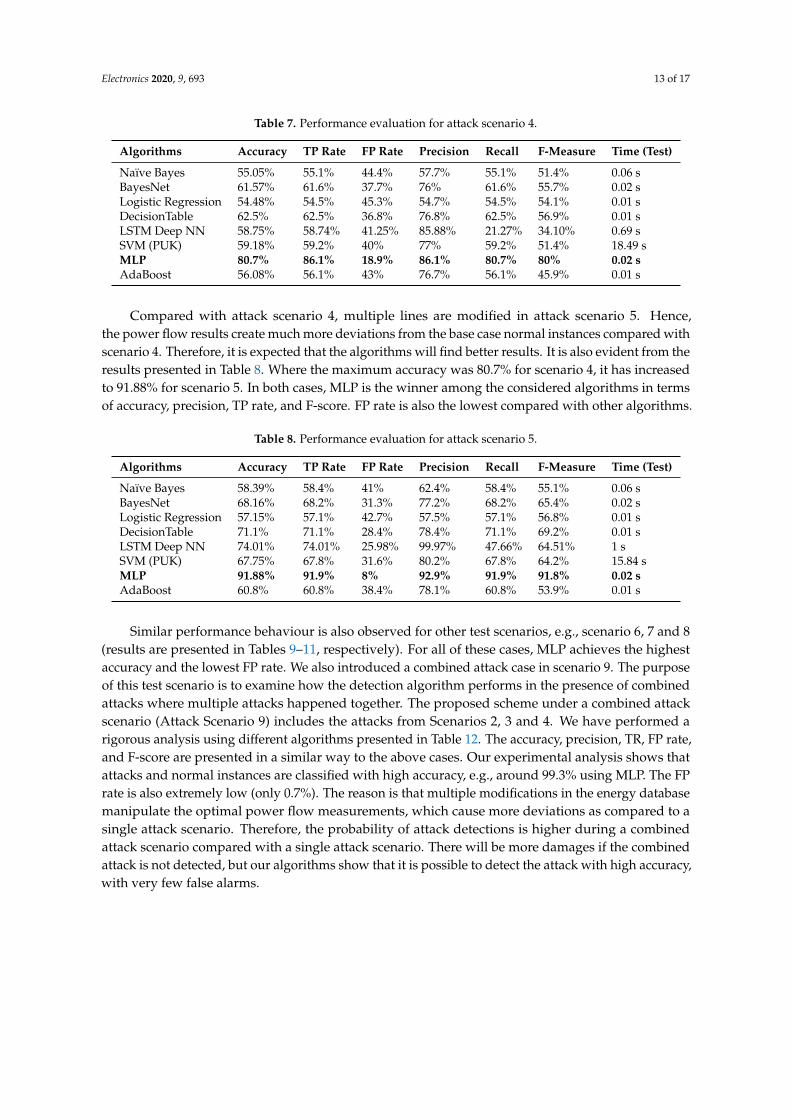
Among all nine datasets, we observe that the scenario 4 is the toughest as most of the algorithmsperform extremely poor for this case. In this case, the line resistance and reactance are changedrandomly from −90% to +90%. If the modification is not that much significant (e.g., close to the originalvalue), the classifier finds it very difficult to determine its class. Therefore, most of the algorithm hasaccuracy under 81%, see the results in Table 7. For this attack scenario, the best performing is againMLP, which produces an accuracy of 80.7%, with a TP and FP rate of 86.1% and 18.9%, respectively.
Table 5. Performance evaluation for attack scenario 2.
Algorithms Accuracy TP Rate FP Rate Precision Recall F-Measure Time (Test)
Naïve Bayes 82.72% 82.7% 17.1% 83.8% 82.7% 82.6% 0.08 sBayesNet 97.12% 97.1% 2.8% 97.2% 97.1% 97.1% 0.02 sLogistic Regression 86.95% 86.9% 12.8% 88.9% 86.8% 86.8% 0.01 sDecisionTable 97.93% 97.9% 2.0% 98.0% 97.9% 97.9% 0.01 sLSTM Deep NN 99.58% 99.58% 0.42% 100% 99% 99.57% 0.82 sSVM (PUK) 94.8% 94.8% 5.2% 95.3% 94.8% 94.8% 7.9 sMLP 99.4% 99.4% 0.6% 99.4% 99.4% 99.4% 0.03 sAdaBoost 95.07% 95.1% 4.9% 95.3% 95.1% 90.4% 0.01 s
Table 6. Performance evaluation for attack scenario 3.
Algorithms Accuracy TP Rate FP Rate Precision Recall F-Measure Time (Test)
Naïve Bayes 64.56% 64.6% 34.9% 69.2% 64.6% 62.5% 0.08 sBayesNet 72.7% 72.7% 27% 74.4% 72.7% 72.3% 0.02 sLogistic Regression 62.5% 62.5% 37.2% 63.5% 62.5% 61.9% 0.01 sDecisionTable 86% 86% 13.7% 88.9% 86% 85.8% 0.01 sLSTM Deep NN 92.24% 92.24% 7.76% 95.06% 88.70% 91.77% 0.49 sSVM (PUK) 80.75% 80.8% 18.9% 86.1% 80.8% 80.1% 12.2 sMLP 94.8% 94.8% 5.1% 95.3% 94.8% 94.8% 0.11 sAdaBoost 67.11% 67.1% 32.2% 79% 67.1% 63.5% 0.01 s
Electronics 2020, 9, 693 13 of 17
Table 7. Performance evaluation for attack scenario 4.
Algorithms Accuracy TP Rate FP Rate Precision Recall F-Measure Time (Test)
Naïve Bayes 55.05% 55.1% 44.4% 57.7% 55.1% 51.4% 0.06 sBayesNet 61.57% 61.6% 37.7% 76% 61.6% 55.7% 0.02 sLogistic Regression 54.48% 54.5% 45.3% 54.7% 54.5% 54.1% 0.01 sDecisionTable 62.5% 62.5% 36.8% 76.8% 62.5% 56.9% 0.01 sLSTM Deep NN 58.75% 58.74% 41.25% 85.88% 21.27% 34.10% 0.69 sSVM (PUK) 59.18% 59.2% 40% 77% 59.2% 51.4% 18.49 sMLP 80.7% 86.1% 18.9% 86.1% 80.7% 80% 0.02 sAdaBoost 56.08% 56.1% 43% 76.7% 56.1% 45.9% 0.01 s
Compared with attack scenario 4, multiple lines are modified in attack scenario 5. Hence,the power flow results create much more deviations from the base case normal instances compared withscenario 4. Therefore, it is expected that the algorithms will find better results. It is also evident from theresults presented in Table 8. Where the maximum accuracy was 80.7% for scenario 4, it has increasedto 91.88% for scenario 5. In both cases, MLP is the winner among the considered algorithms in termsof accuracy, precision, TP rate, and F-score. FP rate is also the lowest compared with other algorithms.
Table 8. Performance evaluation for attack scenario 5.
Algorithms Accuracy TP Rate FP Rate Precision Recall F-Measure Time (Test)
Naïve Bayes 58.39% 58.4% 41% 62.4% 58.4% 55.1% 0.06 sBayesNet 68.16% 68.2% 31.3% 77.2% 68.2% 65.4% 0.02 sLogistic Regression 57.15% 57.1% 42.7% 57.5% 57.1% 56.8% 0.01 sDecisionTable 71.1% 71.1% 28.4% 78.4% 71.1% 69.2% 0.01 sLSTM Deep NN 74.01% 74.01% 25.98% 99.97% 47.66% 64.51% 1 sSVM (PUK) 67.75% 67.8% 31.6% 80.2% 67.8% 64.2% 15.84 sMLP 91.88% 91.9% 8% 92.9% 91.9% 91.8% 0.02 sAdaBoost 60.8% 60.8% 38.4% 78.1% 60.8% 53.9% 0.01 s
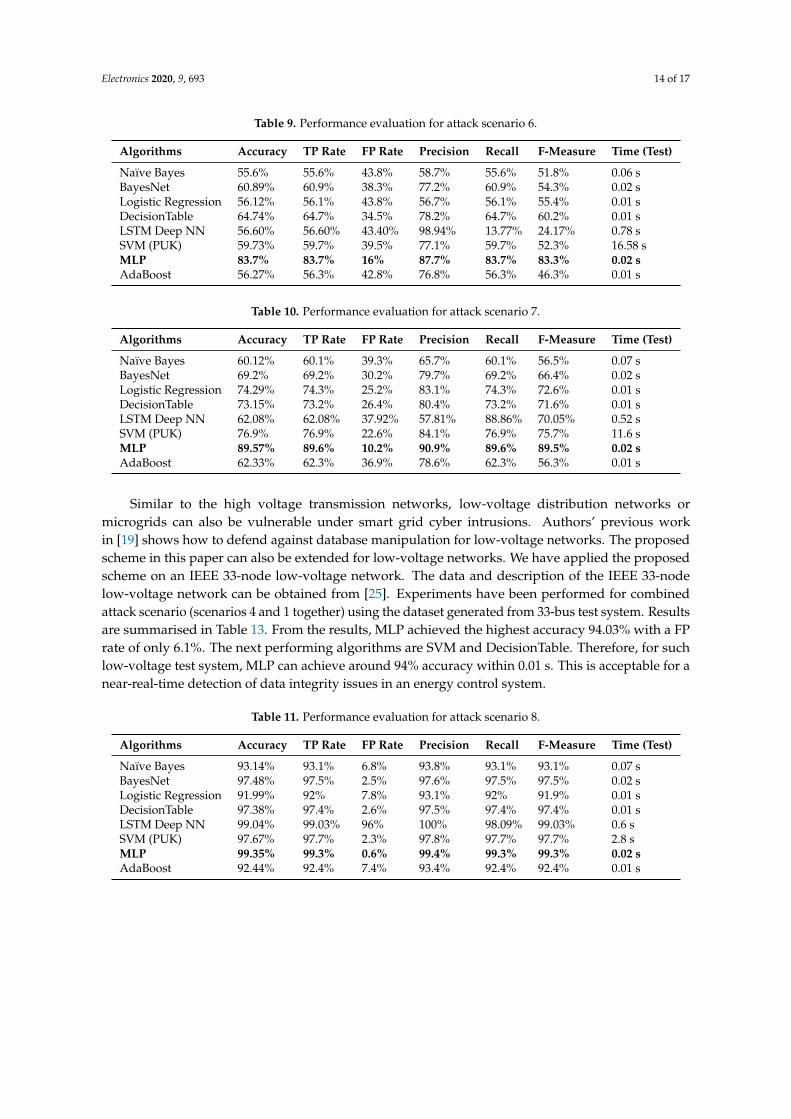
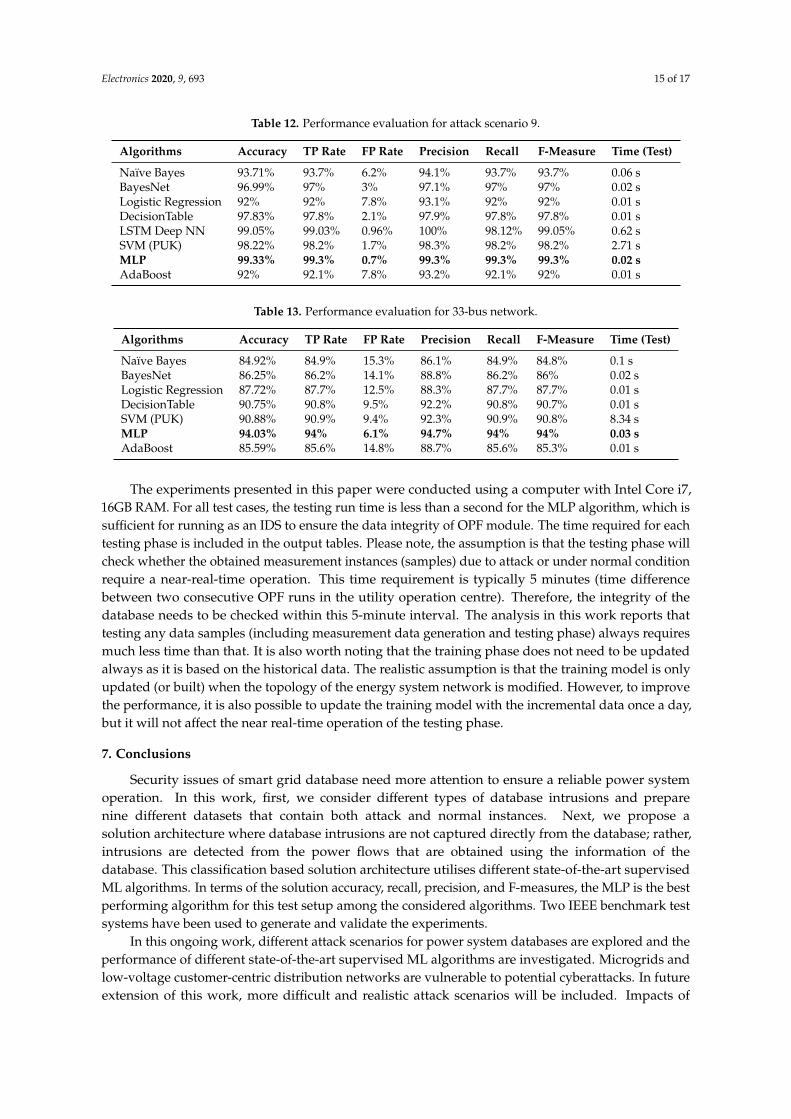
Similar performance behaviour is also observed for other test scenarios, e.g., scenario 6, 7 and 8(results are presented in Tables 9–11, respectively). For all of these cases, MLP achieves the highestaccuracy and the lowest FP rate. We also introduced a combined attack case in scenario 9. The purposeof this test scenario is to examine how the detection algorithm performs in the presence of combinedattacks where multiple attacks happened together. The proposed scheme under a combined attackscenario (Attack Scenario 9) includes the attacks from Scenarios 2, 3 and 4. We have performed arigorous analysis using different algorithms presented in Table 12. The accuracy, precision, TR, FP rate,and F-score are presented in a similar way to the above cases. Our experimental analysis shows thatattacks and normal instances are classified with high accuracy, e.g., around 99.3% using MLP. The FPrate is also extremely low (only 0.7%). The reason is that multiple modifications in the energy databasemanipulate the optimal power flow measurements, which cause more deviations as compared to asingle attack scenario. Therefore, the probability of attack detections is higher during a combinedattack scenario compared with a single attack scenario. There will be more damages if the combinedattack is not detected, but our algorithms show that it is possible to detect the attack with high accuracy,with very few false alarms.
Electronics 2020, 9, 693 14 of 17
Table 9. Performance evaluation for attack scenario 6.
Algorithms Accuracy TP Rate FP Rate Precision Recall F-Measure Time (Test)
Naïve Bayes 55.6% 55.6% 43.8% 58.7% 55.6% 51.8% 0.06 sBayesNet 60.89% 60.9% 38.3% 77.2% 60.9% 54.3% 0.02 sLogistic Regression 56.12% 56.1% 43.8% 56.7% 56.1% 55.4% 0.01 sDecisionTable 64.74% 64.7% 34.5% 78.2% 64.7% 60.2% 0.01 sLSTM Deep NN 56.60% 56.60% 43.40% 98.94% 13.77% 24.17% 0.78 sSVM (PUK) 59.73% 59.7% 39.5% 77.1% 59.7% 52.3% 16.58 sMLP 83.7% 83.7% 16% 87.7% 83.7% 83.3% 0.02 sAdaBoost 56.27% 56.3% 42.8% 76.8% 56.3% 46.3% 0.01 s
Table 10. Performance evaluation for attack scenario 7.
Algorithms Accuracy TP Rate FP Rate Precision Recall F-Measure Time (Test)
Naïve Bayes 60.12% 60.1% 39.3% 65.7% 60.1% 56.5% 0.07 sBayesNet 69.2% 69.2% 30.2% 79.7% 69.2% 66.4% 0.02 sLogistic Regression 74.29% 74.3% 25.2% 83.1% 74.3% 72.6% 0.01 sDecisionTable 73.15% 73.2% 26.4% 80.4% 73.2% 71.6% 0.01 sLSTM Deep NN 62.08% 62.08% 37.92% 57.81% 88.86% 70.05% 0.52 sSVM (PUK) 76.9% 76.9% 22.6% 84.1% 76.9% 75.7% 11.6 sMLP 89.57% 89.6% 10.2% 90.9% 89.6% 89.5% 0.02 sAdaBoost 62.33% 62.3% 36.9% 78.6% 62.3% 56.3% 0.01 s
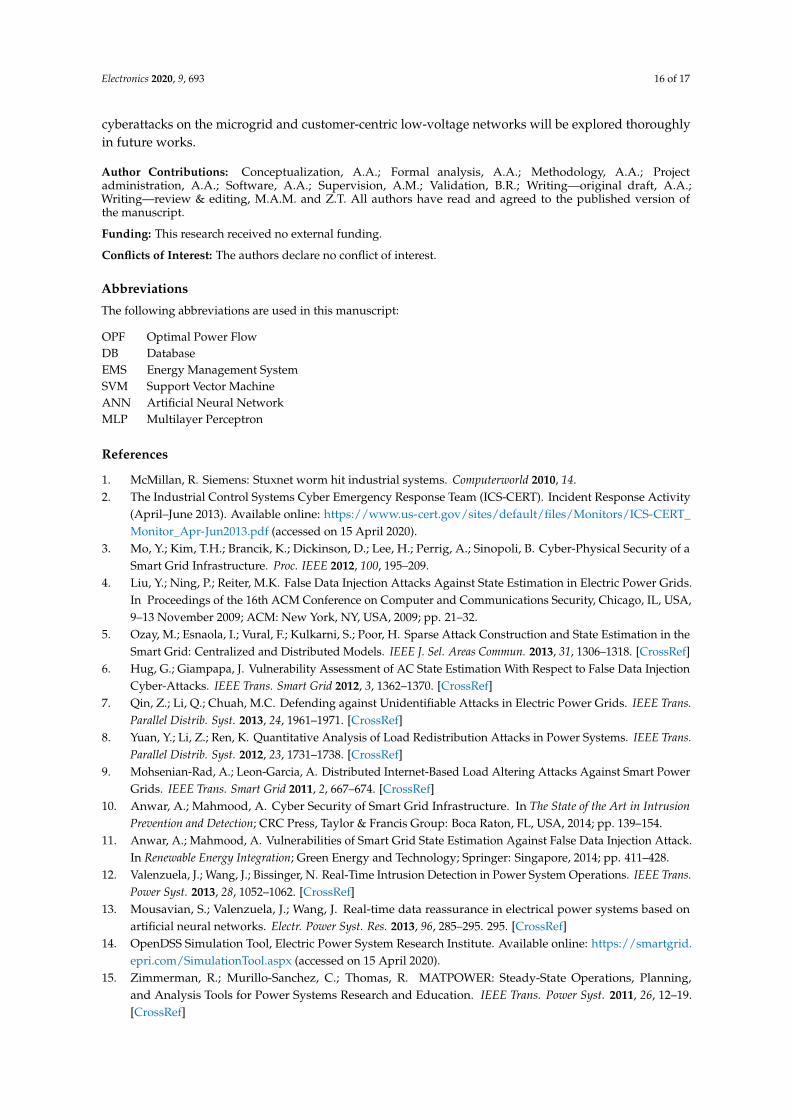
Similar to the high voltage transmission networks, low-voltage distribution networks ormicrogrids can also be vulnerable under smart grid cyber intrusions. Authors’ previous workin [19] shows how to defend against database manipulation for low-voltage networks. The proposedscheme in this paper can also be extended for low-voltage networks. We have applied the proposedscheme on an IEEE 33-node low-voltage network. The data and description of the IEEE 33-nodelow-voltage network can be obtained from [25]. Experiments have been performed for combinedattack scenario (scenarios 4 and 1 together) using the dataset generated from 33-bus test system. Resultsare summarised in Table 13. From the results, MLP achieved the highest accuracy 94.03% with a FPrate of only 6.1%. The next performing algorithms are SVM and DecisionTable. Therefore, for suchlow-voltage test system, MLP can achieve around 94% accuracy within 0.01 s. This is acceptable for anear-real-time detection of data integrity issues in an energy control system.
Table 11. Performance evaluation for attack scenario 8.
Algorithms Accuracy TP Rate FP Rate Precision Recall F-Measure Time (Test)
Naïve Bayes 93.14% 93.1% 6.8% 93.8% 93.1% 93.1% 0.07 sBayesNet 97.48% 97.5% 2.5% 97.6% 97.5% 97.5% 0.02 sLogistic Regression 91.99% 92% 7.8% 93.1% 92% 91.9% 0.01 sDecisionTable 97.38% 97.4% 2.6% 97.5% 97.4% 97.4% 0.01 sLSTM Deep NN 99.04% 99.03% 96% 100% 98.09% 99.03% 0.6 sSVM (PUK) 97.67% 97.7% 2.3% 97.8% 97.7% 97.7% 2.8 sMLP 99.35% 99.3% 0.6% 99.4% 99.3% 99.3% 0.02 sAdaBoost 92.44% 92.4% 7.4% 93.4% 92.4% 92.4% 0.01 s
Electronics 2020, 9, 693 15 of 17
Table 12. Performance evaluation for attack scenario 9.
Algorithms Accuracy TP Rate FP Rate Precision Recall F-Measure Time (Test)
Naïve Bayes 93.71% 93.7% 6.2% 94.1% 93.7% 93.7% 0.06 sBayesNet 96.99% 97% 3% 97.1% 97% 97% 0.02 sLogistic Regression 92% 92% 7.8% 93.1% 92% 92% 0.01 sDecisionTable 97.83% 97.8% 2.1% 97.9% 97.8% 97.8% 0.01 sLSTM Deep NN 99.05% 99.03% 0.96% 100% 98.12% 99.05% 0.62 sSVM (PUK) 98.22% 98.2% 1.7% 98.3% 98.2% 98.2% 2.71 sMLP 99.33% 99.3% 0.7% 99.3% 99.3% 99.3% 0.02 sAdaBoost 92% 92.1% 7.8% 93.2% 92.1% 92% 0.01 s
Table 13. Performance evaluation for 33-bus network.
Algorithms Accuracy TP Rate FP Rate Precision Recall F-Measure Time (Test)
Naïve Bayes 84.92% 84.9% 15.3% 86.1% 84.9% 84.8% 0.1 sBayesNet 86.25% 86.2% 14.1% 88.8% 86.2% 86% 0.02 sLogistic Regression 87.72% 87.7% 12.5% 88.3% 87.7% 87.7% 0.01 sDecisionTable 90.75% 90.8% 9.5% 92.2% 90.8% 90.7% 0.01 sSVM (PUK) 90.88% 90.9% 9.4% 92.3% 90.9% 90.8% 8.34 sMLP 94.03% 94% 6.1% 94.7% 94% 94% 0.03 sAdaBoost 85.59% 85.6% 14.8% 88.7% 85.6% 85.3% 0.01 s
The experiments presented in this paper were conducted using a computer with Intel Core i7,16GB RAM. For all test cases, the testing run time is less than a second for the MLP algorithm, which issufficient for running as an IDS to ensure the data integrity of OPF module. The time required for eachtesting phase is included in the output tables. Please note, the assumption is that the testing phase willcheck whether the obtained measurement instances (samples) due to attack or under normal conditionrequire a near-real-time operation. This time requirement is typically 5 minutes (time differencebetween two consecutive OPF runs in the utility operation centre). Therefore, the integrity of thedatabase needs to be checked within this 5-minute interval. The analysis in this work reports thattesting any data samples (including measurement data generation and testing phase) always requiresmuch less time than that. It is also worth noting that the training phase does not need to be updatedalways as it is based on the historical data. The realistic assumption is that the training model is onlyupdated (or built) when the topology of the energy system network is modified. However, to improvethe performance, it is also possible to update the training model with the incremental data once a day,but it will not affect the near real-time operation of the testing phase.
7. Conclusions
Security issues of smart grid database need more attention to ensure a reliable power systemoperation. In this work, first, we consider different types of database intrusions and preparenine different datasets that contain both attack and normal instances. Next, we propose asolution architecture where database intrusions are not captured directly from the database; rather,intrusions are detected from the power flows that are obtained using the information of thedatabase. This classification based solution architecture utilises different state-of-the-art supervisedML algorithms. In terms of the solution accuracy, recall, precision, and F-measures, the MLP is the bestperforming algorithm for this test setup among the considered algorithms. Two IEEE benchmark testsystems have been used to generate and validate the experiments.
In this ongoing work, different attack scenarios for power system databases are explored and theperformance of different state-of-the-art supervised ML algorithms are investigated. Microgrids andlow-voltage customer-centric distribution networks are vulnerable to potential cyberattacks. In futureextension of this work, more difficult and realistic attack scenarios will be included. Impacts of
Electronics 2020, 9, 693 16 of 17
cyberattacks on the microgrid and customer-centric low-voltage networks will be explored thoroughlyin future works.
Author Contributions: Conceptualization, A.A.; Formal analysis, A.A.; Methodology, A.A.; Projectadministration, A.A.; Software, A.A.; Supervision, A.M.; Validation, B.R.; Writing—original draft, A.A.;Writing—review & editing, M.A.M. and Z.T. All authors have read and agreed to the published version ofthe manuscript.
Funding: This research received no external funding.
Conflicts of Interest: The authors declare no conflict of interest.
Abbreviations
The following abbreviations are used in this manuscript:
OPF Optimal Power FlowDB DatabaseEMS Energy Management SystemSVM Support Vector MachineANN Artificial Neural NetworkMLP Multilayer Perceptron
References
1. McMillan, R. Siemens: Stuxnet worm hit industrial systems. Computerworld 2010, 14.2. The Industrial Control Systems Cyber Emergency Response Team (ICS-CERT). Incident Response Activity
(April–June 2013). Available online: https://www.us-cert.gov/sites/default/files/Monitors/ICS-CERT_Monitor_Apr-Jun2013.pdf (accessed on 15 April 2020).
3. Mo, Y.; Kim, T.H.; Brancik, K.; Dickinson, D.; Lee, H.; Perrig, A.; Sinopoli, B. Cyber-Physical Security of aSmart Grid Infrastructure. Proc. IEEE 2012, 100, 195–209.
4. Liu, Y.; Ning, P.; Reiter, M.K. False Data Injection Attacks Against State Estimation in Electric Power Grids.In Proceedings of the 16th ACM Conference on Computer and Communications Security, Chicago, IL, USA,9–13 November 2009; ACM: New York, NY, USA, 2009; pp. 21–32.
5. Ozay, M.; Esnaola, I.; Vural, F.; Kulkarni, S.; Poor, H. Sparse Attack Construction and State Estimation in theSmart Grid: Centralized and Distributed Models. IEEE J. Sel. Areas Commun. 2013, 31, 1306–1318. [CrossRef]
6. Hug, G.; Giampapa, J. Vulnerability Assessment of AC State Estimation With Respect to False Data InjectionCyber-Attacks. IEEE Trans. Smart Grid 2012, 3, 1362–1370. [CrossRef]
7. Qin, Z.; Li, Q.; Chuah, M.C. Defending against Unidentifiable Attacks in Electric Power Grids. IEEE Trans.Parallel Distrib. Syst. 2013, 24, 1961–1971. [CrossRef]
8. Yuan, Y.; Li, Z.; Ren, K. Quantitative Analysis of Load Redistribution Attacks in Power Systems. IEEE Trans.Parallel Distrib. Syst. 2012, 23, 1731–1738. [CrossRef]
9. Mohsenian-Rad, A.; Leon-Garcia, A. Distributed Internet-Based Load Altering Attacks Against Smart PowerGrids. IEEE Trans. Smart Grid 2011, 2, 667–674. [CrossRef]
10. Anwar, A.; Mahmood, A. Cyber Security of Smart Grid Infrastructure. In The State of the Art in IntrusionPrevention and Detection; CRC Press, Taylor & Francis Group: Boca Raton, FL, USA, 2014; pp. 139–154.
11. Anwar, A.; Mahmood, A. Vulnerabilities of Smart Grid State Estimation Against False Data Injection Attack.In Renewable Energy Integration; Green Energy and Technology; Springer: Singapore, 2014; pp. 411–428.
12. Valenzuela, J.; Wang, J.; Bissinger, N. Real-Time Intrusion Detection in Power System Operations. IEEE Trans.Power Syst. 2013, 28, 1052–1062. [CrossRef]
13. Mousavian, S.; Valenzuela, J.; Wang, J. Real-time data reassurance in electrical power systems based onartificial neural networks. Electr. Power Syst. Res. 2013, 96, 285–295. 295. [CrossRef]
14. OpenDSS Simulation Tool, Electric Power System Research Institute. Available online: https://smartgrid.epri.com/SimulationTool.aspx (accessed on 15 April 2020).
15. Zimmerman, R.; Murillo-Sanchez, C.; Thomas, R. MATPOWER: Steady-State Operations, Planning,and Analysis Tools for Power Systems Research and Education. IEEE Trans. Power Syst. 2011, 26, 12–19.[CrossRef]
Electronics 2020, 9, 693 17 of 17
16. Anwar, A.; Mahmood, A.N.; Pickering, M. Modeling and performance evaluation of stealthy false data injectionattacks on smart grid in the presence of corrupted measurements. J. Comput. Syst. Sci. 2017, 83, 58–72. [CrossRef]
17. Jin, X.; Dan, M.; Zhang, N.; Yu, W.; Fu, X.; Das, S.K. Chapter 2 - Game Theory for Infrastructure Security:The Power of Intent-Based Adversary Models. In Handbook on Securing Cyber-Physical Critical Infrastructure;Morgan Kaufmann: Boston, MA, USA, 2012; pp. 31–53, [CrossRef]
18. Lee, R.M.; Assante, M.J.; Conway, T. Analysis of the Cyber Attack on the Ukrainian Power Grid; Technical Report;The Electricity Information Sharing and Analysis Center: Washington, DC, USA, 2016.
19. Anwar, A.; Mahmood, A.N.; Tari, Z. Ensuring Data Integrity of OPF Module and Energy Database byDetecting Changes in Power Flow Patterns in Smart Grids. IEEE Trans. Ind. Inform. 2017, 13, 3299–3311.[CrossRef]
20. Anwar, A.; Mahmood, A.N. Anomaly detection in electric network database of smart grid: Graph matchingapproach. Electr. Power Syst. Res. 2016, 133, 51–62. [CrossRef]
21. Suh.; Cho. An Enhanced Trust Mechanism with Consensus-Based False Information Filtering Algorithmagainst Bad-Mouthing Attacks and False-Praise Attacks in WSNs. Electronics 2019, 8, 1359. [CrossRef]
22. Wong, P.; Albrecht, P.; Allan, R.; Billinton, R.; Chen, Q.; Fong, C.; Haddad, S.; Li, W.; Mukerji, R.;Patton, D.; et al. The IEEE Reliability Test System-1996. A report prepared by the Reliability Test System TaskForce of the Application of Probability Methods Subcommittee. IEEE Trans. Power Syst. 1999, 14, 1010–1020.
23. Kaggle. Global Energy Competition; Kaggle: San Francisco, CA, USA, 2012.24. Hall, M.; Frank, E.; Holmes, G.; Pfahringer, B.; Reutemann, P.; Witten, I.H. The WEKA Data Mining Software:
An Update. SIGKDD Explor. Newsl. 2009, 11, 10–18. [CrossRef]25. Baran, M.E.; Wu, F.F. Network reconfiguration in distribution systems for loss reduction and load balancing.
IEEE Trans. Power Deliv. 1989, 4, 1401–1407. [CrossRef]
c© 2020 by the authors. Licensee MDPI, Basel, Switzerland. This article is an open accessarticle distributed under the terms and conditions of the Creative Commons Attribution(CC BY) license (http://creativecommons.org/licenses/by/4.0/).