M V M M · autora preko koje se obavlja sva potrebna korespondencija; 2) naslov rada; 3) kratak...
55
Transcript of M V M M · autora preko koje se obavlja sva potrebna korespondencija; 2) naslov rada; 3) kratak...

M V M Mobility Vehicle Mechanics
Editors: Prof. dr Jovanka Lukić; Prof. dr Čedomir Duboka
MVM Editorial Board University of Kragujevac Faculty of Engineering
Sestre Janjić 6, 34000 Kragujevac, Serbia Tel.: +381/34/335990; Fax: + 381/34/333192
Prof. Dr Belingardi Giovanni Politecnico di Torino, Torino, ITALY Dr Ing. Ćućuz Stojan Visteon corporation, Novi Jicin, CZECH REPUBLIC Prof. Dr Demić Miroslav University of Kragujevac Faculty of Engineering Kragujevac, SERBIA Prof. Dr Fiala Ernest Wien, OESTERREICH Prof. Dr Gillespie D. Thomas University of Michigan, Ann Arbor, Michigan, USA Prof. Dr Grujović Aleksandar University of Kragujevac Faculty of Engineering Kragujevac, SERBIA Prof. Dr Knapezyk Josef Politechniki Krakowskiej, Krakow, POLAND
Prof. Dr Krstić Božidar University of Kragujevac Faculty of Engineering Kragujevac, SERBIA Prof. Dr Mariotti G. Virzi Universita degli Studidi Palermo, Dipartimento di Meccanica ed Aeronautica, Palermo, ITALY Prof. Dr Pešić Radivoje University of Kragujevac Faculty of Engineering Kragujevac, SERBIA Prof. Dr Petrović Stojan Faculty of Mech. Eng. Belgrade, SERBIA Prof. Dr Radonjić Dragoljub University of Kragujevac Faculty of Engineering Kragujevac, SERBIA
Prof. Dr Radonjić Rajko University of Kragujevac Faculty of Engineering Kragujevac, SERBIA Prof. Dr Spentzas Constatinos N. National Technical University, GREECE Prof. Dr Todorović Jovan Faculty of Mech. Eng. Belgrade, SERBIA Prof. Dr Toliskyj Vladimir E. Academician NAMI, Moscow, RUSSIA Prof. Dr Teodorović Dušan Faculty of Traffic and Transport Engineering, Belgrade, SERBIA Prof. Dr Veinović Stevan University of Kragujevac Faculty of Engineering Kragujevac, SERBIA
For Publisher: Prof. dr Miroslav Babić, dean, University of Kragujevac, Faculty of Engineering
Publishing of this Journal is financially supported from:
Ministry of Education, Science and Technological Development, Republic Serbia

MVM – International Journal for Vehicle Mechanics, Engines and Transportation Systems NOTIFICATION TO AUTHORS
The Journal MVM publishes original papers which have not been previously published in other journals. This is responsibility of the author. The authors agree that the copyright for their article is transferred to the publisher when the article is accepted for publication.
The language of the Journal is English.
Journal Mobility & Vehicles Mechanics is at the SSCI list.
All submitted manuscripts will be reviewed. Entire correspondence will be performed with the first-named author.
Authors will be notified of acceptance of their manuscripts, if their manuscripts are adopted.
INSTRUCTIONS TO AUTHORS AS REGARDS THE TECHNICAL ARRANGEMENTS OF MANUSCRIPTS:
Abstract is a separate Word document, “First author family name_ABSTRACT.doc”. Native authors should write the abstract in both languages (Serbian and English). The abstracts of foreign authors will be translated in Serbian.
This document should include the following: 1) author’s name, affiliation and title, the first named author’s address and e-mail – for correspondence, 2) working title of the paper, 3) abstract containing no more then 100 words, 4) abstract containing no more than 5 key words.
The manuscript is the separate file, „First author family name_Paper.doc“ which includes appendices and figures involved within the text. At the end of the paper, a reference list and eventual acknowledgements should be given. References to published literature should be quoted in the text brackets and grouped together at the end of the paper in numerical order.
Paper size: Max 16 pages of B5 format, excluding abstract Text processor: Microsoft Word Margins: left/right: mirror margin, inside: 2.5 cm, outside: 2 cm, top: 2.5 cm, bottom: 2 cm Font: Times New Roman, 10 pt Paper title: Uppercase, bold, 11 pt Chapter title: Uppercase, bold, 10 pt Subchapter title: Lowercase, bold, 10 pt Table and chart width: max 125 mm Figure and table title: Figure _ (Table _): Times New Roman, italic 10 pt
Manuscript submission: application should be sent to the following e-mail:
[email protected] ; [email protected] or posted to address of the Journal:
University of Kragujevac – Faculty of Engineering International Journal M V M
Sestre Janjić 6, 34000 Kragujevac, Serbia
The Journal editorial board will send to the first-named author a copy of the Journal offprint.

MVM – International Journal for Vehicle Mechanics, Engines and Transportation Systems
OBAVEŠTENJE AUTORIMA
Časopis MVM objavljuje orginalne radove koji nisu prethodno objavljivani u drugim časopisima, što je odgovornost autora. Za rad koji je prihvaćen za štampu, prava umnožavanja pripadaju izdavaču.
Časopis se izdaje na engleskom jeziku.
Časopis Mobility & Vehicles Mechanics se nalazi na SSCI listi.
Svi prispeli radovi se recenziraju. Sva komunikacija se obavlja sa prvim autorom.
UPUTSTVO AUTORIMA ZA TEHNIČKU PRIPREMU RADOVA
Rezime je poseban Word dokument, “First author family name_ABSTRACT.doc”. Za domaće autore je dvojezičan (srpski i engleski). Inostranim autorima rezime se prevodi na srpski jezik. Ovaj dokument treba da sadrži: 1) ime autora, zanimanje i zvanje, adresu prvog autora preko koje se obavlja sva potrebna korespondencija; 2) naslov rada; 3) kratak sažetak, do 100 reči, 4) do 5 ključnih reči.
Rad je poseban fajl, „First author family name_Paper.doc“ koji sadrži priloge i slike uključene u tekst. Na kraju rada nalazi se spisak literature i eventualno zahvalnost. Numeraciju korišćenih referenci treba navesti u srednjim zagradama i grupisati ih na kraju rada po rastućem redosledu.
Dužina rada: Najviše 16 stranica B5 formata, ne uključujući rezime Tekst procesor: Microsoft Word Margine: levo/desno: mirror margine; unurašnja: 2.5 cm; spoljna: 2 cm, gore: 2.5 cm, dole: 2 cm Font: Times New Roman, 10 pt Naslov rada: Velika slova, bold, 11 pt Naslov poglavlja: Velika slova, bold, 10 pt Naslov potpoglavlja: Mala slova, bold, 10 pt Širina tabela,dijagrama: max 125 mm Nazivi slika, tabela: Figure __ (Table _): Times New Roman, italic 10 pt Dostavljanje rada elektronski na E-mail: [email protected] ; [email protected]
ili poštom na adresu Časopisa Redakcija časopisa M V M
Fakultet inženjerskih nauka Sestre Janjić 6, 34000 Kragujevac, Srbija
Po objavljivanju rada, Redakcija časopisa šalje prvom autoru jedan primerak časopisa.

Mobility & Motorna
Vehicle Vozila i
Mechanics Motori _____________________________________________________________
Isak Karabegović
Ermin Husak
SIGNIFICANCE OF INDUSTRIAL ROBOTS IN DEVELOPMENT OF AUTOMOBILE INDUSTRY IN EUROPE AND THE WORLD
7-16
Slobodan Mišanović EXPLOITATION AND ENVIRONMENTALLY ASPECTS OF HYBRID BUSES IN EUROPEAN CITIES
17-31
Nikola Avramov
Petar Simonovski
CFE MODEL OF A MISSING BOLTED JOINTS INFLUENCE ON A GUARDRAIL RESTRAIN SYSTEM DURING IMPACT
33-42
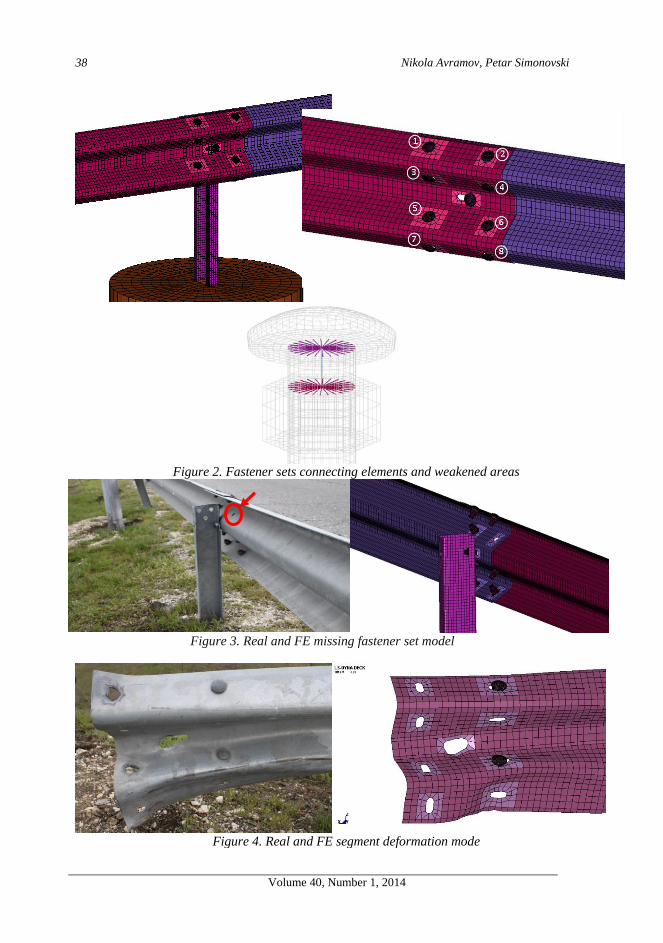
Milan Milovanović
Miroslav Demić
Saša Jovanović
THE ANALYSIS OF SUBFRAME INFLUENCE ON CAR BODY BEHAVIOUR
43-55
Volume 40
Number 1
2014.

Mobility & Motorna
Vehicle Vozila i
Mechanics Motori _____________________________________________________________
Isak Karabegović
Ermin Husak
ZNAČAJ INDUSTRIJSKIH ROBOTA U RAZVOJU AUTOMOBILSKE INDUSTRIJE U EVROPI I SVETU
7-16
Slobodan Mišanović EKSPLOATACIJA I EKOLOŠKI ASPEKTI HIBRIDNIH AUTOBUSA U EVROPSKIM GRADOVIMA
17-31
Nikola Avramov
Petar Simonovski
FE MODEL ZA ANALIZU UTICAJA MEDOSTATALA ELEMENATE VEZE NA SIGURNOSNE OGRADE TOKOM SUDARA
33-42
Milan Milovanović
Miroslav Demić
Saša Jovanović
ANALIZA UTICAJA POLUŠASIJE NA PONAŠANJE KAROSERIJE
43-55
Volume 40
Number 1
2014.

Volume 40, Number 1, 2014
SIGNIFICANCE OF INDUSTRIAL ROBOTS IN DEVELOPMENT OF
AUTOMOBILE INDUSTRY IN EUROPE AND THE WORLD
Isak Karabegović1, Ermin Husak,
UDC:681.5;681.9
Summary
It is known that human population is increasing year after year, there is also a constant
increase of automation and modernization of all production processes as well as the
production processes of an automobile industry. This results with increasing production of
the new motor vehicles every year in a total number of motor vehicles, and also increasing
of the new vehicle models and opening of the new factories of motor vehicles. For such
given conclusion of production enlargement of motor vehicles, the new technologies that are
responsible are: information technologies, sensor technology, robotic technology and new
production technologies. An application of the new technologies looks back in adoption of
new products, tool production, speed and accuracy of production. The production processes
in automobile industry were amongst the first in which industrial robots were beginning to
apply, and were used for automation of process while performing different jobs. The
application of industrial robots in production processes of automobile industry is increasing
from day to day, and their application for performing those jobs that, until today, could not
be carried out with the industrial robot. The development of sensor technology, i.e. the
equipped industrial robots, robot's vision enabled to perform these jobs. This paper provides
the role of industrial robots in development of automobile industry in Europe and the world.
Key words: automobile industry, industrial robot, application, production, new
technologies.....
ZNAČAJ INDUSTRIJSKIH ROBOTA U RAZVOJU AUTOMOBILSKE
INDUSTRIJE U EVROPI I SVETU
UDC: 681.5;681.9
Rezime
Poznato je da je ljudska populacija raste iz godine u godinu, Takođe, postoji konstantan
porast automatizacije i modernizacije svih proizvodnih procesa, kao i proizvodnih procesa
automobilske industrije. Ovo dovodi do toga da se svake godine o e a a o o a
o h moto h o la u uku om b o u moto h o la, a takođe se o e a a broj novih
modela i otvaraju se nove fabrike motornih vozila. Za taka akl učak atog o o og
oš e a moto h o la, o e teh olog e ko e su o go o e su: fo mac o e
tehnologije, tehnologija senzora, tehnologija robota i nove proizvodne tehnologije. Primena
1 Received March 2014, accepted: June 2014.

novih tehnologija daje osvrt na: ač usvajanja novih proizvoda, proizvodnju alata, brzinu i
tač ost o o e. P o o oces u automob lsko ust b l su među ma u
kojoj su ust sk obot su očel a se me u u. Ko š e su a automat ac u
procesa prilikom obavljanja ra l č t h oslo a. P me a ust sk h obota u procesu
proizvodnje u automobilskoj industriji se raste iz dana u dan i njihova primena u obavljanju
tih poslova, do danas je nezamisliva bez industrijskih robota. Razvoj tehnologije senzora, tj.
usa ša a je industrijskih robota, me om obota ko „ “ omogu e o obe beđu e se a
roboti mogu da obavljaju ove zadatke. U ovom radu prikazana je uloga industrijskih robota
u razvoju automobilske industrije u Evropi i svetu.
Ključne reči: automobilska industrija, industrijski robot, primena, proizvodnja, nove
tehnologije

Volume 40, Number 1, 2014
SIGNIFICANCE OF INDUSTRIAL ROBOTS IN DEVELOPMENT OF
AUTOMOBILE INDUSTRY IN EUROPE AND THE WORLD
Isak Karabegović1 PhD, Professor, Ermin Husak, MSc, Assistant
UDC:681.5;681.9
INTRODUCTION
For vehicle production enlargement of all kinds is responsible the technology
development of all kinds. One of the technologies is the new production technologies. The
new production technologies, with the process integration as a main goal, production and
quality enlargement, are based on a new techniques and short development time. The new
technologies are made of the sophisticated knowledge, experiences and information
techniques with a goal to approach a customer at a right time.
Constant outbuilding of the production technologies is enabled with fast
development of the information technologies. The new conceptual approaches have incurred
in the last fifteen years in an area of the mechanical production engineering, with the main
goal to shorten production cycle of a product. Researches indicate that about 80% of
production quality is achieved in a development stage and that 70% of product costs are
determined in this stage. The other responsible technology for development of automobile
industry is the robotic technology, i.e. an application of industrial robots in production
processes of automobile industry. At the beginning, the industrial robot applications in
production processes are used for performing jobs that were dangerous for an employee
health and for performing jobs in difficult conditions of work.
The development of information technology, sensor technology and robotic
technology is extending the industrial robot application in production processes of
automobile industry, so that any process in automobile industry today is unconceivable
without the industrial robot [1, 2, 3]. The industrial robots are used in welding process of the
car shell, painting, montage and inspection. The industrial robots are also used in many
other applications in automobile industry, like: different forms of mechanical processing in
making parts for vehicles, plastic moulding, seal application on an automobile windshield,
and taking parts from a transporters and their packing on the palettes for a forklift truck. The
application of robot's vision on the industrial robots leads to extending of industrial robot
application in vehicle production processes, and also a number of produced motor vehicles
of all kinds are increasing year after year.
1. INDUSTRIAL ROBOT APPLICATION IN AUTOMOBILE INDUSTRY OF
EUROPE AND THE WORLD
An application of industrial robots in Europe and the World is shown in a table 1,
and a figure 1. The statistical data that are shown in table 1 and figure 1 are used from the
IFR (International Federation of Robotics) [6, 7, 8].
1 Isak Karabegović, University of Bihać, Faculty of Technical Engineering, Irfana
Ljubijankića bb. 77000 Bihać, Bosnia and Herzegovina, email: [email protected]

Isak Karabegović, Ermin Husak
Volume 40, Number 1, 2014
10
0
20.000
40.000
60.000
80.000
100.000
120.000
140.000
160.000
Figure 1. Trend of annual application of industrial robots in the World,
An annual application trend of industrial robots in the World for a period of 2000 -
2013 is shown at figure 1. The annual industrial robot application in this period moved from
60.000 to 120.000 of robot units. According to shown trend it can be concluded: in a period
of 2000-2002 the industrial robot application trend is decreasing at annual level, then the
increasing trend from 2002-2005. From 2005 - 2013 can be concluded that the robot
application at annual level is almost constant and moves about 157.000 units, but in 2009
the application decline has been recorded to 60.000 units. In the last three years 2011 – 2013
industrial robot application is increasing to 155.000. In this period, the minimal industrial
robot application has been recorded in 2002 and 2009 due to industrial world crisis, as
shows figure 1.
Table 1. Application of industrial robots at annual and total level in
Europe and World [6, 7, 8] Installation
Cont./Yar
Annual application of robots units Total application of robots units 2008 2009 2010 2008 2009 2010
EUROPA 34.695 20.480 30.630 343.329 343.661 352.031
Rest of the
World
78.277 39.538 87.707 691.972 677.070 682.985
Total World 112.972 60.018 118.337 1.035.301 1.020.731 1.035.016
30,71%34,12%
25,88%
69,29%65,88%
74,12%
0,00%
10,00%
20,00%
30,00%
40,00%
50,00%
60,00%
70,00%
80,00%
2008 2009 2010
EVROPA R.of.Wor.
33,16% 33,60% 34,01%
66,84% 66,40% 65,99%
0,00%
10,00%
20,00%
30,00%
40,00%
50,00%
60,00%
70,00%
80,00%
2008 2009 2010
EVROPA R.of.Wor.
Annual application of robots units Total application of robots units
Figure 2. Percentage of industrial robot application in Europe and World at annual and
total level in production processes

Significance of industrial robots in development of automobile industry
in the Europe and the World
Volume 39, Number 4, 2013
11
Table 1 and figure 2 are showing the annual and total industrial robot application in
Europe and the World at annul and total level in period of 2008 - 2010. If we overlook the
application trend of industrial robot in Europe, it is seen that at annual level in this period
moves from 20.480 - 34.695 units, i.e. 22,88% - 34,12%, in relation to total annual
application in the World. When considering the total industrial robot application, in Europe
is applied 343.329 - 352.031 units, i.e. 33, 16% - 34, 01%, in relation to 1.030.000 units of
industrial robots in the World. We come to a conclusion that 34% of industrial robots are
installed in production processes in Europe, and the rest of 66% is installed on other
continents in the World. Let us analyse the industrial robot application in the drives of
automobile industry in the World. The trend of robot application in production processes of
motors and motor vehicles at annual and total level is shown in figure 3.
0
10.000
20.000
30.000
40.000
50.000
60.000
2005 2006 2007 2008 2009 2010
0
50000
100000
150000
200000
250000
300000
350000
400000
2005 2006 2007 2008 2009 2010
Figure 3. Application of industrial robots in production processes of motors and motor
vehicles at annual and total level in the World
According to figure 3, the robot application trend at annual level in automobile
industry has the decline trend with 50.000 units to 40.000 units from 2006 to 2008, and then
the decline to 20.000 units in 2009, while in 2010, the robot application increase to 33.000
units. The smallest application has been recorded in 2009 due to a huge industrial crisis in
the World. The trend of robot application in automobile industry at total level is in increase
year after year, and has increased from 260.000 units in 2006 to 373.000 in 2010. It
happened due to automation and modernization of fabrics that produce vehicles and opening
of the new fabrics for vehicle production.
Let us analyze the industrial robot application in automobile industry in Europe,
and through an analysis let us cover those countries with the most developed automobile
industry. The robot application trend in automobile industry has been given in table 2.
Table 2. Trend of industrial robot application in automobile industry al annual and total
level in Europe [6, 7, 8] Installation
Cont./Year
Annual application of robots units Total application of robots units 2008 2009 2010 2008 2009 2010
Aut. Ind. of
Europe
12.177 6.700 12.288 156.447 154.308 157.646
Re. of Indus. 22.518 13.780 18.342 186.882 189.353 195.385
Total EVRO. 34.695 20.480 30.630 343.329 343.661 352.031

Isak Karabegović, Ermin Husak
Volume 40, Number 1, 2014
12
35,09% 32,71%
40,11%
64,91% 67,28%
59,88%
0,00%
10,00%
20,00%
30,00%
40,00%
50,00%
60,00%
70,00%
80,00%
2008 2009 2010
Auto Ind. R.of.Ind.
45,56% 44,90% 44,78%
54,43% 55,10% 55,22%
0,00%
10,00%
20,00%
30,00%
40,00%
50,00%
60,00%
2008 2009 2010
Auto Ind. R.of.Ind.
Annual application of robots units Total application of robots units Figure 4. Percentage of industrial robot application in automobile industry in Europe at annual and total level in
production processes [14, 15, 16]
If we analyze the industrial robot application in automobile industry in Europe,
table 2 and figure 4, it is obvious that at annual level is applying about 12.000 units, which
is about 38% of total robot application at annual level, while 62% of robot units is applying
in other production processes. The total industrial robot application trend in automobile
industry is somewhat different, and is applied about 190.000 units of total application of
350.000 units. In other words, in automobile industry robots are mostly applied, about 45%,
while in other industries are applied about 55% of total industrial robot quantity. We can
conclude that in Europe, the production processes are modernizing and are more automated
in automobile industry as a result of constant development of the new technologies,
information technologies and robotic technology.
2. PRODUCTION OF AUTOMOBILE AND LOAD VEHICLES IN THE WORLD
The production trend of automobile and load vehicles in automobile industry is
given in a figure 5, according to data from the OECD (Organization for Economical Co-
operation and Development).
0
10.000.000
20.000.000
30.000.000
40.000.000
50.000.000
60.000.000
70.000.000
80.000.000
90.000.000Total vehicle
Autocars
Trucks vehicles
Figure 5. Annual automobile and trucks vehicles production in period 1999-2012 [4, 5]
According to figure 5, it is seen that the production trend of automobile and load
vehicles is increasing year after year. In 1999 have been produced about 40 million of
automobiles and about 16 million of load vehicles which gives the number of 56 million
vehicles. In 2012 has been produced about 63 million of automobiles and 21 million of load

Significance of industrial robots in development of automobile industry
in the Europe and the World
Volume 39, Number 4, 2013
13
vehicles, and the total production in 2012 amounts to 84 million of vehicles. It is obvious
that in 13 years the production of vehicles increased for 28 million units.
0
2.000.000
4.000.000
6.000.000
8.000.000
10.000.000
12.000.000
14.000.000
16.000.000
18.000.000
20.000.000
Autocars
0
500.000
1.000.000
1.500.000
2.000.000
2.500.000
Autocars
Figure 6. Annual production in automobile industry in 2011 by countries [4, 5]
According to figure 6, the first place in production in automobile industry in the
World in 2011 takes China with over 18 million vehicles, the second place takes the USA
with over 8 million vehicles and the third place takes Japan with over 8 million vehicles.
The production trend is logical in automobile industry because the trend is influenced by the
installing trend of industrial robots. China is the best example as it is seen in figure 6,
because the number of industrial robot applications in China is increasing year after year.
When it comes to the trend of automobile production in Europe, we analysed those
countries where the automobile production at annual level is over 500.000 units, and those
countries are: Germany, Spain, France, Italy and the Czech Republic. Other countries in
Europe are not taken into consideration due to vehicle production under 500.000 units at
annual level. The annual trend of vehicle production and total trend of industrial robot
application in all industrial branches and in automobile industry in Germany and Spain is
shown in figure 7.
0
1.000
2.000
3.000
4.000
5.000
6.000
7.000
2008 2009 2010 2011 2012
Germany
Spain
Production of the vehicles The total use of the robot and the auto industry
Figure 7. Production of vehicles in Germany, Spain and total application of industrial
robots in all industrial branches and automobile industry [4, 5, 6, 7, 8]
According to figure 7, the first place in vehicle production in Europe takes
Germany, and the trend of vehicle production moves from 5, 2 million of vehicles to 6, 3
million of vehicles. When analysing the industrial robot application in Germany (right
figure), in a period from 2005-2010 has been applied totally 125.000-145.000 of industrial
robot units, a part of that number is applied in automobile industry, about 80.000 units at
annual level which represents more then 50% of industrial robots which are installed in
fabrics that produce vehicles. Considering an average, on one robot comes 75 vehicles (1/75
x 1
000 u
nit
s
U
nit
s of
ind
ust
rial
robots

Isak Karabegović, Ermin Husak
Volume 40, Number 1, 2014
14
robot/vehicles). At a same graph has been shown the vehicle production in Spain, and the
trend moves from 2 million of vehicles to 2, 5 million of vehicles, while total industrial
robot application in Spain at annual level moves from 24.000-29.000 units, and in
automobile industry has been installed 16.000-17.000 units which represents about 60% of
all installed robots in all industrial branches. In Spain, on one robot comes 117 vehicles
(1/117 robot/vehicles).
0
500
1.000
1.500
2.000
2.500
3.000
2008 2009 2010 2011 2012
Italy
Czech Republik
France
a) Production of the vehicles b) The total use of the robots and use in automotive industry Figure 8. Production of vehicles in France, Italy, Czech Republic and total application of
industrial robots in all industrial branches and automotive industry
When analyzing the diagrams from figure 8, we conclude according to a) that the
motor vehicle production is maximal in France and moves from 2 million to 2.5 million
annually, in a period of 2008-2012, the second place takes the Czech Republic where the
production moves from 900 thousand to 1, 3 million of motor vehicles, and the third place
takes Italy with the production of motor vehicles from 600 thousand to 1.1 million in a
period of 2008-2012. In figure 8 b) total industrial robot application has been shown in Italy
and France and also the total application in automobile industry. The total trend of industrial
robots in all industrial branches in Italy moves from 58.000 to 63.000 of robot units, while
the automobile industry uses only 20.000 robot units in a period of 2005-2010.
The industrial robot application trend in France in the same period is from 30.000
to 36.000 of robot units, and automobile industry uses almost as Italy, about 20.000 of robot
units. It is obvious that in France, in relation to Italy, is produced more then 2 to 2,5 million
vehicles at annual level with almost the same number of installed industrial robots in
production drivers in automobile industry. One of the conclusions can be that the industrial
robots are not enough functional in drivers for vehicle production in Italy, or that the
automation of the production processes hasn't been carried out properly; where in the same
automation robots are included. The other conclusion can be that the companies that
produce vehicles in France are performing total automation and modernization of the
production processes and all lines for vehicle production are introducing innovations, are
shortening the production time for production of one vehicle, and in this way are reaching
this trend of vehicle production.
The Czech Republic, ever since entering the EU, produces more vehicles than Italy
and that trend moves from 900 thousand to 1.1 million vehicles in a period of 2008-2012,
although the number of installed industrial robots in production drivers of automobile
industry is small and moves from 100-300 of robot units. The reason for such production
vehicle trend and robot application in production processes of automobile industry in the
Czech Republic is because the German companies dislocated their production in the Czech
Republic, and most of the vehicle parts that are produced in Germany come as a semi-
finished product in companies for vehicle production in the Czech Republic, where only the
montage is carried out. Besides Germany, in the Czech Republic are companies for vehicle
production dislocated and the other companies from different countries. This way justifies
this trend of vehicle production in the Czech Republic with such small number of installed
industrial robots in automobile industry.
x1000
Unit
s of
ind.
robots
Un
its
of
ind.
robots

Significance of industrial robots in development of automobile industry
in the Europe and the World
Volume 39, Number 4, 2013
15
3. CONCLUSION
According to all derived indicators in this paper it can be certainly predicted that
the great robot application in vehicle production will continue to carry on in the future. The
new generations of robots with more perfect sensory evaluation, and particularly with
robot's vision will have greater application in this industry, and also in industry for
production of vehicle parts.
The production of vehicle parts of the renowned world's manufacturers is the
chance for the industrial development of the countries in transition, like the Czech Republic.
The robot application of the new generation in automobile industry will improve the quality
and productivity of part production and of entire vehicle, and it will significantly influence
on increasing the competitive competences of firms that produce vehicles for more
demanding international market.
The greater robot application in automobile industry will enable more continuous
and more flexible production that will significantly contribute to satisfaction of market
demand for higher variety of the same types of vehicles, by building certain supporting
equipment and securing systems in vehicles. The future production drivers of the vehicle
producers will look like „The fabrics of the future“ with more and more robots, and less and
less production employee. These firms, from day to day, will increase a number of engineers
which will have to have a proper knowledge from the modern technician discipline called
mechatronics that represents an integration of mechanical engineering, management,
electronics and computer science.
4. REFERENCES
[1] C. John, J., Introduction to Robotics: Mechanics and Control, Pearson Prentice Hall,
2005.
[2] Doleček, V., Karabegović, I., Robots in Industry, Tehnički fakultet Bihać, Bihać, 2008.
[3] Doleček, V., Karabegović, I., Robotics, Tehnički fakultet Bihać, Bihać, 2002.
[4] VDA, AutoJahresbericht 2011, 2011.
[5] VDA, AutoJahresbericht 2012, 2012.
[6] World Robotics 2010, United Nations, New York and Geneva, 2010.
[7] World Robotics 2008, United Nations, New York and Geneva, 2008.
[8] World Robotics 2006, United Nations, New York and Geneva, 2006.
[9] Bakšys, B., Fedaravičius, A., Robotu Technika, Kaunas Technologija, Kaunas, 2004.
[10] Rogić, M., Industrial Robots, Mašinski fakultet Banjaluka, Banjaluka, 2001.
[11] Karabegović, I., Karabegović, E., Husak, E., (2011), Application analyses of industrial
robot in World automobile industry in 2010, Journal of international scientific
publications: Material,Methods & Technologies, Vol.5, No.2, 2011., pp. 336-345
[12] Wolka, D.W., Roboter sisteme, Technishe Universität des Saarlandes im Stadtwald,
1992.
[13] Freund, E., Stern, O., Robotertechnologie I, Institut für Roboterforschung, Dortmund,
1999.
[14] Karabegović, I., Karabegović, E., Husak, E., Comparative analysis of the industrial
robot application in Europa and Asia, International Journal of Engineering &
Technology IJET-IJENS Vol: 11 No:01, 2011.

Isak Karabegović, Ermin Husak
Volume 40, Number 1, 2014
16
[15] Karabegović, E., Karabegović, I., Hadžalić, E., Industrial robots application trend in
world metal industry, Journal Engineering Economics,Vol.23. No.4, Lithuania, 2012,
pp. 368-378.
[16] Karabegović, I., Doleček, V., Husak, E., Analysis of the Industrial Robots in Various
Production Processes in the World, International Review of Mechanical Engineering,
Vol.5., No.7., 2011, Napoli, Italy, pp. 1272-1277.
[17] McKerrow, P. J., Introduction to robotics, Addison-Wesley Publishing Company,
Sydney, 1991.
[18] M. Richard, M., A Mathematical Introduction to Robotic Manipulation, CRC Press,
1994.
[19] Sciavicco, L., Siliciano, B., Modeling and Control of Robot Manipulators, McGraw-
Hill International Editions, 1996.
[20] Shimon, Y. N., Handbook of Industrial Robotics, 2nd Edition, 1999.
[21] Merlet, J. P., Parallel Robots (Solid Mechanics and Its Applications), 2006.
[22] Timothy N. H., Loving the Machine: The Art and Science of Japanese Robots, 2006.
[23] Spong M. W., Hutchinson, S., Vidyasagar M., Robot Modeling and Control, 2005.

Volume 40, Number 1, 2014
EXPLOITATION AND ENVIRONMENTALLY ASPECTS OF HYBRID BUSES IN
EUROPEAN CITIES
Slobodan Mišanović 1,
UDC:629.342
ABSTRACT: The problem of air pollution, acid rain and the formation of ''greenhouse
effect'', as a result of emissions a carbon dioxide (CO2), from vehicles are found in the
developed countries of the EU several decades.
This problem was got primary importance. EU has chosen a strategy of increase number the
vehicles with lower emissions of carbon dioxide (CO2). Introduction of city buses with
hybrid (diesel-electric) engines in a growing number of EU cities, are first stage in the
implementation of the EU strategy which has defined (Transport policy- White Paper 2011)
where is the ultimate goal that of the 2050 year, the cities in the EU will be used only
vehicles with zero emissions (CO2). Defined strategy for the EU to promote an ecological
clean the bus subsystem of public transport, have accelerated all manufacturers of buses in
the European market, to produce buses with hybrid power, which allowed that companies
for public transport, are used tender procedures for procurement of hybrid buses pursuant to
Directive EC/2009/33.
In this paper, is presented experiences in operation of hybrid buses in the some EU cities,
which have this type of buses in regular service.
KEY WORDS: hybrid bus, exploitation, environment
EKSPLOATACIJA I EKOLOŠKI ASPEKTI HIBRIDNIH AUTOBUSA U
EVROPSKIM GRADOVIMA
REZIME: Problem aerozagađenja, kisele kiše i formiranje ''efekta staklene bašte'', kao
rezultat emisije ugljen- dioksida (CO2 , iz ozila s se raz ijenim zemljama ro ske
nije nekoliko e enija aj roblem je obio r orazre ni zna aj je izabrala
strategij o e anja broja ozila sa niskim emisijama gljen-dioksida (CO2 ođenje
gradskih autobusa sa ibri nim izel - elektri ni motorima s e e em broj gra o a ,
s r a faza realiza iji strategije koja je efinisana aobra ajna olitika - Bela knjiga
2011), gde je krajnji cilj da se od 2050. godine u gradovima EU koriste samo vozila sa
nultom emisijom CO2 efinisana strategija romo iše ekološki iste o sisteme ja nog
re oza, što je brzalo s e roiz ođa e a tob sa na e ro skom tr išt , a roiz o nj
a tob sa sa ibri nim ogonom, što je omog ilo a re ze a za ja ni re oz , koriste se
tenderske procedure za nabavku hibridnih autobusa u skladu sa Direktivom EC/2009/33. U
ovom radu su prikazana iskustva u primeni hibridnih autobusa u nekim gradovima EU, koje
imaju ovaj tip autobusa u redovnoj upotrebi.
KLJUČNE REČI: hibridni autobus, ekspolatacija, okolina
1 Received August 2012, Accepted September 2012

Volume 39, Number 4, 2013
EXPLOITATION AND ENVIRONMENTALLY ASPECTS OF HYBRID
BUSES IN EUROPEAN CITIES
Slobodan Mišanović 1MSc
UDC: 629.342
1. INTRODUCTION
The energy and environmental problems at the moment are the major problems that
the world faces today. The intensive development of the automotive industry has been one
of the hallmarks 20th
century. At the beginning of 70-ies of the last century due to the oil
crisis in the developed countries of the world, all leading vehicle manufacturers are headed
in research of alternative fuels in order to partially mitigate the dependence on fossil fuels.
In addition, it is known that fossil fuels as an energy resource will have a limited service life
of up to 100 next years (Figure 1).
Figure 1 The use of energy resources in the world to 2100. [4]
Trend of production, available reserves, volatility of fuel prices (Figure 2), in the
past 40 years have accelerated on the experiments with various alternative fuels from which
we will mention electric vehicles, solar cells, methanol, vegetable fuel, hydrogen, natural
gas, etc.
1 Slobodan Mišanović, M.Sc.T.E., GSP ''Beograd'', Knjeginje Ljubice 29, Beograd,

Slobodan Mišanović
Volume 40, Number 1, 2014
20
Figure 2 The trend of change in the price of diesel fuel in the EU (2005-2011)
Euro/1000 [4]
But the key question that came to the fore and that required an immediate solution
has become a matter of ecology, and the rapid increase in environmental pollution as a
direct result of burning fossil fuels. The enormous release of carbon dioxide CO2, primarily
from automobile engines and industrial plants has led to global warming (Figure 3) and
causing the greenhouse effect, acid rain and the formation of damaging the upper layers of
the atmosphere.
1973.1973. 2005.2005.
Figure 3 Global warming, melting ice at the North Pole 1973-2003 year
2. PLACE AND ROLE OF BUS SUBSYSTEM TRANSPORTATION IN THE EU
In the cities of the EU, the bus subsystem of public transport is one of the most
important segments of the urban life of the city, which has a direct impact on meeting the
socio-economic and other needs of the population.
Thanks to its techno-exploitation advantages and flexibility, its role in the
distribution of passengers with highly capacitive lines of public transport such as metro or
LRT and urban parts, is irreplaceable. According to the data of UITP's, today in the 100
largest cities in EU operational use is around 54,700 buses urban type, which achieve about
80% of the transport of labour-expressed in km. The EU is the world leader in the
production of city buses. Annually produces about 12,000 new buses which are 60% of
world production [9].
Most buses use conventionally energy but fossil fuels are one of the main causes of
urban pollution and emissions in cities. For these reasons bus subsystem has become
important as a major promoter of new technologies in the implementation of sustainable

Exploitation and environmentally aspects of hybrid buses in european cities
Volume 40, Number 1, 2014
21
development strategies. The above facts have initiated the adoption of a series of strict
standards relating to limit emissions from conventional vehicles to drive, from ECR 49 of
1982, over Euro emission standards (Euro 1 to Euro 6) (Figure 4) in the period 1992 to
2013, the introduction of buses powered by CNG, LPG and bio fuels, has led to significant
progress in reducing emissions of gases (CO, NOx, CxHy, PM10). The problem is that the
buses and vehicles on conventionally fuels are remaining high emitters of carbon dioxide
CO2, as a direct result of burning fossil fuels.
Figure 4 The evolution of development in terms of bus emissions [11]
Since December 2010, the EU countries have been applied the EC Directive
33/2009 concerning the promotion of energy efficient and environmentally clean vehicles in
road transport, which are used in the public sector such as buses for public transport, utility
vehicles, etc. The directive defines a strategy to reduce CO2 emissions by 20% by 2020 year
compared to the base year 1990 year [6]. Significantly, the directive regulates the energy
and environmental criteria for tendering for procurement of new vehicles, which will be an
integral part of the tender documents. This directive defines the price of emission, expressed
in Euro / kg for each product: CO2 (0.03 to 0.04 Euro / kg), NOx (0.0044 Euro / g), Non-
Methane Hydrocarbons - NMCH (0.001 Euro / g), Particular matter - PM (0.087 Euro / g)
[6]. The Directive specifies that the basis for all calculations in terms of calculating the
value of the issue or the cost of emissions is g / km, not g / KWh.
3. EU-WHITE PAPER OF TRANSPORT
The introduction of hybrid buses (diesel-electric) in the system of public transports
passengers in the period 2010-2020 years, is the first step in the implementation of the
strategy defined by the EU which is the ultimate goal that by 2050, in cities of the EU , will
be only vehicles with pure electric drive or ''zero emissions'' (CO2) [7].

Slobodan Mišanović
Volume 40, Number 1, 2014
22
Figure 5 Forecast uses of buses for public transport in the EU for the period 2010-2050.
It is observed that the trend of using diesel-powered buses have a constant tendency
of reduce everything to its complete abolition of the 2050 year. (Figure 5) Enhanced Hybrid
concept ''plug in'' will be present after 2015. Introducing the bus with pure electric drive will
depend primarily on battery technology, battery capacity; need to provide autonomy of day
operation, without charge. The widespread use of this type of drive is expected after the
2020. It should be noted that there are now buses with full electric drive, but their
application is limited only to the mini and midi versions, with the range of movement of
about 120 km, which is not enough for a regular exploitation. Currently they are developing
electric-powered buses with standard lengths of 12 m and articulated 18 m, with different
recharge batteries. This concept was presented in 2009, on the one line in Shanghai (China).
In Geneva (Switzerland) is currently in the implementation of the project Trolleybus
Optimisation System Alimentation - TOSA the introduction of the first buses to electric
drive, whose start-up is planned for May 2013. For the period after 2025, provides for the
growing use technology of fuel cells (Fuel-Cell), which is used as fuel, hydrogen (H2).
HYBRID CONCEPT OF CITY BUSES
The concept of buses with hybrid drive is based on the use of two types of drive.
Buses have the two engines: diesel engine displacement about 5 litres and the electric
motor-generator. Depending of concept in use are serial and parallel types, (Figure 6)
a) Serial hybrid
b) Parallel hybrid
Figure 6 The working principle of the serial and parallel types of hybrid buses
In a serial-type hybrid (Figure 6a), the diesel engine drives a generator to produce
electricity, which accumulates in high capacity battery (ultra cap, Ni MH, Li-ion). The
vehicle is powered by electric motor located on the drive shaft. Diesel engine is turned on,
when the battery needs to be supplemented, the control unit regulates it. The cooling system
prevents overheating and keeps the operating temperature of electrical components.
Recovery system uses for electricity to charge the battery during braking mode. Block
inverter converts direct current from the battery into AC to drive asynchronous traction
motors.
In the parallel-hybrid concept (Figure 6b) can be to power electric motor or diesel
engine directly. Buses are powered with electric traction. When the vehicle reaches a certain
speed of 20-25 (km/h) includes a diesel engine that powers the vehicle through the
transmission. Depending on the mode and the load can be turned on simultaneously diesel

Exploitation and environmentally aspects of hybrid buses in european cities
Volume 40, Number 1, 2014
23
and electric motor. The main components of the hybrid buses: Hybrid unit, diesel engine,
inverter module, cooling unit, brake resistor, battery, battery cooling system (Figure 7).
Figure 7 The main components of the hybrid buses
Main advantages of the concept of hybrid system in comparison to buses for urban
transport with a conventional drive are reflected in:
Lower consumption of diesel fuel (20 to 40%),
Reduced CO2 emissions,
Lower emissions of harmful substances: CO, NOx, CxHy, PM10,
Lower level of external noise (10-12 dB(A)), and
Good driving performance (acceleration-deceleration) [3].
4. OPERATIONS HYBRID BUSES IN THE EU AND WORLD
The concept of the hybrid buses for public transport has been known since the 1969
year, when the Mercedes-Benz was shown the application of these buses. Their increased
utilization in urban public transport is recorded in the early 21st century only. At first it was
just a demonstration and observation opportunities primarily techno-exploitation elements,
leading bus manufacturers: Mercedes, MAN, Volvo in some EU capitals. Putting into
operation of buses with hybrid drive in the EU has begun since 2006 year. The period 2006-
2010 was marked by a relatively small number of buses with hybrid drive, which has been
involved in regular exploitation. It was the pilot testing a hybrid concept in cities: Paris,
Barcelona, Dresden, Strasbourg, Nuremberg, Wallonia and Flanders region in Belgium,
Luxemburg. London was exception where from 2006 in regular exploitation included 56
''double-decker’’ Wright-bus, which can be considered the beginning of the ''mass'' of
introducing this kind of buses in Europe. In the period 2010-2011/12 years there is a steady
upward trend in hybrid buses in regular operation, on the end of 2010. The EU has been in
service 178 buses with hybrid drive but the mid-2012, in service is 1191 buses with hybrid
drive. In the following Figure 8, is shown the numbers of hybrid buses by EU countries in
2012.

Slobodan Mišanović
Volume 40, Number 1, 2014
24
660
130 12074 58 46 31 24 21 19 8
0
100
200
300
400
500
600
700
Eng
land
Belgium
Ger
man
y
Holla
nd
Sca
ndin.co
untrie
s
Spa
in
Fra
nce
Swiss
Luxe
mbu
rg
Polan
d
Italia
Hyb
rid
bu
ses i
n s
ervic
e
Figure 8 EU number of hybrid buses in service 2012 year
Cities and regions with the highest number of hybrid buses currently in service are:
London (260), Manchester (162); Flanders Region-Belgium (136), Dresden (57), Oxford
(43); Birmingham (33), Dordrecht (27), Barcelona (25), Region South Holland (24),
Luxembourg (21), Hamburg (20), Oslo (18), Bochum (13) [5].
In 2012 expected to continue increase the number of buses in use. City of Dijon (F)
has published a procurement of 100 new hybrid buses, which will become the city with the
largest percentage share of hybrid buses.
Also, should be emphasized that the exploitation of hybrid buses have presented in
North America, starting since 1990. According to the data available at end of 2010 in the
United States and Canada were in service 6300 buses with hybrid drive. Observed by cities:
New York (1812), Toronto (950), Washington (550); Philadelphia (510), Seattle (520),
Chicago (228) [5].
Of the types of buses that are used the most common models are: Daimler Orion
and New Flyer bus-Xcelsior. At this time all leading bus manufacturers in the EU in its
commercial offer are given city buses with hybrid drive. The following Table 1 presents all
types of hybrid buses by manufacturers in the EU [5].
The following Figure 9 shows the Volvo 7700 Hybrid with basic technical data [8].
5. AN EXAMPLE OF THE EXPLOITATION OF HYBRID BUSES IN LONDON
The Bus transport in London is one of the largest systems of its kind in Europe and
the world.
With approximately 8500 buses in service, working on a network of 700 lines,
transports around 6.4 million passengers a day [1]. The structure of the fleet consists of:
33% of single vehicle, 62% double-decker and 5% of the articulated. Buses are spent about
240 million litres of diesel fuel per year, which releases exceeding 610 000 tons of carbon
dioxide CO2, which represents about 5% of the total emission. Responsibility than bus

Exploitation and environmentally aspects of hybrid buses in european cities
Volume 40, Number 1, 2014
25
emissions of gases is 6% for coal hydrogen (Cx Hy), 7.7% for micro particles (PM10), and
8% for carbon monoxide (CO) and 9% for oxides of nitrogen (NOx). [1] This high level of
emissions, give rise to adopting a series of measures in London, which began to be
implemented from 2000. Its aim is to reduce the level of emissions.
Table 1 Manufacturers and types of hybrid buses in the EU
Manufacturers Type of drive Energy storage Size
Evobus Serial Li-ion 18 m
MAN Serial Ultra capacity 12 m
Volvo Parallel Li-ion 12 m
Scania Serial Li-ion 15 m
Irisbus Serial Li-ion 12-18 m
Solaris Serial/Parallel Ultra capacity 12-18 m
Van Hool Serial Li-ion 9-10-18-24 m
VDL Parallel Li-ion 12 m
Hess Serial Ultra capacity 18-24 m
Aleks. Dennis Serial Li-ion 10 m ( DD)
Tata-Hyspano Serial Li-ion 12 m
Castrosua Serial Li-ion 9,6-11 m
Wright Serial Li-ion 12 m (DD)
Technical Data VOLVO
7700 Hybrid
Length: 12 000 mm,
Width: 2 555 mm,
Height: 3 200 mm,
Vehicle weight: 18
000 kg,
Number of doors: 3,
Number of
passengers: 95,
Hybrid system:
parallel Volvo-I-
SAM,
Diesel engine :
Volvo D5E, 5 L,
Power output /
torque: 210 hp, 800
Nm,
Electric motor power
output: 160 hp/800
Nm,
Batteries: Li-ion, and
Transmission:
Volvo-I-Shift
automatic.
Figure 9 Volvo 7700 H, AVL- Luxemburg

Slobodan Mišanović
Volume 40, Number 1, 2014
26
6. THE MOST IMPORTANT MEASURES
1) Substitution of old buses with diesel-powered, buses with lower emissions that
meet Euro 3, Euro 4, and Euro 5. This phase was particularly pronounced during the period
2001-2006 years, according to data from 2010 year, over 76% of buses meet these emission
norms. The most significant reduction was achieved in the micro emissions of PM10 [2].
The following Figure 10 presents annual bus trends of emissions (CO2, NOx, PM10) for
period 2001-2011 and forecasts for period 2012-2018.
Figure 10 Annual bus emission trends in London (2001-2018 year)
2) The introduction of hybrid buses
Putting into operation of hybrid buses has been a strategically decision that started
with the implementation of the 2006 year. Currently, 260 hybrid buses are run every day and
London is planning introduction of this type bus, total of 600 buses until 2016 year [2].
The following Table 2, presents the results of comparative testing of 3 different
types of buses with diesel-powered buses and equivalent to the hybrid [1] on the central line
route 159 (Figure11).
Table 2 Results of tests on the line route 159 (6th
February – 5th
March 2011 year)
Type of buses Type of drive Euro
Consump
tion CO2 NOx PM
norm L/100 km (g/km) (g/km)
(g/km
)
ADL Enviro
400 Diesel SCR Euro 4 47.6 1253 6.146 0.035
ADL Enviro
400 H
Hybrid Serial-
BAE Euro 4 32.3 856 4.170 0.024
Wright Gemini
2 Diesel SCR Euro 5 47.3 1250 3.490 0.025
Wright Gemini
2 H
Hybrid Serial-
Siemens Euro 4 27.7 734 2.04 0.020
Volvo B9TL Diesel SCR Euro 4 63.0 1670 4.648 0.046
Volvo B5L
Hybrid Parallel-
ISAM EEV 35.4 937 2.612 0.026

Exploitation and environmentally aspects of hybrid buses in european cities
Volume 40, Number 1, 2014
27
From the table 2 it can be observed that for all three types of buses with hybrid
drive have had decline in fuel consumption compared to the same bus with diesel
propulsion. As a result of less consumption of diesel fuel is lower emissions of CO2, NOx
and PM is shown in Table 2.
Figure 11 Pink line-Route 159 ( Marble Arch - Streatham Station)
Figure 12 ADL Enviro 400 Hybrid
The effect of using hybrid buses from the point of emission reductions are: 76%
less emissions CxHy, 98% lower CO emissions, 12% lower NOx emissions, 31% reduction
in fuel consumption and emissions of CO2, 4 dB(A) lower level of external noise. [10]
In addition to the large scale introduction of hybrid buses on the streets of London
as the most important measures to reduce emissions and CO2, coming from the bus
subsystems [2]:
Driver training in fuel-efficient driving,
Use of bio-fuels,

Slobodan Mišanović
Volume 40, Number 1, 2014
28
Introduction of ''shut-down'' which excludes diesel engine when the vehicle is in the
column, traffic lights, stop location,
''Retrofit'' buses with Euro 3 norm of the CRT to reduced NOx emissions (the period
2012-2015),
Purchase of new buses with Euro 6 emissions standard (from 2015 to 2018),
Experimental exploitation buses are driven by fuel cells currently has 8 buses in service.
7. AN EXAMPLE OF THE EXPLOITATION OF HYBRID BUSES IN THE
FLANDERS REGION (BELGIUM)
The company ''De Lijn'' is the largest operator in the Flanders region (Belgium).
Performing public transport in the cities of Bruges, Ghent, Antwerpen. Exploitation of buses
with hybrid drive were begun since 2008 years and is currently 130 buses '' Van Hool '' in
regular operation. According to the results of the test on bus line No 3, (Table 3), Van Hool
AG 300 D for diesel-powered vehicles and identical with hybrid operation in the winter
period, the hybrid bus was had the lower fuel consumption from 12.85 to 16.05% [12].
Table 3 Comparative results of fuel consumption on buses Van Hool AG 300 H and AG
300D
Period Van HooL AG 300H
L/100 Km
Van HooL AG 300D
L/100 Km %
22/10/-22/11/2010 47.63 55.3
13.8
6
1/1-31/1/2011 49.2 58.6
16.0
5
1/2-28/2/2011 49.81 57.15
12.8
5
The noise level measured on station while bus departure is 82.5 dB(A) for buses
with diesel-powered and 72.4 dB(A) with hybrid drive [11].
8. AN EXAMPLE OF THE EXPLOITATION OF HYBRID BUSES IN BARCELONA
Company-TMB-has 25 solo buses with hybrid drive, a serial-type by producer
Castrosua-MAN. Trial period was begun in 2008/9 on the two hybrid buses. Since 2010 the
fleet of hybrids was increasing. Experiences show that the use of hybrids in city driving
conditions generate savings of 20-25% compared to an equivalent diesel bus, while the
suburban mode, the difference is 10-15%, table 4 [13].
Table 4 Effects of reducing fuel consumption in different modes
MAN - Castrosua Stop time
%
Average speed
km/h
Energy saving
%
City driving conditions 44 12.1 20-25
Suburban driving conditions 32 25 10-15

Exploitation and environmentally aspects of hybrid buses in european cities
Volume 40, Number 1, 2014
29
Interestingly, note that TMB has in service 370 buses powered by CNG. They are
planning that some of CNG buses should be reconstructed, installation of equipment
Generator-Electric motors and other components and will become buses with Hybrid CNG-
powered.
9. FURTHER DEVELOPMENT OF THE CONCEPT OF HYBRID BUSES FOR
PUBLIC TRANSPORT
Buses with hybrid drive have been gaining increasing importance in many EU
companies and cities, thanks to its advantages in energy efficiency and emissions of CO2,
compared to a conventional bus. However, the hybrid concept has certain shortcoming
which slows massive use especially in less developed countries and cities. The perceived
disadvantages are:
High cost of hybrid buses (higher by 50% compared to the same bus with a diesel-
powered),
Battery life and their price (at present battery technology limits their lifespan to 6-7
years, after which it is necessary to replace the battery, which increases the
costs),
The greater weight of buses,
Specific maintenance (two engines, highly sophisticated technology, precautions
600 V),
Additional training for drivers and maintenance workers.
Figure 13 Optimal mode of serial hybrid ''Citaro'' [14]
Figure 14 Parallel hybrid concept'' Volvo'' [8]
For most of the hybrid buses depending on the system drive (serial or a parallel) in
real operating conditions, it is necessary to review all the influential weights (speed,

Slobodan Mišanović
Volume 40, Number 1, 2014
30
intensity of passenger flows, terrain ...) on routes where vehicles with hybrid drive working.
From that very much depends on the choice of the most suitable vehicle and therefore the
effects of use. Figure 13 shows an example of the optimal mode serial-type hybrid Citaro G
BlueTec. Figure 14 shows the characteristics of torque for parallel hybrid concept Volvo
7700 H.
In the next period, hybrid buses will have permanent development and
improvement as an alternative of diesel buses.
Improving battery technology that will allow to keep the battery life of 10-12 years,
which is approximately the service life of the vehicle,
Increasing the capacity of the battery which will allow greater autonomy in electric
mode, the vehicle,
At the moment capacity Li-ion battery is 85 Wh / kg. It is expected that in 3-4
years capacity will be about 170 Wh / kg,
Optimize components of the hybrid propulsion and auxiliary equipment on the
vehicle,
Higher capacity batteries enable supplementing '' plug in'' while the vehicle is
stationary at the station or terminus and thus reduce to a minimum the use of diesel
engine, and
Reducing vehicle weight. By using lighter composite materials, tends to reduce
vehicle weight by 1000 kg. This would have the effect of a 7% increase in the
efficiency of hybrid buses.
10. CONCLUSIONS
Exploitation of hybrid buses in many EU cities is a significant improvement of the
transport system of the city, especially in terms of environmental protection, energy
efficiency and quality of transport. Experiences in EU cities that use this concept were
contributed to identify possible specifics compared to diesel buses, especially in terms of
reducing fuel consumption, environmental benefits as well as future trends in the
development and promotion of the hybrid concept.
In the period 2011 - 2020 years hybrid buses will significantly contribute to the
sustainable development of cities, as the first phase in the use of electric drive, which will be
primary in all vehicles for road transport, in a future.
11. REFERENCES
[1] Weston M. - ''Commitment to hybrid buses in London: Interim results and future
plans'', 1st Workshop Hybrid user forum, London, 26 May 2011, pp.3,9,12,20
[2] Weston M, Esposito G. - ''Update on London and UK experience with hybrids'', 2nd
Workshop Hybrid user forum, Dordrecht and Rotterdam, 31 May 2012, pp.2,10
[3] Mars G. - ''Hybrid experience across Europe'', 2nd Workshop Hybrid user forum,
Dordrecht and Rotterdam, 31 May 2012, pp.16
[4] Putz R. - ''Options for fully electrified operation of urban bus lines'', Workshop of
Electrified public transport bus systems'', Brussels, 2 April 2012, pp. 6
[5] Gonzales F. - ''Fuel & Traction Systems Observatory Hybrids'' , 92th UITP Bus
Committee, Istanbul, 18 April 2012, pp.4,6,7-9
[6] Directive 33/2009/EC On the promotion of clean and energy efficient road transport
vehicles, 23 April 2009, pp. L 120/5, L 120/12

Exploitation and environmentally aspects of hybrid buses in european cities
Volume 40, Number 1, 2014
31
[7] Ramirez A. - '' Presentation EU White paper 2011- Roadmap to a single European
Transport area'', Workshop Towards a competitive and resource efficient transport
system'', 19 April Belgrade, pp.10,17,19
[8] Volvo buses. - ''Discover the new Volvo 777 Hybrid'', catalogue 2010, pp.4
[9] UITP-Bus Division, www.uitp.org/public-transport/bus/index.cfm, accessed on 1 June
2012.
[10] Public Transport International-Magazine,'' Hybrid Buses of Tf/ London'', No 5-2009,
ISSN-1016-796X, pp.8
[11] Roger M.- ''First results hybrid program De Lijn'', 6th Bus Conference, Lyon, 9-11 June
2010,pp. 4
[12] Debeuf P. - ''Implementation status report on 20 new energy efficient hybrid buses'',
Final Report Civitas- Elan Tren/FP7 TR/ 218954, 24 February 2011, pp.15
[13] Gonzales F. - ''Fuel & Traction Systems Observatory Hybrids'', 89th UITP Bus
Committee, Luxemburg, 14 October 2010, pp.8
[14] Koninendik T. - ''RET-Rotterdam and sustainable mobility'', 2nd
Workshop Hybrid user
forum, Dordrecht and Rotterdam, 31 May 2012, pp.17

Volume 40, Number 1, 2014
FE MODEL OF A MISSING BOLTED JOINTS INFLUENCE ON A
GUARDRAIL RESTRAIN SYSTEM DURING IMPACT
Nikola Avramov1, teaching assistant, Petar Simonovski, PhD, proffessor
UDC: 62.78;608.4
ABSTRACT: The increase in traffic safety and the design of safer roads includes
installation of guardrail systems on separate road segments as part of the highway
infrastructure for withholding the vehicle back on the road. In cases when there are no
authorities to monitor the highway infrastructure or the EU regulations are taken as a
recommendation but no obligation, situation like the bad restrain systems installation can
occur. One example of not proper installation of the guardrails is misaligning the bolt holes
for the fastener connection between the segments usually resulting in removing them. The
aim of this study is to examine the influence of missing fastener sets between the guardrail
segments. For model initial input and its validation parameters data from real-life accident
were taken. This accident was fatal for the passenger’s life.
KEY WORDS: accident severity, bolted joints, finite element method, guardrail
segments
FE MODEL ZA ANALIZU UTICAJA MEDOSTATALA ELEMENATE
VEZE NA SIGURNOSNE OGRADE TOKOM SUDARA
REZIME: Porast broјa saobraćajnih nezgoda i projektovanje bezbednih puteva obuhvata
postavljanje sistema odbojnika pored saobraćajnica, kao deo putne infrastrukture koja ima
zadatak da vozilo vrati u saobraćajnu traku. U slučajevima kada nadležni ne prate
postavljanje infrastrukture na auto-putevima ili se EU regulativa shvata kao preporuka a ne
obaveza, situacija sa neadekvatnim postavljanjem zaštitnih sistema može da se dogodi.
Jedan primer je neodgovarajuće postavljanje sigurnosne ograde zbog nesaosnog vezivanja
segmenata, što često dovodi do razdvajanja i uklanjanja segmenata. Cilj ovog rada je
ispitivanje uticaja uklanjanja elemenata veze između segmenata zaštitne ograde. Kao ulazni
parametri i parametri na osnovu kojih je izvršena validacija modela korišćeni su podaci
dobijeni u relanim nezgodama, koje su imale smrtni ishod.
KLJUČNE REČI: jačina nezgode, vijčani spojevi, metoda konačnih elemenata, segmenti
sigurnosnih ograda
1 Nikola Avramov, Faculty of Mechanical Engineering, Skopje, Macedonia, Karpos 2 bb,

Intentionally blank

Volume 39, Number 4, 2013
FE MODEL OF A MISSING BOLTED JOINTS INFLUENCE ON A
GUARDRAIL RESTRAIN SYSTEM DURING IMPACT
Nikola Avramov1, teaching assistant, Petar Simonovski, PhD, proffessor
UDC:62.78;608.4
1. INTRODUCTION
The most common road vehicles restrain systems that are used on the roads are W-
beam, bridge parapets, concrete barriers, etc. and they differ by their ability to retain
different types of vehicle out runs. Single sided W-beam guardrail segments with metal
posts compressed in the ground is the most frequent type of guardrail found on the
highways. The existing European normative EN1317:1998 is the framework for the
guardrail design. Trough different parameters thresholds among which the most important
are ASI (acceleration severity index) and PHD (post impact head deceleration) the vehicle
impact severity level is approached [1][2]. The regulative is determining for example both
the maximum deceleration in the passenger compartment considering the vehicle and the
maximum guardrail deflection for specific type of impact, given in the test matrix. If all of
the parameters are within the prescribed range and if other obligations are fulfilled like the
vehicle motion after the impact should be in the specified exit box boundaries, nothing is
allowed to penetrate in the passenger compartment and no part of the guardrail system
should be separated from it becoming danger for the other road users. Or the guardrails are
designed to absorb the energy coming from the vehicle motion safely lowering the velocity
through desired vehicle path.
The road restrain systems installation on different highway sections depends on the
vehicle frequency, most common types of vehicles driving on that road, maximum permitted
velocity, coming turns etc. The highway inspection authorities considering these facts will
decide about the minimum containment level that the restrain system has to fulfill.
According to the regulations the guardrail should comply with the criteria for the defined
containment level. In reality the impact parameters can vary significantly but proper
standard implementation means maximum safety for all crash scenarios.
The importance of the guardrail protection comes from the fact that in most of the
countries the restrain systems normative is accepted as regulation. The stated is confirmed
with the following extracts of different EU-countries regulations.
Finland (Finnish Transport Agency) - „Barriers bearing the CE mark and
complying with standard SFS-EN 1317-5 are used on roads if they satisfy the requirements
set out in this guide. “
Germany (Forschungsgesellschaft für Straßen- und Verkehrswesen) - „Vehicle
restraint systems must meet the requirements of DIN EN 1317 - Restraint systems on roads.
The compliance with the requirements must be verified by presenting the relevant test
reports.“
1 Nikola Avramov, Faculty of Mechanical Engineering, Skopje, Macedonia, Karpos 2 bb,

Nikola Avramov, Petar Simonovski
Volume 40, Number 1, 2014
36
Norway (The Directorate of Public Roads) - „…it has been harmonized with the
common European guidelines for testing and approval of vehicle restraint systems - NS EN
1317, which was prepared under the auspices of CEN and set by Norwegian Standard.“
United Kingdom (The Highways Agency) - „This Standard describes the
procedures to be followed by the various parties involved in the design and provision of
various types of Road Restraint Systems.“
2. FE MODELS
2.1. Vehicle model
For FEM vehicle model the Ford Taurus (model year 2001) is chosen because its
closeness to the European mid-sized vehicle fleet [3]. The model was developed for general
purposes so it needed some modifications to address certain deficiencies in the vehicle to
barrier simulations. The model had to undergo some modifications for lowering the
simulation time and bringing the response closer to the realistic.
removing parts of less importance for the vehicle behavior.
adding element mass adequate to the removed parts mass. The element mass was
added at the B-pillars because of the position of the centre of gravity at the mid plane
between the B-pillars trough the vehicle width.
fixing the free turning of the wheel with the first contact to the guardrail and
consequently the change of the load path. During the research phase it was seen from the
crash test videos that the wheel experience slight inclination after the engagement during the
oblique collision.
mass was added to the accelerometers to damp the oscillation amplitude of high
frequency noise and getting more stable results.
Figure 1. Simplified vehicle geometry model
2.2. Guardrail model
The guardrail consists of twelve segments or rails and thirteen support posts compressed
in the ground. For the rails connection eight pairs of fastener sets are used, and for the rail to
post connection one pair of fastener is used. For a more accurate representation the guardrail
model had to undertake some adjustments like:

FE model of a missing bolted joints influence on a guardrail restrain system during impact
Volume 40, Number 1, 2014
37
the bolt to nut connection is modeled by using beam connection, specifying the
beam stiffness, cross-section area and the mass density. This type of connection gives us the
possibility of defining the pre-load force as initial force acting in the beam direction joining
the segments together and is used as more direct approach instead of already known
methods of temperature difference or initial strain method. The joining components, bolt and
nut are modeled with their standard dimensions except modeling the threads which was found in
the literature as non-essential factor affecting the results [4]. They are tied together with linear
beam between connecting nodes, first as the centre node of spider rigid body elements around the
circumference at the end of the bolt head and the second one as the centre node of spider rigid
body elements around the hole at the beginning of the nut (Fig.2).
the soil is modeled as a solid cylinder meshed with hexagonal elements, with a
centre hole trimmed with the projection nodes of the post.
the contact on separate segments is defined trough the static and dynamic
coefficient of friction, one between the guardrails segments, other between the post and the
ground and the last between the vehicle and the guardrail elements.
guardrail end elements are connected by dampers to rigid constrains. Dampers are
used because they have the possibility to absorb energy, corresponding to the deformation of
the adjacent rails. For adequate representation the “length of need” according to NCHRP
350 as a general rule should not be less than 30m for a flexible barrier, and in this case is
48,3m [5].
local weakening around the fastener holes. From the crash analysis was
concluded that the bolt head is pulled out of the guardrail segment. These local deformations
are reached in the model by defining lower Young’s elastic modulus for the elements around
the holes that will enable the fastener unbuckle (Fig.2).
3. MODEL VERIFICATION
One of the possible arrangements of improper guardrail installation is shown on
Fig.3. The numerical FE model verification will be done trough comparison by visual
inspection of the guardrail elements involved in a real crash accident with the appropriate
virtual model.
Real crash tests only are used as verification tools accompanied by measurements
and videos for the specific case. The scene investigation provided information about the
deformation modes of the guardrail components and some relevant measurements for the
verification are the holes openings, segments final displacement and magnitude of the posts
bending.
The initial impact parameters were gathered from the police reports. The vehicle
closing speed was 141 km/h, angle of impact 8 degrees and vehicle weight including the
driver was approximately 1710kg.
Nikola Avramov, Petar Simonovski
Volume 40, Number 1, 2014
38
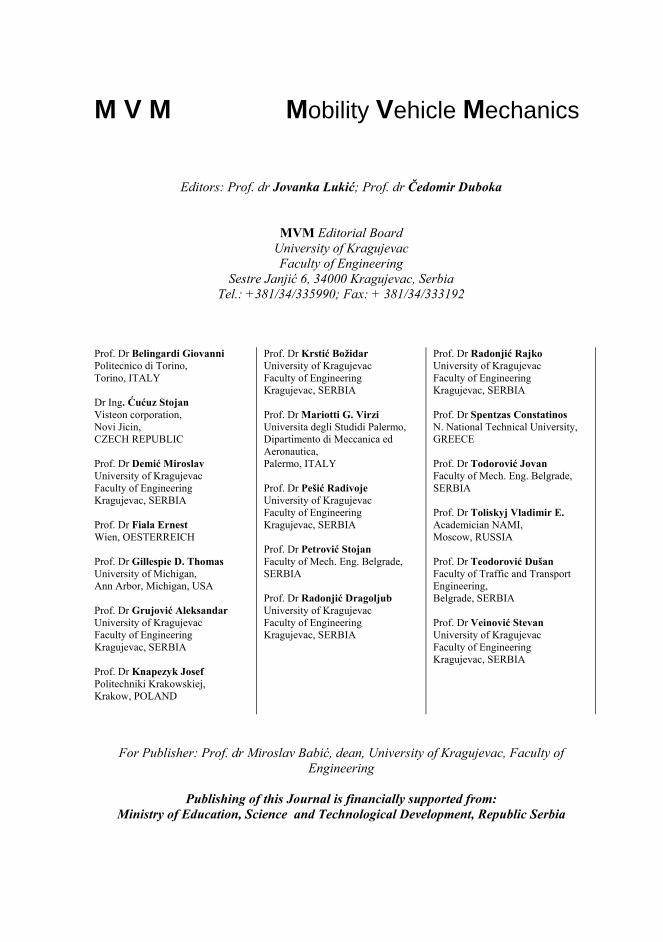
6
Figure 2. Fastener sets connecting elements and weakened areas
Figure 3. Real and FE missing fastener set model
Figure 4. Real and FE segment deformation mode

FE model of a missing bolted joints influence on a guardrail restrain system during impact
Volume 40, Number 1, 2014
39
Figure 5. Real and FE accident severity
From visual observation, part of it presented on the pictures above (Fig.4 and Fig.5),
can be seen the close behavior of the guardrail FE model and the scenes from the real-life
accident. The first picture shows the fastener hole widening as a result of local
deformations, clearly seen on the photograph taken at the place of the accident. As the
impact progresses the segments are being subjected to complex deformation modes, both
bending and shear, causing bolted joints pulling through the deformed holes [6]. On the
second picture the segment separation on the place of the vehicle run off can be seen. Two
of the segments have been carried away by the vehicle and were found several meters away
from the place of impact.
As noted before some of the segments were connected with less than the needed eight
fastener sets. At the point of impact the segments were connected with seven or fasteners
number 1,2,3,5,6,7 and 8 as marked on Fig.2 and the adjacent segments were connected
with only four fasteners 1,2,5 and 6, which can be seen by the hole imprints on Fig.4. The
result and the consequences of this badly installed guardrail are enormous and can be noted
as a fact that there was nearly no absorption of the guardrail segments or the vehicle just
passed through and ran off the road.
4. RESULTS AND DISCUSSION
For analyzing the missing bolted joints influence on a guardrail segment separation,
fasteners for segment to segment connection have been removed. At first the outer (ones
farther away from the post connection, bolts number 1,2,7 and 8) and afterwards the inner
(ones closer to the post, bolts number 3,4,5 and 6). Both are compared with the real accident
outcome.
For grading guardrails performance parameters from European normative [1,2] are used.
Acceleration severity index (ASI)
This parameter measures the severity of the vehicle motion over a person seated in the
proximity of a chosen point during an impact.
222
az
az
ay
ay
ax
axtASI , (1)

Nikola Avramov, Petar Simonovski
Volume 40, Number 1, 2014
40
where
ax ,
ay ,
az are the threshold values of a human body accelerations (for
passengers using safety belts ax = 12g, ay = 9g, az = 10g) and ax , ay , az are the
accelerations of a driver seating point, averaged over a time interval of 50ms.
Table 1. Acceleration severity index
accident with outer with inner
ASI [/] 1.4052 1.5498 1.3711
Post Impact Head Deceleration (PHD)
This is the maximum value of an averaged longitudinal and transversal component
accelerations of a vehicle centre of gravity computed over 10ms. It is assumed that the head
remains in contact with the vehicle after the impact for the rest of the time period.
2
,,2
,,
max
CC yxPHD
Table 2. Post impact head deceleration
accident with outer with inner
PHD [g] 16.8285 18.5612 16.4201
Figure 6. Vehicle and guardrail deformation modes at time 0.28 [s]

FE model of a missing bolted joints influence on a guardrail restrain system during impact
Volume 40, Number 1, 2014
41
Figure 7. Centre of gravity acceleration
The diagram on Fig.7 presented above shows the vehicle centre of gravity acceleration
curve. Some of the impact characteristic tracing points are described. At the beginning of
the crash the acceleration impulse follows same trend which is expected till more of the
structures interact. The first contact of the vehicle to guardrail starts at 0.01s. At 0.05s the
vehicle wheel comes into contact with the guardrail post but no wheel snagging occurs
because the wheel slides outside the post. The second vehicle to post interaction occurs at
0.15s when the direct impact separates the post from the guardrail. At the time of 0.28s the
guardrail deforms so that it gets the vehicle front shape and together with the coming post
holds back the vehicle (Fig.6). The last acceleration peak happens at 0.45s and this is the
time when the third post directly subjected to the impact breaks the connection with the
rails. For the rest of the time duration the guardrail segments separate and the accelerations
are getting lower.
From the presented tables of ASI and PHD the highest values are for the case of
segments connected with only outer fasteners, following the one for the real accident and the
last is with only inner fastener case. This corresponds to the acceleration peaks occurring at
the same order as stated but for different time moment.
5. CONCLUSION
Properly modeled and verified model can be adequate replacement of the actual crash
tests. The models have to address certain modifications for bringing the response closer for
the corresponding test. The state of the art achievements in this paper are in the direction of
general improvements of the FEM models in the virtual impact testing and the influence of
the missing fastener in the guardrail installation during impact.
The vehicle to guardrail model used can be appropriate representative considering the
above stated modifications. Some of the adjustments made are: parts of less importance of
the model can be removed with no influence to the response and replaced with element
mass, like the back parts of the vehicle in the front impact tests, and being aware of not re-
positioning the vehicle centre of gravity; there is no driver’s response to the steering wheel

Nikola Avramov, Petar Simonovski
Volume 40, Number 1, 2014
42
and the vehicle front wheels are turning freely resulting in changing the driving path, the
adjustments are in fixing the turning of the wheel; damping the oscillations by adding mass
to the accelerometers that are modeled as a solid rigid cubes with its edges defining local
coordinate system and measuring the origin acceleration.
The advantages of virtual testing methods are used for finding the influence of the
missing guardrail bolted joints stimulated from real crash accident. The conclusions
regarding the fasteners are the following. Missing inner bolted joints is much severe than
missing the outer ones. The difference in acceleration severity index between both is about
11.5%. For impacts in guardrail restrains with only outer fastener sets between the rails,
from the post impact head deceleration can be assumed that the human head is for almost
2g’s higher deceleration subjected to.
6. REFERENCES
[1] European Standard EN 1317-1. (1998). Road restrain systems-Part 1: Terminology and
general criteria for test methods. European Committee for Standardization.
[2] European Standard EN 1317-2. (1998). Road restrain systems-Part 2: Performance
classes, impact test acceptance criteria and test methods for safety barriers. European
Committee for Standardization.
[3] National Crash Analysis Centre NCAC (1993).
http://www.ncac.gwu.edu/vml/models.html. The George Washington University.
Washington D.C.
[4] Montgomery J. (2002). Methods for modeling bolts in the bolted joints. ANSYS User’s
Conference.
[5] National Cooperative Highway Research Programme NCHRP Report 350. (1993).
Recommended Procedures for the Safety Performance Evaluation of Highway Features.
Transportation Research Board. Washington D.C.
[6] Rogers A. Colin; Hancock J. Gregory. (1998). Failure Modes of Bolted Sheet Steel
Connections Loaded in Shear. The University of Sydney, Department of Civil
Engineering. Sydney, Australia.

Volume 40, Number 1, 2014
THE ANALYSIS OF SUBFRAME INFLUENCE ON CAR BODY
BEHAVIOUR
1Milan Milovanović, Miroslav Demić, Saša Jovanović,
UDC:621.9-112.3
ABSTRACT: The development of the carrying construction of one producer is an endless
process. In addition to the analysis of carrying construction behaviour, it is necessary to take
into account the influence of additionally installed drive units onto the carrying construction
behaviour. In this paper, the influence of subframe on carrying construction behaviour, is
shown. With the aim of presenting the results, behaviour of carrying construction in
conditions of quasi-static test has been shown, as well as in conditions of simulation of
front impact test.
KEYWORDS: car body, behaviour, influence.
ANALIZA UTICAJA POLUŠASIJE NA PONAŠANJE KAROSERIJE
UDC:621.9-112.3
Rezime
za d g p đ č b an proces. Pored analize
p š p d b naknadno postavljenih
p g d p š . U ovom radu prikazan je uticaj
p l š na p š . U cilju pr l ž
l ž l m kvazi - č g ispitivanja, kao i uslovima
simulacije uslova testa prednjeg č g d .
KEIVORDS: p š .
1 Received August 2012, Accepted September 2012

Intentionally blank

Volume 40, Number 1, 2014
THE ANALYSIS OF SUBFRAME INFLUENCE ON CAR BODY BEHAVIOUR
Milan Milovanović1, PhD, Miroslav Demić, PhD, professor, Saša Jovanović, MSc
UDC:621.9-112.3
INTRODUCTION The level of success of the construction is the reflection of the design period, as shown in Figure
1, where the carrying construction of vehicle Zastava Yugo, designed in the 70-ties of the last
century, is presented. The carrying construction was similar to the carrying construction of other
FIAT models, with the frontal frame construction considerably influenced by the construction of
the front vehicle suspension system. The functions of the front suspension system of the vehicle
did not include the stiffening of the frontal frame. The designed directions of car body
deformation are specific due to the characteristic position of front longitudinal supports, which
direct deformation considerably towards longitudinal roof supports, and less towards car floor.
There was no connection with the car floor elements on the frontal part, which was unfavourable
from the aspect of carrying construction loading.
Figure 1 Vehicle Yugo - car body
Car body of vehicle Zastava10 is a car body of modern concept, with car body shown in Figure
2. Frontal frame was strengthened considerably; together with front vehicle suspension system,
it makes a set which is of great importance for car body behaviour at front impact. The installed
subframe the frontal frame. Front longitudinal supports, which direct deformation towards car
floor, are also important. With the purpose of satisfying side impact conditions, side shell frame,
with prominent pillar B and lateral longitudinal supports of floor, was strengthened
considerably. Side door frame was strengthened additionally.
1 Milan Milovanović, Zastava vehicles group, Kosovska 4, 34000 Kragujevac, SERBIA,
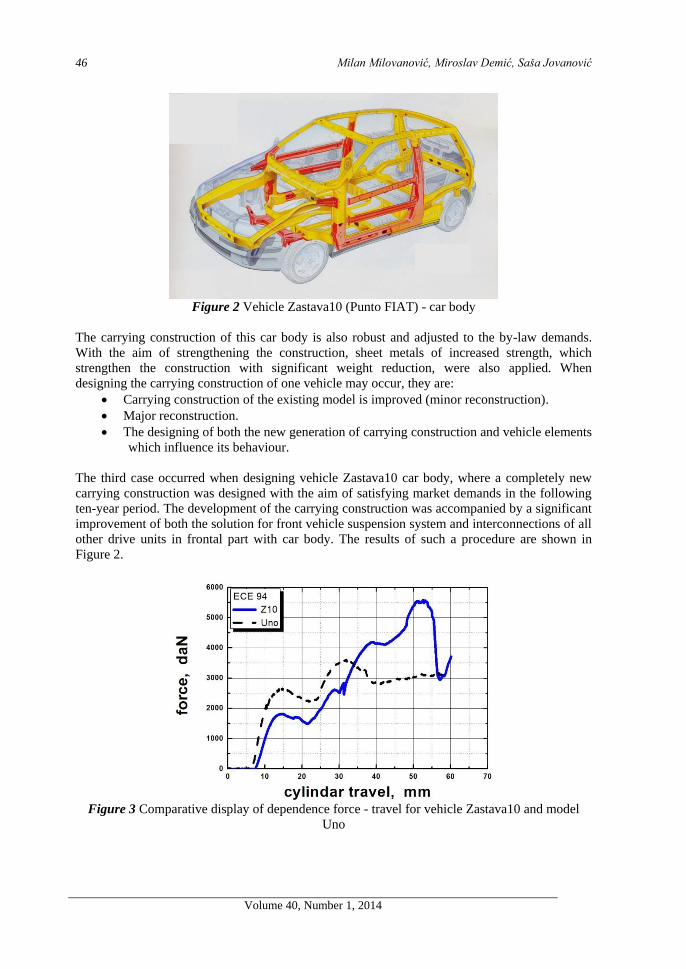
Milan Milovanović, Miroslav Demić, Saša Jovanović
Volume 40, Number 1, 2014
46
Figure 2 Vehicle Zastava10 (Punto FIAT) - car body
The carrying construction of this car body is also robust and adjusted to the by-law demands.
With the aim of strengthening the construction, sheet metals of increased strength, which
strengthen the construction with significant weight reduction, were also applied. When
designing the carrying construction of one vehicle may occur, they are:
Carrying construction of the existing model is improved (minor reconstruction).
Major reconstruction.
The designing of both the new generation of carrying construction and vehicle elements
which influence its behaviour.
The third case occurred when designing vehicle Zastava10 car body, where a completely new
carrying construction was designed with the aim of satisfying market demands in the following
ten-year period. The development of the carrying construction was accompanied by a significant
improvement of both the solution for front vehicle suspension system and interconnections of all
other drive units in frontal part with car body. The results of such a procedure are shown in
Figure 2.
Figure 3 Comparative display of dependence force - travel for vehicle Zastava10 and model
Uno

The analysis of subframe influence on car body behaviour
Volume 40, Number 1, 2014
47
Figure 4 Comparative display of effect of car body improvement
Improvement of one model of any producer inevitably leads to improvement of vehicle
construction. For the behaviour of the older vehicle car body (car body of vehicle Uno), it is
typical that large deformations first appear on the connection of front longitudinal supports and
partition wall, then the deformations occur on side shell frame, and finally the construction
collapse occurs /3/. In this way, with directed collapse point, the desired objective is
accomplished. In new vehicle model car body, considerably higher level of force is achieved,
and the behaviour of car body is significantly improved. Deformations of the carrying
construction in the front part are insignificant and also directed regarding point and direction.
Side shell frame is slightly deformed, i.e. passenger space deformation is minimal, see Figure 6
and 7. Regardless of stricter investigation conditions, increase of force achieved for car body of
vehicle Z10 compared with car body of vehicle Uno is significant, which indicates that great
efforts were invested in order to accomplish such a result, see Figure 3.
The following model which was developed in Zastava was vehicle Yugo, which maintained
many elements of vehicle Z101/128 (carrying constriction type, front vehicle suspension system,
drive unit suspension etc.). FIgure 4 shows the comparative display of obtained improvement of
vehicle Yugo behaviour. Critical point in car body behaviour can be observed, which can also be
the consequence of the welding quality. In vehicles Z101 and Z128, since the front part is the
same, almost identical accomplished force was obtained. Model Yugo exceeded the previous
model significantly, which was expected as it was the new model. However, the realized
difference was limited by the similar front vehicle suspension system, i.e. realized carrying
construction, which was adjusted to this system.

Milan Milovanović, Miroslav Demić, Saša Jovanović
Volume 40, Number 1, 2014
48
Figure 5 Improvement on vehicle Florida car body
When developing vehicle Zastava Florida (90-ties of the last century), the opportunity was not
taken to change the construction of front system for vehicle suspension, the consequence of
which would be the change of carrying construction in the front part. Figure 5 shows the
accomplished improved level of car body behaviour, which was not sufficient to satisfy by-law
ECE 94. I Maintenance of the same construction of front vehicle suspension system also had a
lot of influence on vehicle Florida car body.
Figure 6 Display of installed drive units
ANALYSIS OF SUBFRAME INFLUENCE ON CAR BODY
BEHAVIOUR
The developed method was focussed on obtaining data on car body behaviour at impact test. The
concept of monitoring the behaviour of car body itself, regardless of the influence of
additionally installed car body parts, i.e. influence of drive units installed on the vehicle, was
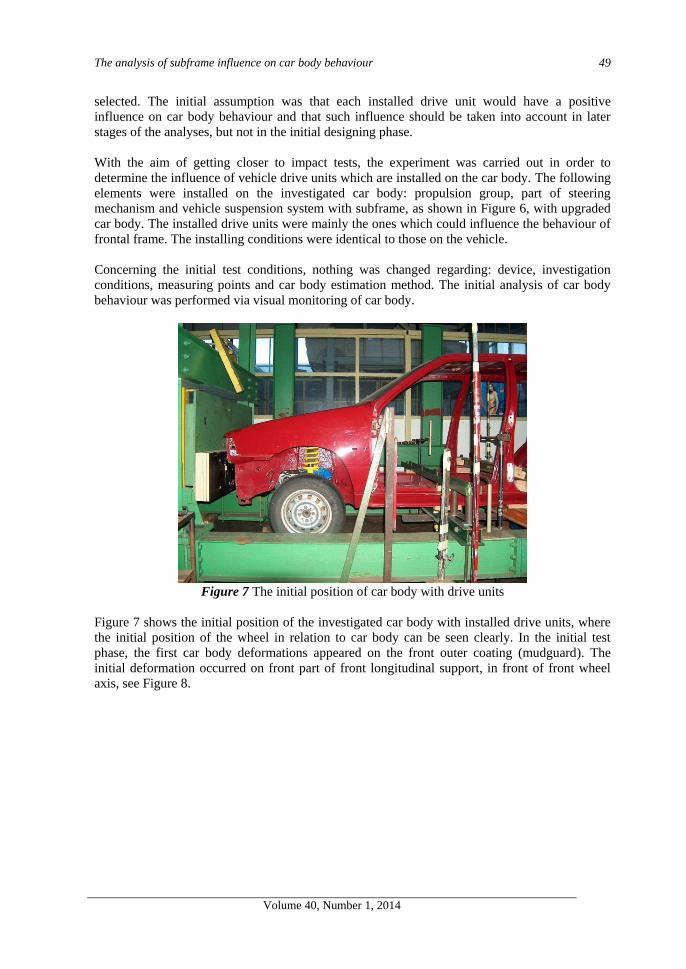
The analysis of subframe influence on car body behaviour
Volume 40, Number 1, 2014
49
selected. The initial assumption was that each installed drive unit would have a positive
influence on car body behaviour and that such influence should be taken into account in later
stages of the analyses, but not in the initial designing phase.
With the aim of getting closer to impact tests, the experiment was carried out in order to
determine the influence of vehicle drive units which are installed on the car body. The following
elements were installed on the investigated car body: propulsion group, part of steering
mechanism and vehicle suspension system with subframe, as shown in Figure 6, with upgraded
car body. The installed drive units were mainly the ones which could influence the behaviour of
frontal frame. The installing conditions were identical to those on the vehicle.
Concerning the initial test conditions, nothing was changed regarding: device, investigation
conditions, measuring points and car body estimation method. The initial analysis of car body
behaviour was performed via visual monitoring of car body.
Figure 7 The initial position of car body with drive units
Figure 7 shows the initial position of the investigated car body with installed drive units, where
the initial position of the wheel in relation to car body can be seen clearly. In the initial test
phase, the first car body deformations appeared on the front outer coating (mudguard). The
initial deformation occurred on front part of front longitudinal support, in front of front wheel
axis, see Figure 8.

Milan Milovanović, Miroslav Demić, Saša Jovanović
Volume 40, Number 1, 2014
50
Figure 8 The first inter- phase
Figure 9 shows the following inter- phase. The increased deformations of side door opening
caused the windshields glass to start falling out. The deformation on front left longitudinal
support was still increasing. The final position of the deformed car body is shown in Figure 10.
In the given case, the extreme deformations occurred in the front part and at side door opening.
Figure 9 The second inter- phase

The analysis of subframe influence on car body behaviour
Volume 40, Number 1, 2014
51
Figure 10 The final position
Major deformations also occurred on car body with installed drive units, with subframe, on front
part of front longitudinal supports, figure 11, which was the consequence of the influence of
subframe which had stiffened the front frame in the partition wall zone. Intensive deformation
occurred at side door opening and windshield glass opening. Character of front frame
deformation was considerably changed.
Figure 11 Appearance of front frame

Milan Milovanović, Miroslav Demić, Saša Jovanović
Volume 40, Number 1, 2014
52
Figure 12 Front inner mudguard after the test
Figure 13 Partition wall after the test
Figure 11, 12 and 13 show the front part of vehicle Florida car body, on which the drive units
were installed, after the quasi - static test. Here, as well, major deformation of car body was
obtained on the left side, but it was significantly smaller than on the ″bare″ car body.
Redistribution of load and increased deformations of front left longitudinal support occurred in
front part. The installed drive units caused the significant changes of character of critical zones
deformations. In case of this test, as well, critical zones, similar to those in investigations of car
body without drive units, were located.

The analysis of subframe influence on car body behaviour
Volume 40, Number 1, 2014
53
Figure 14 Force - travel dependence of cylinder on "bare" car body
Figure 15 Influence of installed drive units - standard vehicle version

Milan Milovanović, Miroslav Demić, Saša Jovanović
Volume 40, Number 1, 2014
54
Figure 16 Influence of installed drive units – with subframe
Figure 17 Comparative display of the influence of installed drive units
As expected, the installed serial drive units influenced the behaviour of car body, which was
manifested by increased force at construction fracture. The first critical zone was less prominent,
which was probably the consequence of contact between the wheel and car body.
As expected, the installed drive units with subframe influenced the behaviour of car body, which
was manifested by increased force at construction fracture. The first critical zone was more
prominent, which was probably the consequence of the lack of contact between the wheel and
car body.

The analysis of subframe influence on car body behaviour
Volume 40, Number 1, 2014
55
On serially installed drive units, deformation of front part towards partition wall occurs; its
character, however, becomes significantly improved after the contact of wheel and gearbox with
the car body. In the case of subframe, after the deformation of front longitudinal supports, the
influence of subframe, visible at the end of the test, occurs. Car body deformation character has
been considerably changed.
CONCLUSIONS
The development and introduction of new solutions in car industry is a necessity. The presented
results indicate the influence of installed drive units which must be taken into account when
making calculations and in the initial project phase.
REFERENCES
[1] Milovanović M.: KAROSERIJA PUTNIČKOG AUTOMOBILA, monografija, Institut za
automobile, Kragujevac, 2000.,
[2] Milovanović M.: KVAZI-STATIČKA ISPITIVANJA KAROSERIJE PUTNIČKOG
AUTOMOBILA, monografija, Institut za automobile, Kragujevac, 2003.,
[3] Milovanović M., Jovanović S., Popović M.: ANALYSIS OF CAR BODY BEHAVIOUR
IN CONDITIONS OF LARGE DEFORMATIONS, trans&MOTAUTO '10, Ruse, July
2010.,
[4] Milovanović M., Demić M., Časnji F.: THE ANALYSIS OF INFLUENCE ON CAR
BODY BEHAVIOUR, trans&MOTAUTO '11, Varna, July 2011..


MVM Editorial Board University of Kragujevac Faculty of Engineering
Sestre Janjić 6, 34000 Kragujevac, Serbia Tel.: +381/34/335990; Fax: + 381/34/333192
www.mvm.fink.rs