M C W D V , MTC M 20, 2017 MTC ABAG BAAQMD BCDC FINDINGS –MARIN COUNTY While growth in the Bay...
34
MTC BAAQMD BCDC ABAG M ARIN C OUNTY W ORKSHOP D AVID V AUTIN , MTC – M AY 20, 2017 Source: https://www.flickr.com/photos/pepemichelle/33855582715/
Transcript of M C W D V , MTC M 20, 2017 MTC ABAG BAAQMD BCDC FINDINGS –MARIN COUNTY While growth in the Bay...

MTC BAAQMD BCDCABAG
MARIN COUNTY WORKSHOP
DAVID VAUTIN, MTC – MAY 20, 2017
Source: https://www.flickr.com/photos/pepemichelle/33855582715/

WHAT IS VITAL SIGNS?
Vital Signs tracks 40 performance indicators to understand if the Bay Area is (or is not) making progress towards key regional goals.
2

WHAT IS VITAL SIGNS?
The interactive Vital Signs website allows residents to explore trends on the regional, county, city, and even neighborhood levels.
vitalsigns.mtc.ca.gov3

WHAT IS VITAL SIGNS?
The interactive Vital Signs website allows residents to explore trends on the regional, county, city, and even neighborhood levels.
vitalsigns.mtc.ca.gov4

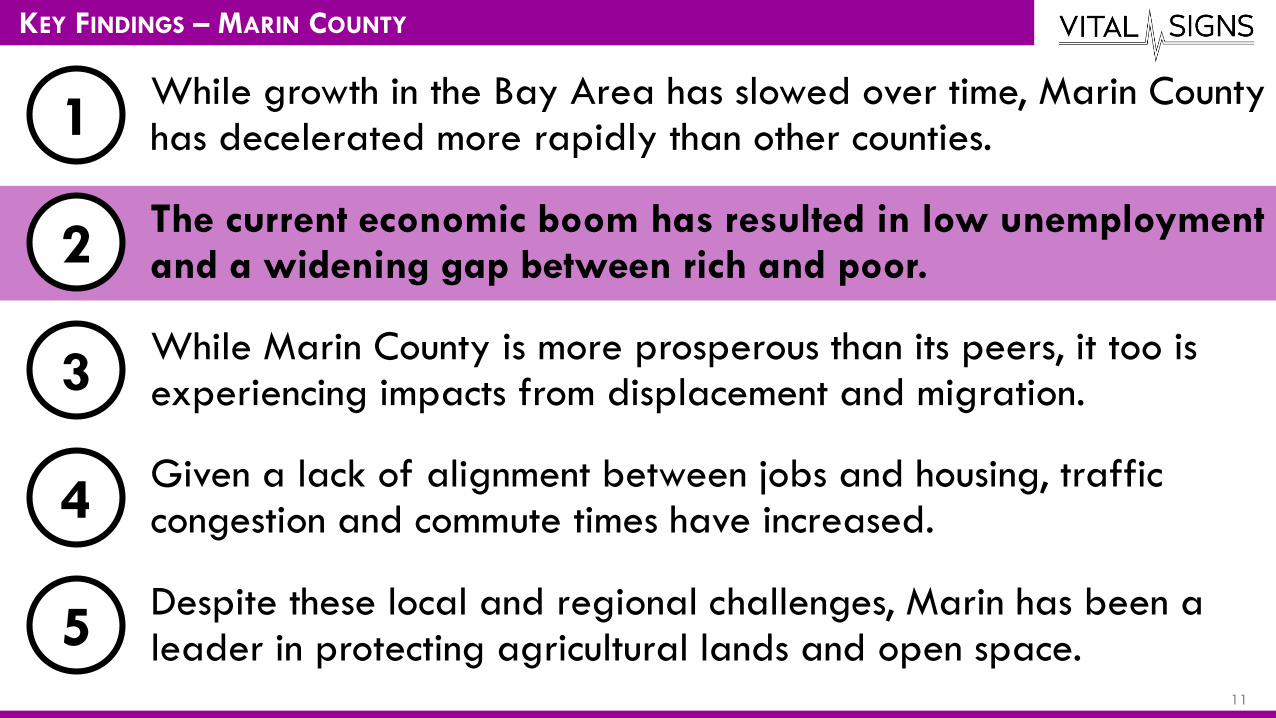
KEY FINDINGS – MARIN COUNTY
While growth in the Bay Area has slowed over time, Marin County has decelerated more rapidly than other counties.1
2
3
4
5
The current economic boom has resulted in low unemployment and a widening gap between rich and poor.
While Marin County is more prosperous than its peers, it too is experiencing impacts from displacement and migration.
Given a lack of alignment between jobs and housing, traffic congestion and commute times have increased.
Despite these local and regional challenges, Marin has been a leader in protecting agricultural lands and open space.
5
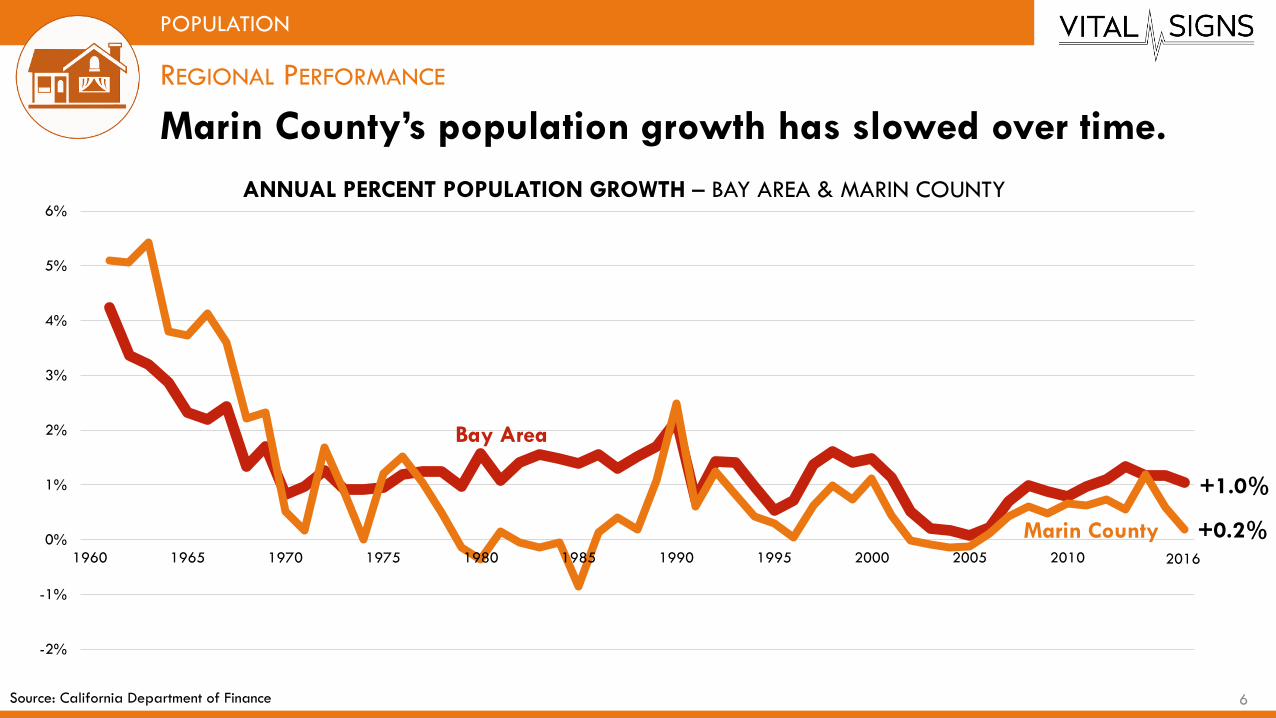
Marin County’s population growth has slowed over time.
-2%
-1%
0%
1%
2%
3%
4%
5%
6%
1960 1965 1970 1975 1980 1985 1990 1995 2000 2005 2010 2015
ANNUAL PERCENT POPULATION GROWTH – BAY AREA & MARIN COUNTY
2016
REGIONAL PERFORMANCE
POPULATION
+1.0%
Source: California Department of Finance
+0.2%
Bay Area
Marin County
6

Marin County’s job growth has slowed in recent years.
-8%
-6%
-4%
-2%
0%
2%
4%
6%
1990 1995 2000 2005 2010 2015
ANNUAL PERCENT JOBS GROWTH – BAY AREA & MARIN COUNTY
REGIONAL PERFORMANCE
JOBS
+3.6%
Source: California Department of Finance
Bay Area
Marin County
+1.8%
7

North Bay counties have similar growth trajectories; regional growth has been increasingly concentrated in the core.
LOCAL FOCUS
POPULATION165
147
62
13
(25)
113
423
37 58
32
100
14
20
(37)
30
230
63 9
5
171
147
8 12 4
5
62
203
104
89
160
141
16
13 4
9
55
179
53
69
73 1
04
6 13 32
13
105
21
27
118
74
10
6
61
48
146
18
18
ALAMEDA CONTRA COSTA
MARIN NAPA SAN FRANCISCO
SAN MATEO SANTA CLARA SOLANO SONOMA
NOMINAL CHANGE BY COUNTY (IN THOUSANDS)
1960s 1970s 1980s 1990s 2000s 2010s
Source: California Department of Finance; note: 2010s spans six years between 2010 and 2016 8

Permitting has declined on the regional and county levels.
REGIONAL PERFORMANCE
HOUSING GROWTH
Source: Construction Industry Research Board (1967-2010); California Homebuilding Foundation (2011-2015)
0
10
20
30
40
50
60
70
1967 1973 1979 1985 1991 1997 2003 2009 2015
Thousa
nds
of
Perm
itte
d U
nits
PERMITTED UNITS BY YEAR – BAY AREA
Single-Family Units Multi-Family Units
0
1
2
3
4
5
6
7
1967 1973 1979 1985 1991 1997 2003 2009 2015Thousa
nds
of
Perm
itte
d U
nits
PERMITTED UNITS BY YEAR – MARIN COUNTY
Single-Family Units Multi-Family Units
9
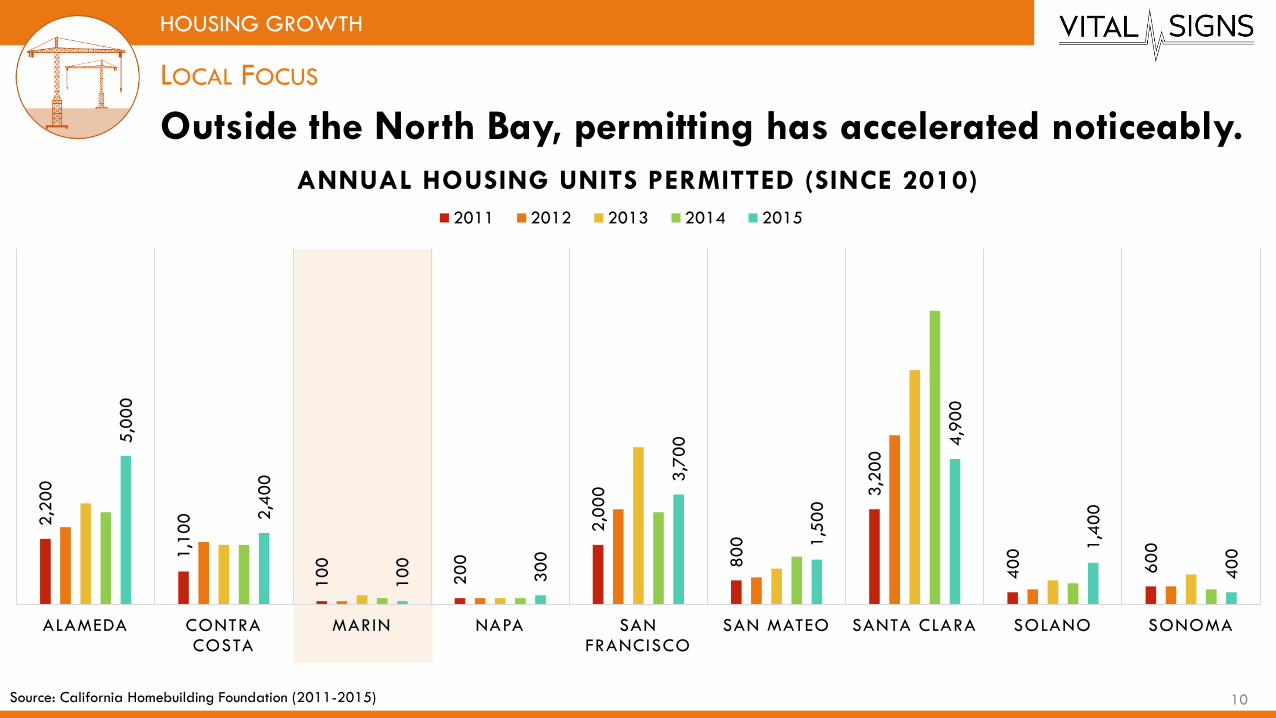
Outside the North Bay, permitting has accelerated noticeably.
LOCAL FOCUS
HOUSING GROWTH
Source: California Homebuilding Foundation (2011-2015)
2,2
00
1,1
00
10
0
20
0
2,0
00
80
0
3,2
00
40
0
60
0
5,0
00
2,4
00
10
0
30
0
3,7
00
1,5
00
4,9
00
1,4
00
40
0
ALAMEDA CONTRA COSTA
MARIN NAPA SAN FRANCISCO
SAN MATEO SANTA CLARA SOLANO SONOMA
ANNUAL HOUSING UNITS PERMITTED (SINCE 2010)
2011 2012 2013 2014 2015
10
KEY FINDINGS – MARIN COUNTY
While growth in the Bay Area has slowed over time, Marin County has decelerated more rapidly than other counties.1
2
3
4
5
The current economic boom has resulted in low unemployment and a widening gap between rich and poor.
While Marin County is more prosperous than its peers, it too is experiencing impacts from displacement and migration.
Given a lack of alignment between jobs and housing, traffic congestion and commute times have increased.
Despite these local and regional challenges, Marin has been a leader in protecting agricultural lands and open space.
11

The Bay Area economy is growing rapidly – especially in the San Francisco and San Jose MSAs.
$0
$100
$200
$300
$400
$500
$600
$700
$800
2001 2002 2003 2004 2005 2006 2007 2008 2009 2010 2011 2012 2013 2014 2015
GRP (in
bill
ions
of
2015 d
olla
rs)
GROSS REGIONAL PRODUCT BY SUB-REGION
LOCAL FOCUS
ECONOMIC OUTPUT
Source: Bureau of Economic Analysis (inflation-adjusted to 2015 dollars)
Note: GRP is reported at the MSA level; the San Jose MSA include Santa Clara County and San Benito County
Napa CountySolano CountySonoma County
San Jose MSA
(2 counties)
San Francisco MSA
(5 counties)
$7$15$22
$133
$331
$9$17$24
$145
$360 $371
$173
$22$17$8
$9$20$26
$235
$432
12

Silicon Valley is booming, widening the gap in per capita GRP between northern and southern parts of the Bay Area.
$0
$20
$40
$60
$80
$100
$120
2001 2002 2003 2004 2005 2006 2007 2008 2009 2010 2011 2012 2013 2014 2015
Per
Capita G
RP (in
tho
usa
nds
of
2015 d
olla
rs)
GROSS REGIONAL PRODUCT PER CAPITA
LOCAL FOCUS
ECONOMIC OUTPUT
Napa County
Solano CountySonoma County
San Jose MSA
San Francisco MSA
Sources: Bureau of Economic Analysis (inflation-adjusted to 2015 dollars); Department of Finance
Note: GRP is reported at the MSA level; the San Jose MSA include Santa Clara County and San Benito County 13
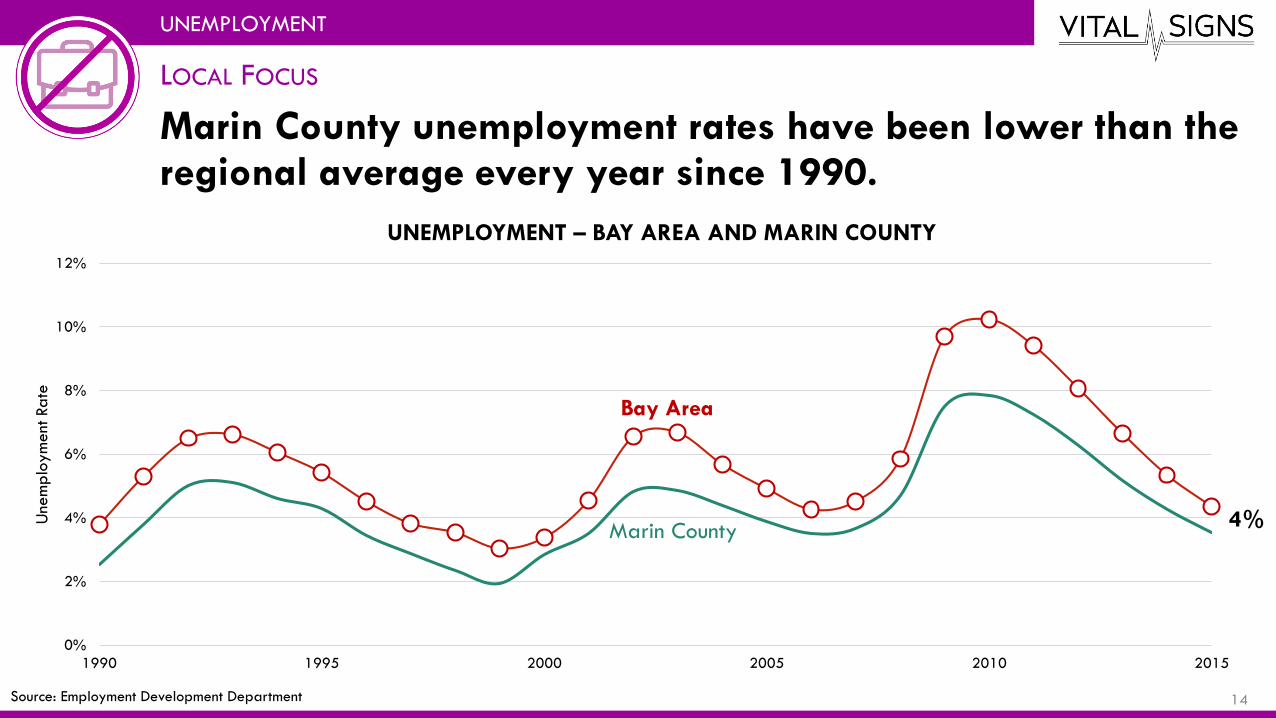
Marin County unemployment rates have been lower than the regional average every year since 1990.
0%
2%
4%
6%
8%
10%
12%
1990 1995 2000 2005 2010 2015
Unem
plo
ym
ent Rate
UNEMPLOYMENT – BAY AREA AND MARIN COUNTY
LOCAL FOCUS
UNEMPLOYMENT
Source: Employment Development Department
Bay Area
Marin County4%
14

Marin County residents have some of the highest incomes in the Bay Area – but many work outside of the county.
$50
$60
$70
$80
$90
$100
$110
$120
1970 1980 1990 2000 2010
Media
n H
ouse
hold
Inc
om
e(in
thous
and
s of
2015 d
olla
rs)
MEDIAN HOUSEHOLD INCOME BY COUNTY
LOCAL FOCUS
INCOME
Santa ClaraSan MateoMarinSan Francisco
Contra CostaAlameda
Napa
SolanoSonoma
Sources: U.S. Census Bureau/American Community Survey (inflation-adjusted to 2015 dollars); Bureau of Labor Statistics 15
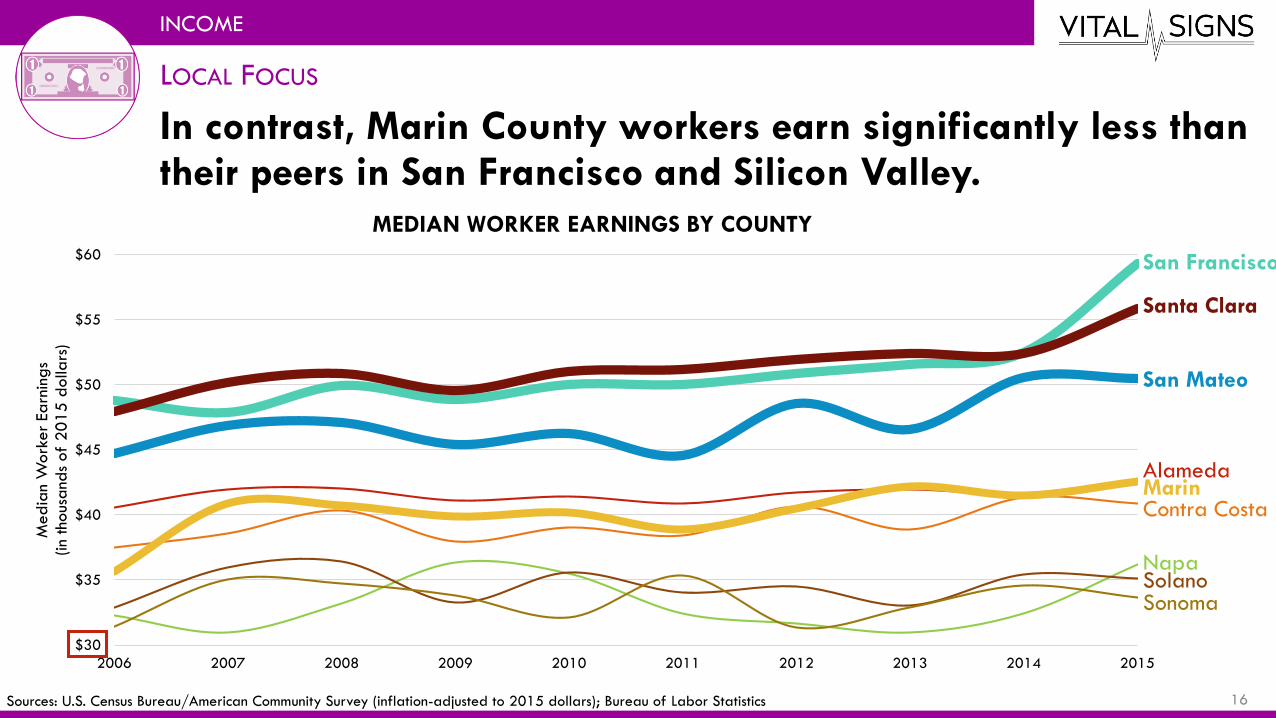
In contrast, Marin County workers earn significantly less than their peers in San Francisco and Silicon Valley.
$30
$35
$40
$45
$50
$55
$60
2006 2007 2008 2009 2010 2011 2012 2013 2014 2015
Media
n W
ork
er
Earn
ings
(in
thous
and
s of
2015 d
olla
rs)
MEDIAN WORKER EARNINGS BY COUNTY
LOCAL FOCUS
INCOME
Santa Clara
San Mateo
Marin
San Francisco
Contra Costa
Alameda
NapaSolanoSonoma
Sources: U.S. Census Bureau/American Community Survey (inflation-adjusted to 2015 dollars); Bureau of Labor Statistics 16

KEY FINDINGS – MARIN COUNTY
While growth in the Bay Area has slowed over time, Marin County has decelerated more rapidly than other counties.1
2
3
4
5
The current economic boom has resulted in low unemployment and a widening gap between rich and poor.
While Marin County is more prosperous than its peers, it too is experiencing impacts from displacement and migration.
Given a lack of alignment between jobs and housing, traffic congestion and commute times have increased.
Despite these local and regional challenges, Marin has been a leader in protecting agricultural lands and open space.
17

In contrast to neighboring North Bay counties, Marin County’s poverty rate is the lowest in the region.
30%28% 28%
25% 25% 24%
21% 21%19%
SOLANO SONOMA NAPA SAN FRANCISCO
ALAMEDA CONTRA COSTA
SANTA CLARA SAN MATEO MARIN
Share
Of
Popul
ation In
Pove
rty (200%
Leve
l)
2015 POVERTY RATE BY COUNTY
LOCAL FOCUS
POVERTY
Source: U.S. Census Bureau/American Community Survey, 2015
Note: poverty is defined as living below twice the national poverty level
Bay Area Regional Poverty Rate – 24%
18

Marin County home prices have risen since the end of the recession but remain below their 2007 peak.
$0
$200
$400
$600
$800
$1,000
$1,200
1997 2000 2003 2006 2009 2012 2015
Media
n H
om
e S
ale
Price
(in
thous
and
s of
2015 d
olla
rs)
MEDIAN HOME SALE PRICE BY COUNTY
LOCAL FOCUS
HOME PRICES
San Francisco
San Mateo
MarinSanta Clara
Alameda
NapaSonomaContra Costa
Solano
Sources: Zillow (inflation-adjusted to 2015 dollars); Bureau of Labor Statistics 19
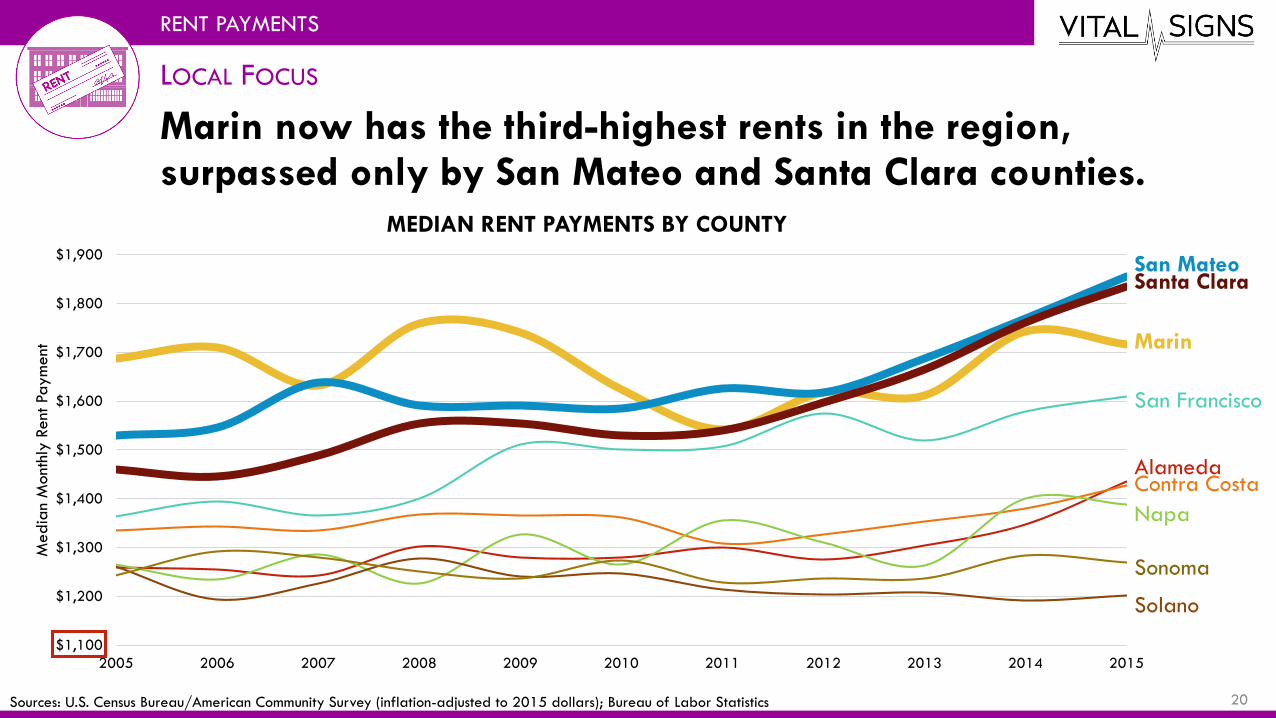
Marin now has the third-highest rents in the region, surpassed only by San Mateo and Santa Clara counties.
$1,100
$1,200
$1,300
$1,400
$1,500
$1,600
$1,700
$1,800
$1,900
2005 2006 2007 2008 2009 2010 2011 2012 2013 2014 2015
Media
n M
onth
ly R
ent Paym
ent
MEDIAN RENT PAYMENTS BY COUNTY
LOCAL FOCUS
RENT PAYMENTS
San MateoSanta Clara
Marin
San Francisco
AlamedaContra Costa
Napa
Sonoma
Solano
Sources: U.S. Census Bureau/American Community Survey (inflation-adjusted to 2015 dollars); Bureau of Labor Statistics 20

Marin County’s housing affordability – as a share of income – has closely tracked regional trends since 1980.
0%
10%
20%
30%
40%
50%
60%
70%
80%
90%
100%
1980 1985 1990 1995 2000 2005 2010 2015
Share
of
House
hold
s
SHARE OF HOUSEHOLD INCOME SPENT ON HOUSING – BAY AREA
REGIONAL PERFORMANCE
HOUSING AFFORDABILITY
Less than 20% of Income
20% to 34% of Income
At least 35% of Income 31%
32%
37%48%
30%
22%
Source: U.S. Census Bureau/American Community Survey
0%
10%
20%
30%
40%
50%
60%
70%
80%
90%
100%
1980 1985 1990 1995 2000 2005 2010 2015Share
of
House
hold
s
SHARE OF HOUSEHOLD INCOME SPENT ON HOUSING – MARIN COUNTY
Less than 20% of Income
20% to 34% of Income
At least 35% of Income 33%
31%
36%46%
30%
24%
21

Of the nine Bay Area counties, Marin County’s lower-income residents are the most at risk of displacement.
0%
20%
40%
60%
1990 1995 2000 2005 2010 2015
Sha
re o
f Lo
wer-
Inco
me H
ouse
hold
s at Risk
DISPLACEMENT RISK BY COUNTY
LOCAL FOCUS
DISPLACEMENT RISK
Sources: U.S. Census Bureau/American Community Survey; Longitudinal Tract Database; note that recent data relies upon 5-year rolling averages; only 2010 and 2015 are shown for clarity
San Francisco
San Mateo
Solano
Marin
Alameda
Santa Clara
Sonoma
Contra Costa
Napa
San Francisco
San Mateo
Solano
Marin
Alameda
Santa Clara
Sonoma
Contra Costa
Napa
22

North Bay residents are increasingly moving out of the region and are being replaced by new arrivals from the West Bay.
LOCAL FOCUS
MIGRATION
Sources: American Community Survey/U.S. Census Bureau – County-to-County Migration Data; note that data relies upon 5-year rolling averages; immigration from abroad not shown for simplicity
2014 NET MIGRATION BY SUBREGION
SAN FRANCISCO + SILICON VALLEY EAST BAY NORTH BAY
East Bay:
-14,100 people
Out of Region:
-5,900 people
SF +
Silicon Valley:
+14,100 people
North Bay:
-3,600 people
North Bay:
+600 people
Out of Region:
-9,100 people
SF +
Silicon Valley:
+3,600 people
East Bay:
-600 people
Out of Region:
-1,800 people
23

KEY FINDINGS – MARIN COUNTY
While growth in the Bay Area has slowed over time, Marin County has decelerated more rapidly than other counties.1
2
3
4
5
The current economic boom has resulted in low unemployment and a widening gap between rich and poor.
While Marin County is more prosperous than its peers, it too is experiencing impacts from displacement and migration.
Given a lack of alignment between jobs and housing, traffic congestion and commute times have increased.
Despite these local and regional challenges, Marin has been a leader in protecting agricultural lands and open space.
24

Because of the county’s job-housing imbalance, significant shares of workers and residents commute between counties.
LOCAL FOCUS
COMMUTE PATTERNS
Source: U.S. Census Bureau – Census Transportation Planning Package
Marin County64%
Sonoma County14%
San Francisco6%
Other Bay Area Counties
9%
Outside the Bay Area
2%
Other31%
COMMUTE ORIGINS OF MARIN COUNTY WORKERS
Marin County65%
San Francisco
22%
Other Bay Area Counties
12%
Outside the Bay Area
1%
Other35%
COMMUTE DESTINATIONS OF MARIN COUNTY RESIDENTS
25

Commute times have ticked upward regionally in recent years – and Marin County is no exception to this trend.
0
5
10
15
20
25
30
35
1980 1985 1990 1995 2000 2005 2010 2015
Media
n C
om
mute
Tim
e
COMMUTE TIMES – BAY AREA AND MARIN COUNTY
REGIONAL PERFORMANCE
COMMUTE TIME
Source: U.S. Census Bureau
Bay Area
Marin County31 min.
30 min.
26

While traffic congestion in Marin remains slightly less severe than the region as a whole, it has grown markedly since 2008.
0%
1%
2%
3%
4%
5%
6%
2004 2005 2006 2007 2008 2009 2010 2011 2012 2013 2014 2015
Congest
ed S
hare
of
Freew
ay V
MT
MILES TRAVELED IN CONGESTION – BAY AREA AND MARIN COUNTY
REGIONAL PERFORMANCE
MILES TRAVELED IN CONGESTION
Source: Iteris/PeMS, 2015
Bay Area
Marin County
6%
4%
27

The Bay Area has made significant progress in shifting travel modes in recent years, but at a slower pace in Marin.
0%
10%
20%
30%
40%
50%
60%
70%
80%
90%
100%
1960 1970 1980 1990 2000 2010
COMMUTE MODE SHARE – BAY AREA
Auto Transit Walk, Bike, Other Work at Home
70%
81%79%76%
REGIONAL PERFORMANCE
COMMUTE MODE CHOICE
Source: U.S. Census Bureau
0%
10%
20%
30%
40%
50%
60%
70%
80%
90%
100%
1960 1970 1980 1990 2000 2010
COMMUTE MODE SHARE – MARIN COUNTY
Auto Transit Walk, Bike, Other Work at Home
73%77% 76%
75%
28

In the case of Marin, this trend is due in part to declining bus ridership even as ferry usage has increased.
0
10
20
30
40
1991 1996 2001 2006 2011 2016
Ave
rage W
eekday B
oard
ings
(in tho
usa
nds)
ANNUAL AVERAGE WEEKDAY RIDERSHIP FOR MARIN COUNTY OPERATORS
LOCAL FOCUS
TRANSIT RIDERSHIP
Note: Estimated average weekday boardings is annual boardings divided by 300 (standard MTC factor)
Source: FTA NTD Annual Database, 2015; FTA NTD Monthly Adjusted Data (preliminary), 2016
Bus(Marin Transit +
Golden Gate Bus)
Ferry(Golden Gate
Ferry)
29

PM2.5
1
2
3
4
5Despite these local and regional challenges, Marin has been a leader in protecting agricultural lands and open space.
KEY FINDINGS – MARIN COUNTY
While growth in the Bay Area has slowed over time, Marin County has decelerated more rapidly than other counties.
The current economic boom has resulted in low unemployment and a widening gap between rich and poor.
While Marin County is more prosperous than its peers, it too is experiencing impacts from displacement and migration.
Given a lack of alignment between jobs and housing, traffic congestion and commute times have increased.
30

Greenfield protection policies in Marin County and beyond have made a difference in protecting natural lands.
(2,000)
-
2,000
4,000
6,000
8,000
10,000
12,000
14,000
16,000
18,000
1992 1994 1996 1998 2000 2002 2004 2006 2008 2010 2012 2014
2-Y
ear
Gro
wth
in
Deve
loped L
and in
Acr
es
TWO-YEAR CHANGE IN REGIONAL GREENFIELD DEVELOPMENT(CHANGE IN DEVELOPED LAND)
REGIONAL PERFORMANCE
GREENFIELD DEVELOPMENT
Source: Department of Conservation, Farmland Mapping and Monitoring Program
Marin County
Rest of Region
31
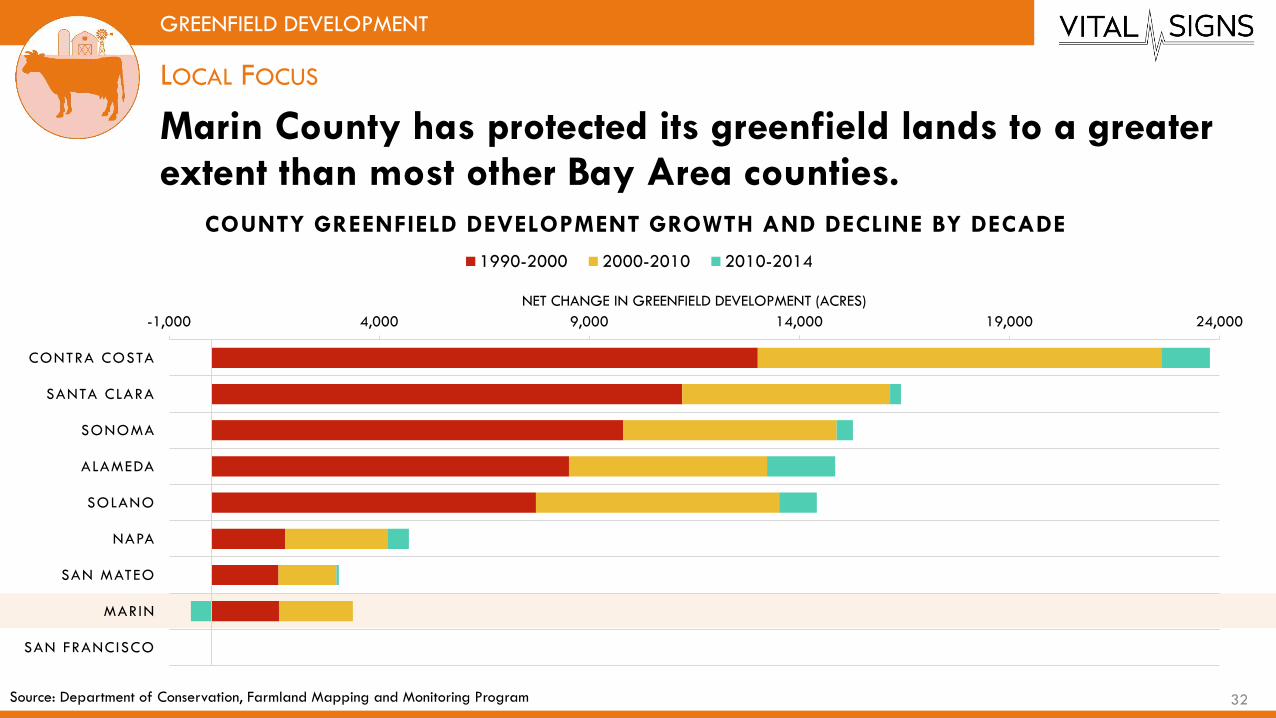
Marin County has protected its greenfield lands to a greater extent than most other Bay Area counties.
-1,000 4,000 9,000 14,000 19,000 24,000
CONTRA COSTA
SANTA CLARA
SONOMA
ALAMEDA
SOLANO
NAPA
SAN MATEO
MARIN
SAN FRANCISCO
NET CHANGE IN GREENFIELD DEVELOPMENT (ACRES)
COUNTY GREENFIELD DEVELOPMENT GROWTH AND DECLINE BY DECADE
1990-2000 2000-2010 2010-2014
LOCAL FOCUS
GREENFIELD DEVELOPMENT
Source: Department of Conservation, Farmland Mapping and Monitoring Program 32

PM2.5
Major investments in wetland restoration in the mid-2000s resulted in thousands of new acres of Bay surface area.
REGIONAL PERFORMANCE
BAY RESTORATION
Source: BCDC Annual Report, 2015
-1,000
1,000
3,000
5,000
7,000
1970 1975 1980 1985 1990 1995 2000 2005 2010 2015
Acr
es
of
Annual C
hang
e
ANNUAL CHANGE IN SAN FRANCISCO BAY SURFACE AREA
Major wetland restorations in Sonoma
County, Solano County, and Hayward
Major wetland
restorations in Novato
Major wetland
restorations in Redwood
City and North Bay
Major wetland
restorations in
Solano County
33

MTC BAAQMD BCDCABAG
DAVID VAUTIN, MTC
UPCOMING DATA RELEASES:
LATE SPRING 2017 – TRANSPORTATION
SUMMER 2017 – ENVIRONMENT
Source: https://www.flickr.com/photos/isolino/8338786790/
vitalsigns.mtc.ca.gov
QUESTIONS?


![[TITLE] - AARP Research Report · Alameda, Contra Costa, Marin, Napa, San Francisco, San Mateo, Santa Clara, Solano, Sonoma San Francisco, San Jose, Oakland In 2001, MTC adopted the](https://static.fdocuments.in/doc/165x107/5f207a78e334fa2c2a286385/title-aarp-research-report-alameda-contra-costa-marin-napa-san-francisco.jpg)