LWD High Resolution Ultrasonic Imager Deliver Innovative ...€¦ · Weatherford ©2018 Weatherford...
18
Weatherford ©2018 Weatherford International plc. All rights reserved. Davide Di Tommaso Operation Manager LWD Petrophysics, North Sea and Continental Europe LPS New Technology Seminar, London, January 10 th 2019 LWD High Resolution Ultrasonic Imager Deliver Innovative Solutions
Transcript of LWD High Resolution Ultrasonic Imager Deliver Innovative ...€¦ · Weatherford ©2018 Weatherford...

Weatherford
©2018 Weatherford International plc. All rights reserved.
Davide Di Tommaso
Operation Manager LWD Petrophysics, North Sea and Continental Europe
LPS New Technology Seminar, London, January 10th 2019
LWD High Resolution Ultrasonic Imager Deliver Innovative Solutions
Weatherford
©2018 Weatherford International plc. All rights reserved.
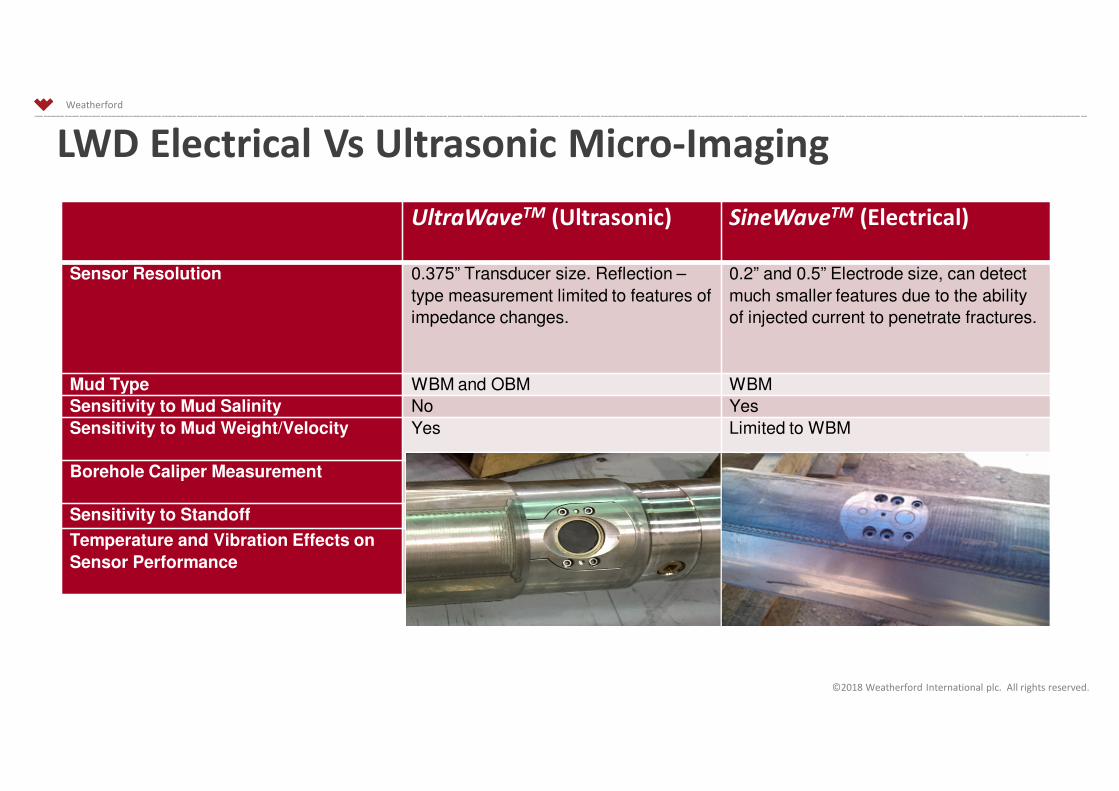
LWD Electrical Vs Ultrasonic Micro-Imaging
UltraWaveTM (Ultrasonic) SineWaveTM (Electrical)
Sensor Resolution 0.375” Transducer size. Reflection –
type measurement limited to features of
impedance changes.
0.2” and 0.5” Electrode size, can detect
much smaller features due to the ability
of injected current to penetrate fractures.
Mud Type WBM and OBM WBM
Sensitivity to Mud Salinity No Yes
Sensitivity to Mud Weight/Velocity Yes Limited to WBM
Borehole Caliper Measurement Yes No
Sensitivity to Standoff Very Tolerant High
Temperature and Vibration Effects on
Sensor Performance
None None
Weatherford
©2018 Weatherford International plc. All rights reserved.
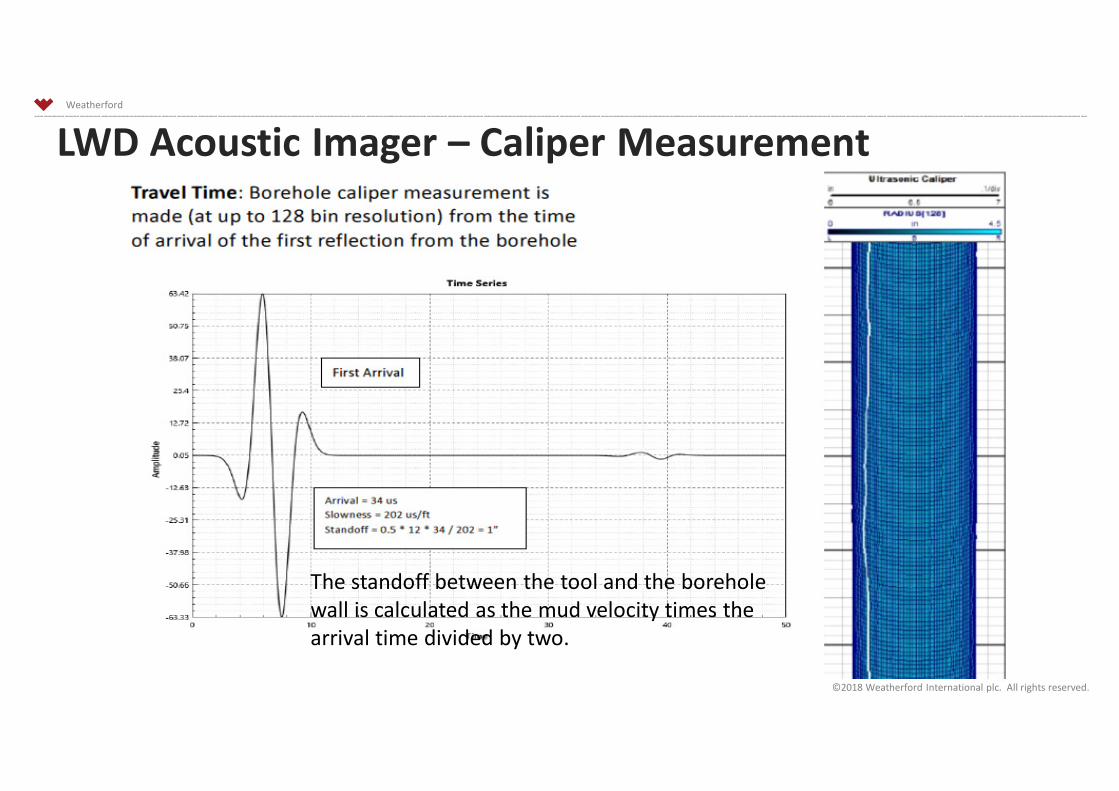
LWD Acoustic Imager – Caliper Measurement
The standoff between the tool and the borehole
wall is calculated as the mud velocity times the
arrival time divided by two.
Weatherford
©2018 Weatherford International plc. All rights reserved.
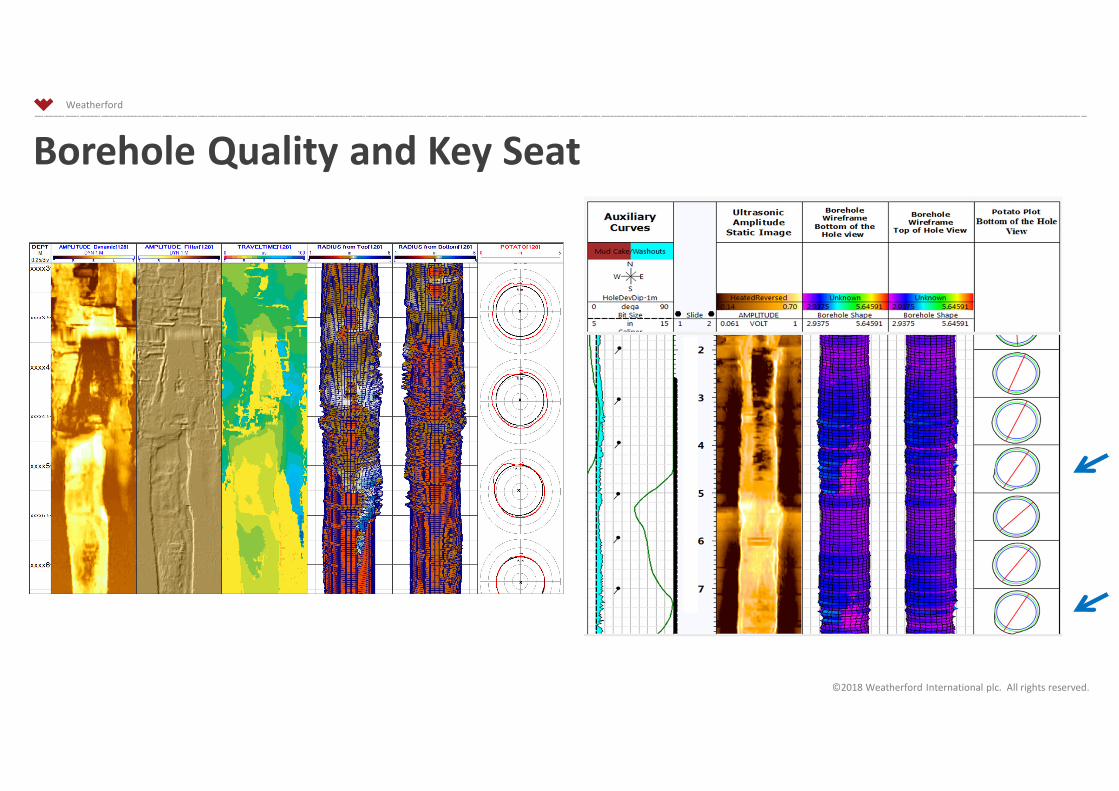
Borehole Quality and Key Seat

Weatherford
©2018 Weatherford International plc. All rights reserved.
LWD Acoustic Imager – Amplitude Image

Weatherford
©2018 Weatherford International plc. All rights reserved.
High Resolution Acoustic Imager - Outputs

Weatherford
©2018 Weatherford International plc. All rights reserved.
Bedding
Weatherford
©2018 Weatherford International plc. All rights reserved.
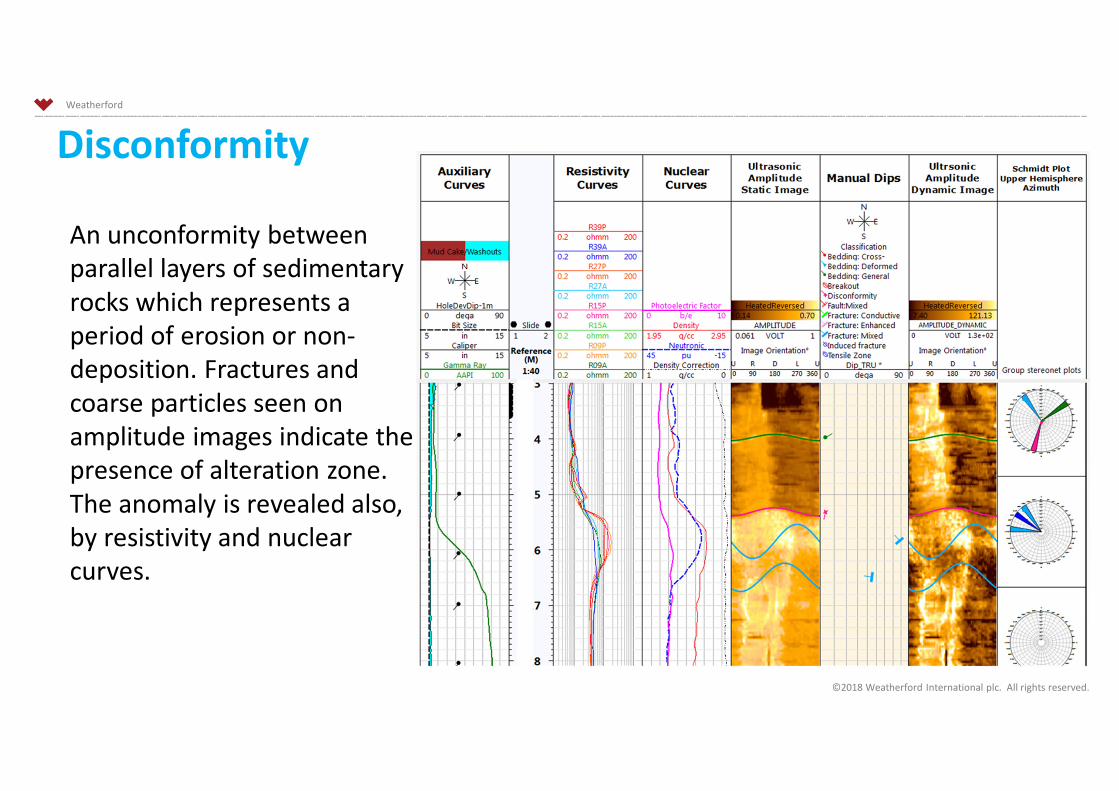
Disconformity
An unconformity between
parallel layers of sedimentary
rocks which represents a
period of erosion or non-
deposition. Fractures and
coarse particles seen on
amplitude images indicate the
presence of alteration zone.
The anomaly is revealed also,
by resistivity and nuclear
curves.
Weatherford
©2018 Weatherford International plc. All rights reserved.
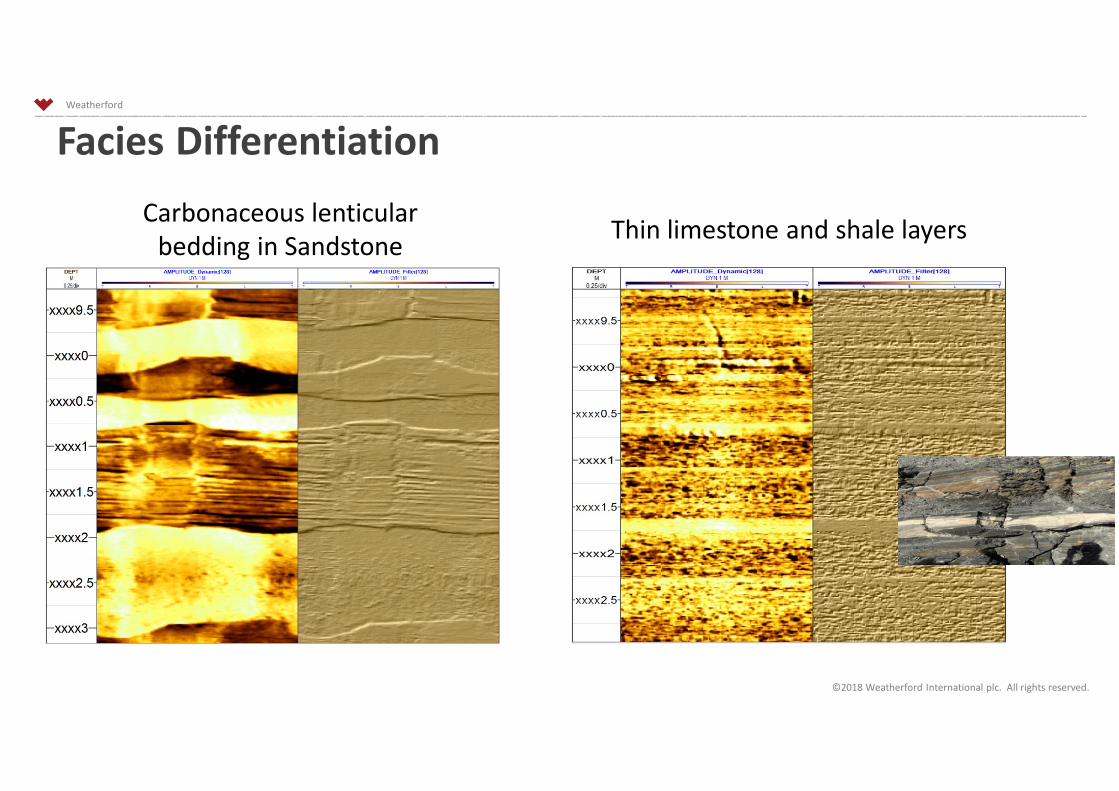
Facies Differentiation
Carbonaceous lenticular
bedding in SandstoneThin limestone and shale layers

Weatherford
©2018 Weatherford International plc. All rights reserved.
Fault
Discordant feature
showing evidence of
fault movement by
offset bedding.
Weatherford
©2018 Weatherford International plc. All rights reserved.
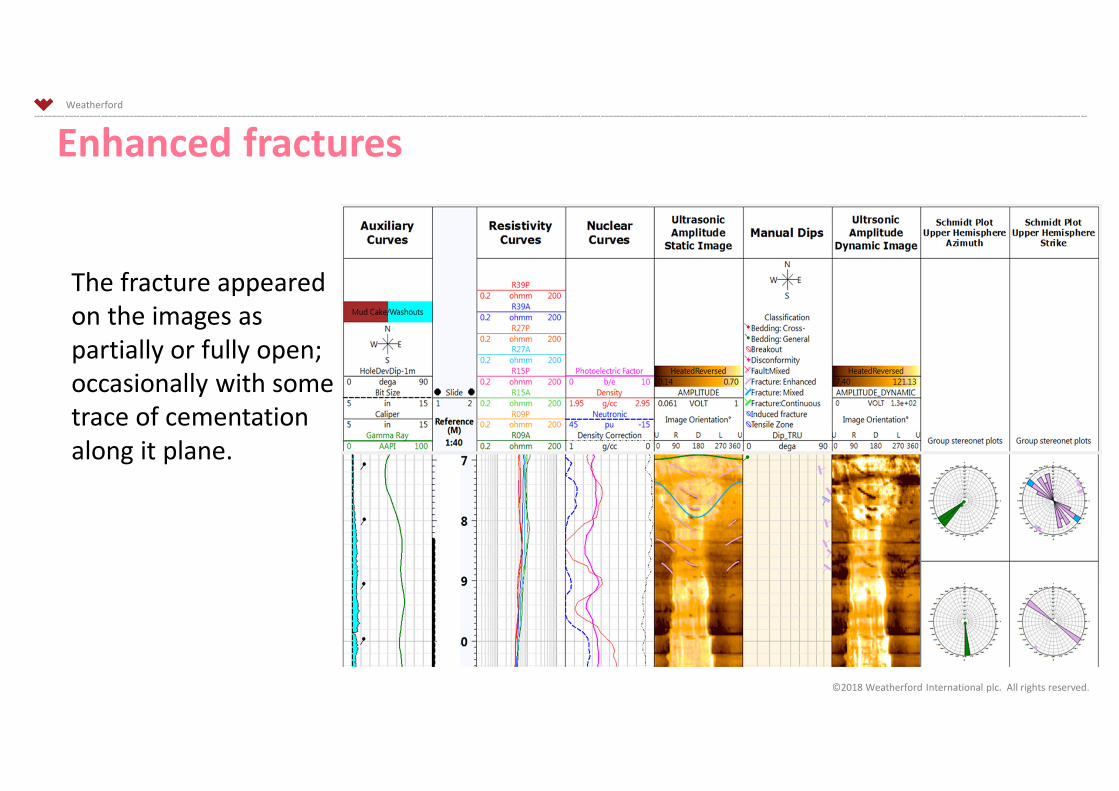
Enhanced fractures
The fracture appeared
on the images as
partially or fully open;
occasionally with some
trace of cementation
along it plane.

Weatherford
©2018 Weatherford International plc. All rights reserved.
Breakouts
Breakout were identified both
on ultrasonic amplitude image
and oriented Schmidt plot
derived from “travel-time”
measurement (two different
sources which confirm one
each other)
Weatherford
©2018 Weatherford International plc. All rights reserved.
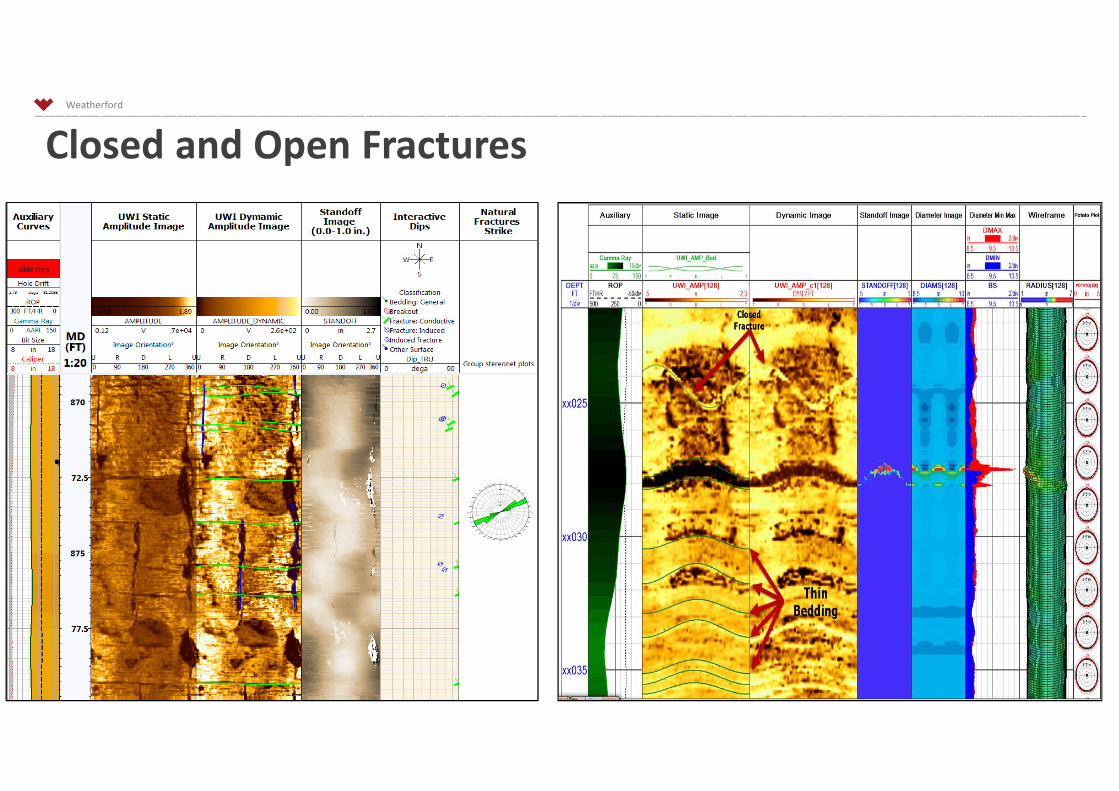
Closed and Open Fractures
Weatherford
©2018 Weatherford International plc. All rights reserved.
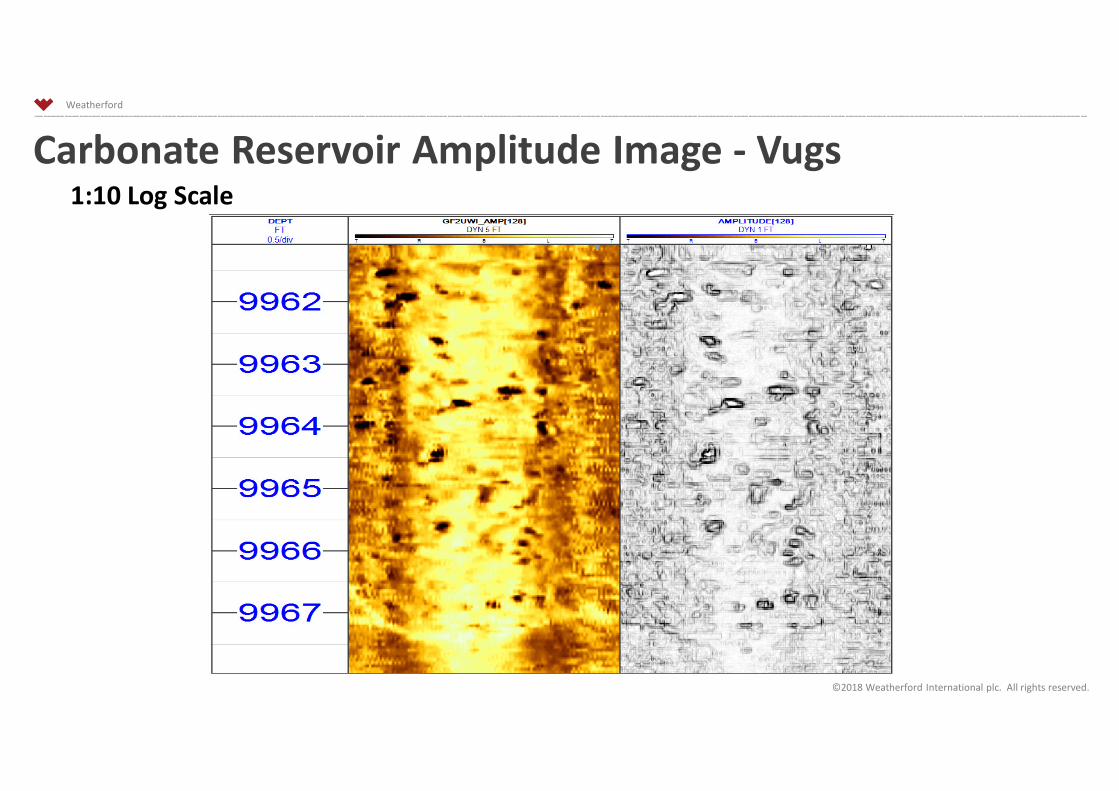
Carbonate Reservoir Amplitude Image - Vugs1:10 Log Scale

Weatherford
©2018 Weatherford International plc. All rights reserved.
Macro-porosity
A) Combination of meso
(matrix) and macro
porosity
B) vuggy porosity
Weatherford
©2018 Weatherford International plc. All rights reserved.
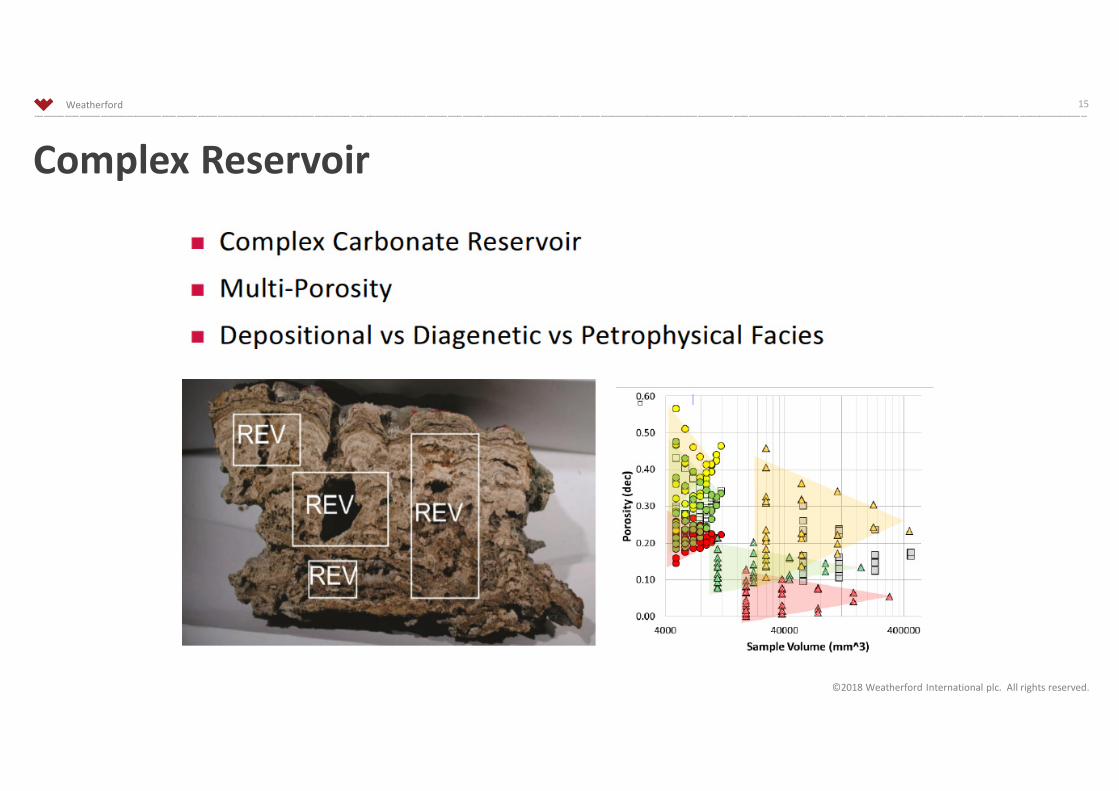
Complex Reservoir
15

Weatherford
©2018 Weatherford International plc. All rights reserved.
Macro-porosity from Ultrasonic Amplitude Images
16
Amplitude image is
responding almost 100% to
matrix porosity
Bimodal histogram with high
amplitude still responding to
matrix porosity and low
amplitude to macro porosity

Weatherford
©2018 Weatherford International plc. All rights reserved.
Example: Carbonate
17
Total porosity
from Neutron
Cut off based on the experience, local knowledge and/or calibration data, generates a binary image where
black points are the bins with low amplitude. Based on the relationship between low and high amplitude
bins times any porosity measurement you can calculate the contribution of the vuggy porosity.