Luxottica Group 2Q2015 Results Presentation
28
2Q 2015 results Milan, July 27, 2015
-
Upload
luxottica-group -
Category
Investor Relations
-
view
903 -
download
0
Transcript of Luxottica Group 2Q2015 Results Presentation

2Q 2015 results
Milan, July 27, 2015

FORWARD LOOKING STATEMENTS Certain statements in this investor presentation may constitute “forward-looking statements” as defined in the Private Securities Litigation Reform Act of 1995. Such statements involve risks, uncertainties and other factors that could cause actual results to differ materially from those which are anticipated. Such risks and uncertainties include, but are not limited to, our ability to manage the effect of the uncertain current global economic conditions on our business, our ability to successfully acquire new businesses and integrate their operations, our ability to predict future economic conditions and changes in consumer preferences, our ability to successfully introduce and market new products, our ability to maintain an efficient distribution network, our ability to achieve and manage growth, our ability to negotiate and maintain favorable license arrangements, the availability of correction alternatives to prescription eyeglasses, fluctuations in exchange rates, changes in local conditions, our ability to protect our proprietary rights, our ability to maintain our relationships with host stores, any failure of our information technology, inventory and other asset risk, credit risk on our accounts, insurance risks, changes in tax laws, as well as other political, economic, legal and technological factors and other risks and uncertainties described in our filings with the US Securities and Exchange Commission. These forward-looking statements are made as of the date hereof, and we do not assume any obligation to update them.
This investor presentation contains measures that were not prepared in accordance with IFRS. For a reconciliation of non-IFRS measures used in these materials, see the Company’s press release titled “Record results for Luxottica Group in the second quarter of 2015” dated July 27, 2015, available on the company’s website www.luxottica.com under the Investors tab.
2

+21.4% growth in adjusted(3) Group sales to record €2.5 billion (+6.6% at constant forex(1))
• Solid trends propelled by adjusted(3)Retail sales: +27.3% - Retail comps(2): +3.9%
- LensCrafters North America comps(2): +6.4% - Sunglass Hut global sales: +12.7% at constant forex(1)
• Wholesale sales: +14.3%, growing nicely across all regions
- Opened 1,281 new STARS doors
• E-com sales up by 57%
For additional disclosures regarding information in this presentation, please see “Notes to the presentation” in the Appendix
2Q 2015: NEW QUARTERLY SALES RECORD Continued solid momentum
3 2Q 2015 results

Best-in-class manufacturing capabilities keep delivering efficiencies: strong gross margin increase of 160bps(3)
Group adjusted(3)(4) operating margin up by 160bps to a record 20.8%
• Wholesale margin expansion(3)(4): +190bps • Retail margin expansion(3): +140bps
All-time high adjusted(3)(4) net income of €314 million, adjusted(3)(4) net margin at 12.6%
Net debt/adjusted EBITDA(3)(4) at 0.8x, after dividend payment of €690 million
• Strong free cash flow(3) generation: €261 million For additional disclosures regarding information in this presentation, please see “Notes to the presentation” in the Appendix
4 2Q 2015 results
2Q 2015: FURTHER EFFICIENCY GAINS Operating leverage fully at work

Group profitability boosted by better than expected operational efficiencies without compromising on quality and service level
• Production cost per unit reduction: -3.5% at constant forex, in line with 1Q
• Further improvements in service level
- Order cycle acceleration: >90% on time delivery of new product launches
- Backorders: -10% vs. 2Q 2014
RELYING ON HIGHER OPERATION’S EFFICIENCIES
5 2Q 2015 results
OAKLEY: SYNERGIES AND COSTS
6
Synergies of approximately €100 million resulting from:
• Additional annual revenues expected to yield €50 million of incremental operating income by 2017 as a result of the wholesale integration and the new targeted initiatives for retail and apparel
• Annualized cost savings of €50 million as a result of integration benefits and streamlining of the entire structure from 2016; immaterial impact in 2015
Integration related charges (including minor reorganization activities across the Group): approximately €50 million between 2Q and 2H 2015
2Q 2015 results
x
x
x
x
x x
x
x
x
x
x x
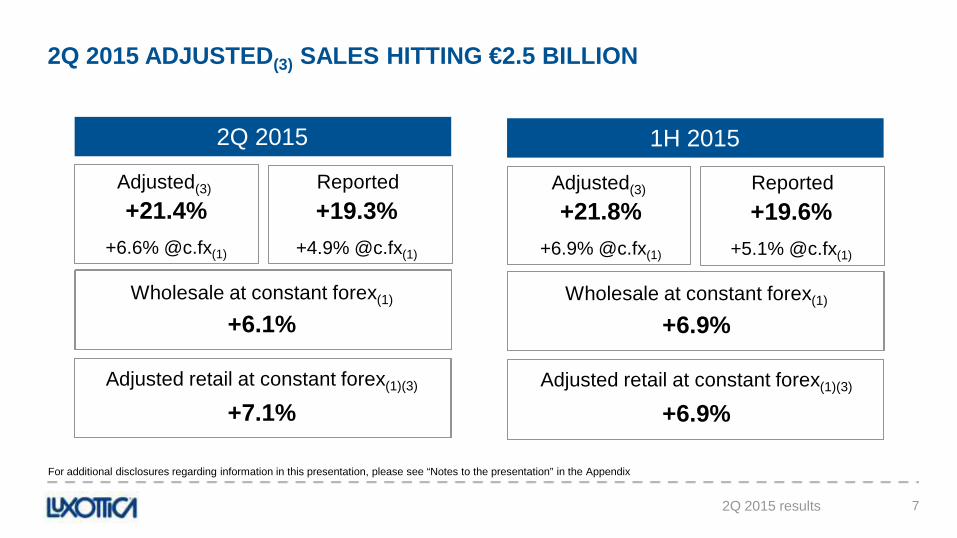
2Q 2015 ADJUSTED(3) SALES HITTING €2.5 BILLION
2Q 2015 1H 2015
7
For additional disclosures regarding information in this presentation, please see “Notes to the presentation” in the Appendix
Adjusted(3) Reported +21.4%
+6.6% @c.fx(1)
+19.3% +4.9% @c.fx(1)
Wholesale at constant forex(1)
+6.1%
Adjusted retail at constant forex(1)(3)
+7.1%
Adjusted(3) Reported +21.8%
+6.9% @c.fx(1)
+19.6% +5.1% @c.fx(1)
Wholesale at constant forex(1)
+6.9%
Adjusted retail at constant forex(1)(3)
+6.9%
2Q 2015 results

2Q 2015 ADJUSTMENTS IMPACTING REPORTED RESULTS
8
Impact on Group sales
(€ mn)
Impact on Group operating income
(€ mn)
Impact on Group net income
(€ mn)
EyeMed change in presentation of net sales
• Commencing in 3Q14, EyeMed sales are reported on a net basis due to a change in the contractual terms of an insurance underwriting agreement
-43.7
-
-
• Oakley integration project (including minor reorganization activities across the Group) -20.4 -19.6
2Q 2015 results

666
879
1H 2014 1H 2015
STRONG GROWTH IN OPERATING PROFITABILITY(3)(4)
Wholesale (€ mn)
Retail (€ mn)
262 320
2Q 2014 2Q 2015
28.1% 30.0%
182 252
2Q 2014 2Q 2015
16.2% 17.6%
396 521
2Q 2014 2Q 2015
19.2% 20.8%
Group (€ mn)
+100bps @c.fx.(1)
456 556
1H 2014 1H 2015
26.2% 27.7%
307 424
1H 2014 1H 2015
14.2% 15.5%
17.1%
18.5%
9 2Q 2015 results
+130bps @c.fx.(1)
(3)(4) 2Q 2015 and 1H 2015 figures are on an adjusted basis. For further information, please, see “Notes to the presentation” in the Appendix.
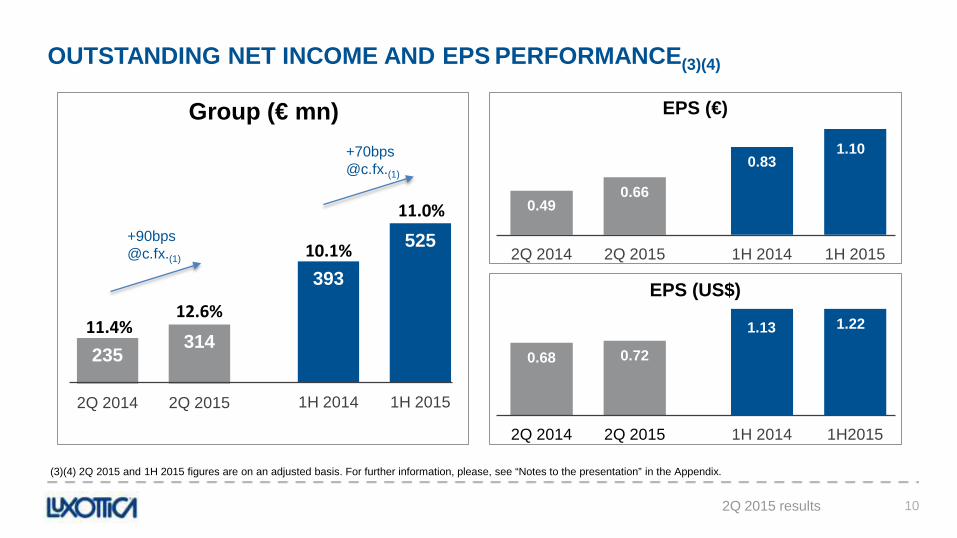
393
525
1H 2014 1H 2015
OUTSTANDING NET INCOME AND EPS PERFORMANCE(3)(4)
10
Group (€ mn)
235 314
2Q 2014 2Q 2015
0.49 0.66
2Q 2014 2Q 2015
0.68 0.72
2Q 2014 2Q 2015
11.4% 12.6%
10.1%
11.0%
EPS (€)
EPS (US$)
0.83 1.10
1H 2014 1H 2015
1.13 1.22
1H 2014 1H2015
2Q 2015 results
+70bps @c.fx.(1)
+90bps @c.fx.(1)
(3)(4) 2Q 2015 and 1H 2015 figures are on an adjusted basis. For further information, please, see “Notes to the presentation” in the Appendix.
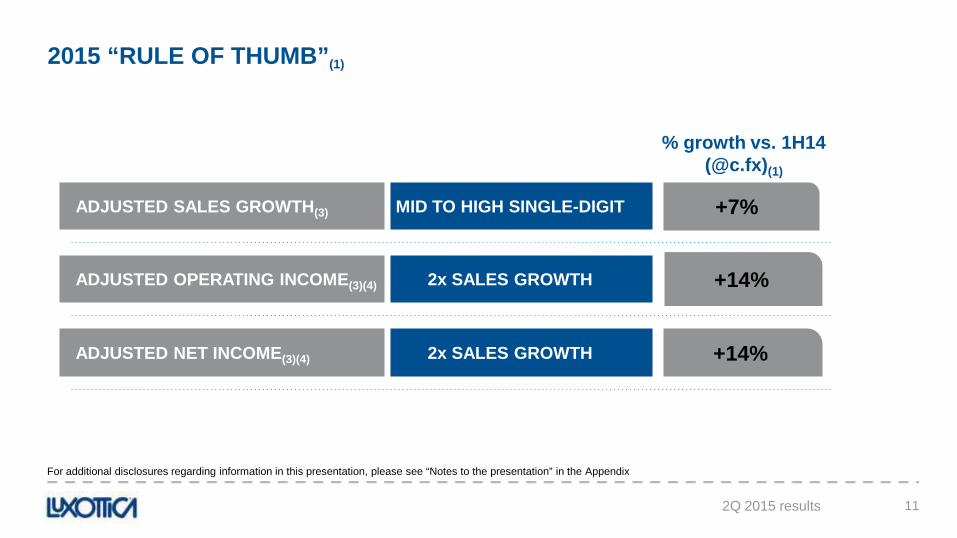
2015 “RULE OF THUMB”(1)
11
+7% MID TO HIGH SINGLE-DIGIT
+14% 2x SALES GROWTH
+14% 2x SALES GROWTH
% growth vs. 1H14 (@c.fx)(1)
ADJUSTED SALES GROWTH(3)
ADJUSTED NET INCOME(3)(4)
ADJUSTED OPERATING INCOME(3)(4)
For additional disclosures regarding information in this presentation, please see “Notes to the presentation” in the Appendix
2Q 2015 results

DEBT OVERVIEW AND FREE CASH FLOW(3) GENERATION
12
Free cash flow(3) generation unchanged, before €63 million tax-related payment and after strategic working capital expansion • 32% increase in Capex (from €93 million in 2Q14 to €123 million in 2Q15)
• Higher inventory level to support sales and improve lead time and service level
Δ days • DSO (Days sales outstanding) -1
• DSI (Days sales of inventory) +10
• DPO (Days payables outstanding) -1
1,005 1,447
1Q 2015 2Q 2015
Net debt(3) (€ mn)
321 261
2Q 2014 2Q 2015
Free cash flow(3) (€ mn)
Net debt/adjusted EBITDA(3)(4) at 0.8x after €690 million dividend payment
For additional disclosures regarding information in this presentation, please see “Notes on the presentation” in the Appendix
-2 -43
Operating working capital (€ mn) 2Q 2014 2Q 2015
2Q 2015 results
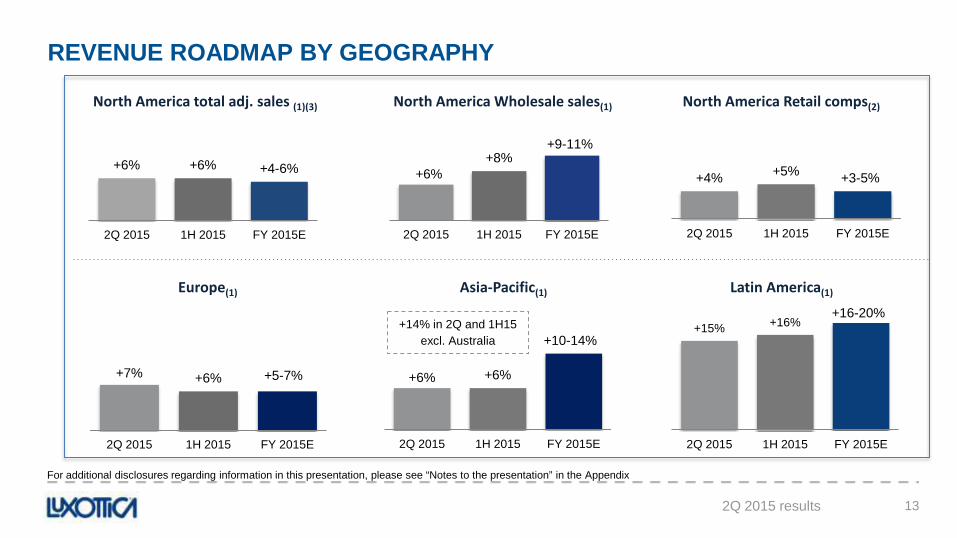
+7% +6% +5-7%
2Q 2015 1H 2015 FY 2015E
+4% +5% +3-5%
2Q 2015 1H 2015 FY 2015E
+6% +8%
2Q 2015 1H 2015 FY 2015E
+6% +6% +4-6%
2Q 2015 1H 2015 FY 2015E
+6% +6%
2Q 2015 1H 2015 FY 2015E
+15% +16%
2Q 2015 1H 2015 FY 2015E
North America total adj. sales (1)(3) North America Wholesale sales(1) North America Retail comps(2)
Asia-Pacific(1) Europe(1) Latin America(1)
REVENUE ROADMAP BY GEOGRAPHY
For additional disclosures regarding information in this presentation, please see “Notes to the presentation” in the Appendix
13
+10-14%
+16-20%
+9-11%
2Q 2015 results
+14% in 2Q and 1H15 excl. Australia

NORTH AMERICA Strong momentum continues
14 2Q 2015 results
Total adjusted sales(3) up by 29.3% (+6% in US$) Wholesale: solid trading environment except for a few weeks of slower Oakley sales due to integration Retail • LensCrafters accelerating: comps(2) +6.4%, driven by
conversion rate • Sunglass Hut: total sales(1) +7% with solid contribution
from new stores - Comps(2): +2.5% vs. strongest quarter in 2014
- July comps(2) up high single-digit
• E-com sales growth at 45% For additional disclosures regarding information in this presentation, please see “Notes to the presentation” in the Appendix

EUROPE Acceleration in sales performance
15
Total sales: +9.1% vs. a strong 2Q 2014 Best performers: Spain, Germany, UK, Nordic and Eastern countries • Opened 681 STARS doors in Europe Strong retail performance throughout • Sunglass Hut double-digit comps(2) led by Continental
Europe
2Q 2015 results
For additional disclosures regarding information in this presentation, please see “Notes to the presentation” in the Appendix

ASIA-PACIFIC
16
2Q 2015 sales: +18.2%, driven by China (+48%) and India (+34%) Unlocking China: sales growth accelerated pace • Wholesale rapidly moving forward to increase
number of doors • LensCrafters: total sales up double-digit, +1% in
comps(2) vs. double-digit growth in the previous two years
• Solid early results in 13 Sunglass Hut stores opened since the beginning of the year
Mixed retail performance in Australia • Strong Sunglass Hut and Oakley, weak OPSM
2Q 2015 results
For additional disclosures regarding information in this presentation, please see “Notes to the presentation” in the Appendix
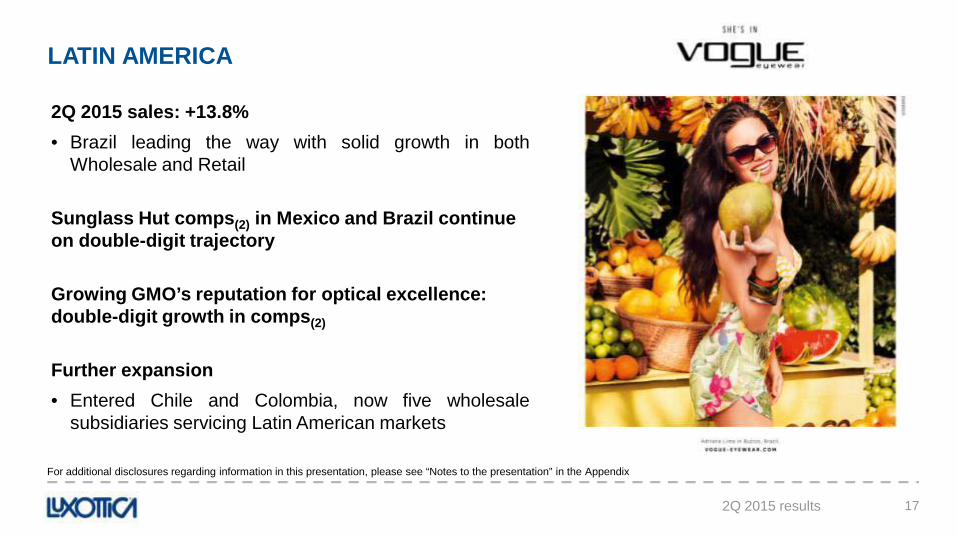
LATIN AMERICA
17
2Q 2015 sales: +13.8% • Brazil leading the way with solid growth in both
Wholesale and Retail Sunglass Hut comps(2) in Mexico and Brazil continue on double-digit trajectory
Growing GMO’s reputation for optical excellence: double-digit growth in comps(2)
Further expansion • Entered Chile and Colombia, now five wholesale
subsidiaries servicing Latin American markets
2Q 2015 results
For additional disclosures regarding information in this presentation, please see “Notes to the presentation” in the Appendix
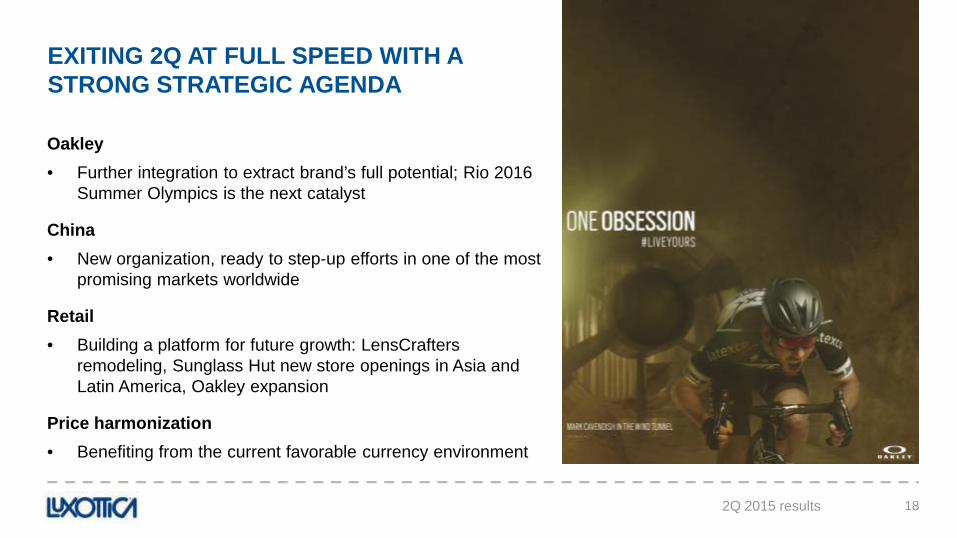
Oakley • Further integration to extract brand’s full potential; Rio 2016
Summer Olympics is the next catalyst
China • New organization, ready to step-up efforts in one of the most
promising markets worldwide
Retail • Building a platform for future growth: LensCrafters
remodeling, Sunglass Hut new store openings in Asia and Latin America, Oakley expansion
Price harmonization • Benefiting from the current favorable currency environment
18 2Q 2015 results
EXITING 2Q AT FULL SPEED WITH A STRONG STRATEGIC AGENDA
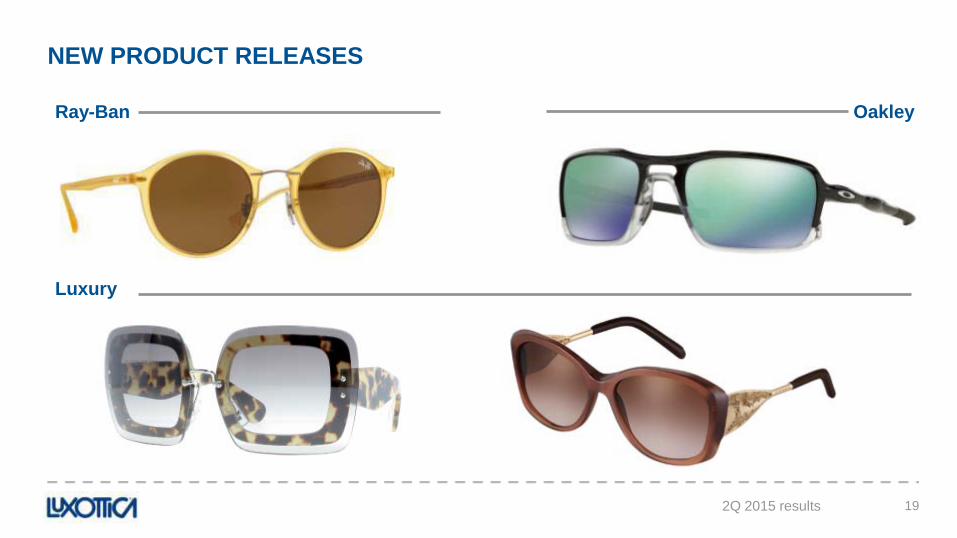
NEW PRODUCT RELEASES
19 2Q 2015 results
Oakley
Luxury
Ray-Ban

OneSight is a nonprofit leading the global effort to provide permanent access to quality vision care and eyewear in underserved communities worldwide. Since 1988, OneSight has engaged thousands of skilled volunteers across Luxottica to help 9 million people in 41 countries.
2Q 2015 RESULTS OneSight Vision Center in Rwanda On July 21, 2015 OneSight opened its first sustainable vision center in Rwanda, providing access to vision care and glasses for 385,000 people in the Musanze District. The Honorable Minister of Health Dr. Agnes Binagwaho marked the occasion by speaking at the grand opening ceremony held onsite at Ruhengeri Hospital. Following the evaluation of the pilot project in November, OneSight plans to scale its sustainable vision care system model to 20-30 additional vision centers over the next 3-5 years serving the entire country of 12.2 million people in Rwanda. First Charitable Clinic in Colombia OneSight partnered with GMO to serve more than 2,000 patients in Apartado, Colombia, in April. Colombia is an important addition to OneSight’s programming as the organization is committed to expanding its involvement in Latin America. Clinics were held in Mexico, Nicaragua and Brazil earlier this year with an additional clinic scheduled for Peru in October.
Training Rwandans for Sustainable Success Rwanda has an extensive and sophisticated network of over 40,000 community health workers that will be instrumental in connecting Rwandans to the new vision center. OneSight volunteers leveraged lessons from The Gambia to implement a “train the trainer” model in Rwanda. They have developed a successful and efficient new training plan that involves hospital employees in preparing the community health workers to conduct vision screenings in their villages. Pictured above: OneSight volunteers train a Rwandan health care worker to conduct an eye exam.
20 2Q 2015 results
Appendix
21

NOTES ON THE PRESENTATION
22
› 1 Figures at constant exchange rates are calculated using the average exchange rates in effect during the corresponding period of the previous year. Please refer to the “Major currencies” table in the press release titled “Record results for Luxottica Group in the second quarter of 2015” dated July 27, 2015 available at the www.luxottica.com website under the Investors tab.
› 2 Comparable store sales reflect the change in sales from one period to another, that, for comparison purposes, includes in the calculation only stores open in the more recent period that also were open during the comparable prior period, and applies to both periods the average exchange rate for the prior period and the same geographic area.
› 3 Net debt/EBITDA, net debt/adjusted EBITDA, net debt, EBITDA, adjusted EBITDA, adjusted operating income, adjusted operating margin, adjusted net income, adjusted net sales, adjusted earnings per share and free cash flow are not measures in accordance with IFRS. For additional disclosure, see the press release titled “Record results for Luxottica Group in the second quarter of 2015” dated July 27, 2015 available at the www.luxottica.com website under the Investors tab.
› 4 Excluding non-recurring items
› 5 Equals interest income minus interest expenses
› 6 Equals extraordinary income minus extraordinary expenses
› 7 Net debt figures are calculated using the average exchange rates used to calculate EBITDA figures
Appendix

23 Appendix
2Q 2015 SALES BREAKDOWN
€ mn 2Q 2014 % 2Q 2015 % Curr. fx Const. fx(1)
North America adj.(3) 1,102 53% 1,425 57% 29.3% 5.7%
Wholesale 227 11% 293 12% 29.0% 5.5%
Retail adj.(3) 875 42% 1,132 45% 29.3% 5.8%
Europe 487 24% 531 21% 9.1% 6.5%
Asia-Pacific 269 13% 318 13% 18.2% 6.4%
Latin America 116 6% 131 5% 13.8% 15.3%
Rest of the World 86 4% 95 4% 10.1% 8.4%
GROUP TOTAL adj.(3) 2,060 100% 2,501 100% 21.4% 6.6%
GROUP TOTAL rep. 2,060 2,457 19.3% 4.9%
2015 vs. 2014
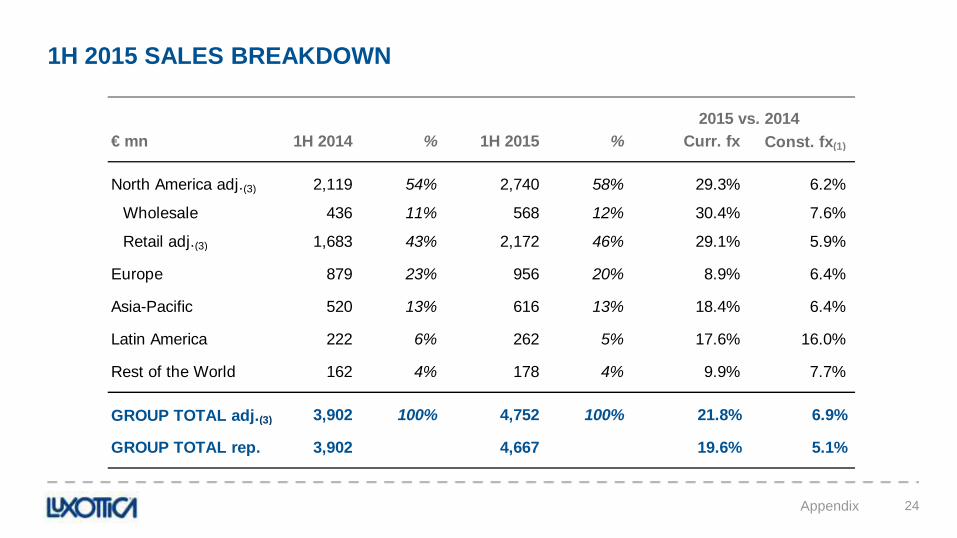
1H 2015 SALES BREAKDOWN
24 Appendix
€ mn 1H 2014 % 1H 2015 % Curr. fx Const. fx(1)
North America adj.(3) 2,119 54% 2,740 58% 29.3% 6.2%
Wholesale 436 11% 568 12% 30.4% 7.6%
Retail adj.(3) 1,683 43% 2,172 46% 29.1% 5.9%
Europe 879 23% 956 20% 8.9% 6.4%
Asia-Pacific 520 13% 616 13% 18.4% 6.4%
Latin America 222 6% 262 5% 17.6% 16.0%
Rest of the World 162 4% 178 4% 9.9% 7.7%
GROUP TOTAL adj.(3) 3,902 100% 4,752 100% 21.8% 6.9%
GROUP TOTAL rep. 3,902 4,667 19.6% 5.1%
2015 vs. 2014

RETAIL COMPARABLE STORE SALES(2)
25
2Q 2015 1H 2015
Optical North America
• LensCrafters +6.4% +6.1%
• Licensed brands +7.1% +9.1%
Australia/New Zealand -2.2% -0.3%
Sunglass Hut worldwide +4.6% +5.8%
Group retail +3.9% +4.6%
Appendix

DEBT OVERVIEW
26
Adj. EBITDA(3)(4) 488 645
Δ working capital 70 3
Capex (93) (123)
Operating cash flow 465 525
Financial charges(5) (24) (26)
Taxes paid (119) (236)
Extraordinary charges(6)
(1) (2)
Free cash flow(3) 321 261
2Q 2014 2Q 2015 Mar. 31, 2015
June 30, 2015 Δ
Net US$ debt(3) (346) (364) (18)
Net € debt(3) (683) (1,122) (439)
Translation adj. 9
€ 1 = US$ 1.0759 1.1189
Net debt (€)(3) (1,005) (1,447) (442)
Net debt/adj. EBITDA(3)(4)
0.6x 0.8x
Net debt/adj. EBITDA excluding exchange rate effect(3)(4)(7)
0.6x 0.8x
Appendix

INVESTOR RELATIONS TEAM
Tel. +39 (02) 8633 - 4662 [email protected]
Alessandra Senici
Tel. +39 (02) 8633 - 4038 [email protected]
Elena Dimichino
Tel. +39 (02) 8633 - 4510 [email protected]
Giorgio Iannella
Tel. +39 (02) 8633 - 4870 [email protected]
Elisa Cattaruzza
Upcoming event
› October 26 – 3Q 2015 results
http://www.luxottica.com/en/company/investors/financial-calendar
27

28
Like our Luxottica Group page
Instagram.com/luxottica
@Luxottica
Pinterest.com/luxotticagroup
LinkedIn.com/company/luxottica_group
Youtube.com/luxotticagroup
Slideshare.net/LuxotticaGroup
SOCIAL MEDIA CONTACTS