Lundbeck delivers its best financial results following 10%...
25
Corporate Release Valby, Denmark, 7 February 2018 H. Lundbeck A/S Investor Relations Ottiliavej 9 DK-2500 Valby Copenhagen Tel+45 36 30 13 11 www.lundbeck.com CVR-nr.: 56759913 LEI code: 5493006R4KC2OI5D3470 Financial report for the period 1 January to 31 December 2017 Lundbeck delivers its best financial results following 10% revenue growth and 117% growth in net profit HIGHLIGHTS • Revenue reached DKK 17,234 million in 2017 representing an increase of 10% (12% in local currencies) compared to 2016 ➢ Revenue of Abilify Maintena ® increased by 19% to DKK 1,331 million (21% in local currencies) ➢ Revenue of Brintellix ® /Trintellix ® increased by 50% to DKK 1,662 million (52% in local currencies) ➢ Revenue of Northera ® increased by 51% to DKK 1,644 million (55% in local currency) ➢ Revenue of Onfi ® increased by 25% to DKK 3,022 million (28% in local currency) ➢ Revenue of Rexulti ® increased by 51% to DKK 1,247 million (54% in local currencies) ➢ Revenue in North America increased by 17% to DKK 10,672 million (19% in local currencies) ➢ Revenue in International Markets increased by 2% to DKK 3,345 million (5% in local currencies) ➢ Revenue in Europe decreased by 3% to DKK 2,818 million (4% decline in local currencies) • EBIT improved significantly reaching DKK 4,408 million from DKK 2,292 million in 2016. EBIT for 2017 includes the gain of DKK 242 million from the divestment of properties which is recognized as Other operating income. Adjusted for this gain the EBIT margin reached 24.2% compared to an EBIT margin of 14.7% in 2016 • EPS grew 117% in the period to DKK 13.28 compared to DKK 6.12 the year before • Free cash flow reached DKK 2,215 million and the net cash position improved to DKK 3,677 million compared to DKK 326 million at the end of 2016 • For 2018, Lundbeck expects revenue to reach DKK 17.2-18.0 billion and EBIT to reach DKK 4.8-5.2 billion • The Board of Directors proposes to pay a dividend of DKK 8.00 per share, corresponding to a pay-out ratio of 61% In connection with the financial report, Lundbeck’s CFO and interim CEO, Anders Götzsche said: “2017 has been a successful financial year for Lundbeck as we grew the business and increased Lundbeck’s profitability significantly. Going forward we will continue to focus on profitability, while at the same time focus on strengthening our pipeline to create long-term, sustainable and profitable growth.” DKK million FY 2017 FY 2016 Growth Reported Revenue 17,234 15,634 10% Reported EBIT 4,408 2,292 92% Reported EPS 13.28 6.12 117% Reported EBIT margin 25.6% 14.7% - Core Revenue* 17,234 15,634 10% Core EBIT* 5,115 3,477 47% Core EPS* 16.50 11.09 49% Core EBIT margin* 29.7% 22.2% - *For definition of the measures “Core Revenue”, “Core EBIT” and “Core EPS”, see note 3 Core reporting
Transcript of Lundbeck delivers its best financial results following 10%...

Corporate Release
Valby, Denmark, 7 February 2018
H. Lundbeck A/S Investor Relations
Ottiliavej 9
DK-2500 Valby
Copenhagen
Tel+45 36 30 13 11
www.lundbeck.com
CVR-nr.: 56759913
LEI code: 5493006R4KC2OI5D3470
Financial report for the period 1 January to 31 December 2017
Lundbeck delivers its best financial results following 10% revenue growth and 117% growth in net profit
HIGHLIGHTS
• Revenue reached DKK 17,234 million in 2017 representing an increase of 10% (12% in local currencies)
compared to 2016
➢ Revenue of Abilify Maintena® increased by 19% to DKK 1,331 million (21% in local currencies)
➢ Revenue of Brintellix®/Trintellix® increased by 50% to DKK 1,662 million (52% in local currencies)
➢ Revenue of Northera® increased by 51% to DKK 1,644 million (55% in local currency)
➢ Revenue of Onfi® increased by 25% to DKK 3,022 million (28% in local currency)
➢ Revenue of Rexulti® increased by 51% to DKK 1,247 million (54% in local currencies)
➢ Revenue in North America increased by 17% to DKK 10,672 million (19% in local currencies)
➢ Revenue in International Markets increased by 2% to DKK 3,345 million (5% in local currencies)
➢ Revenue in Europe decreased by 3% to DKK 2,818 million (4% decline in local currencies)
• EBIT improved significantly reaching DKK 4,408 million from DKK 2,292 million in 2016. EBIT for 2017 includes
the gain of DKK 242 million from the divestment of properties which is recognized as Other operating income.
Adjusted for this gain the EBIT margin reached 24.2% compared to an EBIT margin of 14.7% in 2016
• EPS grew 117% in the period to DKK 13.28 compared to DKK 6.12 the year before
• Free cash flow reached DKK 2,215 million and the net cash position improved to DKK 3,677 million compared
to DKK 326 million at the end of 2016
• For 2018, Lundbeck expects revenue to reach DKK 17.2-18.0 billion and EBIT to reach DKK 4.8-5.2 billion
• The Board of Directors proposes to pay a dividend of DKK 8.00 per share, corresponding to a pay-out ratio of
61%
In connection with the financial report, Lundbeck’s CFO and interim CEO, Anders Götzsche said:
“2017 has been a successful financial year for Lundbeck as we grew the business and increased Lundbeck’s
profitability significantly. Going forward we will continue to focus on profitability, while at the same time focus on
strengthening our pipeline to create long-term, sustainable and profitable growth.”
DKK million FY 2017 FY 2016 Growth
Reported Revenue 17,234 15,634 10%
Reported EBIT 4,408 2,292 92%
Reported EPS 13.28 6.12 117%
Reported EBIT margin 25.6% 14.7% -
Core Revenue* 17,234 15,634 10%
Core EBIT* 5,115 3,477 47%
Core EPS* 16.50 11.09 49%
Core EBIT margin* 29.7% 22.2% -
*For definition of the measures “Core Revenue”, “Core EBIT” and “Core EPS”, see note 3 Core reporting

FINANCIAL REPORT FOR THE PERIOD 1 JANUARY TO 31 DECEMBER 2017 Page 2
Corporate Release No 637/2018
CONTENTS
FINANCIAL HIGHLIGHTS AND KEY FIGURES .................................................. 3
MANAGEMENT REVIEW ............................................................................... 4
Financial guidance and forward-looking statements ..................................... 4
Revenue ................................................................................................. 5
Expenses and income ..............................................................................10
Balance sheet ........................................................................................12
Lundbeck's development portfolio .............................................................13
General corporate matters .......................................................................16
FINANCIAL STATEMENTS ............................................................................18

FINANCIAL REPORT FOR THE PERIOD 1 JANUARY TO 31 DECEMBER 2017 Page 3
Corporate Release No 637/2018
FINANCIAL HIGHLIGHTS AND KEY FIGURES
FY 2017 FY 2016 Q4 2017 Q4 2016
Financial highlights (DKK million)
Reported revenue 17,234 15,634 4,392 4,165
Core revenue 17,234 15,634 4,392 4,165
Operating profit before depreciation and amortization (EBITDA) 5,424 3,846 1,254 1,162
Reported profit from operations (EBIT) 4,408 2,292 932 751
Core profit from operations (core EBIT) 5,115 3,477 1,169 1,014
Net financials (131) (135) (50) (14)
Profit before tax 4,277 2,157 882 737
Tax 1,653 946 329 264
Profit for the period 2,624 1,211 553 473
Equity 12,181 9,694 12,181 9,694
Assets 19,756 20,210 19,756 20,210
Cash flows from operating and investing activities (free cash flow) 2,215 2,789 926 900
Purchase of property, plant and equipment, gross 245 238 138 85
Key figures
EBIT margin (%) 25.6 14.7 21.2 18.0
Return on invested capital (ROIC) (%) 30.8 13.2 6.8 5.1
Annualized return on invested capital (ROIC) (%) 30.8 13.2 27.0 20.4
Cash to earnings (%) 141.8 230.3 258.9 190.3
Research and development ratio (%) 15.7 19.0 17.8 17.1
Return on equity (%) 24.0 13.1 4.7 5.0
Equity ratio (%) 61.7 48.0 61.7 48.0
Invested capital (DKKm) 8,504 9,368 8,504 9,368
Net debt/EBITDA (0.7) (0.1) (2.9) (0.3)
Share data*
Number of shares for the calculation of EPS (millions) 197.5 197.2 198.6 197.3
Number of shares for the calculation of DEPS (millions) 197.8 197.4 198.7 197.5
Earnings per share, basic (EPS) (DKK) 13.28 6.12 2.79 2.39
Earnings per share, diluted (DEPS) (DKK) 13.27 6.11 2.78 2.38
Cash flow from operating activities per share, diluted (DKK) 20.45 15.77 6.78 5.21
Net asset value per share, diluted (DKK) 61.29 48.88 61.29 48.88
Market capitalization (DKK million) 62,700 56,776 62,700 56,776
Share price end of period (DKK) 315.00 287.30 315.00 287.30
Proposed dividend per share (DKK) 8.00 2.45 - -
Other
Number of employees (FTE) end of period 4,976 4,983 4,976 4,983
*) Comparative figures including number of shares have been restated using a factor 0.9958 for the effect of employees’ exercise of warrants.

FINANCIAL REPORT FOR THE PERIOD 1 JANUARY TO 31 DECEMBER 2017 Page 4
Corporate Release No 637/2018
MANAGEMENT REVIEW
Financial guidance and forward-looking statements
Lundbeck’s results in 2018 are expected to be driven by the continued strong growth of Abilify Maintena,
Brintellix/Trintellix, Northera and Rexulti which should more than compensate the effect of additional generic erosion
on older products and also the potential introduction of generic clobazam towards the end of the year. Looking at
our geographical regions, we expect to realize growth in all three regions, North America, International Markets and
Europe, in local currencies.
Total revenue is expected to reach between DKK 17.2 and DKK 18.0 billion in 2018 and Lundbeck’s EBIT is
expected to be in the range between DKK 4.8 and DKK 5.2 billion. Lundbeck’s main currency is the USD and the
guidance is based on the level for the USD as it was by the end of January 2018. As a consequence of the U.S. tax
reform, Lundbeck expects the reported tax rate to be 26-28% compared to 38.7% in 2017. The financial guidance
is summarized below:
Financial guidance 2018
DKK 2017 actual 2018 guidance
Revenue 17,234 million 17.2-18.0 billion
EBIT 4,408 million 4.8-5.2 billion
Tax rate 38.7% 26-28%
Forward-looking statements
Forward-looking statements are subject to risks, uncertainties and inaccurate assumptions. This may cause actual
results to differ materially from expectations. Various factors may affect future results, including interest rates and
exchange rate fluctuations, delay or failure of development projects, production problems, unexpected contract
breaches or terminations, governance-mandated or market-driven price decreases for products, introduction of
competing products, Lundbeck’s ability to successfully market both new and existing products, exposure to product
liability and other lawsuits, changes in reimbursement rules and governmental laws, and unexpected growth in
expenses.
Dividend
The Board of Directors proposes to pay a dividend of 61% of net profit for 2017 in line with our pay-out policy of 60-
80%. This corresponds to DKK 8.00 per share. The dividend pay-out is subject to approval at the Annual General
Meeting on 20 March 2018.
Financial targets
Lundbeck introduced the following three financial targets in February 2016 to describe what Lundbeck strives for on
the journey to realize the strategy and to govern the company’s path towards increased profitability and enhanced
cash flow generation.
Key figures Definition 2017 actual Financial target
EBIT margin (%) Profit from operations as a percentage of revenue 25.6%* 25%
ROIC (%) Profit from operations (EBIT) after tax as a
percentage of average invested capital 30.8% 25%
Cash to earnings Free cash flow exclusive of changes in cash
equivalence, as a percentage of net profit 141.8% >90%
*) Adjusted for gains from divestiture of properties of DKK 242 million, the EBIT margin was 24.2%

FINANCIAL REPORT FOR THE PERIOD 1 JANUARY TO 31 DECEMBER 2017 Page 5
Corporate Release No 637/2018
Revenue
Revenue for 2017 reached DKK 17,234 million compared to DKK 15,634 million for 2016. The increase of 10%
(12% in local currencies) is primarily driven by Brintellix/Trintellix, Northera, Onfi and Rexulti.
Revenue - products and regions
DKK million FY
2017 FY
2016 Growth
Growth in local
currencies Q4
2017 Q4
2016 Growth
Growth in local
currencies Q3
2017
Abilify Maintena 1,331 1,114 19% 21% 336 309 9% 12% 336
Brintellix/Trintellix 1,662 1,105 50% 52% 467 332 41% 47% 417
Cipralex/Lexapro 2,369 2,518 (6%) (4%) 525 610 (14%) (10%) 558
Northera 1,644 1,087 51% 55% 456 313 46% 56% 472
Onfi 3,022 2,409 25% 28% 807 636 27% 35% 767
Rexulti 1,247 826 51% 54% 336 271 24% 32% 337
Sabril 1,509 1,342 12% 14% 366 406 (10%) (3%) 370
Xenazine 1,049 1,571 (33%) (32%) 232 390 (40%) (37%) 272
Other pharmaceuticals 3,002 3,337 (10%) (8%) 690 820 (16%) (13%) 733
Other revenue 399 325 23% 24% 177 78 128% 131% 86
Total revenue 17,234 15,634 10% 12% 4,392 4,165 5% 11% 4,348
North America 10,672 9,122 17% 19% 2,796 2,556 9% 17% 2,761
International Markets 3,345 3,275 2% 5% 731 818 (11%) (5%) 804
Europe 2,818 2,912 (3%) (4%) 688 713 (3%) (5%) 697
Abilify Maintena (aripiprazole once-monthly injection) for the treatment of schizophrenia and in the U.S. also for
bipolar I disorder, shows steady growth. Sales grew 19% and reached DKK 1,331 million. Abilify Maintena was
discovered by Otsuka Pharmaceutical Co., Ltd. (Otsuka), and is co-marketed by Lundbeck and became available
to patients in 2013.
Revenue from Brintellix/Trintellix (vortioxetine) for the treatment of major depression (MDD) reached DKK 1,662
million following a growth of 50%. In the U.S., Trintellix is co-marketed by Takeda Pharmaceutical Company Limited
(Takeda).
Cipralex/Lexapro (escitalopram) for the treatment of depression declined 6% due to generic competition and
revenue reached DKK 2,369 million.
Northera (droxidopa) for the treatment of symptomatic neurogenic orthostatic hypotension (nOH) was launched in
the U.S. in 2014. Sales from Northera showed strong growth of 51% and reached DKK 1,644 million.
Onfi (clobazam) for the treatment of Lennox-Gastaut syndrome continues to show strong growth and generated
revenue of DKK 3,022 million, an increase of 25% compared to 2016.
Rexulti (brexpiprazole) is approved by the U.S. FDA (Food and Drug Administration) as an adjunctive therapy for
the treatment of adults with major depressive disorder and as a treatment for adults with schizophrenia and became
available to patients in the U.S. in early August 2015 and in Canada in April 2017. Rexulti was co-developed and is

FINANCIAL REPORT FOR THE PERIOD 1 JANUARY TO 31 DECEMBER 2017 Page 6
Corporate Release No 637/2018
co-marketed by Otsuka and Lundbeck. Lundbeck’s share of revenue reached DKK 1,247 million for the period
corresponding to a growth of 51%.
Sabril (vigabatrin) for the treatment of refractory complex partial seizures (rCPS) and infantile spasms (IS) saw the
first generic introduction in the third quarter of 2017. Revenue reached DKK 1,509 million, thereby increasing 12%
in 2017 compared to 2016. Lundbeck has the marketing rights for Sabril in the U.S.
Xenazine (tetrabenazine) for the treatment of chorea associated with Huntington’s disease saw the first generic
introductions in the third quarter of 2015 which impacted sales negatively. Revenue reached DKK 1,049 million
compared to DKK 1,571 million in 2016, a decline of 33%. Lundbeck has the marketing rights for Xenazine in the
U.S.
Revenue from Other pharmaceuticals, which comprise the remainder of Lundbeck’s products, was DKK 3,002
million compared to DKK 3,337 million in 2016. Other pharmaceuticals are negatively impacted by the generic
competition on Azilect® (rasagiline) and Ebixa® (memantine) in Europe, which is partly offset by growth in other
mature products. Azilect for the treatment of Parkinson’s disease realized revenue of around DKK 200 million.
Other revenue, which mainly consists of contract manufacturing, reached DKK 399 million compared to DKK 325
million for 2016.
Figure 1 – Revenue per region 2017 vs 2016 (excluding Other revenue)
Key developments in the fourth quarter of 2017
In the fourth quarter of 2017, revenue grew 5% and reached DKK 4,392 million compared to DKK 4,165 million the
year before as decline in sales of Xenazine was more than mitigated by growth of products such as
Brintellix/Trintellix, Northera, Onfi and Rexulti. In local currencies, revenue was up 11%.
North America
Revenue reached DKK 10,672 million in 2017 which is an increase of 17% compared to DKK 9,122 million in 2016.
The growth was mainly driven by the uptake of Trintellix, Rexulti, Onfi and Northera, offsetting the decline in sales
of Xenazine. Overall, there has been limited impact from currencies. North America constitutes 63% of revenue
(excluding Other revenue) compared to 60% last year.

FINANCIAL REPORT FOR THE PERIOD 1 JANUARY TO 31 DECEMBER 2017 Page 7
Corporate Release No 637/2018
Revenue – North America
DKK million FY
2017 FY
2016 Growth
Growth in local
currencies Q4
2017 Q4
2016 Growth
Growth in local
currencies Q3
2017
Abilify Maintena 591 526 12% 14% 161 152 6% 12% 145
Trintellix 974 706 38% 42% 283 208 36% 48% 252
Northera 1,644 1,087 51% 55% 456 313 46% 56% 472
Onfi 3,022 2,409 25% 28% 807 636 27% 35% 767
Rexulti 1,245 826 51% 54% 335 271 23% 31% 336
Sabril 1,509 1,342 12% 14% 366 406 (10%) (3%) 370
Xenazine 1,016 1,557 (35%) (34%) 221 387 (43%) (39%) 262
Other pharmaceuticals 671 669 0% 1% 167 183 (9%) (6%) 157
Total revenue 10,672 9,122 17% 19% 2,796 2,556 9% 17% 2,761
Abilify Maintena revenue grew 12% (14% in local currencies) for the year and reached DKK 591 million in 2017,
which represents Lundbeck’s share of total net sales. In both the U.S. and Canada, Abilify Maintena has a market
share of around 20% in value.
Trintellix sales reached DKK 974 million for Lundbeck following a growth of 38% (42% in local currencies). In the
U.S., Trintellix’ share of branded TRx (total prescriptions) volume increased significantly to 48.6% following the loss
of exclusivity of Pfizer’s Pristiq (desvenlafaxine). The share of branded NRx (new prescriptions) volume reached
50.4% by the end of 2017. The value market share in the U.S. was 16.6% by November 2017.
Northera was made available in the U.S. in the autumn of 2014. Sales from Northera reached DKK 1,644 million
corresponding to a growth of 51% (55% in local currency).
Onfi reached revenue of DKK 3,022 million corresponding to a growth of 25% (28% in local currency).
Lundbeck’s Rexulti revenue reached DKK 1,245 million following a growth of 51% (54% in local currencies). Rexulti
had a 10.5% value market share in the U.S. by November 2017. The share of the total atypical market in the U.S.
reached 1.1%. Patient data suggest that more than ¾ of prescriptions are prescribed for MDD. Rexulti has had
close to 33,000 writers since launch. In February 2017, Lundbeck and Otsuka announced that Health Canada issued
a Notice of Compliance for Rexulti for the treatment of schizophrenia and the product became commercially
available in Canada during the second quarter.
Sabril revenue for the period was DKK 1,509 million, growing 12% (14% in local currency). In September 2017, the
first generic vigabatrin (oral solution) was introduced and by the end of 2017, generic vigabatrin had 27% of the total
sales in volume.
Revenue from Xenazine was DKK 1,016 million. Revenue decreased 35% compared to the previous year.
Performance was impacted by the introduction of generic products and by the end of 2017, generic tetrabenazine
had 75% of the sales in volume.
Key developments in the fourth quarter of 2017
Revenue reached DKK 2,796 million in the fourth quarter of 2017, which is an increase of 17% in local currencies,
or 9% reported. North America continues its solid growth, thereby confirming this market’s strategic importance for
Lundbeck. Sales of Sabril and Xenazine continue to perform better than expected. Revenue in North America
contributed 67% of revenue (excluding Other revenue) compared to 63% in the same period last year. In the quarter,

FINANCIAL REPORT FOR THE PERIOD 1 JANUARY TO 31 DECEMBER 2017 Page 8
Corporate Release No 637/2018
Treanda in Canada has been handed back to Teva and replaced by a royalty agreement. In 2017, Treanda realized
revenues of around DKK 260 million.
International Markets
Revenue from International Markets, which comprise all Lundbeck’s markets outside of Europe and North America,
reached DKK 3,345 million in 2017, compared to DKK 3,275 million in 2016. In local currencies, sales were up 5%
following the positive underlying performance driven by Abilify Maintena and Brintellix. International Markets
constitutes 20% of revenue (excluding Other revenue) compared to 21% last year. The biggest markets are China,
Japan, Brazil, South Korea, Australia and Mexico.
Revenue – International Markets
DKK million FY
2017 FY
2016 Growth
Growth in local
currencies Q4
2017 Q4
2016 Growth
Growth in local
currencies Q3
2017
Abilify Maintena 103 80 27% 29% 28 24 12% 18% 27
Brintellix 307 179 71% 75% 78 57 38% 49% 71
Cipralex/Lexapro 1,554 1,571 (1%) 2% 334 381 (12%) (6%) 360
Ebixa 460 486 (5%) (1%) 76 111 (31%) (27%) 112
Other pharmaceuticals 921 959 (4%) (1%) 215 245 (13%) (8%) 234
Total revenue 3,345 3,275 2% 5% 731 818 (11%) (5%) 804
Abilify Maintena has so far been launched in Australia, Israel and Kuwait and reached revenue of DKK 103 million
in 2017.
Brintellix reached DKK 307 million in revenue following an increase of 71% mainly driven by Brazil following the
launch in March 2016. Brintellix also sees solid growth in countries such as South Korea and Turkey. Brintellix has
been approved by the China Food and Drug Administration. Already today Lundbeck is the market leader in the
anti-depressant market in China as approximately 26% of all medicines prescribed for treating depression in China
are invented by Lundbeck. The expected launch of Brintellix in the second quarter of 2018 will enable Lundbeck to
make an even bigger difference for the many patients and caregivers affected by depression in China. The product
has been launched in some 20 countries in the region including Australia, Mexico, Saudi Arabia and South Africa.
Cipralex/Lexapro generated revenue of DKK 1,554 million. Sales declined 1% compared to the same period the
previous year but grew 2% in local currencies as sales growth in countries such as Brazil, Japan and South Korea
mitigated the sales decline in countries such as Saudi Arabia and Turkey. China realized a modest decline, but in
local currency underlying sales increased by 11%. In Japan, Lexapro has a value share of around 17%.
Ebixa generated revenue of DKK 460 million representing a decline of 5% (1% in local currencies).
Other pharmaceuticals generated revenue of DKK 921 million, a decrease of 4% compared to 2016. The decrease
is explained by quarterly fluctuations and is not a permanent trend in the region. In China, however, sales have
been slightly negatively impacted by generic erosion of Deanxit, an antidepressant sold by China Medical System
Holdings Ltd. on license from Lundbeck.
Rexulti has been approved for the treatment of schizophrenia in Australia in June 2017 and the product was
launched during the third quarter. Rexulti has been submitted for approval in countries such as Brazil, Chile,
Malaysia, Mexico, Saudi Arabia and South Africa during 2017. Azilect was approved by the Chinese FDA in late
June 2017 and has been launched in October 2017 by Lundbeck. Parkinson’s disease is the second most common

FINANCIAL REPORT FOR THE PERIOD 1 JANUARY TO 31 DECEMBER 2017 Page 9
Corporate Release No 637/2018
neurodegenerative disease following Alzheimer's disease. Both Rexulti and Azilect is currently included in Other
pharmaceuticals for this region.
Key developments in the fourth quarter of 2017
Revenue in the fourth quarter was DKK 731 million, corresponding to a decline of 11% reported, but 5% in local
currencies. Brintellix sees solid growth in Brazil, but is impacted by large tender orders from Saudi Arabia in the
second quarter of 2017. Additionally, Brintellix has been approved in China and launch is expected in the early part
of 2018. Sales of Ebixa in China were negatively impacted by quarterly fluctuation following stocking in the first
quarter of 2017. In the fourth quarter, International Markets constituted 17% of revenue (excluding Other revenue)
representing a decline compared to 20% in 2016.
Europe
Revenue reached DKK 2,818 million in 2017, which was a slight decline of 3% compared to DKK 2,912 million in
2016. The decline is a result of generic erosion on mature products. Adjusted for Azilect, Lundbeck realized a growth
of 1% as newer products are replacing the sales decline for other mature products. Europe constitutes 17% of
revenue (excluding Other revenue) compared to 19% last year.
Revenue – Europe
DKK million FY
2017 FY
2016 Growth
Growth in local
currencies Q4
2017 Q4
2016 Growth
Growth in local
currencies Q3
2017
Abilify Maintena 637 508 26% 27% 147 133 11% 11% 164
Brintellix 381 220 73% 67% 106 67 59% 42% 94
Cipralex 648 760 (15%) (16%) 153 185 (18%) (19%) 159
Other pharmaceuticals 1,152 1,424 (19%) (19%) 282 328 (14%) (14%) 280
Total revenue 2,818 2,912 (3%) (4%) 688 713 (3%) (5%) 697
Abilify Maintena has been launched in all major markets in Europe. Sales uptake of Abilify Maintena is solid with
sales reaching DKK 637 million. In Europe, the penetration of long-acting atypical antipsychotics is generally higher
than seen in the U.S. (volume) and Abilify Maintena has a value share of 15-20% in most markets. France, Germany,
Italy, Spain and the UK are the largest European markets for Abilify Maintena.
Brintellix grew 73% thereby reaching DKK 381 million and has been launched in most European markets. Brintellix
realized solid growth in main countries such as France, Italy and Spain where the product has achieved value market
shares of 4.5%, 5.7% and 4.2%, respectively by December 2017.
In March 2017, Lundbeck and Otsuka announced that the European Medicines Agency (EMA) has accepted for
review a Marketing Authorisation Application (MAA) for brexpiprazole to treat schizophrenia in adults. The EMA is
anticipated to complete its review by mid-2018. If the EMA grants regulatory approval to brexpiprazole, the brand
name of the product in the EU will be Rxulti®.
Revenue from Other pharmaceuticals was DKK 1,152 million, a decline of 19% compared to 2016, following
continued generic erosion of mature products such as Azilect and Ebixa. Selincro realized around DKK 170 million
in revenue in 2017.
Key developments in the fourth quarter of 2017
In the fourth quarter, revenue reached DKK 688 million which was a decrease of 3% compared to DKK 713 million
in 2016. The decline in Europe can be explained by seasonal fluctuations, especially in countries such as Italy and
France as well as erosion of mature products following the loss of exclusivity. Europe constitutes 16% of revenue

FINANCIAL REPORT FOR THE PERIOD 1 JANUARY TO 31 DECEMBER 2017 Page 10
Corporate Release No 637/2018
(excluding Other revenue) compared to 17% last year. In the fourth quarter of 2017 revenue from Azilect amounted
to DKK 25 million following the handback to Teva in 2016 after which revenue has been replaced by royalties.
Expenses and income
Total costs in 2017 were DKK 13,068 million compared to DKK 13,342 million for 2016 – a decline of 2%.
Distribution of costs
DKK million FY 2017 FY 2016 Growth Q4 2017 Q4 2016 Growth Q3 2017
Cost of sales 3,881 4,082 (5%) 968 1,042 (7%) 956
COS-ratio 22.5% 26.1% - 22.0% 25.0% - 22.0%
Sales and distribution 5,649 5,488 3% 1,455 1,418 3% 1,330
S&D-ratio 32.8% 35.1% - 33.1% 34.1% - 30.6%
Administration 833 805 3% 257 240 7% 198
G&A-ratio 4.8% 5.1% - 5.9% 5.8% - 4.6%
Research and development 2,705 2,967 (9%) 780 714 9% 651
R&D-ratio 15.7% 19.0% - 17.8% 17.1% - 15.0%
Total costs 13,068 13,342 (2%) 3,460 3,414 1% 3,135
Cost of sales decreased 5% to DKK 3,881 million in 2017. This corresponds to 22.5% of total revenue compared
to 26.1% in the previous year. Cost of sales is positively impacted by the change in product mix which reduces the
royalty costs. Furthermore, intangible amortization has declined from DKK 1,045 million in 2016 to DKK 949 million
in 2017.
Sales and distribution costs were DKK 5,649 million, which was an increase of 3% compared to 2016. The
increase is mainly due to additional spend on DTC promotion and higher distribution costs in the U.S. partly offset
by sales force savings in Europe. Sales and distribution costs correspond to 32.8% of revenue compared to 35.1%
the year before.
Administrative expenses were stable at DKK 833 million corresponding to 4.8% of total revenue in 2017.
SG&A costs were DKK 6,482 million compared to DKK 6,293 million in 2016. The SG&A ratio for the period was
37.6%, compared to 40.2% in the same period the year before.
Research and development costs declined to DKK 2,705 million for the year because of fewer ongoing late-stage
trials compared to last year. The R&D ratio reached 15.7% compared to 19.0% last year.
Other operating income amounted to DKK 242 million and represented the gain from divestment of office and
research facilities in the U.S. and in Copenhagen, recognized in the first and third quarter of 2017. The payment
regarding divestment of properties in Copenhagen of DKK 378 million was received in December 2017.
Key developments in the fourth quarter of 2017
In the fourth quarter of 2017, total costs amounted to DKK 3,460 million, which is an increase of 1% compared to
the same quarter last year.

FINANCIAL REPORT FOR THE PERIOD 1 JANUARY TO 31 DECEMBER 2017 Page 11
Corporate Release No 637/2018
Depreciation, amortization and impairment charges
Depreciation, amortization and impairment charges, which are included in the individual expense categories,
amounted to DKK 1,258 million in 2017 compared to DKK 1,554 million the previous year.
Depreciation, amortization and impairment charges
DKK million FY 2017 FY 2016 Growth Q4 2017 Q4 2016 Growth Q3 2017
Cost of sales 1,090 1,258 (13%) 276 351 (21%) 268
Sales and distribution 47 46 1% 12 12 0% 11
Administration 27 22 24% 6 6 12% 7
Research and development 94 228 (59%) 28 42 (35%) 22
Total depreciation, amortization and
impairment charges 1,258
1,554
(19%)
322
411
(22%)
308
Profit from operations (EBIT)
EBIT for 2017 reached DKK 4,408 million compared to DKK 2,292 million for the same period last year. The EBIT
margin increased significantly and reached 25.6% in 2017 compared to 14.7% last year. EBIT was positively
impacted by Other operating income of DKK 242 million. There is a modest negative currency impact on EBIT for
the period.
Core EBIT increased by 47% to DKK 5,115 million and the Core EBIT margin improved to 29.7% in 2017. The
increase in EBIT and in Core EBIT is driven by strong sales especially in North America, more than offsetting the
loss in revenue due to generic erosion on mature products, and benefits from the restructuring programme initiated
in 2015.
Key developments in the fourth quarter of 2017
In the fourth quarter of 2017, EBIT amounted to DKK 932 million, which is an increase of 24% compared to the
same quarter last year. The EBIT margin increased from 21.2% in the quarter compared to 18.0% last year.
For definition of the measures “Core Revenue”, “Core EBIT” and “Core EPS”, see note 3 Core reporting.
Net financials
Lundbeck generated a net financial expense of DKK 131 million for 2017, compared to a net financial expense of
DKK 135 million for 2016.
Net interest expense, including realized and unrealized gains and losses on the bond portfolio, amounted to an
expense of DKK 86 million for 2017, compared to an expense of DKK 50 million in 2016. The increased cost in 2017
is primarily related to fees for early repayment of mortgage debt in 2017.
Net exchange gains/losses amounted to a loss of DKK 33 million for 2017, compared to a loss of DKK 73 million
in 2016. The loss in 2016 was primarily related to the recognition of an exchange loss relating to the devaluation in
Venezuela.
Tax
The reported tax rate has decreased from 43.9% in 2016 to 38.7% in 2017. The rate is higher than the Danish
corporate income tax rate for the following reasons:
• Lundbeck’s activity in the U.S. results in a significant profit generated in the U.S. and taxed at a higher
tax rate in 2017 than the Danish tax rate

FINANCIAL REPORT FOR THE PERIOD 1 JANUARY TO 31 DECEMBER 2017 Page 12
Corporate Release No 637/2018
• Amortization of Northera product rights, which is not deductible for tax purposes and thus creates a
permanent difference
• Orphan tax credits on Northera phase IV partly offsets the negative effect of the amortizations in 2017
Net profit and EPS for the period
Net profit for 2017 reached DKK 2,624 million compared to DKK 1,211 million last year. The reported net profit
corresponds to an EPS of DKK 13.28 per share versus an EPS of DKK 6.12 per share for last year. Core EPS was
DKK 16.50 per share for 2017, compared to a Core EPS of DKK 11.09 per share in 2016 – a growth of 49%.
In the fourth quarter of 2017, Net profit increased by 17% y/y thereby reaching DKK 553 million. Core EPS
increased from DKK 3.50 to DKK 3.81, representing a growth of 9%.
Hedging
Lundbeck hedges expected income from its products through currency hedging on a rolling basis, up to 18 months
in advance. As a result of Lundbeck's currency hedging policy, foreign exchange gains and losses on hedging
transactions are allocated directly to the hedged transaction. Hedging had a positive impact of DKK 33 million for
2017, compared with a situation where the income is not hedged and included at the current exchange rates during
the period. The effect was negative with DKK 15 million for the full year 2016.
Cash flow
Cash flows from operating activities amounted to DKK 4,045 million, against DKK 3,126 million in 2016. The
increase of 29% follows the significant increase in profitability, slightly muted by seasonality in working capital and
by increased income taxes paid.
Lundbeck’s net cash outflow from investing activities reached DKK 1,830 million in 2017 compared to DKK 337
million last year. The increase was mainly due to investments in securities and a milestone payment to Otsuka
following the U.S. FDA approval of Abilify Maintena for the maintenance treatment of bipolar I disorder. The free
cash flow reached DKK 2,215 million for the period compared to DKK 2,789 million for 2016.
In 2017 repayment of loans and dividend payout (net) amounted to DKK 1,873 million and DKK 483 million,
respectively. Net cash flow for the period declined from DKK 783 million in 2016 to a cash outflow of DKK 20 million
in 2017. In the fourth quarter 2017, the net cash flow reached DKK 71 million compared to DKK 412 million in the
fourth quarter of 2016.
In 2017, Lundbeck has increased its share capital by DKK 7 million due to employees’ exercise of warrants. The
total proceed to the company was DKK 214 million.
At the Annual General Meeting in March 2017, the proposed dividend for 2016 of DKK 2.45 per share or DKK 484
million was approved. The dividend was paid to the shareholders in April 2017.
Balance sheet
At 31 December 2017, Lundbeck’s total assets amounted to DKK 19,756 million, compared to DKK 20,210 million
at the end of 2016.

FINANCIAL REPORT FOR THE PERIOD 1 JANUARY TO 31 DECEMBER 2017 Page 13
Corporate Release No 637/2018
At 31 December 2017, Lundbeck's equity amounted to DKK 12,181 million, corresponding to an equity ratio of
61.7% compared to 48.0% at the end of 2016.
Interest bearing debt has been reduced to DKK 0 million compared to DKK 1,891 million at the end of 2016. Net
cash has increased from DKK 326 million at year-end 2016 to DKK 3,677 million at the end of 2017.
To fund Lundbeck’s long-term incentive programmes granted to key employees in Denmark and abroad, Lundbeck
purchased 290,000 shares at a value of DKK 93 million in 2017.
Lundbeck's development portfolio
Lundbeck is developing a number of new and promising pharmaceuticals for the treatment of psychiatric and
neurological disorders within the indications of Alzheimer’s, depression, Parkinson’s and schizophrenia. Pipeline
developments are summarized below.
Aripiprazole for prolonged release injectable suspension (Abilify Maintena)
• Abilify Maintena is an atypical anti-psychotic for intra-muscular, once-monthly use and a dopamine D2
partial agonist
• Abilify Maintena was approved in the U.S. and in Europe in February and November 2013, respectively,
for the treatment of adults with schizophrenia
• Abilify Maintena was invented by Otsuka in Japan and has been co-developed and co-commercialized by
the alliance between Otsuka and Lundbeck
November 2017: Lundbeck Canada and Otsuka Canada Pharmaceutical announced that Health Canada issued a
Notice of Compliance for Abilify Maintena, approving a new indication for the maintenance monotherapy treatment
of bipolar I disorder in adult patients.
July 2017: Lundbeck and Otsuka announced the U.S. FDA approval of Abilify Maintena for the maintenance
monotherapy treatment of bipolar I disorder (BP-I). The approval is based on results from a 52-week, phase III,
double-blind, randomized-withdrawal study in adults (aged 18 to 65) with BP-I (NCT01567527).
June 2017: Lundbeck together with Otsuka, initiated a phase I, open-label study to determine the pharmacokinetics
and tolerability of aripiprazole 2-month intramuscular depot administered gluteal in adult subjects with
schizophrenia.
Brexpiprazole (Rexulti)
• The efficacy of brexpiprazole may be mediated through a combination of partial agonist activity at serotonin
5-HT1A and dopamine D2 receptors, and antagonist activity at serotonin 5-HT2A receptors. Brexpiprazole
exhibits high affinity (sub-nanomolar) for these receptors as well as for noradrenaline alpha1B/2C receptors
• Brexpiprazole was approved by the U.S. FDA in July 2015 for treating patients with schizophrenia and as
an adjunctive treatment for patients with MDD
• Brexpiprazole was also approved in February 2017 by Health Canada, and in May 2017 by the Australian
Department of Health, for the treatment of schizophrenia
• Brexpiprazole is distributed and marketed under the brand name Rexulti
• Brexpiprazole was discovered by Otsuka and is being co-developed and co-commercialized by Otsuka
and Lundbeck

FINANCIAL REPORT FOR THE PERIOD 1 JANUARY TO 31 DECEMBER 2017 Page 14
Corporate Release No 637/2018
November 2017: Lundbeck and Otsuka announced that the two companies will initiate a third clinical phase III study
for brexpiprazole in the treatment of agitation in patients with dementia of the Alzheimer's type. The trial is expected
to commence during the first half of 2018.
October 2017: Lundbeck and Otsuka announced that patient enrolment has been initiated in two global phase III
clinical trials (NCT03259555 and NCT03257865) to evaluate brexpiprazole for the treatment of patients with manic
episodes associated with bipolar I disorder. Both studies are expected to recruit around 320 patients and is planned
to finalize around year-end 2018.
May 2017: Lundbeck and Otsuka announced top-line results from two pivotal studies with brexpiprazole in
individuals with agitation associated with dementia of the Alzheimer’s type (NCT01862640, NCT01922258). In both
studies, patients treated with brexpiprazole showed improvements in symptoms of agitation relative to placebo. In
the first study, the improvements in the primary endpoint of CMAI for 2 mg brexpiprazole were statistically better
than placebo (p<0.05) and appeared more robust than the improvements on the key secondary endpoint of CGI-S
(p>0.05). In the second study, the improvements in the primary endpoint of CMAI (p>0.05) appeared less robust
than the improvements on the key secondary endpoint of CGI-S (p<0.05). Regarding safety and tolerability, both
studies confirmed the profile of brexpiprazole as observed in the clinical trials for schizophrenia and for adjunctive
treatment of major depressive disorder. U.S. FDA has granted Fast Track designation for this programme.
March 2017: Lundbeck and Otsuka announced that the European Medicines Agency (EMA) has accepted for review
a Marketing Authorisation Application (MAA) for brexpiprazole to treat schizophrenia in adults. If the EMA grants
regulatory approval to brexpiprazole, the brand name of the product in the EU will be Rxulti®.
January 2017: A phase II trial (NCT03033069) using brexpiprazole as monotherapy or as combination therapy in
the treatment of adults with Post-traumatic Stress Disorder (PTSD) was initiated. The study is expected to enrol
around 330 patients.
January 2017: A phase I open-label study (NCT02968121) to determine the pharmacokinetics and tolerability of
brexpiprazole LAI (long-acting injectable) administered subcutaneously or intramuscularly was initiated. Part A of
the study was completed per protocol. Evaluation of Part A data and subsequent clinical program is ongoing.
Vortioxetine (Brintellix/Trintellix)
• Vortioxetine is an inhibitor of serotonin (5-HT) reuptake and that is thought to be a mechanism of its action.
It is also an agonist at 5-HT1A receptors, a partial agonist at 5-HT1B receptors and an antagonist at 5-HT3,
5-HT1D and 5-HT7 receptors
• Vortioxetine is considered to be the first and only compound with this combination of pharmacodynamic
activity. The clinical relevance of this is unknown
• Vortioxetine was discovered by Lundbeck researchers in Copenhagen, Denmark. The clinical trial program
in the U.S. was conducted jointly by Lundbeck and Takeda, and Takeda holds the new drug application for
the U.S. market
• The U.S. FDA approved vortioxetine for the treatment of MDD in adults in 2013. Vortioxetine is furthermore
approved in more than 60 markets (including Europe, Brazil, Canada, Chile, China, Mexico, Argentina,
South Korea, Turkey, Australia, Hong Kong, Singapore and South Africa)

FINANCIAL REPORT FOR THE PERIOD 1 JANUARY TO 31 DECEMBER 2017 Page 15
Corporate Release No 637/2018
December 2017: Lundbeck announced that it further enhances its leading position within treatments for Major
Depressive Disorder (depression) in China as Brintellix (vortioxetine) has been approved by the China Food and
Drug Administration.
June 2017: Lundbeck and Takeda announced that after providing additional analysis, the U.S. FDA issued a second
Complete Response Letter (CRL) regarding the supplemental new drug application (sNDA) to include new data in
the clinical trials section of the U.S. prescribing information of vortioxetine for treating aspects of cognitive
dysfunction in adults with MDD.
April 2015: Takeda started a clinical phase III study (NCT02389816) with vortioxetine in Japanese individuals. The
study is planned to recruit 480 patients who will receive vortioxetine (10 or 20 mg) or placebo. The study is expected
to be finalized in 2018.
Nalmefene (Selincro)
• Nalmefene is an opioid receptor antagonist
• Nalmefene has been marketed in Europe by Lundbeck since April 2013 under the brand name Selincro®
as treatment for the reduction of alcohol consumption
• In October 2013, Otsuka was named as Lundbeck’s partner for nalmefene in Japan
• A clinical phase III study (NCT02364947) was initiated in Japan in December 2014
• It is estimated that 800,000 people in Japan have been diagnosed with alcohol dependency
October 2017: Lundbeck (Japan) and Otsuka announced the Japanese submission by Otsuka of a new drug
application (NDA) for nalmefene for patients with alcohol dependency.
June 2017: Lundbeck (Japan) and Otsuka announced positive topline results from the comparative clinical trial and
a follow-on, long-term extension study in participants with an alcohol dependency.
Lu AF35700
• Lu AF35700 has a novel pharmacological profile with predominant D1 vs. D2 dopamine receptor
occupancy, and a high occupancy of 5-HT2A and 5-HT6 serotonin receptors
• The relatively low dopamine D2 receptor occupancy of Lu AF35700 is expected to result in reduced burden
of adverse events, such as extrapyramidal symptoms (EPS), prolactin elevation, dysphoria/anhedonia,
and depressed mood
• In completed safety trials, Lu AF35700 was generally well tolerated with a beneficial safety profile
• U.S. FDA has granted Fast Track designation for Lu AF35700 - a first important step to ensure a potential
expedited approval of the compound
July 2017: Lundbeck initiated the Anew-study (NCT03230864) to evaluate the efficacy of 10 mg/day Lu AF35700
on symptoms of schizophrenia in patients with early-in-disease (ED) or late-in-disease (LD) treatment-resistant
schizophrenia. The study is expected to recruit around 300 patients and is planned to finalize during first half of
2019.
August 2016: Lundbeck initiated an open-label, flexible-dose, long-term safety study of Lu AF35700 in adult patients
with schizophrenia (NCT02892422).

FINANCIAL REPORT FOR THE PERIOD 1 JANUARY TO 31 DECEMBER 2017 Page 16
Corporate Release No 637/2018
March 2016: Lundbeck initiated the phase III programme on Lu AF35700 which is currently planned to consist of
two pivotal trials. Two doses of Lu AF35700 (10 and 20 mg) will be tested in patients with treatment resistant
schizophrenia. The first study, DayBreak (NCT02717195) is planned to enrol around 1,000 patients in approximately
15 countries including the U.S. and Canada and is expected to continue into early 2019.
Lu AF20513
• Lu AF20513 is an active vaccine inducing high affinity polyclonal antibodies that target beta-amyloid, for
the potential injectable prevention of progression of Alzheimer's
• Lundbeck is developing Lu AF20513 in a phase I trial in collaboration with Otsuka
• In March 2015, an open-label, dose escalation, multiple immunisation phase I study (NCT02388152) was
initiated, to assess the safety, tolerability and immunogenicity of Lu AF20513 in patients with mild
Alzheimer’s disease
• All 35 patients have been enrolled and the patients are now being studied. The study has been extended
and is expected to finalise by the end of 2018
General corporate matters
Lundbeck is involved in legal proceedings in a number of countries against a number of businesses, including patent
disputes. In the Annual Report 2017 (page 50), Lundbeck provided an overview of pending legal proceedings.
In June 2013, Lundbeck received the European Commission’s decision that the company’s agreements concluded
with four generic competitors concerning citalopram violated competition law. The decision included fining Lundbeck
EUR 93.8 million (approximately DKK 700 million). On 8 September 2016, Lundbeck announced that the General
Court of the European Union had delivered its judgment concerning Lundbeck’s appeal against the European
Commission’s 2013 decision. Lundbeck’s appeal was rejected by the General Court. Lundbeck has appealed the
judgment to the European Court of Justice. Lundbeck paid and expensed the fine in the third quarter of 2013. A final
judgment is expected during 2018.
In December 2011, the Brazilian antitrust authorities SDE (Secretariat of Economic Law) initiated administrative
proceedings to investigate whether Lundbeck’s enforcement of data protection rights could be viewed as
anticompetitive conduct. In January 2012, Lundbeck submitted a response to the authorities. Due to a change in
the Brazilian Antitrust Law, handling of the case has shifted from SDE to CADE (Administrative Council for Economic
Defense) and remains pending.
H. Lundbeck A/S and Lundbeck Canada Inc. are involved in three product liability class-action lawsuits relating to
Cipralex®/Celexa® and four relating to Abilify Maintena in Canada. The cases are in the preliminary stages and as
such associated with significant uncertainties. Lundbeck strongly disagrees with the claims raised.
In January 2016, Lundbeck LLC, USA, received a subpoena from the US Attorney’s Office for the District of Rhode
Island relating to an investigation of Xenazine sales, marketing and related practices. Lundbeck LLC is cooperating
with the relevant authorities on this investigation.
In May 2016, Lundbeck NA Ltd. (formerly known as Chelsea Therapeutics, Inc.) received a subpoena from the US
Attorney’s Office in Boston, Massachusetts, relating to an investigation of payments to charitable organizations
providing financial assistance to patients taking Lundbeck products, and to Northera and Xenazine sales, marketing
and related practices. Lundbeck LLC is cooperating with the relevant authorities on this investigation.

FINANCIAL REPORT FOR THE PERIOD 1 JANUARY TO 31 DECEMBER 2017 Page 17
Corporate Release No 637/2018
Incentive programmes in the Lundbeck Group
In February 2017 Lundbeck initially granted a Restricted Share Unit (RSU) programme to members of Lundbeck´s
Executive Management and to key employees in Denmark and abroad. The RSUs will be finally granted in February
2018 and will vest three years after final grant. A similar programme will be initially granted to members of
Lundbeck´s Executive Management and key employees (approximately 130) in Denmark and abroad in February
2018. Grant and vesting are subject to Lundbeck achieving certain targets specified by the Board of Directors and
to continued employment with the Lundbeck Group in the period from initial grant until the RSUs vest. The fair value
of the RSUs will be calculated on the basis of Lundbeck’s average share price in the first 10 banking days after
publication of Lundbeck’s annual report for 2017 reduced by an expected dividend yield of 2.00% p.a. The estimated
value of the programme will be approximately DKK 40 million.
Purchase of shares to fund long-term incentive programmes
To fund Lundbeck's long-term incentive programme, granted in 2014 and which vested in 2017, 170,000 shares
were purchased in 2017.
The estimated number of shares a total of 120,000 to cover the obligation regarding the 2017 RSU programme were
purchased in 2017.
To cover the RSU programme that will be initially granted to key employees in Denmark and abroad in February
2018, Lundbeck will purchase shares at a value of approximately DKK 40 million. The number of shares to be
purchased will be dependent on Lundbeck’s average share price in the first 10 banking days after publication of
Lundbeck’s annual report for 2017. The number of shares to be purchased corresponds to less than 0.1% of
Lundbeck’s share capital. The shares are intended to be purchased during 2018 and in compliance with applicable
legislation.
Considering the relatively small number of shares concerned, the purchase will be carried out as a share buy-back
outside of the EU Commission Regulation on share buy-back. However, to secure market integrity the purchase is
subject to the following rules:
• The purchase will be carried out by a bank (lead manager) on an arm’s-length basis and independently
of Lundbeck
• The bank must not purchase shares at a price higher than the higher of the price of the last
independent trade and the highest current independent bid on Nasdaq Copenhagen at the time of the
purchase
• The bank must not purchase more than 20% of the daily volume of the shares on NASDAQ
Copenhagen on the day the purchase is carried out.
Conference call
Today at 13:00 CET, Lundbeck will be hosting a conference call for the financial community. You can listen to the
call online at www.lundbeck.com under the investor section.

FINANCIAL REPORT FOR THE PERIOD 1 JANUARY TO 31 DECEMBER 2017 Page 18
Corporate Release No 637/2018
FINANCIAL STATEMENTS
Income statement
DKK million FY 2017 FY 2016 Q4 2017 Q4 2016
Revenue 17,234 15,634 4,392 4,165
Cost of sales 3,881 4,082 968 1,042
Gross profit 13,353 11,552 3,424 3,123
Sales and distribution costs 5,649 5,488 1,455 1,418
Administrative expenses 833 805 257 240
Research and development costs 2,705 2,967 780 714
Other operating income 242 - - -
Profit from operations (EBIT) 4,408 2,292 932 751
Net financials (131) (135) (50) (14)
Profit before tax 4,277 2,157 882 737
Tax on profit for the period 1,653 946 329 264
Profit for the period 2,624 1,211 553 473
Earnings per share, basic (EPS) (DKK) 13.28 6.12 2.79 2.39
Earnings per share, diluted (DEPS) (DKK) 13.27 6.11 2.78 2.38
Statement of comprehensive income
DKK million FY 2017 FY 2016 Q4 2017 Q4 2016
Profit for the period 2,624 1,211 553 473
Actuarial gains/losses 33 (42) 33 (42)
Tax (5) 3 (5) 3
Items that will not be reclassified subsequently
to profit or loss
28 (39) 28 (39)
Exchange rate gains/losses on investments in
foreign subsidiaries (447) (180) (69) 138
Exchange rate gains/losses on additions to net
investments in foreign subsidiaries (107) 241 15 139
Deferred exchange gains/losses, hedging 817 (308) 157 (273)
Exchange gains/losses, hedging (transferred to the
hedged items) (33) 15 (49) 26
Exchange gains/losses, transferred from hedging to
financial items - 3 - 3
Fair value adjustment of available-for-sale financial
assets 16 8 8 2
Tax (143) 8 (26) 22
Items that may be reclassified subsequently to
profit or loss 103 (213) 36 57
Other comprehensive income 131 (252) 64 18
Comprehensive income 2,755 959 617 491

FINANCIAL REPORT FOR THE PERIOD 1 JANUARY TO 31 DECEMBER 2017 Page 19
Corporate Release No 637/2018
Balance sheet
DKK million 31.12.2017 31.12.2016
Assets
Intangible assets 7,565 8,839
Property, plant and equipment 1,990 2,162
Financial assets 1,357 1,685
Non-current assets 10,912 12,686
Inventories 1,376 1,528
Receivables 3,791 3,779
Securities 1,522 17
Cash and bank balances 2,155 2,200
Current assets 8,844 7,524
Assets 19,756 20,210
Equity and liabilities
Share capital 995 988
Foreign currency translation reserve 634 1,164
Currency hedging reserve 382 (230)
Retained earnings 10,170 7,772
Equity 12,181 9,694
Provisions 1,039 1,032
Debt 57 1,708
Non-current liabilities 1,096 2,740
Provisions 491 745
Debt - 188
Trade payables 3,203 3,650
Other payables 2,785 3,193
Current liabilities 6,479 7,776
Liabilities 7,575 10,516
Equity and liabilities 19,756 20,210

FINANCIAL REPORT FOR THE PERIOD 1 JANUARY TO 31 DECEMBER 2017 Page 20
Corporate Release No 637/2018
Statement of changes in equity
DKK million Share
capital Share
premium
Foreign currency
translation reserve
Currency hedging reserve
Retained earnings Equity
Equity at 1 January 2017 988 - 1,164 (230) 7,772 9,694
Profit for the period - - - - 2,624 2,624
Other comprehensive income - - (530) 612 49 131
Comprehensive income - - (530) 612 2,673 2,755
Distributed dividends, gross - - - - (484) (484)
Dividends received, treasury shares - - - - 1 1
Capital increase through exercise of warrants 7 - - - 207 214
Buyback of treasury shares - - - - (93) (93)
Incentive programmes - - - - 37 37
Tax on other transactions in equity - - - - 57 57
Other transactions 7 - - - (275) (268)
Equity at 31 December 2017 995 - 634 382 10,170 12,181
DKK million
Equity at 1 January 2016 987 349 1,157 (4) 6,296 8,785
Profit for the period - - - - 1,211 1,211
Other comprehensive income - - 7 (226) (33) (252)
Comprehensive income - - 7 (226) 1,178 959
Capital increase through exercise of warrants 1 36 - - - 37
Buyback of treasury shares - - - - (155) (155)
Incentive programmes - - - - 53 53
Tax on other transactions in equity - - - - 15 15
Reclassified to retained earnings - (385) - - 385 -
Other transactions 1 (349) - - 298 (50)
Equity at 31 December 2016 988 - 1,164 (230) 7,772 9,694

FINANCIAL REPORT FOR THE PERIOD 1 JANUARY TO 31 DECEMBER 2017 Page 21
Corporate Release No 637/2018
Cash flow statement
DKK million FY 2017 FY 2016 Q4 2017 Q4 2016
Profit from operations (EBIT) 4,408 2,292 932 751
Adjustments for non-cash operating items etc. 871 1,154 308 352
Change in working capital 291 463 647 60
Cash flows from operations before financial receipts
and payments 5,570 3,909 1,887 1,163
Financial receipts and payments (96) (63) (48) (17)
Cash flows from ordinary activities 5,474 3,846 1,839 1,146
Income taxes paid (1,429) (720) (492) (113)
Cash flows from operating activities 4,045 3,126 1,347 1,033
Purchase and sale of securities and other financial assets (1,509) (3) (505) -
Purchase and sale of intangible assets and property, plant
and equipment (321) (334) 84 (133)
Cash flows from investing activities (1,830) (337) (421) (133)
Cash flows from operating and investing activities (free
cash flow) 2,215 2,789 926 900
Capital increase through exercise of warrants 214 37 18 -
Dividends paid in the financial year, net (483) - - -
Other financing activities (1,966) (2,043) (873) (488)
Cash flows from financing activities (2,235) (2,006) (855) (488)
Net cash flow for the period (20) 783 71 412
Cash and bank balances at beginning of period 2,200 1,504 2,087 1,785
Unrealized exchange gains/losses on cash and bank
balances (25) (87) (3) 3
Net cash flow for the period (20) 783 71 412
Cash and bank balances at end of period 2,155 2,200 2,155 2,200
Interest-bearing debt, cash, bank balances and
securities, net is composed as follows:
Cash and bank balances 2,155 2,200 2,155 2,200
Securities 1,522 17 1,522 17
Interest-bearing debt - (1,891) - (1,891)
Interest-bearing debt, cash, bank balances and
securities, net end of period – Net cash/(net debt) 3,677 326 3,677 326

FINANCIAL REPORT FOR THE PERIOD 1 JANUARY TO 31 DECEMBER 2017 Page 22
Corporate Release No 637/2018
Income statement – Core results reconciliation (full year)
FY 2017
DKK million Reported
result Intangible
amortization Impairment Major
restructuring
Legal fees and
settlements
Divestments / sales
milestones Core result
Revenue 17,234 - - - - - 17,234
Cost of sales 3,881 (949) - - - - 2,932
Gross profit 13,353 949 - - - - 14,302
Sales and distribution costs 5,649 - - - - - 5,649
Administrative expenses 833 - - - - - 833
Research and development costs 2,705 - - - - - 2,705
Other operating income 242 - - - - (242) -
Profit from operations (EBIT) 4,408 949 - - - (242) 5,115
Net financials (131) - - - - - (131)
Profit before tax 4,277 949 - - - (242) 4,984
Tax on profit for the period 1,653 131 - - - (60) 1,724
Profit for the period 2,624 818 - - - (182) 3,260
Earnings per share, basic (EPS) (DKK) 13.28 4.15 - - - (0.93) 16.50
FY 2016
DKK million Reported
result Intangible
amortization Impairment Major
restructuring
Legal fees and
settlements
Divestments / sales
milestones Core result
Revenue 15,634 - - - - - 15,634
Cost of sales 4,082 (1,045) (10) - - - 3,027
Gross profit 11,552 1,045 10 - - - 12,607
Sales and distribution costs 5,488 - - - - - 5,488
Administrative expenses 805 - - - - - 805
Research and development costs 2,967 - (130) - - - 2,837
Profit from operations (EBIT) 2,292 1,045 140 - - - 3,477
Net financials (135) - - - - - (135)
Profit before tax 2,157 1,045 140 - - - 3,342
Tax on profit for the period 946 169 31 - - - 1,146
Profit for the period 1,211 876 109 - - - 2,196
Earnings per share, basic (EPS) (DKK) 6.12 4.42 0.55 - - - 11.09

FINANCIAL REPORT FOR THE PERIOD 1 JANUARY TO 31 DECEMBER 2017 Page 23
Corporate Release No 637/2018
Income statement – Core results reconciliation (Q4)
Q4 2017
DKK million Reported
result Intangible
amortization Impairment Major
restructuring
Legal fees and
settlements
Divestments / sales
milestones Core result
Revenue 4,392 - - - - - 4,392
Cost of sales 968 (237) - - - - 731
Gross profit 3,424 237 - - - - 3,661
Sales and distribution costs 1,455 - - - - - 1,455
Administrative expenses 257 - - - - - 257
Research and development costs 780 - - - - - 780
Profit from operations (EBIT) 932 237 - - - - 1,169
Net financials (50) - - - - - (50)
Profit before tax 882 237 - - - - 1,119
Tax on profit for the period 329 34 - - - - 363
Profit for the period 553 203 - - - - 756
Earnings per share, basic (EPS) (DKK) 2.79 1.02 - - - - 3.81
Q4 2016
DKK million Reported
result Intangible
amortization Impairment Major
restructuring
Legal fees and
settlements
Divestments / sales
milestones Core result
Revenue 4,165 - - - - - 4,165
Cost of sales 1,042 (263) - - - - 779
Gross profit 3,123 263 - - - - 3,386
Sales and distribution costs 1,418 - - - - - 1,418
Administrative expenses 240 - - - - - 240
Research and development costs 714 - - - - - 714
Profit from operations (EBIT) 751 263 - - - - 1,014
Net financials (14) - - - - - (14)
Profit before tax 737 263 - - - - 1,000
Tax on profit for the period 264 43 - - - - 307
Profit for the period 473 220 - - - - 693
Earnings per share, basic (EPS) (DKK) 2.39 1.11 - - - - 3.50
FINANCIAL REPORT FOR THE PERIOD 1 JANUARY TO 31 DECEMBER 2017 Page 24
Corporate Release No 637/2018
Notes
Note 1 Accounting policies
Lundbeck’s accounting policies are explained in detail in the 2017 Annual Report also published today.
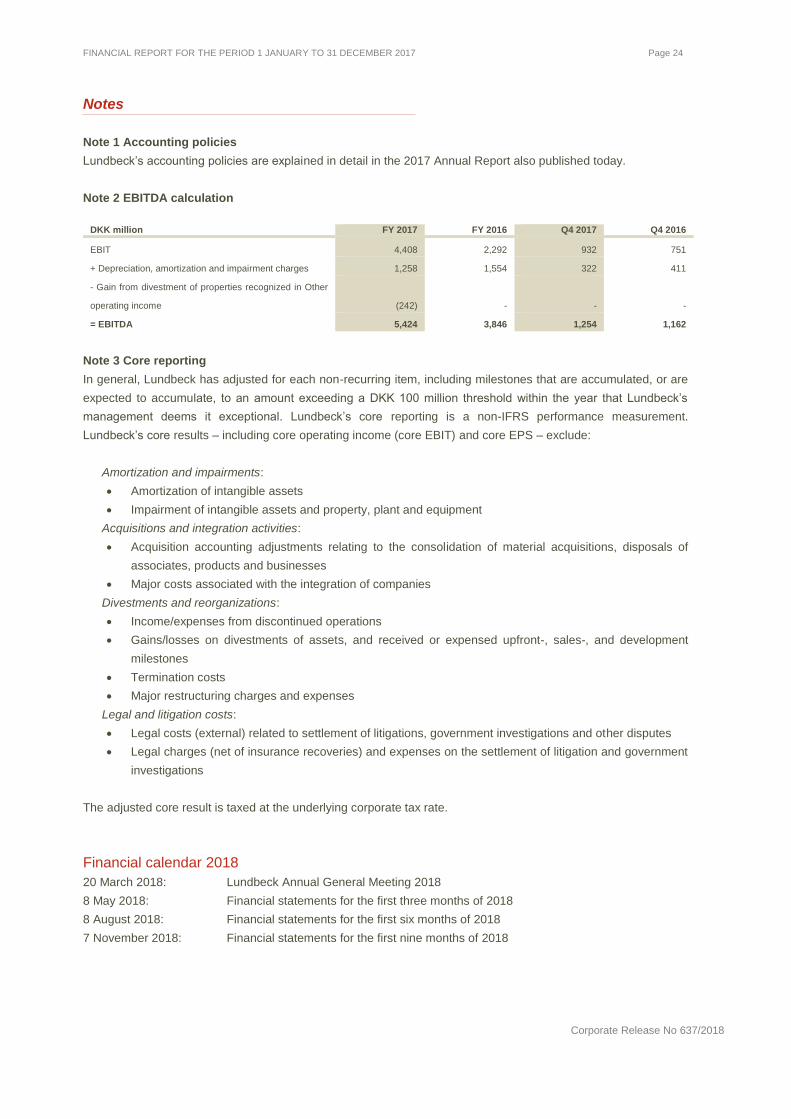
Note 2 EBITDA calculation
DKK million FY 2017 FY 2016 Q4 2017 Q4 2016
EBIT 4,408 2,292 932 751
+ Depreciation, amortization and impairment charges 1,258 1,554 322 411
- Gain from divestment of properties recognized in Other
operating income
(242) -
-
-
= EBITDA 5,424 3,846 1,254 1,162
Note 3 Core reporting
In general, Lundbeck has adjusted for each non-recurring item, including milestones that are accumulated, or are
expected to accumulate, to an amount exceeding a DKK 100 million threshold within the year that Lundbeck’s
management deems it exceptional. Lundbeck’s core reporting is a non-IFRS performance measurement.
Lundbeck’s core results – including core operating income (core EBIT) and core EPS – exclude:
Amortization and impairments:
• Amortization of intangible assets
• Impairment of intangible assets and property, plant and equipment
Acquisitions and integration activities:
• Acquisition accounting adjustments relating to the consolidation of material acquisitions, disposals of
associates, products and businesses
• Major costs associated with the integration of companies
Divestments and reorganizations:
• Income/expenses from discontinued operations
• Gains/losses on divestments of assets, and received or expensed upfront-, sales-, and development
milestones
• Termination costs
• Major restructuring charges and expenses
Legal and litigation costs:
• Legal costs (external) related to settlement of litigations, government investigations and other disputes
• Legal charges (net of insurance recoveries) and expenses on the settlement of litigation and government
investigations
The adjusted core result is taxed at the underlying corporate tax rate.
Financial calendar 2018
20 March 2018: Lundbeck Annual General Meeting 2018
8 May 2018: Financial statements for the first three months of 2018
8 August 2018: Financial statements for the first six months of 2018
7 November 2018: Financial statements for the first nine months of 2018

FINANCIAL REPORT FOR THE PERIOD 1 JANUARY TO 31 DECEMBER 2017 Page 25
Corporate Release No 637/2018
Lundbeck contacts
Investors: Media:
Palle Holm Olesen Mads Kronborg
Vice President, Investor Relations Senior Director, Corporate Communication
[email protected] [email protected]
+45 30 83 24 26 +45 36 43 40 00
About Lundbeck
H. Lundbeck A/S (LUN.CO, LUN DC, HLUYY) is a global pharmaceutical company specialized in psychiatric and
neurological disorders. For more than 70 years, we have been at the forefront of research within neuroscience. Our
key areas of focus are Alzheimer's disease, depression, Parkinson's disease and schizophrenia.
Our approximately 5,000 employees in 55 countries are engaged in the entire value chain throughout research,
development, manufacturing, marketing and sales. Our pipeline consists of several late-stage development
programmes and our products are available in more than 100 countries. We have production facilities in Denmark,
France and Italy. Lundbeck generated revenue of DKK 17.2 billion in 2017 (EUR 2.3 billion; USD 2.6 billion).
For additional information, we encourage you to visit our corporate site www.lundbeck.com and connect with us on
Twitter at @Lundbeck.


![WELCOME [files.shareholder.com]files.shareholder.com/downloads/ACIW/5800322185x0x707102/...PAPER BILLS/ CHECKS MOBILE ONLINE BRANCH POS ATM CHANNELS ACI UNIVERSAL PAYMENTS Global Markets](https://static.fdocuments.in/doc/165x107/5aa109037f8b9ac67a8b46d7/welcome-files-files-bills-checks-mobile-online-branch-pos-atm-channels-aci.jpg)