Luminosity and Mass Functions of Galaxiesjgreene/AST542/Alex2013.pdf · Luminosity and mass...
34
Luminosity and Mass Functions of Galaxies Alex R. Howe February 13, 2013
Transcript of Luminosity and Mass Functions of Galaxiesjgreene/AST542/Alex2013.pdf · Luminosity and mass...
Luminosity and Mass Functions of Galaxies
Alex R. Howe
February 13, 2013
Outline
Overview of galaxy types
Definitions and origin of luminosity and mass functions
Systematics
Properties of luminosity and mass functions
Mass-to-light ratios
Effect of environment
Group luminosity and mass functions
A. R. Howe Luminosity and Mass Functions of Galaxies
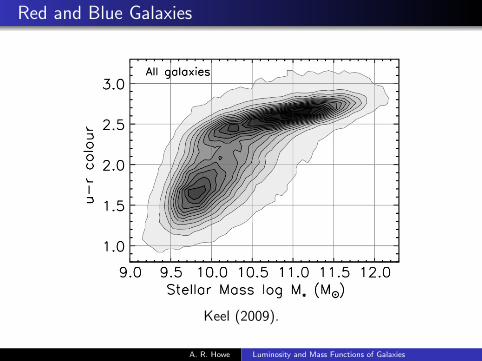
Red and Blue Galaxies
Keel (2009).
A. R. Howe Luminosity and Mass Functions of Galaxies
Red and Blue Galaxies
Blue galaxies are late types, mostly spirals and irregulars.
Red galaxies are early types, mostly ellipticals and lenticulars.
Early type (red) galaxies may be divided into two groups bySersic index.
n > 2 are concentrated early types, including traditional deVaucouleurs profile.
n < 2 are diffuse early types, strongly biased toward dwarfgalaxies.
A. R. Howe Luminosity and Mass Functions of Galaxies
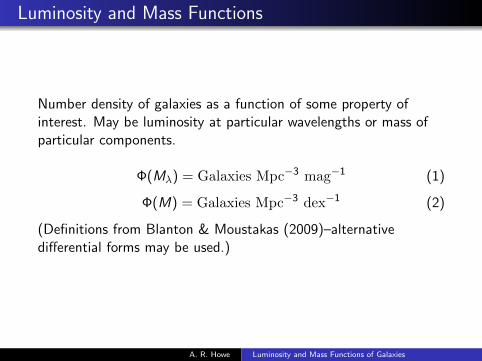
Luminosity and Mass Functions
Number density of galaxies as a function of some property ofinterest. May be luminosity at particular wavelengths or mass ofparticular components.
Φ(Mλ) = Galaxies Mpc−3 mag−1 (1)
Φ(M) = Galaxies Mpc−3 dex−1 (2)
(Definitions from Blanton & Moustakas (2009)–alternativedifferential forms may be used.)
A. R. Howe Luminosity and Mass Functions of Galaxies
Luminosity and Mass Functions
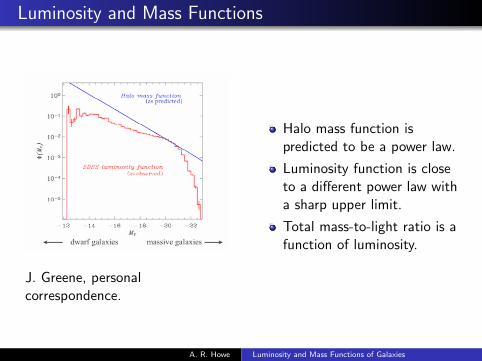
J. Greene, personalcorrespondence.
Halo mass function ispredicted to be a power law.
Luminosity function is closeto a different power law witha sharp upper limit.
Total mass-to-light ratio is afunction of luminosity.
A. R. Howe Luminosity and Mass Functions of Galaxies

Halo and Stellar Mass Functions
J. Greene, personalcorrespondence.
Dashed line: baryonic massfunction if baryons followdark matter perfectly.
Halo mass function extendsto cluster scales.
Star formation most efficientwhere curves areclosest–near L?.
A. R. Howe Luminosity and Mass Functions of Galaxies
Physical Origins of Luminosity Function
Near L?, star formation is efficient and LF matchesexpectations.
Star formation is suppressed at higher masses:
virial heating in cluster-sized halos;AGN feedback in most massive galaxies.
Star formation is suppressed at lower masses (missing satelliteproblem):
gas ejected from small halos by supernova winds;gas pressure suppresses collapse in small halos.
J. Greene, personal correspondence.
A. R. Howe Luminosity and Mass Functions of Galaxies

Systematics
Malmquist Bias: brighter galaxies are easier to detect and aredetectable at greater distances.
Weight galaxies by 1/Vmax, the maximum volume over whichthey can be detected.
Φ = Σi1/Vmax,i
Accounts for many selection effects: luminosity, redshift, etc.
Agrees well with fancier methods.
Not strongly affected by redshift-large scale structurecorrelations.
Blanton & Moustakas (2009).
A. R. Howe Luminosity and Mass Functions of Galaxies
Systematics
Oversubtraction in SDSS: largest galaxies (& 20′′) havebackgrounds oversubtracted by & 20% due to catching halostars in background fluxes.
Mostly affects nearest galaxies.
Small effect on luminosity function, especially at highluminosities because brightest galaxies are far away.
Blanton & Moustakas (2009).
A. R. Howe Luminosity and Mass Functions of Galaxies
Systematics
Low surface-brightness galaxies: selected against due tobackground selection statistics.
Estimated at ∼10% at Mr − 5 log10 h = −17.
Spectroscopic surveys incomplete at lower luminosities.
Effect on mass function is uncertain.
O’Neil et al. (2004) suggest low surface-brightness galaxieswith high HI masses > 1010M�.
Some such galaxies are known, but their abundance is not.
Blanton & Moustakas (2009).
A. R. Howe Luminosity and Mass Functions of Galaxies

r-Band Luminosity Functions
Blanton & Moustakas (2009),Fig. 3a.
r-band luminosity function ofall (gray), late-type (blue),early type (red), and diffuseearly type (orange) galaxies.
“Early” types include mostS0’s and many Sa’s.
Late types most common atlow luminosity.
Early types most common athigh luminosity.
Diffuse early types followlate types.
Converge at highestluminosities.
A. R. Howe Luminosity and Mass Functions of Galaxies
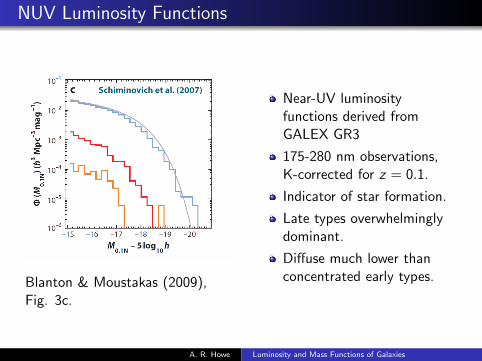
NUV Luminosity Functions
Blanton & Moustakas (2009),Fig. 3c.
Near-UV luminosityfunctions derived fromGALEX GR3
175-280 nm observations,K-corrected for z = 0.1.
Indicator of star formation.
Late types overwhelminglydominant.
Diffuse much lower thanconcentrated early types.
A. R. Howe Luminosity and Mass Functions of Galaxies

Stellar Mass Functions
Blanton & Moustakas (2009),Fig. 3b.
Mass functions very similarto luminosity functions.
Relatively higher for allearly-types.
Suggests difference inmass-to-light ratios.
A. R. Howe Luminosity and Mass Functions of Galaxies
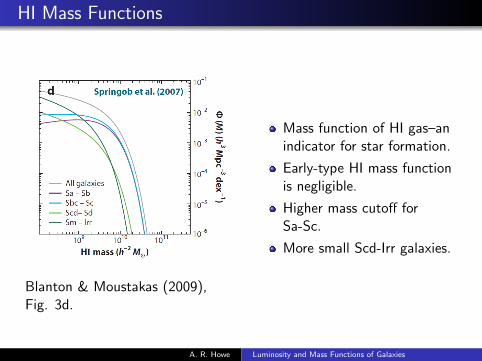
HI Mass Functions
Blanton & Moustakas (2009),Fig. 3d.
Mass function of HI gas–anindicator for star formation.
Early-type HI mass functionis negligible.
Higher mass cutoff forSa-Sc.
More small Scd-Irr galaxies.
A. R. Howe Luminosity and Mass Functions of Galaxies
Mass-to-Light Ratios
Need stellar mass-to-light ratios to convert luminosity functionto mass function.
(Total mass can be found dynamically.)
Bell et al. (2003) develop conversion from luminosity andcolor to M/L.
Create a grid of stellar populations with range of metalicitiesand star-formation histories.
Compute colors at both observed redshift and z = 0 for eachgalaxy and fit to observations.
A. R. Howe Luminosity and Mass Functions of Galaxies
Systematics and Corrections
Must assume an IMF–Bell et al. (2003) use a “diet” SalpeterIMF with fewer low-mass stars.
K-corrections.
Evolution corrections.
Systematic effects of dust remain, but are mostly degeneratewith stellar population.
Galaxy age can change M/L at fixed color.
Bursts of star formation can cause overestimate of M/L by∼ 10% when interpreted as smooth SFHs.
A. R. Howe Luminosity and Mass Functions of Galaxies
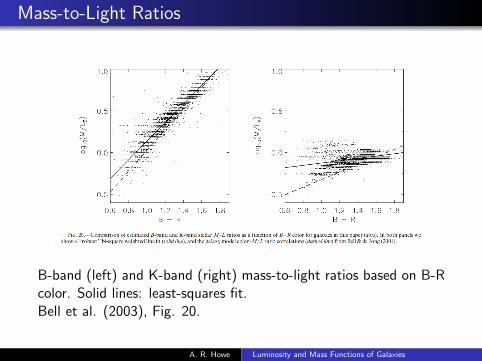
Mass-to-Light Ratios
B-band (left) and K-band (right) mass-to-light ratios based on B-Rcolor. Solid lines: least-squares fit.Bell et al. (2003), Fig. 20.
A. R. Howe Luminosity and Mass Functions of Galaxies
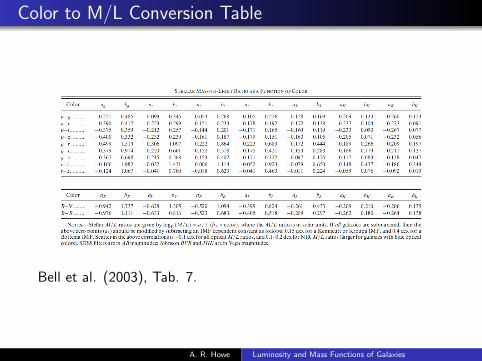
Color to M/L Conversion Table
Bell et al. (2003), Tab. 7.
A. R. Howe Luminosity and Mass Functions of Galaxies
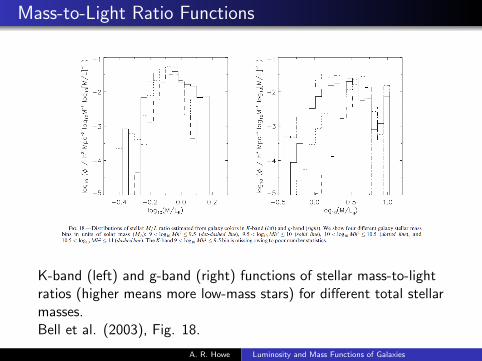
Mass-to-Light Ratio Functions
K-band (left) and g-band (right) functions of stellar mass-to-lightratios (higher means more low-mass stars) for different total stellarmasses.Bell et al. (2003), Fig. 18.
A. R. Howe Luminosity and Mass Functions of Galaxies
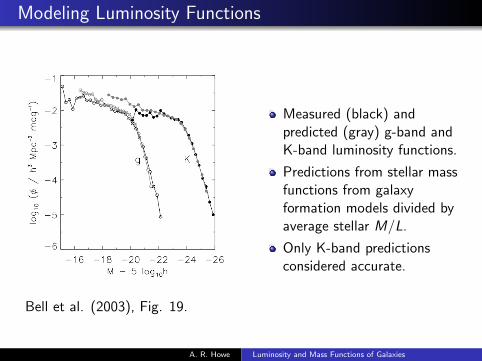
Modeling Luminosity Functions
Bell et al. (2003), Fig. 19.
Measured (black) andpredicted (gray) g-band andK-band luminosity functions.
Predictions from stellar massfunctions from galaxyformation models divided byaverage stellar M/L.
Only K-band predictionsconsidered accurate.
A. R. Howe Luminosity and Mass Functions of Galaxies
Environment
Galaxies may be in clusters, groups, or voids, and propertiescorrelate with environment.
Dense environments have serious effects on galaxies: tidalinteractions, mergers, ram-pressure stripping, etc.
Estimate environment by counting number of neighbors Nn
with Mr − 5 log10 h < −18.5 (≈ LLMC ).
Neighbors counted within projected 500 h−1 kpc and 600 kms−1 (Blanton & Moustakas, 2009).
A. R. Howe Luminosity and Mass Functions of Galaxies
Other Measures of Environment
Membership in a group/size of group.
Distance to nearest neighbor.
Kernel density smoothing.
All measures produce similar results (Blanton & Moustakas,2009).
A. R. Howe Luminosity and Mass Functions of Galaxies
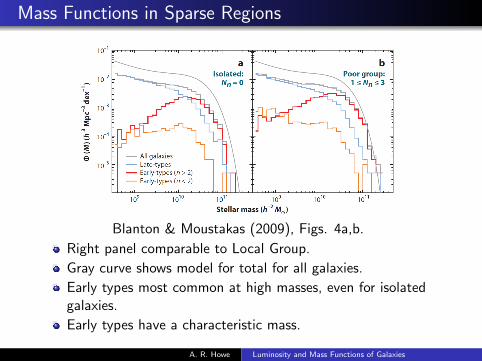
Mass Functions in Sparse Regions
Blanton & Moustakas (2009), Figs. 4a,b.
Right panel comparable to Local Group.
Gray curve shows model for total for all galaxies.
Early types most common at high masses, even for isolatedgalaxies.
Early types have a characteristic mass.
A. R. Howe Luminosity and Mass Functions of Galaxies

Mass Functions in Dense Regions
Blanton & Moustakas (2009), Figs. 4c,d.
Most galaxies not in rich groups or clusters.
But more massive galaxies and relatively more early types.
Weaker characteristic mass for early types.
Late types most common at low masses, even in clusters.
A. R. Howe Luminosity and Mass Functions of Galaxies
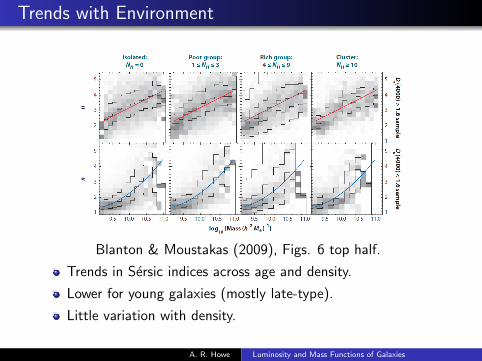
Trends with Environment
Blanton & Moustakas (2009), Figs. 6 top half.
Trends in Sersic indices across age and density.
Lower for young galaxies (mostly late-type).
Little variation with density.
A. R. Howe Luminosity and Mass Functions of Galaxies
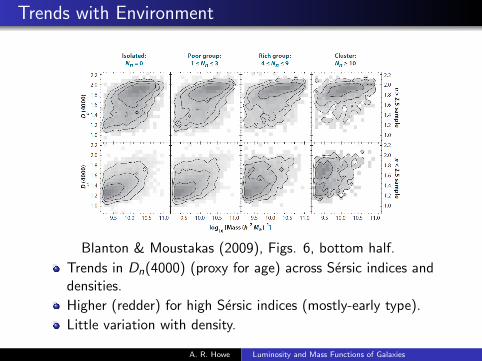
Trends with Environment
Blanton & Moustakas (2009), Figs. 6, bottom half.
Trends in Dn(4000) (proxy for age) across Sersic indices anddensities.
Higher (redder) for high Sersic indices (mostly-early type).
Little variation with density.
A. R. Howe Luminosity and Mass Functions of Galaxies
Effects of Environment
Environment correlates stongly with proxies for star-formationhistory (e.g. Dn(4000) or Sersic index).
When galaxies are classified by star-formation history, otherparameters (e.g. Dn(4000), Sersic index, Hubble type,quantitative morphology parameters) are nearly uncorrelatedwith environment.
Significant differences between Nn = 0 and Nn = 1.
Degeneracy between center of small group and edge of largecluster, but Blanton & Berlind (2007) show this does notstrongly affect galaxy properties.
Only local density is important.
A. R. Howe Luminosity and Mass Functions of Galaxies
Effects of Environment
Very close pairs of galaxies (within ∼ 1 virial radius) morelikely to be red and more likely to have the same morphology.
Not clear if this is related to star formation.
Central galaxies of clusters are larger and more diffuse thanother ellipticals, and more affected by large-scale density.
Blanton & Moustakas (2009).
A. R. Howe Luminosity and Mass Functions of Galaxies
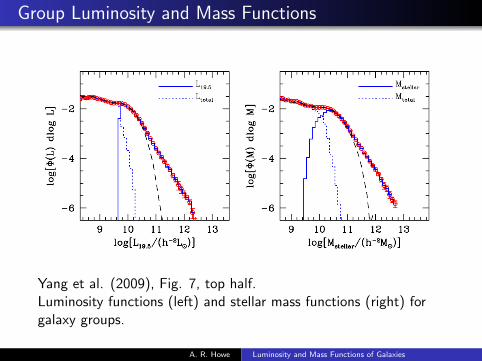
Group Luminosity and Mass Functions
Yang et al. (2009), Fig. 7, top half.Luminosity functions (left) and stellar mass functions (right) forgalaxy groups.
A. R. Howe Luminosity and Mass Functions of Galaxies
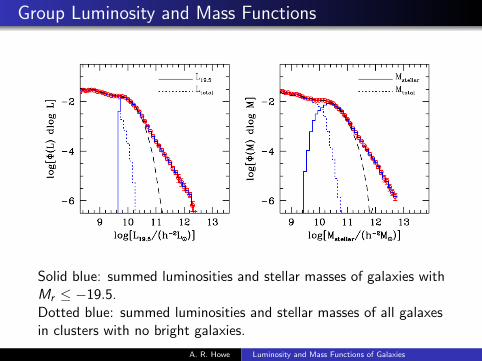
Group Luminosity and Mass Functions
Solid blue: summed luminosities and stellar masses of galaxies withMr ≤ −19.5.Dotted blue: summed luminosities and stellar masses of all galaxesin clusters with no bright galaxies.
A. R. Howe Luminosity and Mass Functions of Galaxies
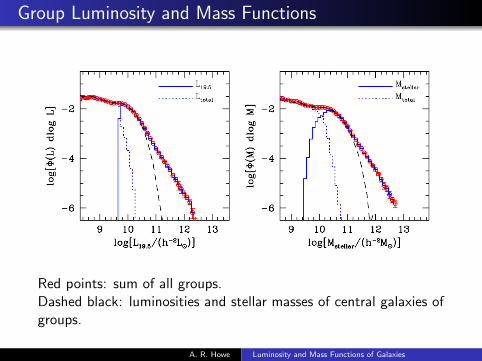
Group Luminosity and Mass Functions
Red points: sum of all groups.Dashed black: luminosities and stellar masses of central galaxies ofgroups.
A. R. Howe Luminosity and Mass Functions of Galaxies

Summary
Luminosity and mass functions have characteristic shapes thatmostly depend on star-formation history.
This manifests as differences between galaxy types (early vs.late) and environments.
It is possible to reliably convert from luminosity and color tostellar mass.
The group luminosity function more closely follows the halomass function.
A. R. Howe Luminosity and Mass Functions of Galaxies
References
Bell, E. F., McIntosh, D. H., Katz, N., & Weinberg, M. D.2003, ApJ Supp. Ser., 149, 289
Blanton, M. R. & Berlind, A. A. 2007, ApJ, 664, 791
Blanton, M. R. & Moustakas, J. 2009, Annu. Rev. Astro.Astrophys., 47, 159
Keel, W. C. 2009, Global Galaxy Properties and Systematics,<http://www.astr.ua.edu/keel/galaxies/systematics.html>
O’Neil, K., Bothun, G., van Driel, W., Monnier Ragainge, D.2004, A&A 428, 823
Yang, X., Mo, H. J., & van den Bosch, F. C. 2009, ApJ, 695,900
A. R. Howe Luminosity and Mass Functions of Galaxies