LTB 16 ANNUAL REPORT INSIDE FINAL REV
121
BUILT FOR SUCCESS Lifetime Brands Annual Report 2016 Lifetime Brands Annual Report 2016
Transcript of LTB 16 ANNUAL REPORT INSIDE FINAL REV

BUILTFORSUCCESSLifetime Brands Annual Report 2016
Lifetime B
rands Annual R
eport 2016

Financial Highlights
NET SALES IN MILLIONS
0
700
2013 2014 2015 2016
$50
3 $58
6
$58
8
$59
3
2013 2014 2015 2016
$1.3
2
$1.0
8
$1.0
0
$0.86
$0.73
$0.71
$1.11
$0.11
2013 2014 2015 2016
$19
$16
$14
$14
$12
$10
$9
$2
ADJUSTED EBITDA(1) IN MILLIONS
0
60
2013 2014 2015 2016
$43
$43
$45
$47
NET INCOME
ADJUSTED NET INCOME
DILUTED INCOME PER COMMON SHARE
ADJUSTED DILUTED INCOME PER COMMON SHARE
NET INCOME AND ADJUSTED NET INCOME(2)
IN MILLIONSDILUTED INCOME PER COMMON SHARE AND
ADJUSTED DILUTED INCOME PER COMMON SHARE(2)
Year Ended December 31, (in thousands, except per share data)
2016 2015 2014 2013
NET SALES $592,619 $587,670 $586,010 $502,721
ADJUSTED EBITDA(1) $47,226 $44,885 $42,542 $43,478
NET INCOME $15,720 $12,278 $1,544 $9,281
ADJUSTED NET INCOME(2) $19,219 $14,199 $10,263 $14,496
DILUTED INCOME PER COMMON SHARE $1.08 $0.86 $0.11 $0.71
ADJUSTED DILUTED INCOME PER COMMON SHARE(2) $1.32 $1.00 $0.73 $1.11
(1) ADJUSTED EBITDA IS A NON-GAAP FINANCIAL MEASURE THAT IS RECONCILED TO GAAP NET INCOME IN THIS ANNUAL REPORT AND IN THE COMPANY’S FORM 10-K FOR THE YEAR ENDED DECEMBER 31, 2016.
(2) ADJUSTED NET INCOME IS A NON-GAAP FINANCIAL MEASURE THAT IS RECONCILED TO GAAP NET INCOME IN THIS ANNUAL REPORT.
We are one of the world’s leading designers, developers,
and marketers of a broad range of nationally branded
consumer products used in the home. Our categories
include Kitchenware, Cutlery, Cutting Boards, Bakeware,
Cookware, Dinnerware, Flatware, Glassware, Pantryware,
Spices, and Home Solutions.
We are committed to delivering five-star experiences
to the earth’s consumers through innovative products,
services, and solutions for the home. In return, they reward
us with increased market share and profitability, allowing
our associates, stakeholders, and shareholders to prosper.
Mission Statement
Lifetime Brands

2LIF
ET
IME
BR
AN
DS
, IN
C.
20
16
AN
NU
AL
RE
PO
RT
2016 was a momentous year for Lifetime Brands.
Despite the headwinds created by the results of Britain’s Brexit Referendum and the ensuing unfavorable fluctuations in the exchange rates for the British Pound and the Euro, challenges to traditional brick and mortar retailing brought about by the accelerating rate of growth of e-commerce, concerns over possible imposition of import duties and/or border tax adjustments and the impact such measures would have on America’s relationships with key trading partners, including China, Mexico, and Canada, we delivered record-setting performance. For the year, net sales reached $593 million, and adjusted net income topped $19 million, or $1.32 per diluted share.
In addition, we moved ahead with Lifetime Next™, our internal restructuring and transformation initiative, and undertook several major new projects designed to build our organization and strengthen our infrastructure. We also completed three acquisitions.
Key strategic initiatives
The Company’s most important strategic initiative is Lifetime Next™, our drive to accelerate profitability by realigning our operating divisions, eliminating complexity, developing Key Performance Indicators, and reducing SG&A. In my many years at Lifetime, I believe this is the most significant effort we have ever undertaken. We expect it to dramatically improve how we do business, enabling us to systematically rationalize the development and lifecycle of SKUs, and focus more on higher-value, higher-profitability products.
As our fourth-quarter 2016 results indicated, Lifetime Next™ has already begun to have a very positive effect on the bottom line, and we
expect considerably more benefit to come in 2017 and beyond. We are only in the beginning stages of this journey, and our teams are highly focused on implementing the changes recommended by the major international consulting firm we retained to assist us in this undertaking. All in all, it has been, and continues to be, an exciting and transformational effort.
Another key initiative is building our capability to support our e-commerce customers, both in the U.S. and overseas so that, within our categories, we are positioned to be a leader in the digital marketplace, whose importance to consumers continues to grow exponentially. We have significantly expanded our organization’s capabilities in this area, and we also successfully leveraged the online presence of our newly acquired brands. As a result, our sales to e-commerce retailers, as well as the sales of our products on the e-commerce sites of our brick and mortar retail partners, had a significant increase for both the fourth quarter and the full 2016 year.
Several years ago we made a sizable investment in a team of professionals to ensure that Lifetime would be able to capitalize on this shift in consumer shopping, and it is now beginning to pay substantial dividends. This team has the specialized skills needed to drive the sales of our company’s products online. In addition, we have invested, and are continuing to invest, in systems that enable us to efficiently ship direct to consumers for our retail partners. Our goal is to be world class in these capabilities.
We have also been integrating our European operations, Kitchen Craft® and Creative Tops®, to reduce costs and accelerate synergies. The kitchenware and tableware entities were legally merged as of year-end, and we are now integrating
Dear fellow shareholders

3 LIF
ET
IME
BR
AN
DS
, IN
C.
20
16
AN
NU
AL
RE
PO
RT
the management teams. We are also putting the companies on the same SAP platform and have been taking steps to combine their warehouses. We believe these initiatives will establish new levels of opportunity and growth in sales and profitability for the businesses, which we now refer to jointly as Lifetime Brands Europe.
During 2016, we also moved ahead with plans to relocate our West Coast distribution into a new, highly efficient build-to-suit warehouse to be located in Rialto, California. We developed plans, signed the lease, and expect to attain occupancy later in 2017 and to begin shipping in early 2018.
The series of successful acquisitions we completed in 2016 brought an array of strong brands that complement those we already have, while adding only minimally to our SG&A expenses. The five brands -- Wilton Armetale®, Amco Houseworks®, Chicago Metallic™, Swing-A-Way®, and Copco® -- are all well known and established both in categories that Lifetime is already in and in several adjacent categories. We have been rapidly integrating each of the acquisitions, and all of them proved accretive for the year. We expect them to contribute even more positively beginning in 2017 as we benefit further from Lifetime’s ability to lower input costs and increase innovation.
In summary, we have a multitude of efforts underway to grow Lifetime’s assortment of brands and products while at the same time increasing our efficiency and profitability. We are also as focused as ever on delivering five-star experiences to consumers through innovative products, services, and solutions for the home. Our whole organization is committed to these initiatives, and we believe they provide an excellent platform for 2017 and beyond.
Respectfully,
Jeffrey Siegel Chairman of the Board and Chief Executive Officer
4LIF
ET
IME
BR
AN
DS
, IN
C.
20
16
AN
NU
AL
RE
PO
RT
®
®
®
®
®
®
®
®
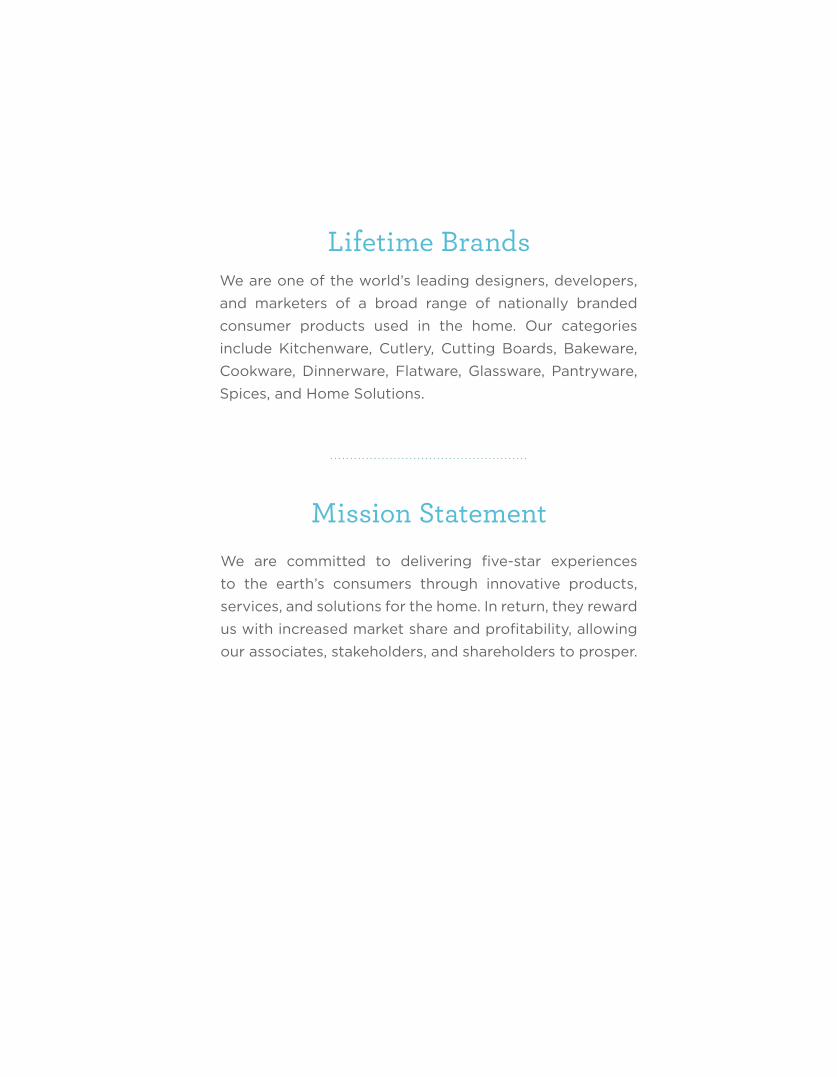
Lifetime Brands is a leading consumer products company focused on products used in the home to prepare, serve, and consume food and beverages. Our products are sold under more than 40 internationally recognized brands that consumers know and trust, and we are continually expanding our portfolio of offerings to reflect the rapidly evolving marketplace.
Kitchenware Brands
Our portfolio of kitchenware brands includes Farberware®, KitchenAid®, Sabatier®, and Built®, brands that are known the world over for reliability and function. Lifetime Brands is the #1 resource for kitchen tools and gadgets in the United States.* * Source: The NPD Group, Inc./Retail Tracking
Service. 52 weeks ending February 1, 2017.
Farberware® was founded over 100 years ago, and the name has long stood for value, quality, and durability. This commitment to the customer continues to this day.
Farberware® is one of the strongest brands in Lifetime’s portfolio, and is the #1 selling cutlery brand in the United States.* * Source: The NPD Group, Inc./Retail Tracking
Service. 52 weeks ending February 1, 2017.
KitchenAid® represents professional quality, durability, and dependability for home chefs around the globe. The KitchenAid® brand is dedicated to premium performance and excellence in culinary tools.
Since identifying our time-honored Sabatier® brand as a major opportunity in cutlery and cutting boards several years ago, Lifetime has dedicated significant resources to product and brand development. In 2016, Sabatier® entered the cast iron cookware category. Legendary for design and impeccable craftsmanship, Sabatier® is now bringing its tradition of European excellence to the realm of cookware. For entry into this new market, Sabatier® cast iron cookware line offers a notable, consumer-friendly feature: it’s rust resistant.
BRANDS
* Source: The NPD Group, Inc./Retail Tracking Service. 52 weeks ending February 1, 2017.
* Source: The NPD Group, Inc./Retail Tracking Service. 52 weeks ending February 1, 2017.
5 LIF
ET
IME
BR
AN
DS
, IN
C.
20
16
AN
NU
AL
RE
PO
RT
®
®
®
®
®
®
®
®
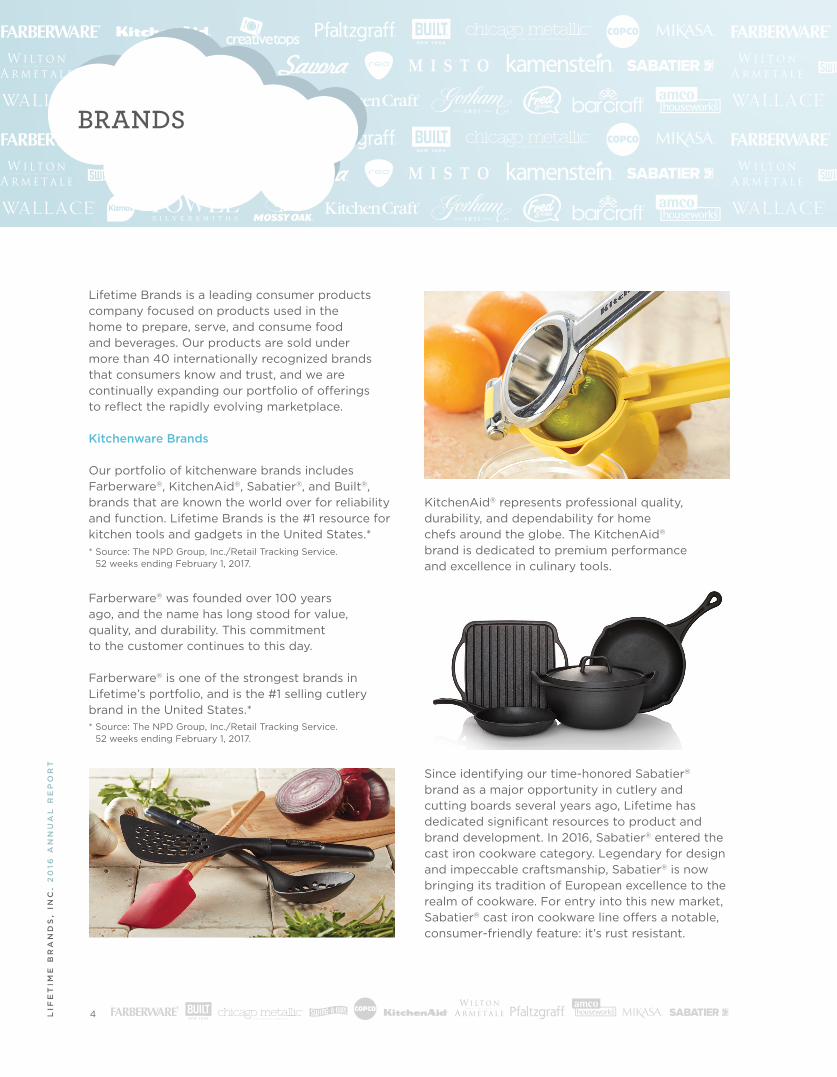
BUILT® is Lifetime’s line of stylish lifestyle accessories, and is seeing spectacular growth in the portable beverageware category. The BUILT® brand supports a recreational lifestyle, and entry into this category has resonated with its consumer base. BUILT® accessories are specifically designed for the active, on-the-go consumer, and seamlessly combine form and function. The product line, which embodies “the good life” spirit, complements Lifetime’s product portfolio and enhances our distribution to fine retailers worldwide.
BUILT® offers a comprehensive collection of designer water bottles in trend-right colors and patterns, many with a patented Perfect Seal™ cap. This ingenious cap is both leak- and spill-proof, and comes off with an easy twist of the hand. It features a threadless design, which inhibits the build-up of dirt.
In 2016, we expanded our portfolio of kitchenware brands through the acquisition of the Copco®, Chicago Metallic™, Amco Houseworks®, and Swing-A-Way® brands.
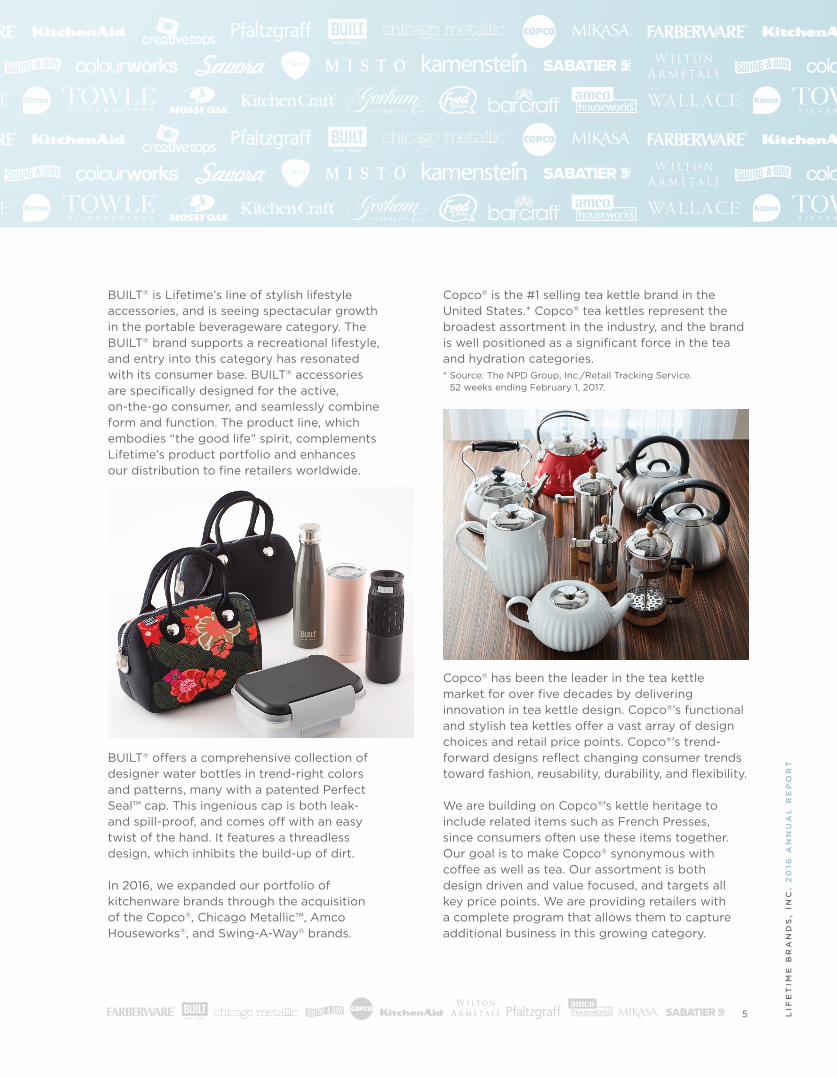
Copco® is the #1 selling tea kettle brand in the United States.* Copco® tea kettles represent the broadest assortment in the industry, and the brand is well positioned as a significant force in the tea and hydration categories. * Source: The NPD Group, Inc./Retail Tracking
Service. 52 weeks ending February 1, 2017.
Copco® has been the leader in the tea kettle market for over five decades by delivering innovation in tea kettle design. Copco®’s functional and stylish tea kettles offer a vast array of design choices and retail price points. Copco®’s trend-forward designs reflect changing consumer trends toward fashion, reusability, durability, and flexibility.
We are building on Copco®’s kettle heritage to include related items such as French Presses, since consumers often use these items together. Our goal is to make Copco® synonymous with coffee as well as tea. Our assortment is both design driven and value focused, and targets all key price points. We are providing retailers with a complete program that allows them to capture additional business in this growing category.
* Source: The NPD Group, Inc./Retail Tracking Service. 52 weeks ending February 1, 2017.

6LIF
ET
IME
BR
AN
DS
, IN
C.
20
16
AN
NU
AL
RE
PO
RT
®
®
®
®
®
®
®
®
Chicago Metallic™ represents an exciting expansion in the bakeware category, with upper-end products and an exceptional global reputation as “The Baking Experts”. Since 1898, the Chicago Metallic™ name has been synonymous with innovative products, superior quality, and exceptional performance to bakers everywhere.
Baking is a growth category, and the prestige of the Chicago Metallic™ product line allows us to expand Lifetime’s product selection for current retailers in addition to developing partnerships with new retailers. We are excited to enhance our product offerings for our consumers, while simultaneously positioning Lifetime to capture a share of the higher-end bakeware market.
Chicago Metallic™ offers premium bakeware plus stylish, innovative specialty bakeware and baking essentials in three product classifications: commercial, professional, and elite.
Amco Houseworks® is an award-winning maker of kitchen tools and accessories. With its commitment to making cooking easier, Amco Houseworks® has earned the loyalty and respect of professional and home cooks around the world.
We are dedicated to expanding upon the Amco Houseworks® tradition of creating new tools, gadgets, and accessories that make food preparation and cleanup faster and easier. Amco Houseworks® specializes in combining precision and performance to design stylish premium kitchen tools that are innovative yet intuitive, often with unique features that serve multiple purposes, further reducing preparation time.
The professional design of the Amco Houseworks® line of products speaks directly to consumers who take their love of cooking seriously, and want that devotion reflected in the tools they select for their kitchen.
Swing-A-Way® has been a creator of high quality, dependable can openers since 1938. With Lifetime’s
BRANDS

7 LIF
ET
IME
BR
AN
DS
, IN
C.
20
16
AN
NU
AL
RE
PO
RT
®
®
®
®
®
®
®
®
great success with can opener lines across various brands, we are positioned to carry on Swing-A-Way®’s reputation for making the most durable and dependable can opener on the market. We can also greatly expand its visibility online and with major retailers, giving this classic a global presence.
In addition to acquisitions, in 2016 we leveraged Lifetime’s leading position in kitchenware through three important technological introductions.
Our Edgekeeper® technology saw tremendous success, as consumers responded to the unique convenience Edgekeeper® offers: self-sharpening knives. Difficulty sharpening knives is consumers’ #1 complaint about cutlery, and 92% of consumers are willing to pay more for cutlery that automatically sharpens with each use.* *Proprietary research conducted by Cambridge
Partners & Associates, October 2016.
Each Edgekeeper® open stock knife and cutlery block has sharpening rods built into their storage slots that automatically sharpen the blade every time the user removes or replaces the knife. The rods are aligned to sharpen the blade at the correct angle, ensuring a razor-sharp edge every time it’s used. This saves the consumer guesswork as to when blades have dulled, and eliminates the extra step of sharpening each knife separately.
Knife Armor™ cutlery is a revolutionary breakthrough in cutlery technology: stainless steel knives that are dishwasher safe. This remarkable step forward is made possible by Lifetime’s proprietary Knife Armor™ technology. Each blade is treated with this advanced rust-resistant coating, making them dishwasher safe and adding a new layer of convenience to washing cutlery. Plus, every blade is forged from superior quality, high-carbon Japanese stainless steel and is perfectly weighted and balanced for optimal control.
We also introduced West Blade®, an exciting new technology that revolutionizes zesting and grating. This patented technology features a unique, tineless surface with bi-directional grating capability, so it grates food no matter if it’s slid up or down. In addition, food moves over the surface with minimal effort, virtually gliding over the blades to create gorgeous, paper-thin flakes.
* Proprietary research conducted by Cambridge Partners & Associates, October 2016.

8LIF
ET
IME
BR
AN
DS
, IN
C.
20
16
AN
NU
AL
RE
PO
RT
®
®
®
®
®
®
®
®
BRANDS
Tableware Brands
For over 70 years, Lifetime’s patterns and designs have defined the look of dinnerware, flatware, stemware, bakeware, cutlery, tools and gadgets, and home décor. And with billions of products sold, we’ve helped shape the look of kitchens and dining rooms worldwide.
Our key tableware brands are Mikasa® and Pfaltzgraff®.
Mikasa® is proud to be recognized worldwide as the leader in tabletop fashion in dinnerware, crystal stemware, barware, flatware, and decorative accessories. Quality and great design have been synonymous with the Mikasa® brand name for over a half-century. Dedication to high quality and exciting designs has been our trademark since Mikasa® was founded.
Pfaltzgraff® has been associated with the highest quality ceramic products available for the home since 1811. The brand is one of the best-known designers and marketers of dinnerware, drinkware, ceramic accessories, giftware, and other products. Pfaltzgraff® has a long-standing tradition of excellence in craftsmanship, quality, and service. This commitment to being responsive to its customers, and to adapting its products to their ever-changing needs, has enabled Pfaltzgraff® to prosper for almost two centuries.
In 2016, we expanded our portfolio of tableware brands through the acquisition of the venerable Wilton Armetale® brand.
Wilton Armetale® was established in 1892, and is highly regarded for its vast collection of beautifully designed serving pieces, including decorative and functional bowls, platters, and grilling vessels.
Armetale metal is a unique aluminum-based alloy, making it ideal for cooking and entertaining. Hot foods cooked and served in Wilton Armetale® products stay hot longer, while cold foods and drinks stay cold longer. Crafted from an alloy that is durable and does not rust, break, crack, or chip under normal use, each Armetale product is a solid piece of metal with no coating applied.
The unique properties of Armetale metal make it a highly desirable addition to the Lifetime Brands portfolio of tableware products. We intend to accelerate the development of new products, and look forward to continuing to deliver excellent quality and service for existing Wilton Armetale® customers and other fine retailers.
As a branded consumer products company, Lifetime is focused on increasing the percentage of sales from our owned and controlled brands, and have seen substantial growth in this area over the past five years.
50%
80%
2012 2014 2016
62.6% 68.6% 73.9%
OWNED AND CONTROLLED BRAND PERCENTAGE

9 LIF
ET
IME
BR
AN
DS
, IN
C.
20
16
AN
NU
AL
RE
PO
RT
®
®
®
®
®
®
®
®
Since our formation in 1945, Lifetime Brands has become one of America’s largest providers of home products. We are proud of our growth, and are taking a proactive approach to ensuring that it is sustainable for many years to come.
To successfully continue in our journey to become a $1 billion company, we engaged a major international consulting firm to assess opportunities to increase efficiencies and drive growth in revenues, gross margin, operating profit, and cash flow.
This initiative, Lifetime Next™, has completed Phase II. In that phase, we designed specific solutions to eliminate impediments, increase efficiencies, reduce SKUs, reduce SG&A, strengthen brand management, and reduce complexity throughout the organization.
The project is now in Phase III (implementation), with process improvement savings already having a positive effect on the bottom line, and expected to provide considerably more benefit in 2017 and beyond. In this phase, we addressed critical areas to reduce spending, enhance capabilities, and support further growth. This included:
• Organizational realignment • Portfolio management • Design optimization • Brand management and indirect sourcing
The implementation of these initiatives involves important changes to the way our organization operates. The organizational realignment allows us to be leaner and improve our go-to-market approach. An enhanced management structure reduces overhead, and generates savings to reinvest into growth and capability efforts.
Portfolio management introduces a new method to plan and track our business from a bottom-up perspective, creating a detailed level of discipline and accountability. The ability to measure portfolio and product development metrics ensures the optimal use of resources. Cross-divisional portfolio reviews instill a culture of sharing and communicating as targets and goals are jointly planned. Additionally, inventory reduction frees working capital tied up in the inventory of low-producing items.
Design optimization ensures the projects entering the development pipeline are carefully selected, validated against divisional portfolio targets, and evaluated throughout their lifecycle. A new operating model places end-to-end responsibility for global design and engineering under a single function, and creates a new China engineering team to improve interfaces with factory and sourcing.
Brand management and indirect sourcing provide us with a process to align divisions around a common set of goals, guidelines, and strategies for common brands, and identifies savings opportunities to pursue.
TRANSFORMATION
ANALYZE DEVELOP
MARKET
PORTFOLIOMANAGEMENT
LAUNCH
IDEA
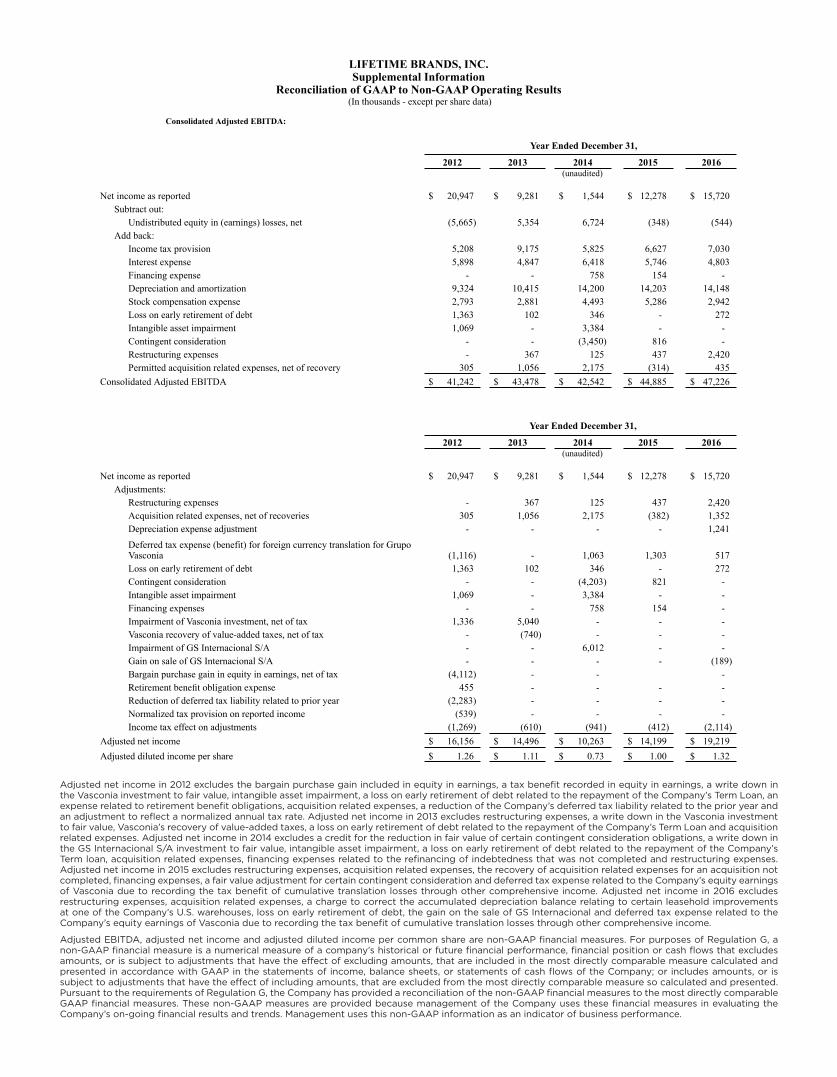
LIFETIME BRANDS, INC. Supplemental Information
Reconciliation of GAAP to Non-GAAP Operating Results (In thousands - except per share data)
Consolidated Adjusted EBITDA:
Year Ended December 31,
2012 2013 2014 2015 2016 (unaudited)
Net income as reported $ 20,947 $ 9,281 $ 1,544 $ 12,278 $ 15,720 Subtract out:
Undistributed equity in (earnings) losses, net (5,665) 5,354 6,724 (348) (544)Add back:
Income tax provision 5,208 9,175 5,825 6,627 7,030 Interest expense 5,898 4,847 6,418 5,746 4,803 Financing expense - - 758 154 - Depreciation and amortization 9,324 10,415 14,200 14,203 14,148 Stock compensation expense 2,793 2,881 4,493 5,286 2,942 Loss on early retirement of debt 1,363 102 346 - 272 Intangible asset impairment 1,069 - 3,384 - - Contingent consideration - - (3,450) 816 - Restructuring expenses - 367 125 437 2,420 Permitted acquisition related expenses, net of recovery 305 1,056 2,175 (314) 435
Consolidated Adjusted EBITDA $ 41,242 $ 43,478 $ 42,542 $ 44,885 $ 47,226
2012 2013 2014 2015 2016 (unaudited)
Net income as reported $ 20,947 $ 9,281 $ 1,544 $ 12,278 $ 15,720 Adjustments:
Restructuring expenses - 367 125 437 2,420 Acquisition related expenses, net of recoveries 305 1,056 2,175 (382) 1,352 Depreciation expense adjustment - - - - 1,241 Deferred tax expense (benefit) for foreign currency translation for Grupo Vasconia (1,116) - 1,063 1,303 517 Loss on early retirement of debt 1,363 102 346 - 272 Contingent consideration - - (4,203) 821 - Intangible asset impairment 1,069 - 3,384 - - Financing expenses - - 758 154 - Impairment of Vasconia investment, net of tax 1,336 5,040 - - - Vasconia recovery of value-added taxes, net of tax - (740) - - - Impairment of GS Internacional S/A - - 6,012 - - Gain on sale of GS Internacional S/A - - - - (189)Bargain purchase gain in equity in earnings, net of tax (4,112) - - - Retirement benefit obligation expense 455 - - - - Reduction of deferred tax liability related to prior year (2,283) - - - - Normalized tax provision on reported income (539) - - - - Income tax effect on adjustments (1,269) (610) (941) (412) (2,114)
Adjusted net income $ 16,156 $ 14,496 $ 10,263 $ 14,199 $ 19,219 Adjusted diluted income per share $ 1.26 $ 1.11 $ 0.73 $ 1.00 $ 1.32
Year Ended December 31,
Adjusted net income in 2012 excludes the bargain purchase gain included in equity in earnings, a tax benefit recorded in equity in earnings, a write down in the Vasconia investment to fair value, intangible asset impairment, a loss on early retirement of debt related to the repayment of the Company’s Term Loan, an expense related to retirement benefit obligations, acquisition related expenses, a reduction of the Company’s deferred tax liability related to the prior year and an adjustment to reflect a normalized annual tax rate. Adjusted net income in 2013 excludes restructuring expenses, a write down in the Vasconia investment to fair value, Vasconia’s recovery of value-added taxes, a loss on early retirement of debt related to the repayment of the Company’s Term Loan and acquisition related expenses. Adjusted net income in 2014 excludes a credit for the reduction in fair value of certain contingent consideration obligations, a write down in the GS Internacional S/A investment to fair value, intangible asset impairment, a loss on early retirement of debt related to the repayment of the Company’s Term loan, acquisition related expenses, financing expenses related to the refinancing of indebtedness that was not completed and restructuring expenses. Adjusted net income in 2015 excludes restructuring expenses, acquisition related expenses, the recovery of acquisition related expenses for an acquisition not completed, financing expenses, a fair value adjustment for certain contingent consideration and deferred tax expense related to the Company’s equity earnings of Vasconia due to recording the tax benefit of cumulative translation losses through other comprehensive income. Adjusted net income in 2016 excludes restructuring expenses, acquisition related expenses, a charge to correct the accumulated depreciation balance relating to certain leasehold improvements at one of the Company’s U.S. warehouses, loss on early retirement of debt, the gain on the sale of GS Internacional and deferred tax expense related to the Company’s equity earnings of Vasconia due to recording the tax benefit of cumulative translation losses through other comprehensive income.
Adjusted EBITDA, adjusted net income and adjusted diluted income per common share are non-GAAP financial measures. For purposes of Regulation G, a non-GAAP financial measure is a numerical measure of a company’s historical or future financial performance, financial position or cash flows that excludes amounts, or is subject to adjustments that have the effect of excluding amounts, that are included in the most directly comparable measure calculated and presented in accordance with GAAP in the statements of income, balance sheets, or statements of cash flows of the Company; or includes amounts, or is subject to adjustments that have the effect of including amounts, that are excluded from the most directly comparable measure so calculated and presented. Pursuant to the requirements of Regulation G, the Company has provided a reconciliation of the non-GAAP financial measures to the most directly comparable GAAP financial measures. These non-GAAP measures are provided because management of the Company uses these financial measures in evaluating the Company’s on-going financial results and trends. Management uses this non-GAAP information as an indicator of business performance.
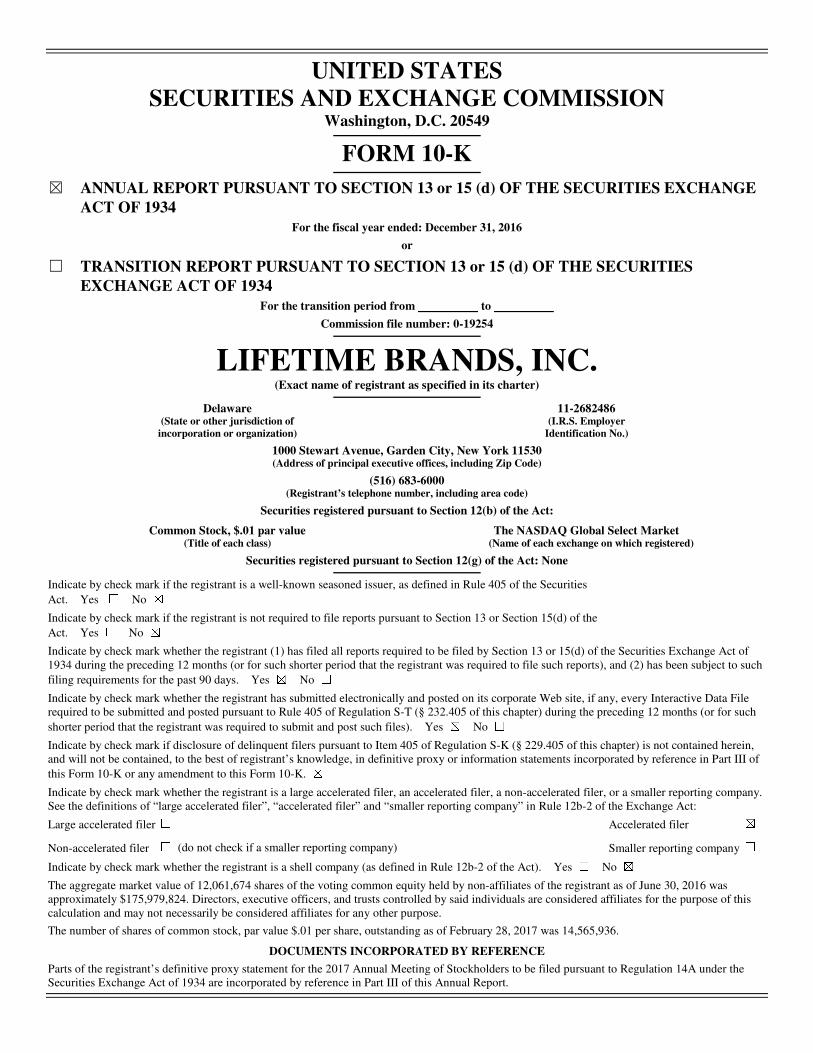
UNITED STATES SECURITIES AND EXCHANGE COMMISSION
Washington, D.C. 20549
FORM 10-K
☒ ANNUAL REPORT PURSUANT TO SECTION 13 or 15 (d) OF THE SECURITIES EXCHANGE
ACT OF 1934 For the fiscal year ended: December 31, 2016
or
☐ TRANSITION REPORT PURSUANT TO SECTION 13 or 15 (d) OF THE SECURITIES
EXCHANGE ACT OF 1934 For the transition period from to
Commission file number: 0-19254
LIFETIME BRANDS, INC. (Exact name of registrant as specified in its charter)
Delaware 11-2682486 (State or other jurisdiction of
incorporation or organization) (I.R.S. Employer
Identification No.)
1000 Stewart Avenue, Garden City, New York 11530 (Address of principal executive offices, including Zip Code)
(516) 683-6000 (Registrant’s telephone number, including area code)
Securities registered pursuant to Section 12(b) of the Act:
Common Stock, $.01 par value The NASDAQ Global Select Market (Title of each class) (Name of each exchange on which registered)
Securities registered pursuant to Section 12(g) of the Act: None
Indicate by check mark if the registrant is a well-known seasoned issuer, as defined in Rule 405 of the Securities Act. Yes ☐ No ☒ Indicate by check mark if the registrant is not required to file reports pursuant to Section 13 or Section 15(d) of the Act. Yes ☐ No ☒ Indicate by check mark whether the registrant (1) has filed all reports required to be filed by Section 13 or 15(d) of the Securities Exchange Act of 1934 during the preceding 12 months (or for such shorter period that the registrant was required to file such reports), and (2) has been subject to such
filing requirements for the past 90 days. Yes ☒ No ☐ Indicate by check mark whether the registrant has submitted electronically and posted on its corporate Web site, if any, every Interactive Data File required to be submitted and posted pursuant to Rule 405 of Regulation S-T (§ 232.405 of this chapter) during the preceding 12 months (or for such
shorter period that the registrant was required to submit and post such files). Yes ☒ No ☐ Indicate by check mark if disclosure of delinquent filers pursuant to Item 405 of Regulation S-K (§ 229.405 of this chapter) is not contained herein, and will not be contained, to the best of registrant’s knowledge, in definitive proxy or information statements incorporated by reference in Part III of
this Form 10-K or any amendment to this Form 10-K. ☒ Indicate by check mark whether the registrant is a large accelerated filer, an accelerated filer, a non-accelerated filer, or a smaller reporting company. See the definitions of “large accelerated filer”, “accelerated filer” and “smaller reporting company” in Rule 12b-2 of the Exchange Act:
Large accelerated filer ☐ Accelerated filer ☒
Non-accelerated filer ☐ (do not check if a smaller reporting company) Smaller reporting company ☐
Indicate by check mark whether the registrant is a shell company (as defined in Rule 12b-2 of the Act). Yes ☐ No ☒ The aggregate market value of 12,061,674 shares of the voting common equity held by non-affiliates of the registrant as of June 30, 2016 was approximately $175,979,824. Directors, executive officers, and trusts controlled by said individuals are considered affiliates for the purpose of this calculation and may not necessarily be considered affiliates for any other purpose. The number of shares of common stock, par value $.01 per share, outstanding as of February 28, 2017 was 14,565,936.
DOCUMENTS INCORPORATED BY REFERENCE Parts of the registrant’s definitive proxy statement for the 2017 Annual Meeting of Stockholders to be filed pursuant to Regulation 14A under the Securities Exchange Act of 1934 are incorporated by reference in Part III of this Annual Report.
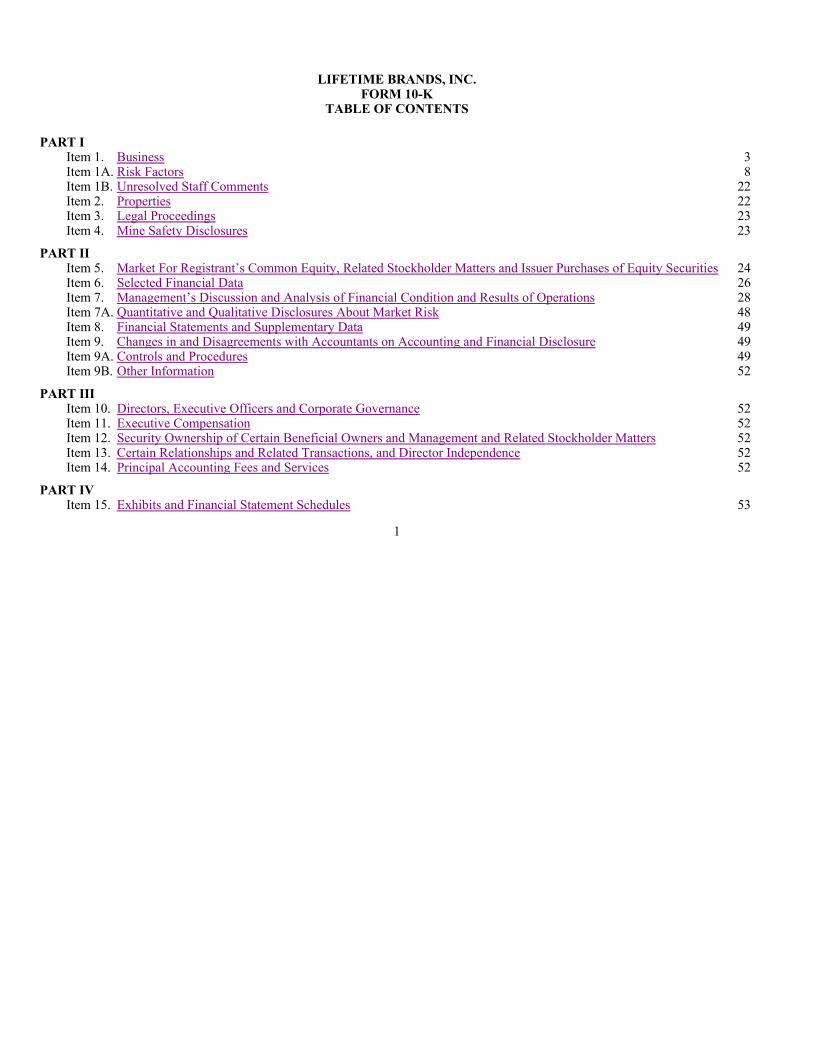
LIFETIME BRANDS, INC. FORM 10-K
TABLE OF CONTENTS
1
PART I Item 1. Business 3Item 1A. Risk Factors 8Item 1B. Unresolved Staff Comments 22Item 2. Properties 22Item 3. Legal Proceedings 23Item 4. Mine Safety Disclosures 23
PART II Item 5. Market For Registrant’s Common Equity, Related Stockholder Matters and Issuer Purchases of Equity Securities 24Item 6. Selected Financial Data 26Item 7. Management’s Discussion and Analysis of Financial Condition and Results of Operations 28Item 7A. Quantitative and Qualitative Disclosures About Market Risk 48Item 8. Financial Statements and Supplementary Data 49Item 9. Changes in and Disagreements with Accountants on Accounting and Financial Disclosure 49Item 9A. Controls and Procedures 49Item 9B. Other Information 52
PART III Item 10. Directors, Executive Officers and Corporate Governance 52Item 11. Executive Compensation 52Item 12. Security Ownership of Certain Beneficial Owners and Management and Related Stockholder Matters 52Item 13. Certain Relationships and Related Transactions, and Director Independence 52Item 14. Principal Accounting Fees and Services 52
PART IV Item 15. Exhibits and Financial Statement Schedules 53

DISCLOSURE REGARDING FORWARD-LOOKING STATEMENTS
This Annual Report on Form 10-K of Lifetime Brands, Inc. (the “Company” and, unless the context otherwise requires, references to the “Company” shall include its consolidated subsidiaries) contains “forward-looking statements” as defined by the Private Securities Litigation Reform Act of 1995. These forward-looking statements include information concerning the Company’s and its subsidiaries’ plans, objectives, goals, strategies, future events, future revenues, performance, capital expenditures, financing needs and other information that is not historical information. Many of these statements appear, in particular, under the headings Business and Management’s Discussion and Analysis of Financial Condition and Results of Operations included in Item 1 of Part I and Item 7 of Part II, respectively. When used in this Annual Report on Form 10-K, the words “estimates,” “expects,” “anticipates,” “projects,” “plans,” “intends,” “believes,” “may,” “should,” “seeks,” “potential” and variations of such words or similar expressions are intended to identify forward-looking statements. All forward-looking statements, including, without limitation, the Company’s examination of historical operating trends, are based upon the Company’s current expectations and various assumptions. The Company believes there is a reasonable basis for its expectations and assumptions, but there can be no assurance that the Company will realize its expectations or that the Company’s assumptions will prove correct.
There are a number of risks and uncertainties that could cause the Company’s actual results to differ materially from the forward-looking statements contained in this Annual Report. Important factors that could cause the Company’s actual results to differ materially from those expressed as forward-looking statements are set forth in this Annual Report, including the risk factors discussed in Part I, Item 1A under the heading Risk Factors.
Except as may be required by law, the Company undertakes no obligation to publicly update or revise forward-looking statements which may be made to reflect events or circumstances after the date made or to reflect the occurrence of unanticipated events.
WHERE YOU CAN FIND OTHER INFORMATION
The Company is required to file its annual reports on Forms 10-K and quarterly reports on Forms 10-Q, and other reports and documents as required from time to time with the United States Securities and Exchange Commission (the “SEC”). The Company also maintains a website at http://www.lifetimebrands.com. Information contained on this website is not a part of or incorporated by reference into this annual report. The Company makes available on its website the Company’s Annual Report on Form 10-K, Quarterly Reports on Form 10-Q, current reports on Form 8-K and amendments to these reports as soon as reasonably practicable after these reports are filed with or furnished to the SEC. Users can access these reports free of charge on the Company’s website. The public may read and copy any materials that the Company files with the SEC at the SEC’s Public Reference Room at 100 F Street, NE, Washington, DC 20549. Information may be obtained with respect to the operation of the Public Reference Room by calling the SEC at 1-800-SEC-0330. The SEC also maintains an Internet site that contains reports, proxy and information statements, and other information regarding the Company’s electronic filings with the SEC at http://www.sec.gov.
2
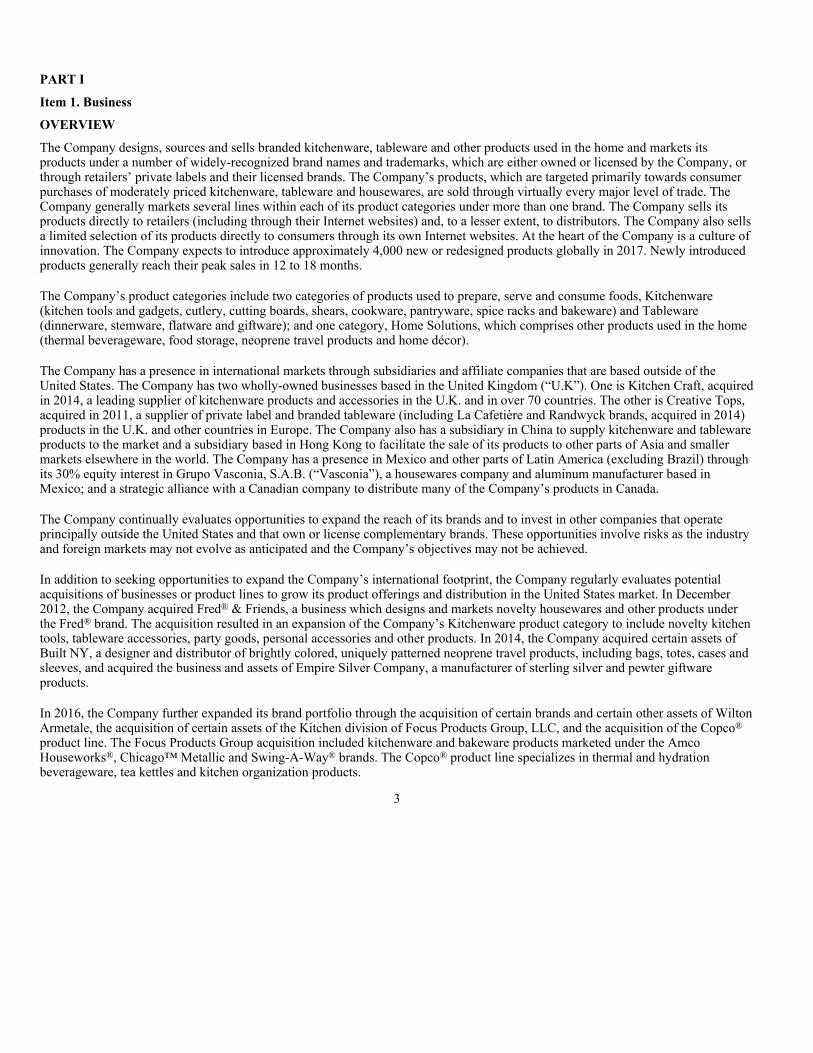
PART I
Item 1. Business
OVERVIEW
The Company designs, sources and sells branded kitchenware, tableware and other products used in the home and markets its products under a number of widely-recognized brand names and trademarks, which are either owned or licensed by the Company, or through retailers’ private labels and their licensed brands. The Company’s products, which are targeted primarily towards consumer purchases of moderately priced kitchenware, tableware and housewares, are sold through virtually every major level of trade. The Company generally markets several lines within each of its product categories under more than one brand. The Company sells its products directly to retailers (including through their Internet websites) and, to a lesser extent, to distributors. The Company also sells a limited selection of its products directly to consumers through its own Internet websites. At the heart of the Company is a culture of innovation. The Company expects to introduce approximately 4,000 new or redesigned products globally in 2017. Newly introduced products generally reach their peak sales in 12 to 18 months.
The Company’s product categories include two categories of products used to prepare, serve and consume foods, Kitchenware (kitchen tools and gadgets, cutlery, cutting boards, shears, cookware, pantryware, spice racks and bakeware) and Tableware (dinnerware, stemware, flatware and giftware); and one category, Home Solutions, which comprises other products used in the home (thermal beverageware, food storage, neoprene travel products and home décor).
The Company has a presence in international markets through subsidiaries and affiliate companies that are based outside of the United States. The Company has two wholly-owned businesses based in the United Kingdom (“U.K”). One is Kitchen Craft, acquired in 2014, a leading supplier of kitchenware products and accessories in the U.K. and in over 70 countries. The other is Creative Tops, acquired in 2011, a supplier of private label and branded tableware (including La Cafetière and Randwyck brands, acquired in 2014) products in the U.K. and other countries in Europe. The Company also has a subsidiary in China to supply kitchenware and tableware products to the market and a subsidiary based in Hong Kong to facilitate the sale of its products to other parts of Asia and smaller markets elsewhere in the world. The Company has a presence in Mexico and other parts of Latin America (excluding Brazil) through its 30% equity interest in Grupo Vasconia, S.A.B. (“Vasconia”), a housewares company and aluminum manufacturer based in Mexico; and a strategic alliance with a Canadian company to distribute many of the Company’s products in Canada.
The Company continually evaluates opportunities to expand the reach of its brands and to invest in other companies that operate principally outside the United States and that own or license complementary brands. These opportunities involve risks as the industry and foreign markets may not evolve as anticipated and the Company’s objectives may not be achieved.
In addition to seeking opportunities to expand the Company’s international footprint, the Company regularly evaluates potential acquisitions of businesses or product lines to grow its product offerings and distribution in the United States market. In December 2012, the Company acquired Fred® & Friends, a business which designs and markets novelty housewares and other products under the Fred® brand. The acquisition resulted in an expansion of the Company’s Kitchenware product category to include novelty kitchen tools, tableware accessories, party goods, personal accessories and other products. In 2014, the Company acquired certain assets of Built NY, a designer and distributor of brightly colored, uniquely patterned neoprene travel products, including bags, totes, cases and sleeves, and acquired the business and assets of Empire Silver Company, a manufacturer of sterling silver and pewter giftware products.
In 2016, the Company further expanded its brand portfolio through the acquisition of certain brands and certain other assets of Wilton Armetale, the acquisition of certain assets of the Kitchen division of Focus Products Group, LLC, and the acquisition of the Copco® product line. The Focus Products Group acquisition included kitchenware and bakeware products marketed under the Amco Houseworks®, Chicago™ Metallic and Swing-A-Way® brands. The Copco® product line specializes in thermal and hydration beverageware, tea kettles and kitchen organization products.
3

The Company is a Delaware corporation, incorporated on December 22, 1983.
The Company’s top brands and their respective product categories are:
With the exception of the Company’s sterling silver products, the Company sources almost all of its products from suppliers located outside the United States, primarily in the People’s Republic of China. The Company manufactures its sterling silver products at a leased facility in San Germán, Puerto Rico and fills canisters with spices and assembles spice racks at its owned Winchendon, Massachusetts distribution facility.
BUSINESS SEGMENTS
The Company’s segments include three categories, U.S. Wholesale, International and Retail Direct. The U.S. Wholesale segment includes the domestic operations of the Company’s primary business that designs, markets and distributes its products to retailers and distributors. Certain business operations conducted outside the U.S. are included in the International segment. The Retail Direct segment is that in which the Company markets and sells a limited selection of its products through its Pfaltzgraff, Mikasa, Built NY, Fred & Friends and Lifetime Sterling internet websites. The Company has segmented its operations to reflect the manner in which management reviews and evaluates the results of its operations.
Additional information regarding the Company’s reportable segments is included in Note K of the Notes to the Consolidated Financial Statements included in Item 15.
CUSTOMERS
The Company’s wholesale customers include mass merchants, specialty stores, national chains, department stores, warehouse clubs, supermarkets, off-price retailers, home and garden centers, pharmacies and Internet retailers.
4
Brand Licensed/Owned Product CategoryFarberware® Licensed (1) KitchenwareMikasa® Owned Tableware and Home SolutionsKitchenAid® Licensed KitchenwarePfaltzgraff® Owned Kitchenware, Tableware and Home SolutionsKitchenCraft® Owned KitchenwareSabatier® Licensed KitchenwareMossy Oak® Licensed Kitchenware, Tableware and Home SolutionsKamenstein® Owned Kitchenwaremasterclass® Owned KitchenwareTowle® Owned TablewareFred® Owned KitchenwareCopco® Owned Kitchenware and Home SolutionsChicago™ Metallic Licensed (2) KitchenwareWilton Armetale® Owned TablewareSwing-A-Way® Owned Kitchenware
(1) The Company has a royalty free license to utilize the Farberware® brand for kitchenware and tableware products for a term that expires in 2195, subject to earlier termination under certain circumstances.
(2) The Company has an exclusive perpetual, royalty free, license to use the Chicago TM Metallic trademark.
The Company’s products are sold globally to a diverse customer base including mass merchants (such as Walmart and Target), specialty stores (such as Bed Bath & Beyond and Dunelm), national chains (such as Kohl’s and JCPenney), department stores (such as Macy’s and Bon-Ton), warehouse clubs (such as Costco, Sam’s Club and BJs), supermarkets (such as Stop & Shop, Meijer, Winn-Dixie, Kroger, Tesco and Sainsbury’s), off-price retailers (such as TJX Companies, Ross Stores and Big Lots), home and garden centers (such as TrueValue, ACE Hardware Stores and Wyevale), pharmacies (such as Walgreens) and Internet retailers (such as Amazon). The Company also does business with independent retailers, including through business-to-business Internet sites aimed at independent retailers.
The Company also operates its own consumer Internet sites that provide information about the Company’s products and offer consumers the opportunity to purchase a limited selection of the Company’s products directly from the Company.
During the years ended December 31, 2016, 2015 and 2014, Wal-Mart Stores, Inc., including Sam’s Club and Asda Superstore, (“Walmart”), accounted for 16% of consolidated net sales, in each period. During the year ended December 31, 2016, Costco Wholesale Corporation, (“Costco”), accounted for 10% of consolidated net sales. No other customer accounted for 10% or more of the Company’s net sales during these periods.
DISTRIBUTION
The Company sells its products directly to retailers and, to a lesser extent, to distributors. The Company also sells a limited quantity of the Company’s products to individual consumers and smaller retailers through its own Internet sites. The Company operates distribution centers at the following locations:
SALES AND MARKETING
The Company’s sales and marketing staff coordinates directly with its wholesale customers to devise marketing strategies and merchandising concepts and to furnish advice on advertising and product promotion. The Company has developed many promotional programs for use in the ordinary course of business to promote sales throughout the year.
The Company’s sales and marketing efforts are supported from its principal offices and showroom in Garden City, New York; as well as showrooms in New York, New York; Medford, Massachusetts; Atlanta, Georgia; Bentonville, Arkansas; Carlisle, Pennsylvania; Issaquah, Washington; Pawtucket, Rhode Island; Menomonee Falls, Wisconsin; Birmingham, England; Corby, England, Maastricht, Netherlands and Hong Kong.
The Company generally collaborates with its largest wholesale customers and in many instances produces specific versions of the Company’s product lines with exclusive designs and/or packaging for their stores.
DESIGN AND INNOVATION
At the heart of the Company is a culture of innovation and new product development. The Company’s global in-house design and development teams currently consist of 122 professional designers, artists and engineers. Utilizing the latest available design tools, technology and materials, these teams create new products, redesign existing products and create packaging and merchandising concepts.
5
Location Size
(square feet) Fontana, California 753,000 Robbinsville, New Jersey 700,000 Birmingham, England 183,000 Winchendon, Massachusetts 175,000 Corby, England 143,000 Medford, Massachusetts 5,590

SOURCES OF SUPPLY
The Company sources its products from hundreds of suppliers. Most of the Company’s suppliers are located in the People’s Republic of China. The Company also sources products from suppliers in Hong Kong, the United States, the United Kingdom, Vietnam, Malaysia, India, Slovakia, Indonesia, Taiwan, Mexico, Thailand, Portugal, American Samoa, Italy, Slovenia, Japan, Korea, France, Poland, Netherlands, Czech Republic, Canada, Germany, Belgium and Israel. The Company orders products substantially in advance of the anticipated time of their sale by the Company. The Company does not have any formal long-term arrangements with any of its suppliers and its arrangements with most manufacturers allow for flexibility in modifying the quantity, composition and delivery dates of orders.
MANUFACTURING
The Company manufactures its sterling silver products at its leased manufacturing facility in San Germán, Puerto Rico and fills jars and other canisters with spices and assembles spice racks at the Company’s owned Winchendon, Massachusetts distribution facility. The Company does not manufacture any of its other products.
COMPETITION
The markets for kitchenware, tableware and other products used in the home including home décor products are highly competitive and include numerous domestic and foreign competitors, some of which are larger than the Company. The primary competitive factors in selling such products to retailers are innovative products, brand, quality, aesthetic appeal to consumers, packaging, breadth of product line, distribution capability and selling price.
PATENTS
The Company owns approximately 350 design and utility patents. The Company believes that the expiration of any of its patents would not have a material adverse effect on the Company’s business.
BACKLOG
Backlog is not material to the Company’s business, because actual confirmed orders from the Company’s customers are typically received within close proximity to the required shipment dates.
EMPLOYEES
At December 31, 2016, the Company had a total of 1,384 full-time employees, of whom 208 were located in Asia and 326 in Europe. In addition, the Company employed 32 people on a part-time basis, predominately in Corporate Marketing/Sales Support. The Company also hires seasonal workers at its distribution centers through temporary staffing agencies. None of the Company’s employees are represented by a labor union or subject to collective bargaining agreements, except as required by local law.
REGULATORY MATTERS
The Company and its affiliates are subject to significant regulation by various governmental, regulatory and other administrative authorities.
As a manufacturer and distributor of consumer products, the Company is subject to the Consumer Products Safety Act in the United States and the Consumer Protection Act in the United Kingdom. Additionally, laws regulating certain consumer products exist in some cities and states, as well as in other countries in which the Company or its subsidiaries and affiliates sell products.
The Company’s spice filling operation is regulated by the Food and Drug Administration.
The Company’s operations also are subject to national, state and local environmental and health and safety laws and regulations, including those that impose workplace standards and regulate the discharge of pollutants into the environment and establish standards for the handling, generation, emission, release, discharge, treatment, storage and disposal of materials and substances including solid and hazardous wastes.
6
The Company is subject to risks and uncertainties associated with economic and political conditions in foreign countries, including but not limited to, foreign government regulations, taxes including value-added taxes, import and export duties and quotas, anti-dumping regulations and related tariffs associated with certain types of products, incidents and fears involving security, terrorism and wars, political unrest and other restrictions on trade and travel.
SEASONALITY
The Company’s business and working capital needs are highly seasonal, with a majority of sales occurring in the third and fourth quarters. In 2016, net sales in the third and fourth quarters accounted for 61% of total annual net sales. In anticipation of the pre-holiday shipping season, inventory levels increase primarily in the June through October time period.
GEOGRAPHIC INFORMATION
Geographic information concerning the Company’s revenues and long-lived assets is contained in Note K of the Notes to the Consolidated Financial Statements included in Item 15 of this annual report.
RESTRUCTURING
In 2015 the Company commenced an in-depth review of its U.S. Wholesale business segment, which included the evaluation of the segment’s efficiency and effectiveness, with the objective of developing a plan to restructure its operations as appropriate. During 2016 the Company expanded this restructuring plan to focus on specific actions required to achieve the plan’s objectives. The restructuring plan included the realignment of product categories to best achieve the Company’s strategic plan and the implementation of cost reduction initiatives. During the years ended December 31, 2016 and 2015, the Company recorded $2.4 million and $437,000, respectively, of restructuring expense. The Company does not expect to incur additional charges related to the U.S. Wholesale restructuring.
7

Item 1A. Risk Factors
The Company’s businesses, operations, liquidity and financial condition are subject to various risks. The Company’s business, financial condition or results of operation could be significantly affected by the risks below or additional risks not presently known to the Company or by risks that the Company presently deems immaterial such as changes in the economy, disruptions due to terrorist activity or manmade or natural disasters, or changes in law or accounting standards. The risks and uncertainties described below are those that the Company considers material.
Economic and political risks
The Company may be adversely affected by changes in U.S. and non-U.S. tax laws in the countries in which it operates.
The U.S. Congress and the Administration have indicated a desire to reform the U.S. corporate income tax code. A significant objective of the tax reform under consideration is to discourage the importation of goods manufactured outside the U.S. and encourage the export of goods manufactured in the U.S. (commonly referred to as a border adjustment tax). Substantially all the Company’s products are manufactured outside the U.S. and a significant majority of its products are sold in the U.S. Additionally, there may be other U.S. tax code changes that adversely affect the Company including elimination of interest expense deductions. At this time, it is not possible to measure the potential impact of the proposed U.S. corporate tax reform on the Company’s tax expense. However, based on the Company’s initial understanding, the impact of certain proposals could be material to its tax expense and profitability. The Company may not be able to fully offset any such incremental tax increase through product price. Significant increases in product prices would likely decrease customer and consumer demand for the Company’s products. Any significant changes in current U.S. tax code could have a material adverse effect upon the Company’s results of operations.
The Company’s business may be materially adversely affected by market conditions and by global and economic conditions and other factors beyond its control.
The Company’s performance is affected by general economic factors, the strength of retail economies and political conditions that are beyond its control. Retail economies are impacted by factors such as consumer demand and the condition of the retail industry, which in turn, are affected by general economic factors. These general economic factors include, among other factors:
The referendum held in the United Kingdom (“U.K.”) on June 23, 2016 resulted in a determination that the U.K. should exit the European Union. Such an exit from the European Union would be unprecedented and it is unclear what impact this would have on the U.K.’s access to the EU Single Market and on the legal and regulatory environment in which the Company operates, as well as its effect on the global macroeconomic environment. The Company has two wholly-owned businesses based in the U.K., Kitchen Craft and Creative Tops. Net sales attributable to these U.K. domiciled businesses were $98.1 million for the year ended December 31, 2016, and represent approximately 17% of the Company’s
8
• recession, inflation, deflation, unemployment and other factors adversely affecting consumer spending patterns generally;
• conditions affecting the retail environment for the home and other matters that influence consumer spending in the home retail industry specifically;
• conditions affecting the housing markets;
• consumer credit availability and consumer debt levels;
• material input costs, including fuel and energy costs and labor cost inflation;
• foreign currency translation;
• interest rates and the ability to hedge interest rate risks;
• government policies including tax policies relating to value-added taxes, import and export duties and quotas, antidumping regulations and related tariffs, import and export controls and social compliance standards;
• the impact of natural disasters, conflicts and terrorist activities;
• unfavorable economic conditions in the United States, the United Kingdom, Continental Europe, Asia and elsewhere; and
• unstable economic and political conditions, lack of legal regulation enforcement, civil unrest and political activism, particularly in Asia.
consolidated net sales for the period. The uncertainty surrounding the terms of the U.K.’s exit and its consequences could adversely impact the U.K economy, customers and investor confidence. It may contribute to additional market volatility, including volatility in the value of the British pound and European euro, and adversely affect the Company’s businesses, results of operations, and financial condition.
Liquidity and financial risks
The Company has substantial indebtedness and the Company’s business is highly seasonal.
The Company has a substantial amount of indebtedness and is dependent on the availability of its bank loan facilities to finance its liquidity needs. The Company’s Second Amended and Restated Credit Agreement with JPMorgan Chase Bank, N.A, as Administrative Agent and Co-Collateral Agent, and HSBC Bank USA, National Association, as Syndication Agent and Co-CollateralAgent, and the other Lenders and Loan Parties party thereto, as amended, (the “Credit Agreement”) provides for, among other things, a Revolving Credit Facility commitment totaling $175.0 million (the “Revolving Credit Facility”) and a term loan facility with an outstanding balance of $9.5 million at December 31, 2016 (“Term Loan”). As of December 31, 2016, the Company had approximately $95.8 million of consolidated debt, including $95.7 million under the Credit Agreement, representing approximately 24% of total capital (indebtedness plus stockholders’ equity). The Company may borrow under its Revolving Credit Facility, subject to the limitations of a borrowing base. Because the borrowing capacity under the Revolving Credit Facility depends on levels of eligible inventory, accounts receivable and the appraised value of certain intellectual property that fluctuate from time to time, the full commitment amount may not represent actual borrowing capacity. The financial covenants in the Credit Agreement limit the Company’s ability to incur indebtedness. The Company may be unable to generate cash sufficient to pay when due the principal of, interest on, or other amounts due with respect to, its indebtedness. In addition, the Company’s business is seasonal with a significant amount of its revenue being realized during the latter portion of the year. Therefore, the Company’s borrowing needs fluctuate widely based upon its working capital requirements.
The Company’s leverage and the effects of seasonal fluctuations in its cash flow, borrowing requirements and ability to borrow could have significant negative consequences on the Company’s financial condition and results of operations, including:
9
• impairing the Company’s ability to meet one or more of the financial covenants contained in its debt agreements or to
generate cash sufficient to pay interest or principal due under those agreements, which could result in an acceleration of some or all of the Company’s outstanding debt;
• increasing the Company’s vulnerability to general adverse economic and industry conditions;
• limiting the Company’s ability to obtain additional debt or equity financing;
• increasing the Company’s borrowing costs if it were to obtain additional debt financing or amend its existing debt agreements;
• requiring the dedication of a substantial portion of the Company’s cash flow from operations to service the Company’s
debt, thereby reducing the amount of cash flow available for other purposes, including working capital, capital expenditures and acquisitions;
• requiring the Company to seek debt or equity financing or to sell some of the Company’s core assets, possibly on unfavorable terms, to meet payment obligations;
• limiting the Company’s flexibility in planning for, or reacting to, changes in its business and the markets in which the Company competes;
• limiting the Company’s ability to declare and pay dividends to its stockholders and/or engage in share repurchase programs; and
• placing the Company at a possible competitive disadvantage to less leveraged competitors and competitors that may have better access to capital resources.

The Company’s failure to meet certain covenants or comply with other requirements of its Credit Agreement may materially and adversely affect the Company’s assets, financial position and cash flows.
The Credit Agreement, under certain circumstances, requires the Company to maintain a certain fixed charge coverage ratio. In addition, at any time the Company’s Term Loan is outstanding, the Company’s Credit Agreement requires the Company to maintain its Senior Leverage Ratio within defined parameters. As a result of these requirements within the Credit Agreement, the Company is limited in its ability to incur additional debt, make investments or undertake certain other business activities. These requirements could limit the Company’s ability to obtain future financing and may prevent the Company from taking advantage of attractive business opportunities. The Company’s ability to meet the covenants or requirements in its Credit Agreement may be affected by events beyond the Company’s control, and the Company cannot assure you that it will satisfy such covenants and requirements. A breach of these covenants or the Company’s inability to comply with the restrictions could result in an event of default under the Credit Agreement, which in turn could result in an event of default under the terms of the Company’s other indebtedness. Upon the occurrence of an event of default under the Company’s Credit Agreement, after the expiration of any grace periods, the Company’s lenders could elect to declare all amounts outstanding under the Company’s debt arrangements, together with accrued interest, to be immediately due and payable. If this happens, the Company cannot assure that its assets would be sufficient to repay in full the amounts due under the Credit Agreement or the Company’s other indebtedness.
The Company’s sale of certain accounts receivables subjects the Company to additional liquidity risks.
In order to improve its liquidity during seasonally high working capital periods, in 2016 the Company entered into an uncommitted Receivables Purchase Agreement with HSBC Bank USA, National Association (“HSBC”), as Purchaser (the “Receivables Purchase Agreement”). If HSBC terminates the Company’s Receivables Purchase Agreement, the Company may experience a material and adverse loss of its liquidity, which could have a material adverse effect on its financial condition, results of operations and cash flows.
The Company’s borrowings, and discount rate applied to sale of receivables, are subject to interest rate fluctuations and an increase in interest rates could adversely affect the Company’s financial results.
The Company’s borrowings bear interest at floating rates. An increase in interest rates would adversely affect the Company’s profitability. To the extent that the Company’s access to credit may be restricted because of its own performance, its bank lenders’ performances or conditions in the capital markets generally, the Company would not be able to operate normally.
The Company’s Receivables Purchase Agreement also depends upon LIBOR, as it is a component of the discount rate applicable to the agreement. If LIBOR increases, the Company may not be able to rely on the Receivables Purchase Agreement, which could have a material and adverse effect upon the Company’s financial condition, results of operations and cash flows.
Foreign exchange variability could materially adversely affect the Company’s operating results.
The Company’s functional currency is the U.S. Dollar. Changes in the relation of foreign currencies to the U.S. Dollar will affect the Company’s sales and profitability and can result in exchange losses because the Company has operations and assets located outside the United States. The Company transacts a portion of its business in currencies other than the U.S. Dollar, primarily British Pounds, and to a lesser degree, Chinese Renminbi, Euros and Canadian Dollars. Such transactions include sales, certain inventory purchases and operating expenses. As a result, portions of the Company’s cash, trade accounts receivable and trade accounts payable are denominated in foreign currencies. Accordingly, foreign operations expose the Company to foreign currency fluctuations, both for purposes of actual conversion and financial reporting purposes. In the consolidated financial statements, local currency financial results are translated into U.S. dollars based on the exchange rates prevailing during the reporting periods. During times of a strengthening U.S. dollar, the reported revenues and earnings of the international operations will be reduced because the local currencies will translate into fewer U.S. dollars.
The Company’s strategic alliances in Mexico and Canada also subject the Company to increases and decreases in its investments resulting from the impact of fluctuations in foreign currency exchange rates.
The vast majority of products are purchased from China in U.S. Dollars, including products purchased by the Company’s international operations. As a result, the gross margin from international operations is subject to volatility from
10
movements in exchange rates, which could have an adverse effect on the financial condition and results of operations and profitability from the growth desired from international operations. The Company has entered into foreign exchange derivative financial instruments to hedge the volatility of exchange rates related to a portion of its international inventory purchases. The Company cannot ensure, however, that these hedges will fully offset the impact of foreign currency rate movements. If the Chinese Renminbi should appreciate against the U.S. Dollar, the costs of the Company’s products will likely rise over time because of the impact the fluctuations will have on the Company’s suppliers, and the Company may not be able to pass on these price increases to its customers. The Company is also subject to the risks of currency controls and devaluations. Currency controls may limit the Company’s ability to convert currencies into U.S. Dollars or other currencies, as needed, or to pay dividends or make other payments from funds held by subsidiaries in the countries imposing such controls, which could adversely affect the Company’s liquidity.
As the Company continues to expand its international operations, it will be subject to increased foreign exchange variability which could have a material adverse effect on the Company’s results of operations. The impact of future exchange rate fluctuations on the Company’s results of operations cannot be accurately predicted.
The Company’s business requires it to maintain large fixed-costs that can affect its profitability. Cost reduction efforts and restructurings benefits may not be realized.
The Company’s business requires it to maintain large distribution facilities in its key markets, which represent high fixed rental costs relating to its leased facilities. In addition, significant portions of the Company’s selling, general and administrative expenses, including leased showrooms, are fixed, they neither increase nor decrease proportionally with sales. Furthermore, the Company’s gross margins depend, in part, on its ability to spread certain other costs, of which a significant portion are fixed, over its products sold. Decreased demand or the need to reduce inventories can lower the Company’s ability to absorb fixed costs and adversely affect its results of operations. This is exacerbated by the high degree of seasonality impacting the Company, which results in lower demand during the first two quarters of the year, while many of the operating costs remain fixed, which further affects profitability.
In order to operate more efficiently and control costs, the Company may announce from time to time restructuring plans, including workforce reductions, global facility consolidations and other cost reduction initiatives that are intended to generate operating expense savings. The implementation of restructuring plans could be disruptive to the Company’s operations, result in higher than anticipated charges and otherwise adversely affect the Company’s results of operations and financial condition. In addition, the Company’s ability to complete the restructuring plan and achieve the anticipated benefits from the plan is subject to estimates and assumptions and may vary materially from the Company’s expectations, including as a result of factors that are beyond the Company’s control. Furthermore, following completion of a restructuring plan, the business may not be more efficient or effective than prior to implementation of the plan.
If the Company’s goodwill or other long-term assets become impaired, the Company will be required to record impairment charges, which may be significant.
A portion of the Company’s long-term assets consists of goodwill recorded as a result of the Company’s acquisitions; other identifiable intangible assets, including trade names; and fixed assets. At December 31, 2016, goodwill totaled $14.2 million. The Company does not amortize goodwill but rather reviews it for impairment on an annual basis or more frequently whenever events or changes in circumstances indicate that its carrying value may not be recoverable. If the carrying value of a reporting unit exceeds its current fair value as determined based on the discounted future cash flows of the reporting unit or comparable market sales and earnings multiples, the goodwill or intangible asset is considered impaired and is reduced to fair value. Events and conditions that could result in impairment include a prolonged period of global economic weakness, a decline in economic conditions or a slow, weak economic recovery, as well as sustained declines in the price of the Company’s common stock, adverse changes in the regulatory environment, adverse changes in the market share of the Company’s products, adverse changes in interest rates, corporate income tax reforms or other factors leading to reductions in the long-term sales or profitability that we expect. Determination of the fair value of a reporting unit includes developing estimates which are highly subjective and incorporate calculations that are sensitive to minor changes in underlying assumptions. Management’s assumptions change as more information becomes available. Changes in these assumptions could result in an impairment charge in the future, which could have a significant adverse impact on the Company’s reported earnings. If future operating performance of one or more of the Company’s operating segments does not meet expectations, the Company may be required to record a significant charge during the period in which any impairment of the Company’s goodwill or other long-term assets is determined.
11
As of October 1, 2016, the fair value of the Creative Tops reporting unit, which carries goodwill of $2.1 million, was approximately 3% below its carrying value. The decline in fair value was due to the forecasted sales and profits for the reporting unit falling below expectations relative to the Company’s previous projections and the macroeconomic conditions in Europe contributing to a decline in EBITDA. With the assistance of a third party valuation specialist the Company performed the second step of the impairment test by estimating the fair value of the assets and liabilities to determine the implied fair value of goodwill. The implied fair value of goodwill was determined to be greater than the carrying value and no impairment charge was recorded. Changes in any of the significant assumptions used in the calculation of the fair value of the reporting unit or changes in the assumptions used in the calculation of the fair value of the assets and liabilities of the reporting unit, could lead to a potentially material non-cash impairment charge.
As of October 1, 2016, the excess of fair value of the Kitchen Craft reporting unit, which carries goodwill of $9.7 million, was approximately 3% over its carrying value. Macroeconomic conditions in Europe have contributed to a decline in the reporting unit’s EBITDA. Management’s projections used to estimate the cash flows include increasing net sales and operational improvements designed to reduce costs. Changes in any of the significant assumptions used could materially affect the expected cash flows, and such impacts could result in the requirement to proceed to the second step of the test and potentially a material non-cash impairment charge could result. The Company is not currently aware of any negative changes in its assumptions that could lead to the fair value of the reporting unit being less than the carrying value.
For the year ended December 31, 2014, the Company recorded an impairment charge of $3.4 million to reduce the book value of Elements and Melannco, home decor trade names. In addition, during 2014, the Company recorded an impairment charge of $6.0 million related to its investment in GSI.
The recognition of an impairment of the Company’s goodwill or any of the Company’s assets would negatively affect the results of operations and total capitalization, the effect of which could be material.
The Company’s ability to complete future acquisitions or strategic alliances and/or integrate acquired businesses could have a material adverse effect on the Company’s business and results of operations.
The Company has achieved growth through acquisitions, investments and joint ventures. The Company has completed approximately 18 acquisitions and strategic investments since 2006, including three acquisitions completed in 2016. The Company seeks acquisition opportunities that complement and expand its operations, some of which are based outside the United States. There can be no assurance that the Company will be able to identify and successfully negotiate suitable acquisitions, obtain financing for future acquisitions on satisfactory terms, obtain regulatory approval or otherwise complete acquisitions in the future.
Additionally, the Company may not be able to successfully integrate these businesses or future acquisitions into its existing business without substantial costs, delays or other operational or financial difficulties. The Company could face significant challenges in consolidating functions and integrating procedures and processes, internal controls, information technology and other systems, personnel, product lines and operations in a timely and efficient manner.
The Company’s projections of product demand, sales and net income are highly subjective in nature and the Company’s future sales and net income could vary in a material amount from the Company’s projections.
From time to time, the Company may provide projections to its stockholders, lenders, the investment community, and other stakeholders of the Company’s future sales and net income. Since the Company does not have long-term purchase commitments from customers and the customer order and shipment process is very short, it is difficult for the Company to accurately predict the demand for many of its products, or the amount and timing of the Company’s future sales and related net income. The Company’s projections are based on management’s best estimate of sales using historical sales data and other information deemed relevant. These projections are highly subjective since sales can fluctuate substantially based on the demands of retail customers and due to other risks described in this Annual Report. Additionally, changes in retailer inventory management strategies could make the Company’s inventory management more difficult. Because the Company’s ability to forecast product demand and the timing of related sales includes significant subjective input, future sales and net income could vary materially from the Company’s projections.
12

Increases in the cost of employee benefits could materially adversely impact the Company’s financial results and cash flows.
The Company self-insures a substantial portion of the costs of employee healthcare and workers compensation. This could result in higher volatility in the Company’s earnings and exposes the Company to higher financial risks. The Company’s medical costs in recent years have generally increased and an aging workforce and other employee demographics could result in an increase in medical costs beyond what we have experienced or expect. We have stop-loss coverage in place for catastrophic events, but the aggregate impact of a high number of claims up to our stop-loss limit may have an effect on our profitability.
There are inherent limitations on the effectiveness of the Company’s controls.
The Company does not expect that its disclosure controls or the Company’s internal controls over financial reporting will prevent or detect all errors and all fraud. A control system, no matter how well-designed and operated, can provide only reasonable, not absolute, assurance that the control system’s objectives will be met. The design of a control system must reflect the fact that resource constraints exist, and the benefits of controls must be considered relative to their costs. Further, because of the inherent limitations in all control systems, no evaluation of controls can provide absolute assurance that misstatements due to error or fraud will not occur or that all control issues and instances of fraud, if any, have been detected. The design of any system of controls is based in part on certain assumptions about the likelihood of future events, and there can be no assurance that any design will succeed in achieving its stated goals under all potential future conditions. Projections of any evaluation of the effectiveness of controls to future periods are subject to risks. Over time, controls may become inadequate due to changes in conditions or deterioration in the degree of compliance with policies or procedures. If the Company’s controls become inadequate, it could fail to meet its financial reporting obligations, its reputation may be adversely affected, its business and operating results could be harmed, and the market price of its stock could decline.
Customer risks
The Company faces intense competition from other companies worldwide.
The markets for the Company’s products are intensely competitive with the principal competitive factors being product innovation, brand name, product quality, aesthetic appeal to customers, packaging, breadth of product offerings, distribution capability, delivery time and price. Advantages or disadvantages in any of these competitive factors may be sufficient to cause the customer to consider changing providers of the kinds of products that the Company sells. The Company competes with many other suppliers, some of which are larger than the Company, have greater financial and other resources or employ brands that are more established, have greater consumer recognition or are more favorably perceived by consumers or retailers than the Company’s brands. Some competitors may be willing to reduce prices and accept lower profit margins to compete with the Company. As a result of this competition, the Company could lose market share and sales, or be forced to reduce its prices to meet competition. If the Company’s product offerings are unable to compete successfully, the Company’s business, results of operations and financial condition could be materially and adversely affected.
Changes in the Company’s customer purchasing practices could materially adversely affect the Company’s operating results.
The Company’s wholesale customers include mass merchants, specialty stores, national chains, department stores, warehouse clubs, supermarkets, off-price retailers and Internet retailers. Unanticipated changes in purchasing and other practices by the Company’s customers, including a customer’s pricing and payment terms, inventory destocking, limitations on shelf space, more extensive packaging requirements, changes in order quantities, use of private label brands and other practices, could materially and adversely affect the Company’s business, results of operations and financial condition. In addition, as a result of the desire of retailers to more closely manage inventory levels, there is a growing trend among retailers to make purchases on a “just-in-time” basis. This requires the Company to shorten its lead time for production in certain cases and more closely anticipate demand, which could in the future require the Company to carry additional inventories. The Company’s annual earnings and cash flows also depend to a great extent on the results of operations in the latter half of the year due to the seasonality of its sales. The Company’s success and sales growth is also dependent on its evaluation of consumer preferences and changing trends.
13
As certain online retailers grow they may continue to demand lower pricing, special packaging, shorter lead times for the delivery of products, smaller more frequent shipments, or impose other requirements on product suppliers. The cost of compliance with customers’ demands could have a material adverse effect on the Company’s business, results of operations and financial condition.
Many of the Company’s wholesale customers are significantly larger than the Company, have greater financial and other resources and also purchase goods directly from vendors in Asia and elsewhere. Decisions by large customers to increase their purchases directly from overseas vendors could have a material adverse effect on the Company’s business, results of operations and financial condition. Significant changes or financial difficulties, including consolidations of ownership, restructurings, bankruptcies, liquidations or other events that affect retailers, could result in fewer retailers selling the Company’s products, reliance on a smaller group of customers, an increase in the risk of extending credit to these customers or limitations on the Company’s ability to collect amounts due from these customers. Although the Company has long-established relationships with many of its customers, the Company does not have any long-term supply or binding contracts or guarantees of minimum purchases. Purchases by the Company’s customers are generally made using individual purchase orders. Customers may cancel their orders, change purchase quantities from forecast volumes, delay purchases for a number of reasons beyond the Company’s control or change other terms of their business relationship with the Company. Significant or numerous cancellations, reductions, delays in purchases or changes in business practices by customers could have a material adverse effect on the Company’s business, results of operations and financial condition.
Retailers place great emphasis on timely delivery of products for specific selling seasons, especially during the third fiscal quarter, and on the fulfillment of consumer demand throughout the year. The Company cannot control all of the various factors that might affect product delivery to retailers. Failure to deliver products to the Company’s retailers in a timely and effective manner, often under special vendor requirements to use specific carriers and delivery schedules, could damage the Company’s reputation and brands and result in a loss of customers or reduced orders.
Changes at the Company’s large customers, or actions taken by them, and consolidation in the retail industry could materially adversely affect the Company’s operating results.
In 2016, Wal-Mart Stores, Inc., including Sam’s Club and, in the United Kingdom, Asda Superstore (“Walmart”), accounted for 16% of the Company’s consolidated net sales and Costco Wholesale Corporation (“Costco”), accounted for 10% of the Company’s consolidate net sales. The Company’s top ten customers accounted for approximately 56% of the Company’s net sales in 2016. A material reduction in sales to Walmart, Costco or other top customers in aggregate, could have a significant adverse effect on the Company’s business and operating results. In addition, pressures by such customers that would cause the Company to materially reduce the price of its products which could result in reduced operating margin. Any significant changes or financial difficulties that affect these customers, such as reduced sales by such customers (whether for reasons that affect a particular customer or the retail industry in general) may also result in reduced demand for the Company’s products. The Company would also be subject to increased credit risk with respect to such customers. In particular, the concentration of the Company’s business with Walmart extends to its international business, including in China, as well as through Vasconia in Mexico and the Company’s strategic alliance in Canada, due to the market presence of Walmart in these foreign countries. Any changes in purchasing practices or decline in the financial condition, of Walmart, Costco or other large customers may have a material adverse impact on the business, results of operations and financial condition of the Company.
The Company’s large customers also have significant purchasing leverage. Customers may demand lower pricing, special packaging, shorter lead times for the delivery of products or impose other requirements on product suppliers like the Company. These business demands may relate to inventory practices, logistics or other aspects of the customer-supplier relationship. If the Company does not effectively respond to the demands of its customers, they could decrease or eliminate their purchases from the Company. These risks could be exacerbated if such large customers consolidate, or if the Company’s smaller customers consolidate to become larger customers, which would increase their purchasing leverage. A reduction in the purchases of the Company’s products by its wholesale customers or the costs of complying with customer business demands could have a material adverse effect on the Company’s business, financial condition and results of operations.
14
The Company’s customers could carry products that directly compete with the Company’s products for retail space and consumer purchases. There is a risk that these customers could give higher priority to products of, or form alliances with, the Company’s competitors. Failure of customers to provide the Company’s products with similar levels of promotional support and retail space could have a material adverse effect on the Company’s business, results of operations and financial condition.
In addition, consumer’s growing preference for purchasing products online may reduce foot traffic at traditional retail stores and increase price competition for the Company’s products. If we do not effectively respond to evolving trends and demands from our customers, these customers could decrease their purchases. A reduction in the demand for the Company’s products could have a material adverse effect on our business, results of operations and financial condition.
Demand for new products and the inability to develop and introduce new competitive products at favorable profit margins could adversely affect the Company’s performance and prospects for future growth.
New product introductions and product innovation are significant contributors to the Company’s growth strategy and the Company’s long-term success in the competitive retail environment depends in part on the Company’s ability to develop and market a continuing stream of innovative new products that meet changing consumer preferences. The uncertainties associated with developing and introducing new products, such as the market demands and the costs of development and production may impede the successful development and introduction of new products. Acceptance of the new products may not meet sales expectations due to several factors, such as the Company’s failure to accurately predict market demand or its inability to resolve technical issues in a timely and cost-effective manner. Additionally, the inability to develop new products on a timely basis could result in the loss of business to competitors.
Supply chain risks
International suppliers subject the Company to regional regulatory, political, economic and foreign currency exchange risk that could materially and adversely affect the Company’s operating results.
The Company sources its products from suppliers located principally in Asia, Europe and the United States. The Company’s vendors in Asia, from whom a substantial majority of the Company’s products are sourced, are located primarily in the People’s Republic of China, which subjects the Company to various risks within the region including regulatory, political, economic and foreign currency changes. The Company’s ability to select and retain reliable vendors and suppliers who provide timely deliveries of quality parts and products efficiently will impact its success in meeting customer demand for timely delivery of quality products. The Company’s sourcing operations and its vendors are impacted by labor costs in China, where labor historically has been readily available at low cost relative to labor costs in North America. However, as China is experiencing rapid social, political and economic changes, labor costs have risen in some regions and labor in China may not continue to be available to the Company at costs consistent with historical levels. Changes in labor or other laws may be enacted which would have a material adverse effect on the Company’s operations in China, or those of the Company’s suppliers. Although China currently enjoys “most favored nation” trading status with the U.S., the U.S. government has in the past proposed to revoke such status and to impose higher tariffs on products imported from China. Changes in currency exchange rates might negatively affect the Company and its overseas vendors’ profitability and business prospects. The Company does not have access to its vendors’ financial information and the Company is unable to assess its vendors’ financial condition, including their liquidity. Interruption of supplies from any of the Company’s vendors, or the loss of one or more key vendors, could have a negative effect on the Company’s business and operating results.
The Company’s international trade subjects it to transportation risks.
The Company imports its products for delivery to its distribution centers, as well as arranges for its customers to import goods to which title has passed overseas or at port of entry. For purchases that are to be delivered to its distribution centers, the Company arranges for transportation, primarily by sea, from ports in Asia and Europe to ports in the United States, principally New York/Newark/Elizabeth and Los Angeles/Long Beach, and in the United Kingdom, principally Felixstowe. Accordingly, the Company is subject to risks incidental to such transportation. These risks include, but are not limited to, increases in fuel costs, fuel shortages, the availability of ships, increased security restrictions, work stoppages, weather disruptions and carriers’ ability to provide delivery services to meet the Company’s shipping needs. Transportation disruptions and increased transportation costs could materially adversely affect the Company’s business, results of operations and financial condition.
15

The Company depends on third-party manufactures to produce the majority of its products which presents quality control risks to the Company.
With the exception of the Company’s sterling silver products, the Company sources almost all of its products from suppliers located outside the United States, primarily in the People’s Republic of China, which restricts the Company’s ability to monitor and control their manufacture of the Company’s goods.
Although the Company has agreements with its third party manufacturers regarding quality standards and regularly audits the facilities of its manufacturers, through its quality control program, there can be no assurance that the third party manufacturers will continue to meet the Company’s quality standards, social standards regarding its workforce that is expected in the United States or legislation and regulations that apply to the products the Company contracts to manufacture. Failure by the Company’s manufacturers to meet these standards could, in turn, increase order cancellations, returns, price concessions and decrease customer demand for the Company’s products. Non-compliance with the Company’s product standards, regulatory requirements or product recall (or other regulatory actions) could have a material adverse effect on the Company’s financial condition, results of operations or cash flows.
The Company’s product costs are subject to price fluctuation.
Various commodities comprise the raw materials used to manufacture the Company’s products. The prices of these commodities have historically fluctuated on a cyclical basis and have often depended on a variety of factors over which the Company has no control. Additionally, labor costs represent a significant component of the Company’s supplier’s manufacturing costs and the Company’s suppliers may increase the prices they charge the Company if they experience rising labor costs. The cost of producing and distributing the Company’s products is also sensitive to energy costs, duties and tariffs. The selling prices of the Company’s products have not always increased in response to raw material, labor or other cost increases, and the Company is unable to determine to what extent, if any, it will be able to pass future cost increases through to its customers. The Company’s inability to come to favorable agreements with its suppliers or to pass increased costs through to the Company’s customers could materially and adversely affect its financial condition or results of operations.
Intellectual property risks
The loss of certain licenses or material changes in royalty rates could materially adversely affect the Company’s operating margin and cash flow.
Significant portions of the Company’s business are dependent on trade names, trademarks and patents, some of which are licensed from third parties. In 2016, sales of licensed brands accounted for approximately 40% of the Company’s gross sales. The Company’s licenses for many of these brands require it to pay royalties based on sales. Many of these license agreements are subject to termination by the licensor, if, for example, the Company fails to satisfy certain minimum sales obligations or breaches the terms of the license. The loss of significant licenses or a material increase in the royalty rates the Company pays or other new terms negotiated upon renewal of such licenses could result in a reduction of the Company’s operating margins and cash flow from operations or otherwise adversely affect its business.
The Company holds certain rights to use the Farberware brand for kitchen tools and gadgets, cutlery, cutting boards, shears and certain other products which together represent a material portion of its sales, through a fully-paid, royalty-free license for a term that expires in 2195, subject to earlier termination under certain circumstances. The licensor is a joint venture of which the Company is a 50% owner. The other 50% owner of the joint venture has the right to terminate the Company’s license if the Company materially breaches any of the material terms of the license and fails to cure the material breach within 180 days of notice of the breach, if it is determined in an arbitration proceeding that money damages alone would not be sufficient compensation to the licensor and that the breach is so egregious as to warrant termination of the license and forfeiture of the Company’s rights to use the brand under that license agreement. If the Company were to lose the Farberware license for kitchen tools and gadgets, cutlery, cutting boards, shears and other products through termination as a result of an uncured breach, its business, results of operations and financial condition would be materially adversely affected.
16

The Company’s license to use the KitchenAid brand, to a lesser extent, also represents a material portion of its sales and is subject to a license agreement that has a three-year term that will expire in December 2018. The Company originally entered into a licensing arrangement for use of the KitchenAid brand in 2000, and has renewed the license, typically for three-year periods, since that time. Although it expects to be able to renew its current KitchenAid license prior to its expiration, there is no assurance that the Company will be able to do so on reasonable terms, or at all, and any failure to do so could have a material adverse effect on the Company’s business, results of operations and financial condition.
The Company may not be able to adequately establish or protect its intellectual property rights, and the infringement or loss of the Company’s intellectual property rights could harm its business.
To establish and protect the Company’s intellectual property rights, the Company relies upon a combination of U.S., foreign and multi-national patent, trademark, copyright and trade secret laws, together with licenses, confidentiality agreements and other contractual arrangements. The measures that the Company takes to protect its intellectual property rights may prove inadequate to prevent third parties from infringing or misappropriating the Company’s intellectual property, or from breaching their contractual obligations to the Company.
The Company has obtained and applied for numerous U.S. and foreign trademark, service mark and patent registrations, and will continue to evaluate the registration of additional marks, patents or other intellectual property, as appropriate. The Company cannot guarantee that any of its pending applications will be approved by the applicable governmental authorities. Moreover, even if such applications are approved, third parties may seek to oppose, declare invalid or otherwise challenge these registrations. Failure to obtain registrations for the Company’s intellectual property in the United States and other countries could limit the Company’s ability to protect its intellectual property rights and impede the Company’s marketing efforts and operations in those jurisdictions.
The Company may need to resort to litigation to enforce or defend its intellectual property rights. If a competitor or collaborator files a patent application claiming technology also claimed by the Company, or a trademark application claiming a trademark, service mark or trade dress also used by the Company, in order to protect the Company’s rights, the Company may have to participate in opposition or interference proceedings before the U.S. Patent and Trademark Office or a similar foreign agency. The Company cannot guarantee that the operation of its business does not infringe or otherwise violate the intellectual property rights of third parties, and the Company’s intellectual property rights may be challenged by third parties or invalidated through administrative process or litigation. The costs associated with protecting intellectual property rights, including litigation costs associated with litigation or administrative proceedings, may be material and there can be no assurance that any such litigation or administrative proceedings will be successful. Any such matters or proceedings could be burdensome, divert the time and resources of the Company’s personnel and the Company may not prevail. Furthermore, even if the Company’s intellectual property rights are not directly challenged, disputes among third parties could lead to the weakening or invalidation of the Company’s intellectual property rights, or other parties such as the Company’s competitors may independently develop technologies that are substantially equivalent or superior to the Company’s technology.
The laws of certain foreign countries in which the Company operates or may operate in the future do not protect, and the governments of certain foreign countries do not enforce, intellectual property rights to the same extent as do the laws and government of the U.S., which may negate the Company’s competitive or technological advantages in such markets. Moreover, any repeal or weakening of intellectual property laws or enforcement of those laws in the United States or foreign jurisdictions could make it more difficult for the Company to adequately protect its intellectual property rights, negatively impacting their value and increasing the cost of enforcing the Company’s rights. If the Company is unable to establish or adequately protect its intellectual property rights, the Company’s business, financial condition and results of operations could be materially and adversely affected.
If the Company is unable to protect the confidentiality of its proprietary information and know-how, the value of the Company’s technology, products and services could be harmed significantly.
In addition to registered intellectual property, the Company relies on know-how and other proprietary information in operating its business. If this information is not adequately protected, then it may be disclosed or used in an unauthorized manner. To the extent that consultants, vendors, key employees or other third parties apply technology independently developed by them or by others to the Company’s proposed products in the absence of a valid license or suitable non-disclosure or assignment of inventions provisions, disputes may arise as to the ownership of or rights to use such technology, which may not be resolved in the Company’s favor. The risk that other parties may breach confidentiality or
17
other agreements could harm the Company by enabling the Company’s competitors and other entities, who may have greater experience and financial resources, to copy or use the Company’s proprietary information in the advancement of their products, methods or technologies.
The Company’s brands are subject to reputational risks.
The Company’s brands and its reputation are among its most important assets. The Company’s ability to attract and retain customers depends, in part, upon the external perceptions of the Company, the quality of its products and its corporate and management integrity. The consumer goods industry is by its nature more prone to reputational risks than other industries. This has been compounded in recent years by the free flow of unverified information on the Internet and, in particular, on social media. Damage to the Company’s brands or reputation or negative publicity or perceptions about the Company could adversely affect its business.
Operational and regulatory risks
Interruptions in the Company’s operations caused by outside forces could cause material losses.
The Company’s worldwide operations could be subject to natural and man-made disasters, telecommunications failures, water shortages, tsunamis, floods, hurricanes, typhoons, fires, extreme weather conditions, conflicts, acts of terrorism, health epidemics and other business interruptions. The occurrence of any of these business disruptions could seriously harm the Company’s business, revenue and financial condition and increase the Company’s costs and expenses. If the Company’s or its manufacturers’ warehousing facilities or transportation facilities are damaged or destroyed, the Company would be unable to distribute products on a timely basis, which could harm the Company’s business. The Company’s back-up operations may be inadequate, and the Company’s business interruption insurance may not be sufficient to compensate for any losses that may occur.
The Company’s international operations present special challenges that the Company may not be able to meet, and this could materially and adversely affect the Company’s financial results.
The Company conducts business outside of the United States through subsidiaries, affiliates and joint ventures. These entities have operations and assets in the United Kingdom, Mexico, Canada, China and Hong Kong. Therefore, the Company is subject to increases and decreases in its investments in these entities resulting from the impact of fluctuations in foreign currency exchange rates. These entities also bear risks similar to those risks faced by the Company. However, there are specific additional risks related to these organizations, such as the failure of the Company’s partners or other investors to meet their obligations and higher credit and liquidity risks related to thinly capitalized entities. Failure of these entities or the Company’s vendors to adhere to required regulatory or other standards, including social compliance standards, could materially and adversely impact the Company’s reputation and business.
In addition, the Company sells its products in foreign countries and seeks to increase its level of international business activity. Accordingly, the Company is subject to various risks, including:
18
• U.S.-imposed embargoes of sales to specific countries;
• foreign import controls (which may be arbitrarily imposed or enforced);
• import regulations and duties;
• export regulations (which require the Company to comply with stringent licensing regimes);
• anti-dumping regulations;
• price and currency controls;
• exchange rate fluctuations;
• dividend remittance restrictions;
Any significant violations of these regulations could result in civil or criminal sanctions or the loss of export or other licenses, which could have a material adverse effect on the Company’s business, results of operations and financial condition. In addition, the Company’s organizational structure may limit its ability to transfer funds between countries, particularly into and out of the United States, without incurring adverse tax consequences. Any of these events could result in a loss of business or other unexpected costs that could reduce sales or profits and have a material adverse effect on the Company’s financial condition, results of operations and cash flows.
The Company operates in a regulated environment that imposes significant compliance requirements. Non-compliance with these requirements could subject the Company to sanctions and materially adversely affect the Company’s business.
The Company is subject in the ordinary course of its business, in the United States and elsewhere, to many statutes, ordinances, rules and regulations that, if violated by the Company or its affiliates, partners or vendors, could have a material adverse effect on the Company’s business. The Company is required to comply with the United States Foreign Corrupt Practices Act (“FCPA”), the U.K. Bribery Act and similar anti-bribery, anti-corruption and anti-kickback laws adopted in many of the countries in which the Company does business which prohibit the Company from engaging in bribery or making other prohibited payments to foreign officials for the purpose of obtaining or retaining business and also require maintenance of adequate record-keeping and internal accounting practices to accurately reflect transactions. Under the FCPA, companies operating in the United States may be held liable for actions taken by their strategic or local partners or representatives. The U.K. Bribery Act is broader in scope than the FCPA in that it directly addresses commercial bribery in addition to bribery of government officials and it does not recognize certain exceptions, notably facilitation payments that are permitted by the FCPA. Civil and criminal penalties may be imposed for violations of these laws. In many of the countries in which the Company operates, particularly those with developing economies, it is or has been common for government officials and businesses to engage in business practices that are prohibited by these laws. If the Company does not properly implement and maintain practices and controls with respect to compliance with applicable anti-corruption, anti-bribery and anti-kickback laws, or if the Company fails to enforce those practices and controls properly, the Company may be subject to regulatory sanctions, including administrative costs related to governmental and internal investigations, civil and criminal penalties, injunctions and restrictions on the Company’s business and capital raising activities, any of which could materially and adversely affect the Company’s business, results of operations and financial condition. The Company’s employees, distributors, dealers and other agents could engage in conduct that is not in compliance with such laws for which the Company might be held responsible. If the Company’s employees, distributors, dealers or other agents are found to have engaged in illegal practices, the Company could suffer substantial penalties and the reputation, business, results of operations and financial condition of the Company could be materially adversely affected.
The Company is additionally subject to general business laws and regulations, as well as regulations and laws specifically governing the Internet and e-commerce. Such existing and future laws and regulations may impede the growth of Internet or other online services and thereby adversely impact the Company’s sales. These laws and regulations may cover taxation, user privacy, data security, pricing, content, proprietary rights, advertising, distribution, electronic contracts and other communications, consumer protection, the provision of online payment services, broadband residential Internet access and the characteristics and quality of products and services. It is not clear in certain cases how existing laws and regulations
19
• expropriation of assets;
• war, civil uprisings and riots;
• government instability;
• the necessity of obtaining governmental approval for new and continuing products and operations;
• legal systems or decrees, laws, taxes, regulations, interpretations and court decisions that are not always fully developed and that may be retroactively or arbitrarily applied;
• unanticipated income taxes, excise duties, import taxes, export taxes or other governmental assessments; and
• difficulties in managing a global enterprise.

governing issues such as property ownership, sales and other taxes and personal privacy apply to the Internet and e-commerce.Unfavorable resolutions of these issues would harm the Company’s business, diminish the demand for the Company’s products on the Internet and increase the Company’s cost of doing business.
A failure in the Company’s operating systems or infrastructure or those of third parties could disrupt the Company’s business and cause losses.
The Company relies on many information technology systems for the operation of its principal business functions, including the Company’s enterprise resource planning, warehouse management, inventory forecast and re-ordering and call center systems. In the case of the Company’s inventory forecast and re-ordering system, most of the Company’s orders are received directly through electronic connections with the Company’s largest customers. Additionally, the success of certain product categories in a competitive marketplace is dependent upon the creation and launch of new, innovative products. Accordingly, to keep pace within a competitive retail environment, the Company uses and will continue to evaluate new technologies to improve the efficiency of designing new innovative products. The failure of any of these systems or technologies could have a material adverse effect on the Company’s business and results of operations.
The Company is subject to cyber security risks and may incur increasing costs in an effort to minimize those risks.
The Company employs information technology systems and Internet systems, including websites, which allow for the secure storage and transmission of proprietary or confidential information regarding the Company’s customers, employees and others, including credit card information and personal identification information. The Company has made significant efforts to secure its computer network to mitigate the risk of possible cyber-attacks. However, the regulatory environment governing information, security and privacy laws, as well as the requirements imposed on the Company by the credit card industry, is increasingly demanding and continues to evolve. The security of the Company’s computer networks could be compromised which could impact operations and confidential information could be misappropriated, which could lead to negative publicity, loss of sales and profits or cause the Company to incur significant costs to reimburse third-parties for damages which could adversely impact profits. Furthermore, maintaining compliance with applicable security and privacy regulations and standards may increase the Company’s operating costs and/or adversely impact the Company’s ability to market its products or process payment information.
The Company sells consumer products which involve an inherent risk of product liability claims.
The marketing of certain of the Company’s consumer products involve an inherent risk of product liability claims or recalls or other regulatory or enforcement actions initiated by the U.S. Consumer Product Safety Commission, by the Office of Fair Trading in the U.K., by other regulatory authorities or through private causes of action and the Company has had in the past, and may have in the future, recalls (both voluntary and involuntary) of its products. Any defects in products the Company markets could harm the Company’s reputation, adversely affect its relationship with its customers and decrease market acceptance of the Company’s products and the strength of the brand names under which the Company markets such products. Potential product liability claims may exceed the amount of the Company’s insurance coverage and could materially damage the Company’s business and its financial condition. Additionally, the Company’s product standards could be impacted by new or revised environmental rules and regulations or other social initiatives.
The Company may incur material costs due to environmental liabilities.
The Company is subject to a broad range of federal, state, local, foreign and multi-national laws and regulations relating to the environment. These include laws and regulations that govern:
The Company may incur material costs to comply with increasingly stringent environmental laws and enforcement policies. Moreover, there are proposed international accords and treaties, as well as federal, state and local laws and regulations, which would attempt to control or limit the causes of climate change, including the effect of greenhouse gas emissions on the environment. In the event that the U.S. government or foreign governments enact new climate change laws or regulations or make changes to existing laws or regulations, compliance with applicable laws or regulations may result in increased manufacturing costs for the Company’s products, such as by requiring investment in new pollution
20
• discharges to the air, water and land;
• the handling and disposal of solid and hazardous substances and wastes; and
• remediation of contamination associated with release of hazardous substances at the Company’s facilities and at off-sitedisposal locations.
control equipment or changing the ways in which certain of the Company’s products are made. The Company may incur some of these costs directly and others may be passed on to the Company from its third-party suppliers. Although the Company believes that it is substantially in compliance with applicable environmental laws and regulations at its facilities, the Company may not always be in compliance with such laws and regulations or any new laws and regulations in the future, which could have a material adverse effect on the Company’s business, financial condition and results of operations.
Wallace Silversmiths de Puerto Rico, Ltd. (“WSPR”), a wholly-owned subsidiary of the Company, operates a manufacturing facility in San Germán, Puerto Rico that is leased from the Puerto Rico Industrial Development Company (“PRIDCO”). In March 2008, the United States Environmental Protection Agency (the “EPA”) announced that the San Germán Ground Water Contamination site in Puerto Rico (the “Site”) had been added to the Superfund National Priorities List due to contamination present in the local drinking water supply.
In May 2008, WSPR received from the EPA a Notice of Potential Liability and Request for Information Pursuant to 42 U.S.C. Sections 9607(a) and 9604(e) of the Comprehensive Environmental Response, Compensation, and Liability Act (“CERCLA”). WSPR has cooperated with the EPA in their investigation. In August 2015, the EPA released its remedial investigation and feasibility study (“RI/FS”) for the Site. In December 2015, the EPA issued its Record of Decision (“ROD”) for OU-1, selecting a dual phase removal remedy to deal with soil contamination. The EPA’s selected remedy consists of soil vapor extraction and dual-phase extraction/in-situ treatment. The EPA also designated a second operable unit under which the EPA will conduct further investigations to determine the nature and extent of groundwater contamination, as well as a determination by the EPA on the necessity of any further response actions to address groundwater contamination. It is not possible at this time for the Company to estimate its share of liability, if any, related to this matter. However, in the event of one or more adverse determinations related to this matter, it is possible that the ultimate liability resulting from this matter and the impact on the Company’s results of operations could be material.
If previously unknown contamination of property underlying or in the vicinity of the Company’s manufacturing facility or other properties that are currently or have formerly been owned, operated or used by the Company is discovered, the Company could be required to incur material unforeseen expenses. If this occurs, it may have a material adverse effect on the Company’s business, financial condition and results of operations.
The Company may not be able to adequately address the additional review and disclosure required in respect of “Conflict Minerals.”
The Dodd-Frank Wall Street Reform and Consumer Protection Act contains regulations concerning the supply of conflict minerals originating from the Democratic Republic of Congo and adjoining countries. As a result, the SEC adopted annual disclosure and reporting requirements for those companies that use such conflict minerals in the products they manufacture or contract to manufacture. These requirements require ongoing due diligence efforts and there are costs associated with complying with these disclosure requirements, including the costs of investigations to determine the sources of raw materials used in the Company’s products and the costs of any changes to products, processes or sources of supply as a consequence of the results of such investigations. These rules could adversely affect the sourcing, supply and pricing of materials used in the Company’s products. As there may be only a limited number of suppliers offering these conflict minerals from “conflict free” sources, the Company cannot ensure that it will be able to obtain necessary materials from such suppliers in sufficient quantities or at competitive prices. Also, the Company may face reputational challenges if it determines that certain of its products contain conflict minerals not determined to be “conflict free” or if it is unable to sufficiently verify the origins for all conflict minerals used in its products through the procedures the Company has implemented and may implement in the future.
The Company’s executives and other key employees are critical to the Company’s success. The loss of and failure to attract and maintain its highly skilled employees could adversely affect the Company’s business.
The Company’s success depends, in part, on the efforts and skills of its executives and other key employees. The Company’s key employees are experienced and highly qualified in the housewares industry. The loss of any of the Company’s executive officers or other key employees could harm the business and the Company’s ability to timely achieve its strategic initiatives. The Company’s success also depends, in part, on its ability to identify, hire and retain other skilled personnel. The Company’s industry is characterized by a high level of employee mobility and aggressive recruiting among competitors for personnel with successful track records. The Company may not be able to attract and retain skilled personnel or may incur significant costs in order to do so.
21

Item 1B. Unresolved Staff Comments
None
Item 2. Properties
The following table lists the principal properties at which the Company operated its business at December 31, 2016:
22
Location Description
Size(square
feet) Owned/Leased
Fontana, California (1) (4) Principal West Coast warehouse and distribution facility 753,000 LeasedRobbinsville, New Jersey(1) Principal East Coast warehouse and distribution facility 700,000 LeasedBirmingham, England (2) Offices, showroom, warehouse and distribution facilities 204,000 LeasedWinchendon, Massachusetts(1) Warehouse and distribution facility, and spice packing line 175,000 OwnedCorby, England (2) Offices, showroom, warehouse and distribution facility 168,000 LeasedGarden City, New York(3) Corporate headquarters/main showroom 159,000 LeasedMedford, Massachusetts(1) Offices, showroom, warehouse and distribution facility 69,000 LeasedSan Germán, Puerto Rico(1) Sterling silver manufacturing facility 55,000 LeasedShanghai, China(3) Offices 22,000 LeasedGuangzhou, China(3) Offices 18,000 LeasedNew York, New York (1) Showrooms 17,000 LeasedYork, Pennsylvania(1) Offices 14,000 LeasedKowloon, Hong Kong(3) Offices and showrooms 12,000 LeasedAtlanta, Georgia(1) Showrooms 11,000 LeasedBentonville, Arkansas(1) Offices and showroom 7,000 LeasedMaastricht, Netherlands(2) Offices and showroom 5,400 LeasedPawtucket, Rhode Island (1) Offices and showroom 4,900 LeasedMenomonee Falls, Wisconsin(1) Showroom 4,000 LeasedCarlisle, Pennsylvania(1) Showroom 2,300 LeasedIssaquah, Washington (1) Showroom 1,100 Leased
(1) Location primarily used by the U.S. Wholesale segment. (2) Location used by the International segment. (3) Location used by all segments. (4) In February 2017 the Company entered into a lease agreement for warehouse and distribution space in Rialto, California. The
Company expects to begin moving its operations into the Facility in November 2017. The Facility will serve as the Company’s West Coast distribution facility primarily for its U.S. Wholesale segment, which will replace the Company’s existing Fontana, California facility, the lease for which expires in March 2018.

Item 3. Legal Proceedings
Wallace Silversmiths de Puerto Rico, Ltd. (“WSPR”), a wholly-owned subsidiary of the Company, operates a manufacturing facility in San Germán, Puerto Rico that is leased from the Puerto Rico Industrial Development Company (“PRIDCO”). In March 2008, the United States Environmental Protection Agency (the “EPA”) announced that the San Germán Ground Water Contamination site in Puerto Rico (the “Site”) had been added to the Superfund National Priorities List due to contamination present in the local drinking water supply.
In May 2008, WSPR received from the EPA a Notice of Potential Liability and Request for Information Pursuant to 42 U.S.C. Sections 9607(a) and 9604(e) of the Comprehensive Environmental Response, Compensation, and Liability Act (“CERCLA”). In July 2011, WSPR received a letter from the EPA requesting access to the property that it leases from PRIDCO to conduct an environmental investigation, and the Company granted such access. In February 2013, the EPA requested access to conduct a further environmental investigation at the property. PRIDCO agreed to such access and the Company consented. EPA conducted a further investigation during 2013 and, in April 2015, notified the Company and PRIDCO that the results from vapor intrusion sampling may warrant implementation of measures to mitigate potential exposure to sub-slab soil gas. The Company reviewed the information provided by the EPA and requested that PRIDCO, as the property owner, find and implement a solution acceptable to the EPA. While WSPR did not cause the sub-surface condition that resulted in the potential for vapor intrusion, in order to protect the health of its employees and continue its business operations, it has nevertheless implemented corrective action measures to prevent vapor intrusion such as sealing floors of the building and conducting periodic air monitoring to address potential exposure. On August 13, 2015, the EPA released its remedial investigation and feasibility study (“RI/FS”) for the Site. On December 11, 2015, the EPA issued the Record of Decision (“ROD”) for OU-1, electing to implement its preferred remedy which consists of soil vapor extraction and dual-phase extraction/in-situ treatment. This selected remedy includes soil vapor extraction (“SVE”) to address soil (vadose zone) source areas at the Site, impermeable cover as necessary for the implementation of SVE, dual phase extraction in the shallow saprolite zone, and in-situ treatment as needed to address residual sources. The EPA’s estimated capital cost for its selected remedy is $7.3 million. The EPA also designated a second operable unit under which the EPA will conduct further investigations to determine the nature and extent of groundwater contamination, as well as a determination by the EPA on the necessity of any further response actions to address groundwater contamination. In February 2017, the EPA indicated that it plans to expand its field investigation for the RI/FS for the second operable unit to further determine the nature and extent of the groundwater contamination at and from the Site and to determine the nature of the remedial action needed to address the contamination. The EPA has requested access to the property occupied by WSPR to install monitoring wells and to undertake groundwater sampling as part of this expanded investigation. WSPR has consented to EPA’s access request, provided that the EPA receives PRIDCO’s consent, as the property owner. WSPR never used the primary contaminant of concern and did not take up its tenancy at the Site until after the EPA had discovered the contamination in the local water supply. The EPA has also issued notices of potential liability to a number of other entities affiliated with the Site, which used the contaminants of concern.
Accordingly, based on the above uncertainties and variables, it is not possible at this time for the Company to estimate its share of liability, if any, related to this matter. However, in the event of one or more adverse determinations related to this matter, it is possible that the ultimate liability resulting from this matter and the impact on the Company’s results of operations could be material.
The Company is, from time to time, involved in other legal proceedings. The Company believes that other current litigation is routine in nature and incidental to the conduct of the Company’s business and that none such litigation, individually or collectively, would have a material adverse effect on the Company’s consolidated financial position, results of operations or cash flows.
Item 4. Mine Safety Disclosure
Not applicable.
23

PART II
Item 5. Market For Registrant’s Common Equity, Related Stockholder Matters and Issuer Purchases of Equity Securities
The Company’s common stock is traded under the symbol “LCUT” on the NASDAQ Global Select Market (“NASDAQ”).
The following table sets forth the quarterly high and low sales prices for the common stock of the Company for the fiscal periods indicated as reported by NASDAQ.
At December 31, 2016, the Company estimates that there were approximately 1,700 record holders of the Company’s common stock.
The Company is authorized to issue 100 shares of Series A Preferred stock and 2,000,000 shares of Series B Preferred stock, none of which were issued or outstanding at December 31, 2016.
In the last two fiscal years, the Board of Directors declared a dividend of $0.0375 per share payable on each of May 15, 2015 and August 14, 2015 and declared a dividend of $0.0425 per share payable on each of November 13, 2015, February 15, 2016, May 16, 2016, August 15, 2016 and November 15, 2016. The Board of Directors currently intends to continue paying cash dividends for the foreseeable future, although the Board of Directors may in its discretion determine to modify or eliminate such dividends at any time. On March 8, 2017, the Board of Directors declared a quarterly dividend of $0.0425 per share payable on May 15, 2017 to shareholders of record on May 1, 2017. The Company’s Credit Agreement, however, may restrict its ability to declare and pay dividends, establishing conditions that are to be met prior to making any dividend payment as well as restrictions on the amount of any dividend payment.
The following table sets forth the Company’s purchase of equity securities during the quarter ended December 31, 2016.
The following table summarizes the Company’s equity compensation plan as of December 31, 2016:
24
2016 2015 High Low High LowFirst quarter $15.45 $11.29 $17.27 $12.48Second quarter 17.80 12.70 16.45 14.06Third quarter 16.03 12.03 15.43 12.87Fourth quarter 19.35 12.55 15.81 12.55
Period
Total number ofshares
purchased(1) Average pricepaid per share
Total number of shares
purchased as part of publicly
announced plansor programs(2)
Maximumapproximate
dollar value ofshares that mayyet be purchasedunder the plans
or programs subsequent to
end of period (2)
December 1- December 31, 2016 685 $ 17.75 — $ 6,771,467
(1) The repurchased shares were acquired other than as part of a publicly announced plan or program. The Company repurchased these securities in connection with its Amended and Restated 2000 Long Term Incentive Plan which allows participants to use shares to satisfy certain tax liabilities arising from the vesting of restricted stock. The number above does not include unvested shares forfeited back to us pursuant to the terms of the Company’s stock compensation plans.
(2) On April 30, 2013, the Board of Directors of Lifetime Brands, Inc. authorized the repurchase of up to $10.0 million of the Company’s common stock. The repurchase authorization permits the Company to effect the repurchases from time to time through open market purchases and privately negotiated transactions. No such repurchases occurred during the quarter ended December 31, 2016.
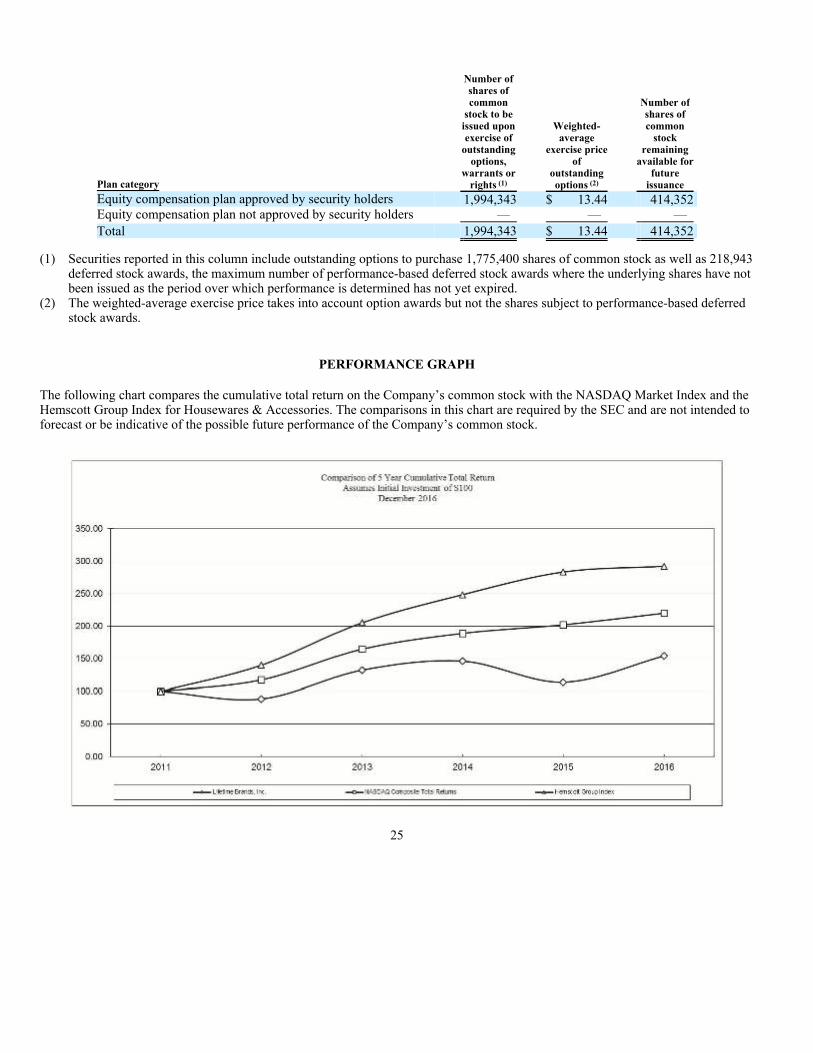
PERFORMANCE GRAPH
The following chart compares the cumulative total return on the Company’s common stock with the NASDAQ Market Index and the Hemscott Group Index for Housewares & Accessories. The comparisons in this chart are required by the SEC and are not intended to forecast or be indicative of the possible future performance of the Company’s common stock.
25
Plan category
Number ofshares ofcommon
stock to beissued uponexercise of
outstandingoptions,
warrants orrights (1)
Weighted- average
exercise priceof
outstanding options (2)
Number ofshares of common
stock remaining
available forfuture
issuanceEquity compensation plan approved by security holders 1,994,343 $ 13.44 414,352Equity compensation plan not approved by security holders — — —
Total 1,994,343 $ 13.44 414,352
(1) Securities reported in this column include outstanding options to purchase 1,775,400 shares of common stock as well as 218,943 deferred stock awards, the maximum number of performance-based deferred stock awards where the underlying shares have not been issued as the period over which performance is determined has not yet expired.
(2) The weighted-average exercise price takes into account option awards but not the shares subject to performance-based deferred stock awards.

Item 6. Selected Financial Data
The selected consolidated statement of operations data for the years ended December 31, 2016, 2015 and 2014 and the selected consolidated balance sheet data as of December 31, 2016 and 2015 has been derived from the Company’s audited consolidated financial statements included elsewhere in this Annual Report on Form 10-K. The selected consolidated statement of operations data for the years ended December 31, 2013 and 2012 and the selected consolidated balance sheet data at December 31, 2014, 2013 and 2012 have been derived from the Company’s audited consolidated financial statements included in the Company’s Annual Reports on Form 10-K for those respective years, which are not included in this Annual Report on Form 10-K.
This information should be read together with the discussion in Management’s Discussion and Analysis of Financial Condition and Results of Operations and the Company’s consolidated financial statements and notes to those statements included elsewhere in this Annual Report on Form 10-K.
26
Date Lifetime
Brands, Inc. Hemscott
Group Index
NASDAQMarket Index
12/31/2011 $ 100.00 $ 100.00 $ 100.0012/31/2012 88.50 139.97 117.4512/31/2013 132.39 205.15 164.5712/31/2014 146.13 248.36 188.8412/31/2015 113.85 283.24 201.9812/31/2016 154.14 292.24 219.89
(1) The graph assumes $100 was invested as of the open of trading on January 1, 2012 and dividends were reinvested. Measurement points are at the last trading day of each of the fiscal years ended December 31, 2012, 2013, 2014, 2015 and 2016. The material in this chart is not soliciting material, is not deemed filed with the SEC and is not incorporated by reference in any filing of the Company under the Securities Act of 1933, as amended, or the Securities Exchange Act of 1934, as amended, whether or not the chart is prepared before or after the date of this Annual Report on Form 10-K and irrespective of any general incorporation language in such filing. A list of the companies included in the Hemscott Group Index will be furnished by the Company to any stockholder upon written request to the Chief Financial Officer of the Company.

Notes:
27
Year ended December 31, 2016 2015 2014 2013 2012STATEMENT OF OPERATIONS DATA(1) (in thousands, except per share data)Net sales $592,619 $587,670 $586,010 $502,721 $486,842Cost of sales 375,719 373,284 373,129 315,459 310,054Distribution expenses (2) 57,006 54,815 54,202 44,364 44,046Selling, general and administrative expenses (3) 130,397 134,903 133,786 114,345 104,338Intangible asset impairment — — 3,384 — 1,069Restructuring expenses 2,420 437 125 367 —
Income from operations 27,077 24,231 21,384 28,186 27,335Interest expense (4,803) (5,746) (6,418) (4,847) (5,898) Financing expense — (154) (758) — — Loss on early retirement of debt (272) — (346) (102) (1,363)
Income before income taxes, equity in earnings and extraordinary item 22,002 18,331 13,862 23,237 20,074Income tax provision (7,030) (6,627) (5,825) (9,175) (5,208) Equity in earnings (losses), net of taxes (4) 748 574 (6,493) (4,781) 6,081
Net income $ 15,720 $ 12,278 $ 1,544 $ 9,281 $ 20,947
Basic income per common share $ 1.11 $ 0.89 $ 0.11 $ 0.73 $ 1.67
Weighted-average shares outstanding – basic 14,174 13,850 13,519 12,757 12,511
Diluted income per common share $ 1.08 $ 0.86 $ 0.11 $ 0.71 $ 1.64
Weighted-average shares outstanding – diluted 14,549 14,266 13,974 13,043 12,810
Cash dividends declared per common share $ 0.17 $ 0.16 $ 0.15 $0.13125 $ 0.125
December 31, 2016 2015 2014 2013 2012BALANCE SHEET DATA(1) (in thousands)Current assets $256,447 $243,380 $258,117 $214,676 $212,759Current liabilities 91,286 91,361 83,869 69,494 66,899Working capital 165,161 152,019 174,248 145,182 145,860Total assets 399,854 398,331 421,402 336,739 348,797Short-term borrowings (5) 9,456 19,898 10,765 3,937 11,375Long-term debt (5) 86,201 80,350 127,655 65,919 84,593Stockholders’ equity 197,728 199,468 188,233 180,905 172,230
(1) The acquisition of Kitchen Craft in January 2014 affects the comparability of the periods. (2) The 2016 period includes a $1.3 million charge to correct prior years’ depreciation of certain assets within the U.S. Wholesale
segment. (3) In 2015 and 2014, the Company recorded a net charge of $0.7 million and a credit of $4.2 million, respectively, related to
adjustments to the fair value of certain contingent consideration. (4) In 2012, the Company recorded a gain of $4.1 million related to Vasconia’s purchase of Almexa and in 2013, the Company
recorded a charge of $5.0 million, net of tax for a reduction of the fair value of the Company’s investment in Vasconia. In 2014, the Company recorded a charge of $6.0 million, net of tax, for a reduction of the fair value of the Company’s investment in GSI.
(5) In 2016 the Company adopted Accounting Standards Update (“ASU”) 2015-03, which requires debt issuance costs to be presented in the balance sheet as a direct deduction from the associated debt liability. In connection with the adoption of this standard, debt issuance costs associated with the Company’s Term Loan are presented as a deduction from the Term Loan balance as of December 31, 2016 and December 31, 2015. The retrospective adoption of this pronouncement results in a reduction of other assets of $621,000, a reduction of the current maturity of the Credit Agreement Term Loan of $354,000 and a reduction of the Credit Agreement Term Loan of $267,000 on the consolidated balance sheet as of December 31, 2015. The debt issuance costs associated with the Company’s Revolving Credit Facility are presented as other assets as of December 31, 2016 and 2015.
Item 7. Management’s Discussion and Analysis of Financial Condition and Results of Operations
The following discussion should be read in conjunction with the consolidated financial statements for the Company and notes thereto set forth in Item 15. This discussion contains forward-looking statements relating to future events and the future performance of the Company based on the Company’s current expectations, assumptions, estimates and projections about it and the Company’s industry. These forward-looking statements involve risks and uncertainties. The Company’s actual results and timing of various events could differ materially from those anticipated in such forward-looking statements as a result of a variety of factors, as more fully described in this section and elsewhere in this Annual Report including those discussed under “Disclosures regarding Forward-Looking Statements” and under Item 1A “Risk Factors” and Item 7A “Quantitative and Qualitative Disclosures Regarding Market Risk.” The Company undertakes no obligation to update publicly any forward-looking statements for any reason, even if new information becomes available or other events occur in the future.
ABOUT THE COMPANY
The Company designs, sources and sells branded kitchenware, tableware and other products used in the home. In 2016, in connection with the Company’s U.S. Wholesale restructuring plan, the Company realigned its product categories to best achieve the Company’s strategic plan and implementation of cost reduction initiatives. Following the realignment, the Company’s product categories include two categories of products that people use to prepare, serve and consume foods: Kitchenware (kitchen tools and gadgets, cutlery, cutting boards, cookware, pantryware, spice racks and bakeware) and Tableware (dinnerware, stemware, flatware and giftware); and one category, Home Solutions, which comprises other products used in the home (thermal beverageware, food storage and home décor). In 2016, Kitchenware products and Tableware products accounted for approximately 90% of the Company’s U.S. Wholesale net sales and 88% of the Company’s consolidated net sales. In 2015, with categories recast to conform to the current period presentation, Kitchenware products and Tableware products accounted for approximately 92% of the Company’s U.S. Wholesale net sales and 90% of the Company’s consolidated net sales.
The Company markets several product lines within each of its product categories and under most of the Company’s brands, primarily targeting moderate price points through virtually every major level of trade. The Company believes it possesses certain competitive advantages based on its brands, its emphasis on innovation and new product development and its sourcing capabilities. The Company owns or licenses a number of leading brands in its industry including Farberware®, Mikasa®, KitchenAid®, Pfaltzgraff®, KitchenCraft®, Sabatier®, Mossy Oak®, Kamenstein®, masterclass®, Towle®, Fred®, Copco®, Chicago™ Metallic, Wilton Armetale® and Swing-A-Way®. Historically, the Company’s sales growth has come from expanding product offerings within its product categories, by developing existing brands, acquiring new brands, including complementary brands in markets outside the United States, and establishing new product categories. Key factors in the Company’s growth strategy have been the selective use and management of the Company’s brands and the Company’s ability to provide a stream of new products and designs. A significant element of this strategy is the Company’s in-house design and development teams that create new products, packaging and merchandising concepts.
BUSINESS SEGMENTS
The Company has three reportable segments: U.S. Wholesale, International and Retail Direct. The U.S. Wholesale segment is the Company’s primary domestic business that designs, markets and distributes its products to retailers and distributors. The International segment consists of certain business operations conducted outside the U.S. The Retail Direct segment is that in which the Company markets and sells a limited selection of its products to consumers through its Pfaltzgraff, Mikasa, Fred and Friends, Built NY and Lifetime Sterling Internet websites. The Company has segmented its operations to reflect the manner in which management reviews and evaluates its results of operations.
28

EQUITY INVESTMENTS
The Company owns approximately 30% of the outstanding capital stock of Grupo Vasconia, S.A.B. (“Vasconia”), an integrated manufacturer of aluminum products and one of Mexico’s largest housewares companies.
The Company accounts for its investment in Vasconia using the equity method of accounting and has recorded its proportionate share of Vasconia’s net income, net of taxes, as equity in earnings in the Company’s consolidated statements of operations. Pursuant to a Shares Subscription Agreement (the “Agreement”), the Company may designate four persons to be nominated as members of Vasconia’s Board of Directors. Shares of Vasconia’s capital stock are traded on the Bolsa Mexicana de Valores, the Mexican Stock Exchange. The Quotation Key is VASCONI.
The Company recorded equity in earnings of Vasconia, net of taxes, of $570,000, $594,000 and $230,000 for the years ended December 31, 2016, 2015 and 2014, respectively.
During the second quarter of 2016 the Company sold its 40% equity interest in GS Internacional S/A (“GSI”), a wholesale distributor of branded housewares products in Brazil. The Company initially acquired GSI in December 2011 and accounted for this investment using the equity method of accounting; however, impairment losses recognized in 2014 reduced the value of the investment to zero. Upon the sale of its equity interest in GSI the Company recognized a net gain of $189,000 which is included within equity in earnings (losses), net of tax.
In February 2012, the Company acquired a 50% stake in Grand Venture Holdings Limited (“Grand Venture”), a joint venture with Manweal Development Limited (“Manweal”), a Chinese corporation, to distribute Mikasa® products in China, which included an initial investment by the Company of $500,000. The Company and Manweal each own 50% of Grand Venture and have rights and obligations proportionate to their ownership percentages. The Company accounts for its investment in Grand Venture using the equity method of accounting and has recorded its proportionate share of Grand Venture’s net loss in equity in earnings in the Company’s consolidated statements of operations.
In January 2011, the Company, together with Vasconia and unaffiliated partners, formed a joint venture based in Hong Kong that supplies imported kitchenware products to retailers in North, Central and South American. The Company sold its investment in this joint venture to an unaffiliated partner in October 2014.
SEASONALITY
The Company’s business and working capital needs are highly seasonal, with a majority of sales occurring in the third and fourth quarters. In 2016, 2015 and 2014, net sales for the third and fourth quarters accounted for 61%, 59% and 60% of total annual net sales, respectively. In anticipation of the pre-holiday shipping season, inventory levels increase primarily in the June through October time period.
IMPACT OF INFLATION
Inflation rates in the United States and in major foreign countries where the Company operates have not had a significant impact on its results of operations or financial position during 2016, 2015 or 2014. The Company will continue its practice of monitoring costs and adjusting prices, accordingly.
EFFECT OF ADOPTION OF ACCOUNTING PRINCIPLES
Adopted Accounting Pronouncements
Effective January 1, 2016, the Company adopted Accounting Standards Update (“ASU”) 2015-03, Simplifying the Presentation of Debt Issuance Costs and ASU 2015-15, Presentation and Subsequent Measurement of Debt Issuance Costs Associated with Line-of-Credit Arrangements. This guidance requires debt issuance costs to be presented in the balance sheet as a direct deduction from the associated debt liability. ASU 2015-15 clarifies that the SEC staff would not object to an entity deferring and presenting debtissuance costs as an asset and subsequently amortizing the deferred debt issuance costs ratably over the term of the line-of-credit arrangement, regardless of whether there are any outstanding borrowings on the line-of-credit arrangement. In connection with the adoption of this standard, debt issuance costs associated with the Company’s Term Loan are presented as a deduction from the Term Loan balance as of December 31,
29
2016 and December 31, 2015. The retrospective adoption of this pronouncement results in a reduction of other assets of $621,000, a reduction of the current maturity of the Credit Agreement Term Loan of $354,000 and a reduction of the Credit Agreement Term Loan of $267,000 on the consolidated balance sheet as of December 31, 2015. The debt issuance costs associated with the Company’s Revolving Credit Facility are presented as other assets as of December 31, 2016 and 2015.
Effective January 1, 2016, the Company adopted ASU 2015-05, Customer’s Accounting for Fees Paid in a Cloud Computing Arrangement, which provides guidance about whether a cloud computing arrangement includes a software license. The Company will apply the guidance prospectively to all arrangements entered into or materially modified after January 1, 2016. The adoption of this standard did not have a significant impact on the Company’s consolidated financial statements.
Effective January 1, 2016, the Company adopted ASU 2015-16, Simplifying the Accounting for Measurement-Period Adjustments, which eliminates the requirement to restate prior period financial statements for measurement period adjustments. The Company will apply the new guidance prospectively to adjustments to provisional amounts that occur after the January 1, 2016 effective date. The adoption of this standard did not have a significant impact on the Company’s consolidated financial statements.
In August 2014, the FASB issued ASU 2014-15, Disclosures of Uncertainties about an Entity’s Ability to continue as a Going Concern, which requires an entity’s management to evaluate whether there are conditions or events, considered in the aggregate, that raise substantial doubt about the entity’s ability to continue as a going concern within one year after the date that financial statements are issued. The standard also requires footnote disclosures if management concludes that substantial doubts exists or that its future plans alleviate substantial doubt that was raised. The Company adopted ASU No. 2014-15 for the year ended December 31, 2016, with no impact to its financial statements and concluded that there were no conditions or events that raise substantial doubt about the Company’s ability to continue as a going concern.
Accounting Pronouncements to be Adopted in Future Periods
In January 2017, the Financial Accounting Standards Board (“FASB”) issued ASU 2017-04, Simplifying the Test for Goodwill Impairment, to simplify the subsequent measurement of goodwill by eliminating the second step of the goodwill impairment test. Under this standard, an entity should perform its annual or interim goodwill impairment test by comparing the fair value of a reporting unit with its carrying amount. An entity should recognize an impairment charge for the amount by which the carrying amount exceeds the reporting unit’s fair value. The loss recognized should not exceed the total amount of goodwill allocated to that reporting unit. This guidance is effective for interim and annual goodwill impairment tests in fiscal years beginning after December 15, 2019. Early adoption is permitted for interim or annual goodwill impairment tests performed on testing dates after January 1, 2017.
In January 2017, the FASB issued ASU 2017-01, Clarifying the Definition of a Business, to assist with evaluating whether transactions should be accounted for as acquisitions (or disposals) of assets or businesses. This guidance is effective for fiscal years beginning after December 15, 2017, and interim periods within those years. Early adoption is permitted for transactions not reported in financial statements that have been issued or made available for issuance.
In August 2016, the FASB issued ASU 2016-15, Statement of Cash Flows: Classification of Certain Cash Receipts and Cash Payments, which reduces the diversity in practice on how certain transactions are classified in the statement of cash flows. The guidance is effective for fiscal years beginning after December 15, 2018, and interim periods within fiscal years beginning after December 15, 2019. Early adoption is permitted. The Company is evaluating the effect of adopting this pronouncement.
In March 2016, the FASB issued ASU 2016-09, Improvements to Employee Share-Based Payment Accounting. This standard will require all income tax effects of awards to be recognized in the income statement when the awards vest or are settled. The standard will also allow an employer to repurchase more of an employee’s shares than is currently allowed for tax withholding purposes without triggering liability accounting, and will allow companies to make a policy election to account for forfeitures as they occur. The guidance is effective for fiscal years beginning after December 15, 2016, and interim periods within those years. Early adoption is permitted. The Company is evaluating the effect of adopting this pronouncement.
In February 2016, the FASB issued ASU 2016-02, Leases, which requires a lessee, in most leases, to initially recognize a lease liability for the obligation to make lease payments and a right-of-use asset for the right to use the underlying asset for the lease term. The guidance is effective for fiscal years beginning after December 15, 2018, and interim periods within with those years. Early adoption is permitted. The Company is evaluating the effect of adopting this pronouncement.
30

In July 2015, the FASB issued ASU 2015-11, Inventory: Simplifying the Measurement of Inventory, which affects reporting entities that measure inventory using either the first-in, first-out or average cost method. Specifically, the guidance requires that inventory be measured at the lower of cost and net realizable value. Net realizable value is the estimated selling price in the ordinary course of business, less reasonably predictable cost of completion, disposal, and transportation. The guidance is effective for fiscal years beginning after December 15, 2016, with early adoption permitted. The Company is evaluating the effect of adopting this pronouncement, but when adopted, this pronouncement is not expected to have a material impact on the Company’s consolidated financial statements.
In May 2014, the FASB issued ASU 2014-09, Revenue from Contracts with Customers, to clarify the principles of recognizing revenue and create common revenue recognition guidance under U.S. GAAP and International Financial Reporting Standards. Following the FASB’s finalization of a one year deferral of this standard, the ASU is now effective for fiscal years and interim periods within those fiscal years beginning after December 15, 2017, with early adoption permitted for fiscal years, and interim periods within those fiscal years, beginning on or after December 15, 2016. This ASU can be adopted either retrospectively to each reporting period presented or as a cumulative effect adjustment as of the date of the adoption. The standard supersedes existing revenue recognition guidance and replaces it with a five step revenue model with a core principle that an entity recognizes revenue to reflect the transfer of promised goods or services to customers in an amount that reflects the consideration to which the entity expects to be entitled to in exchange for those goods or services. In March 2016, the FASB issued Accounting Standards Update No. 2016-08, Revenue from Contracts with Customers (Topic 606): Principal versus Agent Considerations (Reporting Revenue Gross versus Net) which clarifies the implementation guidance on principal versus agent considerations
The Company intends to adopt the new guidance on January 1, 2018, with a cumulative-effect adjustment to opening retained earnings under the modified retrospective approach. Currently, the Company recognizes revenue when title passes to customers and incentives and promotions are recognized as a reduction of revenue, which generally reflects the consideration the Company expects to receive in exchange for the goods sold. The Company’s implementation of this ASU includes the evaluation of its customer agreements to identify terms or conditions that could be considered a performance obligation such that, if material to the terms of the contract, consideration would be allocated to the performance obligation and could accelerate or defer the timing of recognizing revenue. The Company continues to evaluate the presentation of certain contract costs (whether presented gross or offset against revenues) and its principal versus agent arrangements.
The Company’s evaluation of the new guidance is not yet complete; however, based on the nature of the Company’s primary revenue sources and current policies, the Company does not expect a significant change in the timing and presentation of recognizing its revenue.
31

RESULTS OF OPERATIONS
The following table sets forth statement of operations data of the Company as a percentage of net sales for the periods indicated below.
32
Year Ended December 31, 2016 2015 2014 Net sales 100.0% 100.0% 100.0% Cost of sales 63.4 63.5 63.7
Gross margin 36.6 36.5 36.3 Distribution expenses 9.6 9.3 9.2 Selling, general and administrative expenses 22.0 23.0 22.8 Intangible asset impairment — — 0.6 Restructuring 0.4 0.1 —
Income from operations 4.6 4.1 3.7 Interest expense (0.8) (1.0) (1.1) Financing expense — — (0.1) Loss on early retirement of debt — — (0.1)
Income before income taxes and equity in earnings 3.8 3.1 2.4 Income tax provision (1.2) (1.1) (1.0) Equity in earnings (losses), net of taxes 0.1 0.1 (1.1)
Net income 2.7% 2.1% 0.3%

MANAGEMENT’S DISCUSSION AND ANALYSIS 2016 COMPARED TO 2015
Net Sales
Net sales for the year 2016 were $592.6 million, an increase of $4.9 million, or 0.8%, compared to net sales of $587.7 million in 2015.
Net sales for the U.S. Wholesale segment in 2016 were $471.0 million, an increase of $12.4 million, or 2.7%, compared to net sales of $458.6 million in 2015. As a result of the Company’s realignment of the product categories within the U.S. Wholesale segment, previous periods presented for the U.S. Wholesale segment product categories have been recast to conform to the current period presentation.
Net sales for the U.S. Wholesale’s Kitchenware product category in 2016 were $286.8 million, a decrease of $8.8 million, or 3.0%, compared to net sales of $295.6 million in 2015. The decrease in the U.S. Wholesale’s Kitchenware product category was primarily attributable to a decline in cutlery sales volume, partially offset by an increase in tools and gadgets due to strategic sales efforts with key customers, including on-line retailers. The decrease is also partially offset by net sales from the Company’s acquisition of the Amco Houseworks®, Chicago™ Metallic, Swing-A-Way® and Copco® brands.
Net sales for the U.S. Wholesale’s Tableware product category in 2016 were $135.9 million, an increase of $10.5 million, or 8.4%, compared to net sales of $125.4 million for 2015. The Tableware product category sales increase was primarily attributable to an increase in flatware and houseware sales from warehouse club programs. The increase was also due in part to an increase in sales to on-line retailers.
Net sales for the U.S. Wholesale’s Home Solutions products category in 2016 were $48.3 million, an increase of $10.7 million, or 28.5%, compared to net sales of $37.6 million in 2015. The increase in the Home Solutions product category reflects an increase in Built NY sales as a result of growth in hydration programs.
Net sales for the International segment in 2016 were $101.1 million, a decrease of $6.9 million, compared to net sales of $108.0 million for 2015. In constant currency, which excludes the impact of foreign exchange fluctuations, net sales increased approximately 5.6%. The increase, in constant currency, is due to an increase in kitchenware sales to on-line retailers and export sales, partially offset by a small decline in tableware sales with certain customers
Net sales for the Retail Direct segment in 2016 were $20.6 million, a decrease of $0.5 million, or 2.4%, compared to $21.1 million for 2015. The decrease was primarily attributable to a decrease in sales from the Mikasa® Internet website.
Gross margin
Gross margin for 2016 was $216.9 million, or 36.6%, compared to $214.4 million, or 36.5%, for the corresponding period in 2015.
Gross margin for the U.S. Wholesale segment was $169.4 million, or 36.0%, for 2016 compared to $163.5 million, or 35.7%, for 2015. Gross margin may be expected to fluctuate from period to period based on a number of factors, including product and customer mix. The increase in gross margin for the U.S. Wholesale segment is primarily due to an increase in margin in the Kitchenware product category which reflects a decrease in customer incentives and a change in product mix.
Gross margin for the International segment was $33.7 million, or 33.4%, for 2016 compared to $36.7 million, or 34.0%, for 2015. The decrease in gross margin in the International segment is a result of the strengthened U.S. Dollar against the Pound Sterling as well as the weakened Euro against the Pound Sterling during the period.
33

Gross margin for the Retail Direct segment was $13.8 million, or 67.0%, for 2016 compared to $14.2 million, or 67.2%, for 2015. The decrease in gross margin in the Retail Direct segment reflects additional costs to reduce shipment breakage and higher royalty expenses.
Distribution expenses
Distribution expenses for 2016 were $57.0 million as compared to $54.8 million for 2015. In 2016, the Company identified and corrected an error in the accumulated depreciation balance relating to certain leasehold improvements at one of its U.S. warehouses. Accordingly, distribution expense for the year ended December 31, 2016 includes $1.2 million of additional depreciation expense to properly reflect the accumulated depreciation balance of these assets as of December 31, 2016. Excluding this additional depreciation expense, distribution expenses as a percentage of net sales were 9.4% and 9.3% in 2016 and 2015, respectively.
Distribution expenses as a percentage of net sales for the U.S. Wholesale segment were approximately 8.5% in 2016 and 8.0% in 2015. Excluding the additional depreciation expense described above, distribution expenses as a percentage of net sales for the U.S. Wholesale segment were approximately 8.2% in 2016. Distribution expenses, excluding the depreciation expense described above, as a percentage of sales shipped from the Company’s warehouses located in the United States for the U.S. Wholesale segment were 9.0% for 2016 and 2015. Sales shipped from the Company’s warehouses increased in 2016 and offset an increase in expense due to transition service agreements for brands acquired in 2016 and labor related to smaller case pack shipments.
Distribution expenses as a percentage of net sales for the International segment were approximately 10.9% and 10.5% for 2016 and 2015, respectively. Distribution expenses as a percentage of sales shipped from the Company’s warehouses for the International segment were 12.6% and 12.4% for the 2016 and 2015, respectively. The change reflects an increase warehouse labor and storage costs.
Distribution expenses as a percentage of net sales for the Retail Direct segment were 30.6% for 2016 compared to 30.8% for 2015. The decrease was from lower freight-out expenses due to fewer product breakage replacements.
Selling, general and administrative expenses
Selling, general and administrative expenses (“SG&A”) for 2016 were $130.4 million, a decrease of $4.5 million, or 3.3%, as compared to $134.9 million for 2015.
SG&A expenses for 2016 for the U.S. Wholesale segment were $87.5 million, an increase of $2.7 million, or 3.2%, compared to $84.8 million for 2015. The increase was attributable to an increase in incentive compensation, partially offset by a decrease in employee expense due to a reduction in headcount. As a percentage of net sales, SG&A expenses were 18.6% for 2016 compared to 18.5% for 2015.
SG&A expenses for 2016 for the International segment were $19.7 million compared to $27.0 million for 2015. The decrease in the 2016 period was due to foreign currency transaction gains resulting from the Company’s hedging activity and the effect of foreign currency translation as a result of the weakened British pound. As a percentage of net sales, SG&A expenses decreased to 19.5% for 2016 compared to 25.0% for 2015.
SG&A expenses for 2016 for the Retail Direct segment were $6.7 million compared to $8.2 million for 2015. The decrease was primarily due to a decrease in employee related expenses and a decrease in marketing expenditures.
Unallocated corporate expenses for 2016 were $16.5 million compared to $14.9 million for 2015. The 2015 period included the reimbursement of expenses incurred for an acquisition not completed and the reimbursement of certain litigation expenses. The increase in the 2016 period was primarily attributable to an increase in professional and acquisition related fees.
34

Restructuring expenses
Restructuring expenses related to the U.S. Wholesale restructuring plan were $2.4 million and $0.4 million for 2016 and 2015, respectively. The expense for the 2016 period includes severance of approximately $0.7 million and consulting expense of approximately $1.6 million. The expense for the 2015 period includes $0.4 million of consulting expense.
Interest expense
Interest expense for 2016 was $4.8 million compared to $5.7 million for 2015. The decrease in expense is attributable to the use of operating cash flow to reduce indebtedness and a decrease in the average borrowing rate due to Term Loan repayments.
Financing expenses
In 2015 the Company wrote off $0.2 million of expenses related to a refinancing of indebtedness that was not completed.
Loss on early retirement of debt
In April 2016, the Company made a prepayment of $15.2 million in accordance with the amended terms of the Company’s Term Loan. In connection therewith, the Company wrote-off debt issuance costs of $0.3 million.
Income tax provision
The income tax provision was $7.0 million in 2016 and $6.6 million in 2015. The Company’s effective tax rate for 2016 was 32.0%, compared to 36.2% for 2015. The lower effective tax rate in 2016 primarily reflects a reduction of deferred tax liabilities in the U.K. as a result of a rate change enacted in 2016 as well as a favorable foreign tax rate differential for income earned in the U.K.
Equity in earnings (losses)
The Company’s equity in earnings (losses), net of tax, for 2016 and 2015 are as follows:
Equity in earnings of Vasconia, net of taxes, was $570,000 in 2016, as compared to $594,000 in 2015. Vasconia reported income from operations for 2016 of $5.6 million, as compared to $10.6 million for 2015 and net income of $3.5 in 2016, compared to $7.4 million in 2015.
As described above, the Company sold its 40% equity interest in GSI during the year ended December 31, 2016. Upon the sale of its equity interest in GSI the Company recognized a net gain of $189,000. This gain represents the net consideration received of R$2.3 million (approximately $567,000) reduced by currency translation losses of $378,000 that were recognized when the equity interest was sold.
35
Year Ended December 31, 2016 2015 (in thousands) Equity in earnings of Grupo Vasconia:
Equity earnings, net of tax $ 1,087 $ 1,897 Tax provision recorded in equity in earnings (1) (517) (1,303)
Equity in earnings of Grupo Vasconia 570 594 Equity in earnings of GSI:
Gain on sale of investment, net of tax 189 —
Equity in earnings of GSI 189 — Equity in losses of other investments (11) (20)
$ 748 $ 574
(1) Income tax provision related to the valuation allowance for deferred taxes associated with the cumulative foreign currency translation adjustment.
MANAGEMENT’S DISCUSSION AND ANALYSIS 2015 COMPARED TO 2014
Net Sales
Net sales for the year 2015 were $587.7 million, an increase of $1.7 million, or 0.3%, compared to net sales of $586.0 million in 2014.
Net sales for the U.S. Wholesale segment in 2015 were $458.6 million, an increase of $17.3 million, or 3.9%, compared to net sales of $441.3 million in 2014. As a result of the Company’s realignment of the product categories within the U.S. Wholesale segment, previous periods presented for the U.S. Wholesale segment product categories have been recast to conform to the current period presentation.
Net sales for the U.S. Wholesale’s Kitchenware product category in 2015 were $295.6 million, an increase of $1.7 million, or 0.6%, compared to net sales of $293.9 million in 2014. The increase in the U.S. Wholesale’s Kitchenware product category was primarily attributable to an increase in cutlery and cookware sales volume, partially offset by a decline in tools and gadgets.
Net sales for the U.S. Wholesale’s Tableware product category in 2015 were $125.5 million, an increase of $7.9 million, or 6.7%, compared to net sales of $117.5 million for 2014. The Tableware product category sales increase was primarily attributable to an increase in housewares and flatware on sales to new customers and on growth from warehouse club programs.
Net sales for the U.S. Wholesale’s Home Solutions products category in 2015 were $37.6 million, an increase of $7.7 million, or 25.8%, compared to net sales of $29.8 million in 2014. The increase in the Home Solutions product category reflects an increase in Built NY sales on growth from warehouse club and ecommerce customers and an increase in home décor sales for new customer programs.
Net sales for the International segment in 2015 were $108.0 million, a decrease of $17.2 million, compared to net sales of $125.2 million for 2014. In local currency, net sales decreased approximately 5.4%. The decrease is due in part to a decline in export sales of kitchenware products, as a result of the weakness in the European economy, as well as a decline in tools and gadgets and tableware sales with certain customers.
Net sales for the Retail Direct segment in 2015 were $21.1 million, an increase of $1.6 million, or 8.2%, compared to $19.5 million for 2014. The increase was primarily attributable to increases in sales from the Mikasa and Pfaltzgraff Internet websites, as well as sales from Built NY and Fred & Friends internet websites which were launched in the latter part of 2014.
Gross margin
Gross margin for 2015 was $214.4 million, or 36.5%, compared to $212.9 million, or 36.3%, for the corresponding period in 2014.
Gross margin for the U.S. Wholesale segment was $163.5 million, or 35.7%, for 2015 compared to $155.8 million, or 35.3%, for 2014. Gross margin may be expected to fluctuate from period to period based on a number of factors, including product and customer mix. The increase in gross margin for the U.S. Wholesale segment reflects an increase in margin in the tableware and certain home solutions product categories due to new product introductions.
Gross margin for the International segment was $36.7 million, or 34.0%, for 2015 compared to $43.8 million, or 35.0%, for 2014. The decrease in gross margin in the International segment is a result of the strengthened U.S. Dollar against the Pound Sterling as well as the weakened Euro against the Pound Sterling during the period.
Gross margin for the Retail Direct segment was $14.2 million, or 67.2%, for 2015 compared to $13.4 million, or 68.8%, for 2014. The decrease in gross margin in the Retail Direct segment reflects increased promotional activities.
36

Distribution expenses
Distribution expenses for 2015 were $54.8 million as compared to $54.2 million for 2014. Distribution expenses as a percentage of net sales were 9.3% in 2015 and 9.2% in 2014.
Distribution expenses as a percentage of net sales for the U.S. Wholesale segment were approximately 8.0% in 2015 and 8.2% in 2014. Distribution expenses as a percentage of sales shipped from the Company’s warehouses located in the United States for the U.S. Wholesale segment were 9.0% for 2015 as compared to 9.3% for 2014. Sales shipped from the Company’s warehouses increased and offset an increase in labor related to smaller case pack shipments.
Distribution expenses as a percentage of net sales for the International segment were approximately 10.5% and 9.6% for 2015 and 2014, respectively. Distribution expenses as a percentage of sales shipped from the Company’s warehouses for the International segment were 12.4% and 12.1% for the 2015 and 2014, respectively. The change reflects the decrease in sales volume and an increase in drop ship volume.
Distribution expenses as a percentage of net sales for the Retail Direct segment were 30.8% for 2015 compared to 29.7% for 2014. The increase in expense reflects an increase in carrier rates.
Selling, general and administrative expenses
Selling, general and administrative expenses (“SG&A”) for 2015 were $134.9 million, an increase of $1.1 million, or 0.8%, as compared to $133.8 million for 2014.
SG&A expenses for 2015 for the U.S. Wholesale segment were $84.8 million, a decrease of $0.2 million, or 0.2%, compared to $85.0 million for 2014. The 2014 period includes a $4.2 million credit related to contingent consideration. The increase is attributable to higher employee related expenses, including healthcare costs and expenses of the export operations, which began in the latter part of 2014. As a percentage of net sales, SG&A expenses were 18.5% for 2015 compared to 19.3% for 2014.
SG&A expenses for 2015 for the International segment were $27.0 million compared to $28.0 million for 2014. The decrease was attributable to the weakness of the Pound Sterling against the U.S. Dollar in 2015, as compared to 2014, offset by the change in fair value of contingent consideration attributable to the Kitchen Craft acquisition. As a percentage of net sales, SG&A expenses increased to 25.0% for 2015 compared to 22.4% for 2014.
SG&A expenses for 2015 for the Retail Direct segment were $8.2 million compared to $8.7 million for 2014. The decrease was primarily due to a decrease in employee related expenses and a decrease in marketing expenditures.
Unallocated corporate expenses for 2015 were $14.9 million compared to $16.2 million for 2014. The decrease was primarily attributable to a decrease in acquisition related fees including reimbursement of expenses incurred for an acquisition not completed and reimbursement of certain litigation expenses.
Intangible asset impairment
The Company recorded an impairment charge of $3.4 million, related to the Company’s home décor products during the year ended December 31, 2014. There were no impairment charges recorded in the year ended December 31, 2015.
Restructuring expenses
The Company incurred one-time restructuring expenses of $0.4 million in 2015 and $0.1 million in 2014. The restructuring expenses in 2015 resulted primarily from the Company’s reorganization of the U.S. Wholesale product categories. The restructuring expenses in 2014 resulted from the consolidation of the customer service and call center functions which resulted in the elimination of certain employee positions.
37
Interest expense
Interest expense for 2015 was $5.7 million compared to $6.4 million for 2014. The decrease in expense was attributable to the use of operating cash flow to reduce indebtedness.
Financing expenses
In 2015 and 2014, the Company wrote off $0.2 million and $0.7 million of expenses, respectively, related to the refinancing of indebtedness that was not completed.
Loss on early retirement of debt
In January 2014, in connection with the refinancing of its senior debt, the Company repaid the senior secured term loan outstanding under its Amended and Restated Credit Agreement dated as of October 28, 2011 with JP Morgan Chase Bank, N.A. as AdministrativeAgent and a Co-Collateral Agent, which was replaced by the Credit Agreement. In connection therewith, the Company wrote off the related debt issuance costs of $0.3 million.
Income tax provision
The income tax provision was $6.6 million in 2015 and $5.8 million in 2014. The Company’s effective tax rate for 2015 was 36.2%, compared to 42.0% for 2014. The lower effective tax rate in 2015 reflects a reduction of deferred tax liabilities in the U.K. as a result of a rate change. The effective tax rate in 2014 reflects non-deductible transaction costs in both the U.S. and the U.K., as well as a reduction in the deferred tax assets in Puerto Rico as a result of a rate change and an increase in uncertain state tax positions.
Equity in earnings (losses)
Equity in earnings of Vasconia, net of taxes, was $594,000 in 2015, as compared to equity in earnings, net of taxes, of $230,000 in 2014. Vasconia reported income from operations for 2015 of $10.6 million, as compared to $7.8 million for 2014 and net income of $7.4 million in 2015, compared to $5.3 million in 2014.
The Company’s investment in GSI was $0 as of December 31, 2015 and, therefore, the Company did not record its share of equity in losses in GSI for the year ended December 31, 2015. The Company will continue to monitor the operating results of GSI and will record equity in earnings when the equity in earnings exceeds the Company’s previously unrecognized losses. Equity in losses of GSI in 2014 was $6.7 million (including a charge of $6.0 million, net of tax, for the reduction in the fair value of the Company’s investment in GSI).
38

CRITICAL ACCOUNTING POLICIES AND ESTIMATES
Management’s Discussion and Analysis of Financial Condition and Results of Operations discusses the Company’s consolidated financial statements which have been prepared in accordance with GAAP and with the instructions to Form 10-K and Article 10 of Regulation S-X. The preparation of these financial statements requires management to make estimates and assumptions that affect the reported amounts of assets and liabilities, the disclosure of contingent assets and liabilities at the date of the financial statements and the reported amounts of revenues and expenses during the reporting period. On an on-going basis, management evaluates its estimates and judgments based on historical experience and on various other factors that are believed to be reasonable under the circumstances, the results of which form the basis for making judgments about the carrying values of assets and liabilities that are not readily apparent from other sources. The Company evaluates these estimates including those related to revenue recognition, allowances for doubtful accounts, reserves for sales returns and allowances and customer chargebacks, inventory mark-down provisions, health insurance reserves, impairment of goodwill, tangible and intangible assets, stock compensation expense, accruals related to the Company’s tax positions and tax valuation allowances. Actual results may differ from these estimates using different assumptions andunder different conditions. The Company’s significant accounting policies are more fully described in Note A of the Notes to the Consolidated Financial Statements included in Item 15. The Company believes that the following discussion addresses its most critical accounting policies, which are those that are most important to the portrayal of the Company’s consolidated financial condition and results of operations and require management’s most difficult, subjective and complex judgments.
Inventory
Inventory consists principally of finished goods sourced from third-party suppliers. Inventory also includes finished goods, work in process and raw materials related to the Company’s manufacture of sterling silver products. Inventory is priced using the lower of cost (first-in, first-out basis) or market method. The Company estimates the selling price of its inventory on a product by product basis based on the current selling environment. If the estimated selling price is lower than the inventory’s cost, the Company reduces the value of the inventory to its net realizable value.
Accounts Receivable
The Company periodically reviews the collectability of its accounts receivable and establishes allowances for estimated losses that could result from the inability of its customers to make required payments. A considerable amount of judgment is required to assess the ultimate realization of these receivables including assessing the initial and on-going creditworthiness of the Company’s customers. The Company also maintains an allowance for anticipated customer deductions. The allowances for deductions are primarily based on contracts with customers. However, in certain cases the Company does not have a formal contract and, therefore, customer deductions are non-contractual. To evaluate the reasonableness of non-contractual customer deductions, the Company analyzes currently available information and historical trends of deductions. If the financial conditions of the Company’s customers or general economic conditions were to deteriorate, resulting in an impairment of their ability to make payments or sell the Company’s products at reasonable sales prices, or the Company’s estimate of non-contractual deductions varied from actual deductions, revisions to allowances would be required, which could adversely affect the Company’s financial condition. Historically, the Company’s allowances have been appropriate and have not resulted in material unexpected charges.
Goodwill, intangible assets and long-lived assets
Goodwill and intangible assets deemed to have indefinite lives are not amortized but, instead, are subject to an annual impairment assessment. Additionally, if events or conditions were to indicate the carrying value of a reporting unit may not be recoverable, the Company would evaluate goodwill and other intangible assets for impairment at that time. As it relates to the goodwill assessment, the Company first assesses qualitative factors to determine whether it is more likely than not that the fair value of a reporting unit is less than its carrying amount as a basis for determining whether it is necessary to perform the two-step goodwill impairment testing described in ASU Topic No. 350, Intangibles – Goodwill and Other. If, after assessing qualitative factors, the Company determines that it is not more likely than not that the fair value of a reporting unit is less than its carrying amount, then performing the two-step impairment test is unnecessary and the Company’s goodwill is considered to be unimpaired. However, if based on the Company’s qualitative assessment it concludes that it is more likely than not that the fair value of the reporting unit is less than its carrying amount, or if the
39

Company elects to bypass the qualitative assessment, the Company will proceed with performing the two-step process. The first step in the two-step process compares the carrying value of each reporting unit that has goodwill with the estimated fair value of the respective reporting unit. Should the carrying value of a reporting unit be in excess of the estimated fair value of that reporting unit, the second step must be performed. The second step represents a hypothetical purchase price allocation as if the Company had acquired the reporting unit on that date. The Company also evaluates qualitative factors to determine whether or not its indefinite lived intangibles have been impaired and then performs quantitative tests if required. These tests can include the royalty savings model or other valuation models.
Long-lived assets, including intangible assets deemed to have finite lives, are reviewed for impairment whenever events or changes in circumstances indicate that the carrying amount of an asset may not be recoverable. Impairment indicators include, among other conditions, cash flow deficits, historic or anticipated declines in revenue or operating profit or material adverse changes in the business climate that indicate that the carrying amount of an asset may be impaired. When impairment indicators are present, the recoverability of the asset is measured by comparing the carrying value of the asset to the estimated undiscounted future cash flows expected to be generated by the asset. If the asset is considered to be impaired, the impairment to be recognized is measured by the amount by which the carrying amount of the asset exceeds the fair value of the asset.
The Company bypassed the optional qualitative impairment analysis for its three reporting units with goodwill for its October 1, 2016 impairment test. Accordingly, the first step of the two step goodwill impairment test, as described above, was performed. Under the first step, the estimated fair value of each of the reporting units was determined using either the income approach or a combined income and market approach with equal weighting. The significant assumptions used under the income approach, or discounted cash flow method, are projected net sales, projected earnings before interest, tax, depreciation and amortization (“EBITDA”), terminal growth rates, and the cost of capital. Projected net sales, projected EBITDA and terminal growth rates were determined to be significant assumptions because they are three primary drivers of the projected cash flows in the discounted cash flow fair value model. Cost of capital was also determined to be a significant assumption as it is the discount rate used to calculate the current fair value of those projected cash flows. The market approach is based on a market multiple (revenue and EBITDA) and requires an estimate of appropriate multiples based on market date. Under the combined income and market approach, the resultant estimated fair value of two of the three reporting units exceeded their carrying value as of October 1, 2016.
For the Creative Tops reporting unit, which carried goodwill of $2.1 million, the market approach was not used as it was concluded that the selected industry market data was not consistent with a business with the future growth expectations of this reporting unit. The reporting unit’s fair value, as calculated under the income approach, was approximately 3% less than the carrying value. The decline in fair value was due to the forecasted sales and profits for the reporting unit falling below expectations relative to the Company’s previous projections and the macroeconomic conditions in Europe contributing to a decline in EBITDA. With the assistance of a third party valuation specialist, the Company performed the second step of the impairment test by estimating the fair value of the assets and liabilities to determine the implied fair value of goodwill. The implied fair value of goodwill was determined to be greater than the carrying value and no impairment charge was recorded. Changes in any of the significant assumptions used in the calculation of the fair value of the reporting unit or changes in the assumptions used in the calculation of the fair value of the assets and liabilities of the reporting unit, could lead to a potentially material non-cash impairment charge.
The excess of fair value of the Kitchen Craft reporting unit, which carried goodwill of $9.7 million, was approximately 3% over its carrying value. Macroeconomic conditions in Europe have contributed to a decline in EBITDA. Management’s projections used to estimate the cash flows included increasing net sales and operational improvements designed to reduce costs. Changes in any of the significant assumptions used can materially affect the expected cash flows, and such impacts can result in the requirement to proceed to the second step of the test and potentially a material non-cash impairment charge could result. The Company is not currently aware of any negative changes in its assumptions that could lead to the fair value of the reporting unit being less than the carrying value.
In 2014, the result of the impairment assessment of the Company’s indefinite-lived trade names indicated that the carrying values of the Elements® and Melannco® trade names exceeded their fair values as of October 1, 2014. The Company recorded an impairment charge of $3.4 million, related to these brands. The impairment was triggered by a period of decline in the sales and gross margin of the brands.
40

Revenue recognition
The Company sells products:
Wholesale sales and retail sales are recognized when title passes to the customer, which is primarily at the shipping point for wholesale sales and upon delivery to the customer for retail sales. Shipping and handling fees that are billed to customers in sales transactions are included in net sales. Net sales exclude taxes that are collected from customers and remitted to the taxing authorities.
The Company offers various sales incentives and promotional programs to its customers from time to time in the normal course of business. These incentives and promotions typically include arrangements such as cooperative advertising, buydowns, volume rebates and discounts. These arrangements and an estimate of sales returns are reflected as reductions in net sales in the Company’s consolidated statements of operations.
Share-based compensation
The Company accounts for its share-based compensation arrangements in accordance with ASC Topic 718, “Stock Compensation”, which requires the measurement of compensation expense for all share-based compensation granted to employees and non-employee directors at fair value on the date of grant and recognition of compensation expense over the related service period for awards expected to vest.
The Company uses the Black-Scholes option valuation model to estimate the fair value of its stock options. The Black-Scholes option valuation model requires the input of highly subjective assumptions including the expected stock price volatility of the Company’s common stock and the risk-free interest rate. Changes in these subjective input assumptions can materially affect the fair value estimate of the Company’s stock options on the date of the option grant.
Performance share awards are initially valued at the Company’s closing stock price on the date of grant. Each performance award represents the right to receive up to 150% of the target number of shares of common stock. The number of shares of common stock earned will be determined based on the attainment of specified performance goals by the end of the performance period, as determined by the Compensation Committee. Compensation expense for performance awards is recognized over the vesting period, and will vary based on remeasurement during the performance period. If the performance metrics are not probable of achievement during the performance period, compensation expense would be reversed. The awards are forfeited if the performance metrics are not achieved as of the end of the performance period. The performance share awards vest in full at the end of a three year period.
The Company bases the estimated fair value of restricted stock awards based on the fair value of its common stock on the date of grant. The estimated fair value of an award is determined based on the closing price of the Company’s common stock on the date of grant multiplied by the number of shares awarded. Compensation expense is recognized on a straight-line basis over the vesting period, reduced by an estimated forfeiture rate.
Restructuring Expenses
Costs associated with restructuring activities are recorded at fair value when a liability has been incurred. A liability has been incurred at the point of closure for any remaining operating lease obligations and at the communication date for severance.
In December 2015, the Company commenced an in-depth review of its U.S. Wholesale business segment, which included the evaluation of the segment’s efficiency and effectiveness, with the objective of developing a plan to restructure its operations as appropriate. The Company expanded this restructuring plan in 2016 to focus on specific actions required to achieve the plan’s objectives. The Company recorded $2.4 million and $437,000 of restructuring expenses during the years ended December 31, 2016 and 2015, respectively, related to the execution of this plan. The expense for the 2016 period includes severance of approximately $0.7 million and consulting expense of approximately $1.6 million.
41
• Wholesale, to retailers and distributors, and
• Retail, directly to consumers.

Employee healthcare
The Company self-insures certain portions of its health insurance plan. The Company maintains an accrual for unpaid claims and estimated claims incurred but not yet reported (“IBNR”). Although management believes that it uses the best information available to estimate IBNR claims, actual claims may vary significantly from estimated claims.
Income taxes
The Company applies the required provisions for financial statement recognition, measurement and disclosure of uncertain tax positions recognized in the Company’s financial statements. Tax positions must meet a more-likely-than-not recognition threshold and measurement attribute for financial statement recognition and measurement of a tax position taken. The valuation allowance is also calculated, established or maintained when it is “more likely than not” that all or a portion of deferred tax assets will not be realized.
Derivatives
The Company accounts for all derivative instruments on the balance sheet at fair value as either an asset or a liability. Changes in the fair value of derivatives that qualify as hedges and have been designated as part of a hedging relationship for accounting purposes have no net impact on earnings to the extent the derivatives are considered highly effective in achieving offsetting changes in fair value or cash flows attributable to the risk being hedged, until the hedged items are recognized in earnings. If a derivative which is designated as part of a hedging relationship is considered ineffective in achieving offsetting changes in fair value or cash flows attributable to the risk being hedged, the change in fair value is recorded in operations. For derivatives that do not qualify or are not designated as hedging instruments for accounting purposes, changes in fair value are recorded in operations.
42

LIQUIDITY AND CAPITAL RESOURCES
The Company’s principal sources of cash to fund liquidity needs are: (i) cash provided by operating activities and (ii) borrowings available under its Revolving Credit Facility under the Credit Agreement. The Company’s primary uses of funds consist of working capital requirements, capital expenditures, acquisitions and investments and payments of principal and interest on its debt.
At December 31, 2016, the Company had cash and cash equivalents of $7.9 million compared to $7.1 million at December 31, 2015, working capital of $165.2 million at December 31, 2016 compared to $152.0 million at December 31, 2015 and the current ratio (current assets to current liabilities) was 2.8 to 1.0 at December 31, 2016 compared to 2.7 to 1.0 at December 31, 2015.
Borrowings under the Company’s Revolving Credit Facility increased to $86.2 million at December 31, 2016 compared to $65.6 million at December 31, 2015. The borrowings in 2016 were primarily attributable to the pay down of the Company’s Term Loan and the financing of the Copco and Focus acquisitions.
The Company believes that availability under its Revolving Credit Facility and cash flows from operations are sufficient to fund the Company’s operations for the next twelve months. However, if circumstances were to adversely change, the Company may seek alternative sources of liquidity including debt and/or equity financing. However, there can be no assurance that any such alternative sources would be available or sufficient. The Company closely monitors the creditworthiness of its customers. Based upon its evaluation of changes in customers’ creditworthiness, the Company may modify credit limits and/or terms of sale. However, notwithstanding the Company’s efforts to monitor its customers’ financial condition, the Company could be materially affected by changes in the future.
Credit Facilities
The Company’s Credit Agreement, which expires in January 2019, provides for, among other things, the Revolving Credit Facility commitment totaling $175.0 million ($40.0 million of which is available for multi-currency borrowings) and a Term Loan.
Each borrowing under the Revolving Credit Facility bears interest, at the Company’s option, at one of the following rates: (i) the Alternate Base Rate, defined as the greater of the Prime Rate, Federal Funds Rate plus 0.5% or the Adjusted LIBO Rate plus 1.0%, plus a margin of 0.75% to 1.25%, or (ii) the Eurodollar Rate, defined as the Adjusted LIBO Rate plus a margin of 1.75% to 2.25%. Interest rates on outstanding borrowings under the Revolving Credit Facility at December 31, 2016 ranged from 2.5% to 4.75%. In addition, the Company pays a commitment fee of 0.375% on the unused portion of the Revolving Credit Facility.
Availability under the Credit Agreement depends on the valuation of certain current assets and trademark values and the Company’s ability to meet and maintain certain financial ratios, as discussed below. Due to the Company’s seasonality, this may mean that the Company will have greater borrowing availability during the third and fourth quarters of each year. At December 31, 2016, borrowings outstanding under the Revolving Credit Facility were $86.2 million and open letters of credit were $2.4 million. At December 31, 2016, availability under the Revolving Credit Facility was approximately $76.5 million. The borrowing capacity under the Revolving Credit Facility depends, in part, on eligible levels of accounts receivable and inventory that fluctuate regularly and certain trademark values based upon periodic appraisals. Consequently, the $175.0 million commitment may not represent actual borrowing capacity.
The Company classifies a portion of the Revolving Credit Facility as a current liability if the Company intends to and is able to repay the loan from cash flows from operations which are expected to occur within the year. Repayments and borrowings under the facility can vary significantly from planned levels based on cash flow needs and general economic conditions.
ABR Term Loans or Eurocurrency Term Loans, provided for under the Credit Agreement, bear interest based on the applicable Senior Leverage Ratio. As of December 31, 2016, the Company’s Senior Leverage Ratio was 2.1 to 1. The ABR Spread for Term Loans is 3.0% to 3.5% and the Eurocurrency Spread for Term Loans is 4.0% to 4.5%. As of December 31, 2016, $9.5 million was outstanding under the Term Loan. The interest rate on outstanding borrowings under the Term Loan was 5.125%.
43
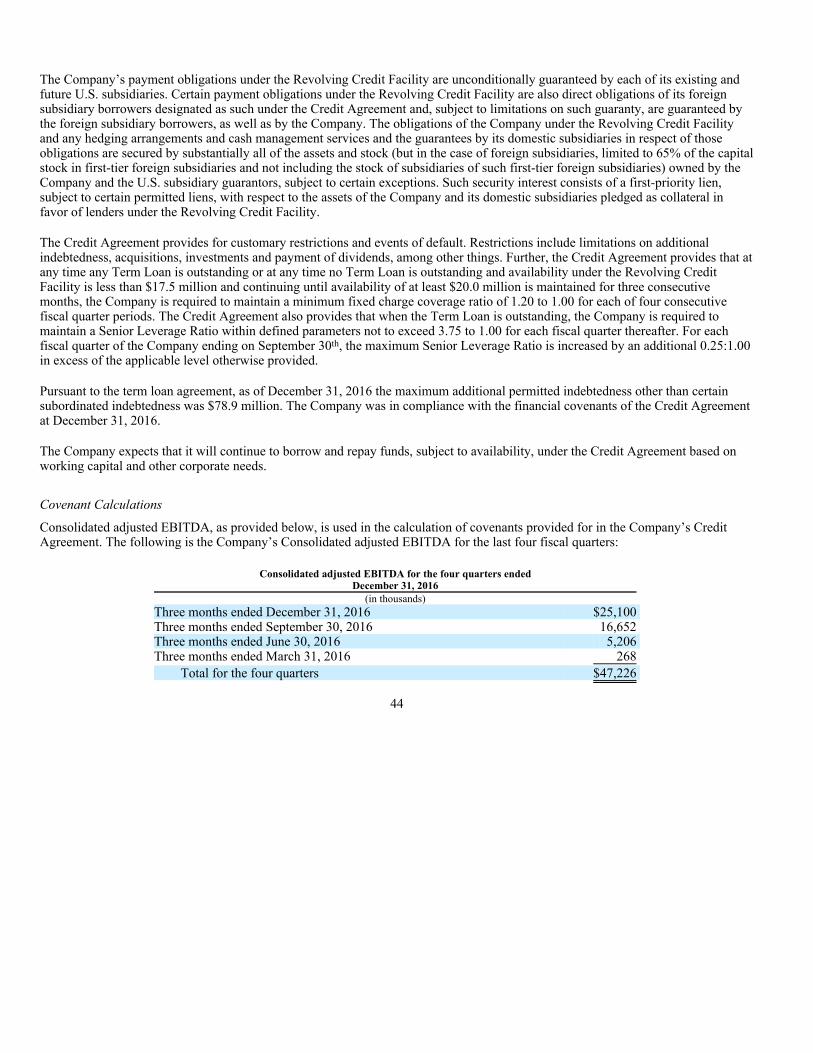
The Company’s payment obligations under the Revolving Credit Facility are unconditionally guaranteed by each of its existing and future U.S. subsidiaries. Certain payment obligations under the Revolving Credit Facility are also direct obligations of its foreign subsidiary borrowers designated as such under the Credit Agreement and, subject to limitations on such guaranty, are guaranteed by the foreign subsidiary borrowers, as well as by the Company. The obligations of the Company under the Revolving Credit Facility and any hedging arrangements and cash management services and the guarantees by its domestic subsidiaries in respect of those obligations are secured by substantially all of the assets and stock (but in the case of foreign subsidiaries, limited to 65% of the capital stock in first-tier foreign subsidiaries and not including the stock of subsidiaries of such first-tier foreign subsidiaries) owned by the Company and the U.S. subsidiary guarantors, subject to certain exceptions. Such security interest consists of a first-priority lien, subject to certain permitted liens, with respect to the assets of the Company and its domestic subsidiaries pledged as collateral in favor of lenders under the Revolving Credit Facility.
The Credit Agreement provides for customary restrictions and events of default. Restrictions include limitations on additional indebtedness, acquisitions, investments and payment of dividends, among other things. Further, the Credit Agreement provides that at any time any Term Loan is outstanding or at any time no Term Loan is outstanding and availability under the Revolving Credit Facility is less than $17.5 million and continuing until availability of at least $20.0 million is maintained for three consecutive months, the Company is required to maintain a minimum fixed charge coverage ratio of 1.20 to 1.00 for each of four consecutive fiscal quarter periods. The Credit Agreement also provides that when the Term Loan is outstanding, the Company is required to maintain a Senior Leverage Ratio within defined parameters not to exceed 3.75 to 1.00 for each fiscal quarter thereafter. For each fiscal quarter of the Company ending on September 30th, the maximum Senior Leverage Ratio is increased by an additional 0.25:1.00 in excess of the applicable level otherwise provided.
Pursuant to the term loan agreement, as of December 31, 2016 the maximum additional permitted indebtedness other than certain subordinated indebtedness was $78.9 million. The Company was in compliance with the financial covenants of the Credit Agreement at December 31, 2016.
The Company expects that it will continue to borrow and repay funds, subject to availability, under the Credit Agreement based on working capital and other corporate needs.
Covenant Calculations
Consolidated adjusted EBITDA, as provided below, is used in the calculation of covenants provided for in the Company’s Credit Agreement. The following is the Company’s Consolidated adjusted EBITDA for the last four fiscal quarters:
44
Consolidated adjusted EBITDA for the four quarters ended December 31, 2016
(in thousands) Three months ended December 31, 2016 $25,100 Three months ended September 30, 2016 16,652 Three months ended June 30, 2016 5,206 Three months ended March 31, 2016 268
Total for the four quarters $47,226
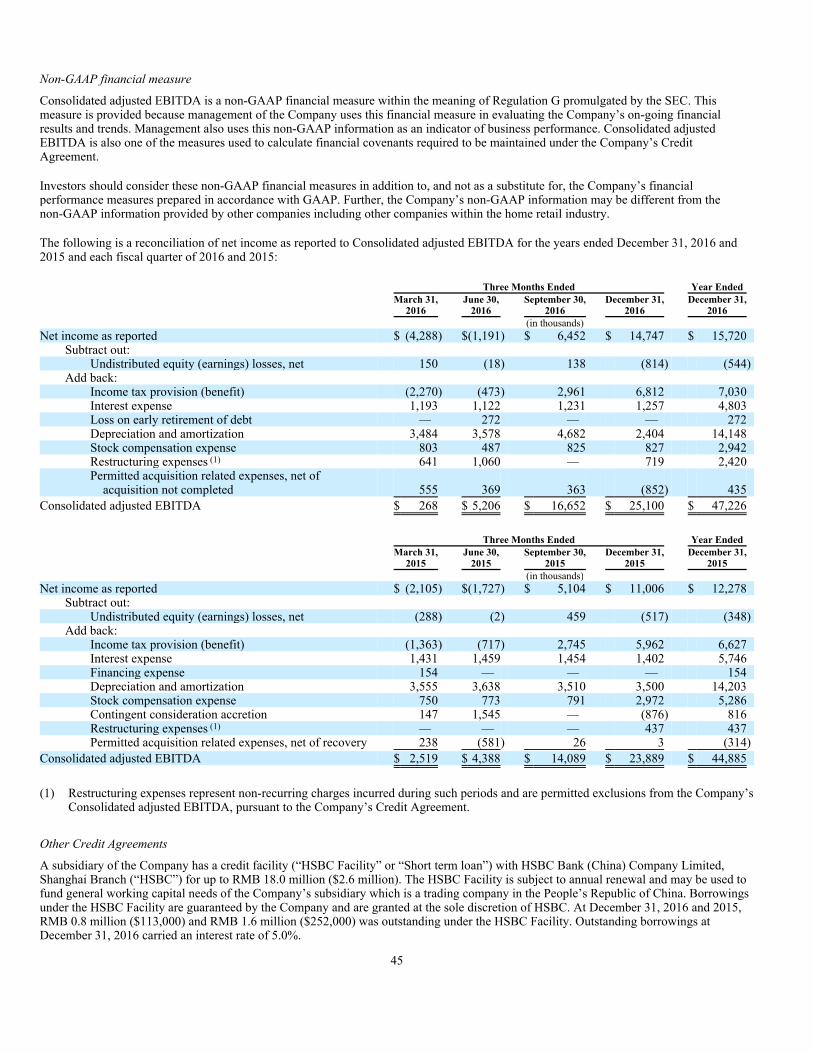
Non-GAAP financial measure
Consolidated adjusted EBITDA is a non-GAAP financial measure within the meaning of Regulation G promulgated by the SEC. This measure is provided because management of the Company uses this financial measure in evaluating the Company’s on-going financial results and trends. Management also uses this non-GAAP information as an indicator of business performance. Consolidated adjusted EBITDA is also one of the measures used to calculate financial covenants required to be maintained under the Company’s Credit Agreement.
Investors should consider these non-GAAP financial measures in addition to, and not as a substitute for, the Company’s financial performance measures prepared in accordance with GAAP. Further, the Company’s non-GAAP information may be different from the non-GAAP information provided by other companies including other companies within the home retail industry.
The following is a reconciliation of net income as reported to Consolidated adjusted EBITDA for the years ended December 31, 2016 and 2015 and each fiscal quarter of 2016 and 2015:
Other Credit Agreements
A subsidiary of the Company has a credit facility (“HSBC Facility” or “Short term loan”) with HSBC Bank (China) Company Limited, Shanghai Branch (“HSBC”) for up to RMB 18.0 million ($2.6 million). The HSBC Facility is subject to annual renewal and may be used to fund general working capital needs of the Company’s subsidiary which is a trading company in the People’s Republic of China. Borrowings under the HSBC Facility are guaranteed by the Company and are granted at the sole discretion of HSBC. At December 31, 2016 and 2015, RMB 0.8 million ($113,000) and RMB 1.6 million ($252,000) was outstanding under the HSBC Facility. Outstanding borrowings at December 31, 2016 carried an interest rate of 5.0%.
45
Three Months Ended Year Ended
March 31,
2016June 30,
2016September 30,
2016 December 31,
2016 December 31,
2016 (in thousands) Net income as reported $ (4,288) $(1,191) $ 6,452 $ 14,747 $ 15,720
Subtract out: Undistributed equity (earnings) losses, net 150 (18) 138 (814) (544)
Add back: Income tax provision (benefit) (2,270) (473) 2,961 6,812 7,030Interest expense 1,193 1,122 1,231 1,257 4,803Loss on early retirement of debt — 272 — — 272Depreciation and amortization 3,484 3,578 4,682 2,404 14,148Stock compensation expense 803 487 825 827 2,942Restructuring expenses (1) 641 1,060 — 719 2,420Permitted acquisition related expenses, net of
acquisition not completed 555 369 363 (852) 435
Consolidated adjusted EBITDA $ 268 $ 5,206 $ 16,652 $ 25,100 $ 47,226
Three Months Ended Year Ended
March 31,
2015June 30,
2015September 30,
2015 December 31,
2015 December 31,
2015 (in thousands) Net income as reported $ (2,105) $(1,727) $ 5,104 $ 11,006 $ 12,278
Subtract out: Undistributed equity (earnings) losses, net (288) (2) 459 (517) (348)
Add back: Income tax provision (benefit) (1,363) (717) 2,745 5,962 6,627Interest expense 1,431 1,459 1,454 1,402 5,746Financing expense 154 — — — 154Depreciation and amortization 3,555 3,638 3,510 3,500 14,203Stock compensation expense 750 773 791 2,972 5,286Contingent consideration accretion 147 1,545 — (876) 816Restructuring expenses (1) — — — 437 437Permitted acquisition related expenses, net of recovery 238 (581) 26 3 (314)
Consolidated adjusted EBITDA $ 2,519 $ 4,388 $ 14,089 $ 23,889 $ 44,885
(1) Restructuring expenses represent non-recurring charges incurred during such periods and are permitted exclusions from the Company’s Consolidated adjusted EBITDA, pursuant to the Company’s Credit Agreement.

Accounts Receivable Purchase Agreement
In order to improve its liquidity during seasonally high working capital periods, in 2016 the Company entered into an uncommitted Receivables Purchase Agreement with HSBC Bank USA, National Association (“HSBC”), as Purchaser (the “Receivables Purchase Agreement”). Under the Receivables Purchase Agreement, the Company may offer to sell certain eligible accounts receivable (the “Receivables”) to HSBC, which may accept such offer, and purchase the offered Receivables. Under the Receivables Purchase Agreement, following each purchase of Receivables, the outstanding aggregate purchased Receivables shall not exceed $25.0 million. HSBC will assume credit risk of the Receivables purchased; provided, however, and the Company will continue to be responsible for all non-credit risk matters. The Company will service the Receivables, and as such servicer, collect and otherwise enforce the Receivables on behalf of HSBC. The term of the agreement is for 364 days and shall automatically be extended for annual successive terms unless terminated. Either party may terminate the agreement at any time upon sixty days’ prior written notice to the other party. Pursuant to this agreement, the Company sold $44.3 million of Receivables during the year ended December 31, 2016. A charge of $131,000 related to the sale of the Receivables is included in Selling, general and administrative expenses in the consolidated statement of operations for the year ended December 31, 2016.
Inventory
Inventory, a large component of the Company’s working capital, is expected to fluctuate from period to period, with inventory levels higher primarily in the June through October time period. The Company also expects inventory turnover to fluctuate from period to period based on product and customer mix. Certain product categories have lower inventory turnover rates as a result of minimum order quantities from the Company’s vendors and customer replenishment needs. Certain other product categories experience higher inventory turns due to lower minimum order quantities or trending sale demands. For the three months ended December 31, 2016, inventory turnover was 3.1 times, or 119 days, as compared to 3.0 times, or 122 days, for the three months ended December 31, 2015. The increase in turnover and decrease in turnover days is, in part, the result of a reduction in average inventory in the U.S. Wholesale segment due to SKU rationalization and inventory management. This was partially offset by an increase in average inventory in the International segment due to a change in strategy to accommodate the replenishment of certain high volume items with certain retailers.
Capital expenditures
Capital expenditures for the year ended December 31, 2016 were $3.4 million.
Derivatives
The Company is a party to interest rate swap agreements with an aggregate notional amount of $14.0 million to manage interest rate exposure in connection with its variable interest rate borrowings. The hedge periods in these agreements commenced in March 2013 and will expire in September 2018, and the notional amounts amortize over this period.
The Company has also entered into certain foreign exchange contracts, primarily to offset the earnings impact related to fluctuations in foreign currency exchange rates associated with inventory purchases denominated in foreign currencies. None of these foreign exchange contracts were designated as hedges as required in order to apply hedge accounting. An aggregate notional amount of $38.3 million foreign exchange contracts are open at December 31, 2016.
Dividends
The Board of Directors declared a dividend of $0.0375 per share, payable on each of February 13, 2015, May 15, 2015, and August 15, 2015, and declared a dividend of $0.0425 per share, payable on each of November 13, 2015, February 15, 2016, May 16, 2016, August 15, 2016, November 15, 2016 and February 15, 2017.
Operating activities
Net cash provided by operating activities was $29.7 million in 2016 compared to $46.5 million in 2015 and $4.6 million in 2014. The decrease was primarily attributable to an increase in accounts receivable, partially offset by an increase in accounts payable and accrued expenses.
46
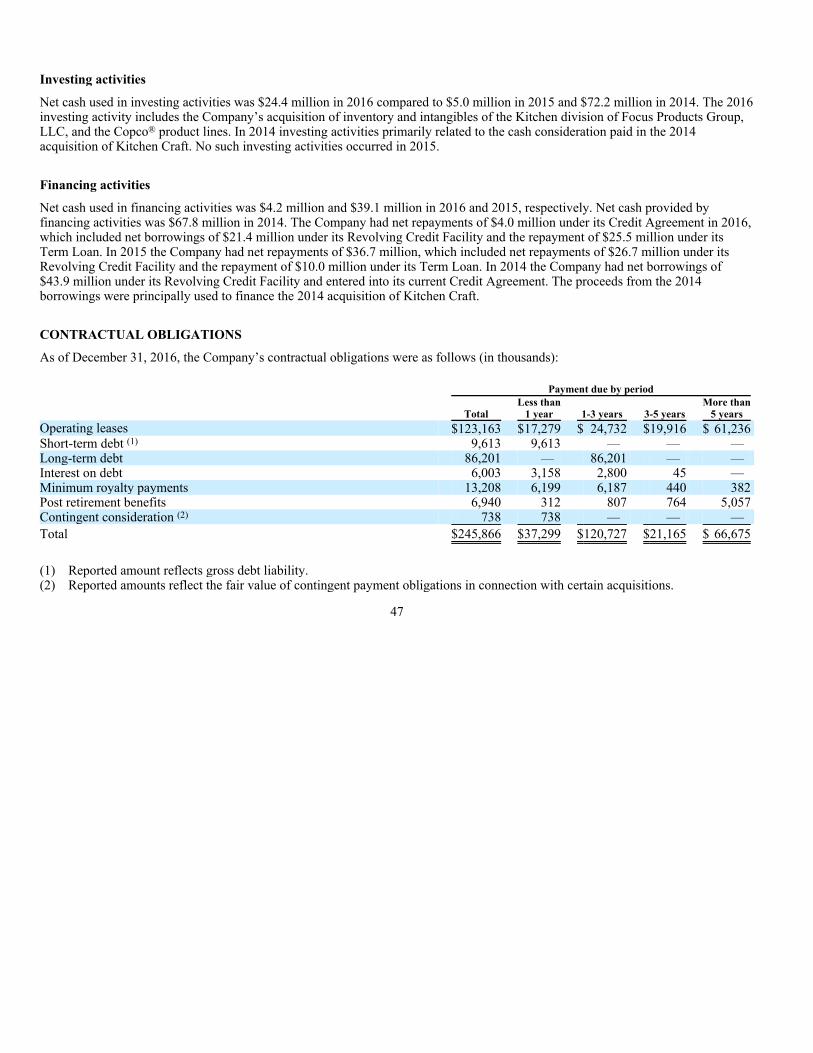
Investing activities
Net cash used in investing activities was $24.4 million in 2016 compared to $5.0 million in 2015 and $72.2 million in 2014. The 2016 investing activity includes the Company’s acquisition of inventory and intangibles of the Kitchen division of Focus Products Group, LLC, and the Copco® product lines. In 2014 investing activities primarily related to the cash consideration paid in the 2014 acquisition of Kitchen Craft. No such investing activities occurred in 2015.
Financing activities
Net cash used in financing activities was $4.2 million and $39.1 million in 2016 and 2015, respectively. Net cash provided by financing activities was $67.8 million in 2014. The Company had net repayments of $4.0 million under its Credit Agreement in 2016, which included net borrowings of $21.4 million under its Revolving Credit Facility and the repayment of $25.5 million under its Term Loan. In 2015 the Company had net repayments of $36.7 million, which included net repayments of $26.7 million under its Revolving Credit Facility and the repayment of $10.0 million under its Term Loan. In 2014 the Company had net borrowings of $43.9 million under its Revolving Credit Facility and entered into its current Credit Agreement. The proceeds from the 2014 borrowings were principally used to finance the 2014 acquisition of Kitchen Craft.
CONTRACTUAL OBLIGATIONS
As of December 31, 2016, the Company’s contractual obligations were as follows (in thousands):
47
Payment due by period
Total Less than
1 year 1-3 years 3-5 years More than
5 yearsOperating leases $123,163 $17,279 $ 24,732 $19,916 $ 61,236Short-term debt (1) 9,613 9,613 — — — Long-term debt 86,201 — 86,201 — — Interest on debt 6,003 3,158 2,800 45 — Minimum royalty payments 13,208 6,199 6,187 440 382Post retirement benefits 6,940 312 807 764 5,057Contingent consideration (2) 738 738 — — —
Total $245,866 $37,299 $120,727 $21,165 $ 66,675
(1) Reported amount reflects gross debt liability. (2) Reported amounts reflect the fair value of contingent payment obligations in connection with certain acquisitions.

Item 7A. Quantitative and Qualitative Disclosures About Market Risk
Market risk represents the risk of loss that may impact the consolidated financial position, results of operations or cash flows of the Company. The Company is exposed to market risk associated with changes in interest rates and foreign currency exchange rates. The Company believes it has moderate exposure to these risks. The Company assesses market risk based on changes in interest rates and foreign currency exchange rates utilizing a sensitivity analysis that measures the potential loss in earnings and cash flows based on a hypothetical 10% or 100 basis point change in these rates.
The Company’s functional currency is the U.S. Dollar. The Company has foreign operations through its acquisitions, investments and strategic alliances in the United Kingdom, Mexico, Canada, Hong Kong China and until May 2016, Brazil; therefore, the Company is subject to increases and decreases in its investments resulting from the impact of fluctuations in foreign currency exchange rates. Additional transactions exposing the Company to exchange rate risk include sales, certain inventory purchases and operating expenses. Through its subsidiaries, portions of the Company’s cash, trade accounts receivable and trade accounts payable are denominated in foreign currencies. For the year ended December 31, 2016, approximately 15% of the Company’s net sales revenue was in foreign currencies, compared to 16% for the year ended December 31, 2015. These sales were primarily denominated in British Pounds, Euros and Canadian Dollars. The Company makes most of its inventory purchases from Asia and uses the U.S. Dollar for such purchases. In the Company’s consolidated statements of operations, foreign exchange gains and losses are recognized in SG&A expense. A hypothetical 10% change in exchange rates, with the U.S. Dollar as the functional and reporting currency, would result in an approximately $1.1 million increase in SG&A expenses.
The Company is a party to certain foreign exchange contracts, primarily to offset the earnings impact related to fluctuations in foreign currency exchange rates associated with inventory purchases denominated in foreign currencies. Included in SG&A expenses in the consolidated statement of operations is a gain of $2.2 million related to these foreign exchange derivative contracts. The aggregate notional amount of outstanding foreign exchange contracts was $38.3 million at December 31, 2016.
The Company’s Revolving Credit Facility and Term Loan, provided for under the Credit Agreement bear interest at variable rates. The Credit Agreement provides for interest rates linked to one of the Adjusted LIBO, the Prime Rate or the Federal Funds Rate; and, therefore, the Company is subject to increases and decreases in interest expense resulting from fluctuations in interest rates. The Company entered into an interest rate swap agreement in August 2012 to manage interest rate exposure in connection with its variable interest rate borrowings. As of December 31, 2016, approximately $95.7 million of the Company’s debt carries a variable rate of interest, as compared to $82.2 million at December 31, 2015. The remainder of the debt at December 31, 2016 (approximately $14.0 million) carries a fixed rate of interest through the use of interest rate swaps. A hypothetical and instantaneous 100 basis point increase in the Company’s variable interest rates would increase interest expense by approximately $0.8 million over a twelve month period. The sensitivity analysis above assumes interest rate changes are instantaneous and parallel shifts in the yield curve.
The Company is a party to interest rate swap agreements with an aggregate notional amount of $14.0 million to manage interest rate exposure in connection with its variable interest rate borrowings. The hedge periods in these agreements commenced in March 2013 and will expire in September 2018.
Interest rate swaps expose the Company to counterparty credit risk for nonperformance. The Company manages its exposure to counterparty credit risk by dealing with counterparties who are international financial institutions with investment grade credit ratings. Although the Company’s credit risk is the replacement cost at the estimated fair value of these instruments, the Company believes that the risk of incurring credit risk losses as a result of counterparty nonperformance is remote.
The Company does not enter into derivative financial instruments for trading purposes.
48
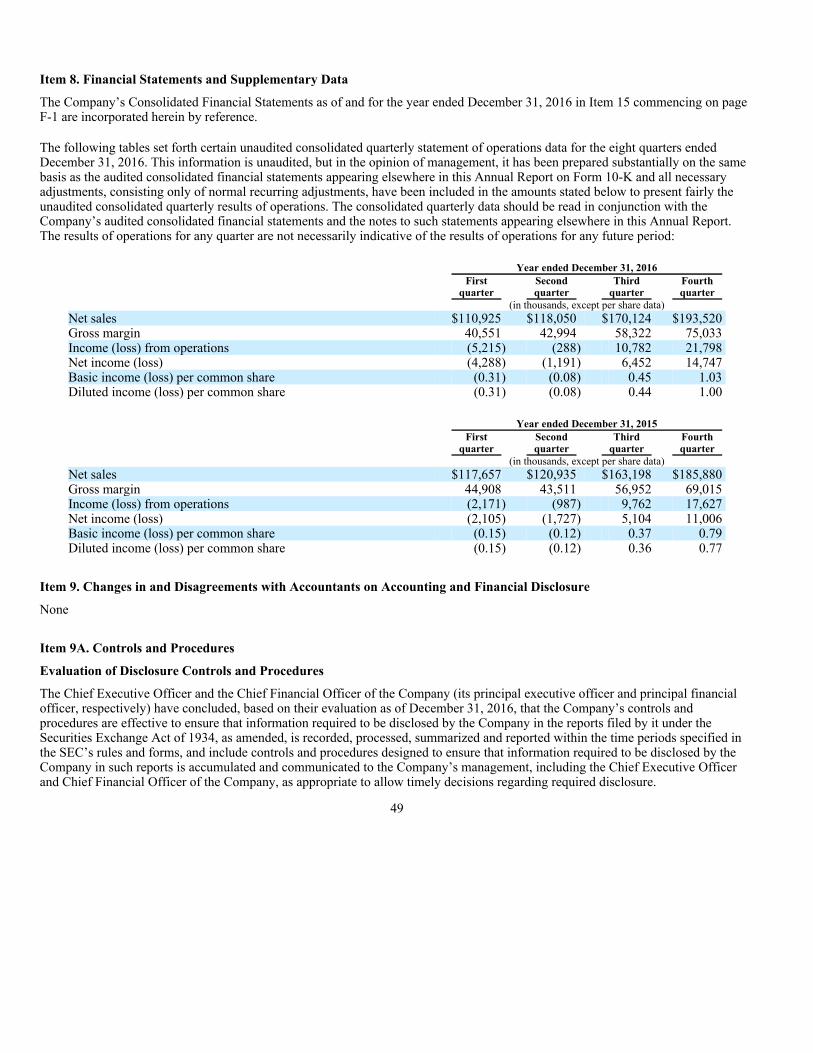
Item 8. Financial Statements and Supplementary Data
The Company’s Consolidated Financial Statements as of and for the year ended December 31, 2016 in Item 15 commencing on page F-1 are incorporated herein by reference.
The following tables set forth certain unaudited consolidated quarterly statement of operations data for the eight quarters ended December 31, 2016. This information is unaudited, but in the opinion of management, it has been prepared substantially on the same basis as the audited consolidated financial statements appearing elsewhere in this Annual Report on Form 10-K and all necessary adjustments, consisting only of normal recurring adjustments, have been included in the amounts stated below to present fairly the unaudited consolidated quarterly results of operations. The consolidated quarterly data should be read in conjunction with the Company’s audited consolidated financial statements and the notes to such statements appearing elsewhere in this Annual Report. The results of operations for any quarter are not necessarily indicative of the results of operations for any future period:
Item 9. Changes in and Disagreements with Accountants on Accounting and Financial Disclosure
None
Item 9A. Controls and Procedures
Evaluation of Disclosure Controls and Procedures
The Chief Executive Officer and the Chief Financial Officer of the Company (its principal executive officer and principal financial officer, respectively) have concluded, based on their evaluation as of December 31, 2016, that the Company’s controls and procedures are effective to ensure that information required to be disclosed by the Company in the reports filed by it under the Securities Exchange Act of 1934, as amended, is recorded, processed, summarized and reported within the time periods specified in the SEC’s rules and forms, and include controls and procedures designed to ensure that information required to be disclosed by the Company in such reports is accumulated and communicated to the Company’s management, including the Chief Executive Officer and Chief Financial Officer of the Company, as appropriate to allow timely decisions regarding required disclosure.
49
Year ended December 31, 2016
First
quarter Secondquarter
Third quarter
Fourthquarter
(in thousands, except per share data)Net sales $110,925 $118,050 $170,124 $193,520Gross margin 40,551 42,994 58,322 75,033Income (loss) from operations (5,215) (288) 10,782 21,798Net income (loss) (4,288) (1,191) 6,452 14,747Basic income (loss) per common share (0.31) (0.08) 0.45 1.03Diluted income (loss) per common share (0.31) (0.08) 0.44 1.00
Year ended December 31, 2015
First
quarter Secondquarter
Third quarter
Fourthquarter
(in thousands, except per share data)Net sales $117,657 $120,935 $163,198 $185,880Gross margin 44,908 43,511 56,952 69,015Income (loss) from operations (2,171) (987) 9,762 17,627Net income (loss) (2,105) (1,727) 5,104 11,006Basic income (loss) per common share (0.15) (0.12) 0.37 0.79Diluted income (loss) per common share (0.15) (0.12) 0.36 0.77

Changes in Internal Controls
There were no changes in the Company’s internal control over financial reporting that occurred during the Company’s most recent fiscal quarter that has materially affected, or is reasonably likely to materially affect, the Company’s internal control over financial reporting.
Management’s Report on Internal Control over Financial Reporting
Management of the Company is responsible for establishing and maintaining effective internal control over financial reporting and for performing an assessment of the effectiveness of internal control over financial reporting as of December 31, 2016. Internal control over financial reporting is defined in Rule 13a-15(f) or 15d-15(f) promulgated under the Exchange Act as a process designed by, or under the supervision of, the Company’s principle executive and principal financial officers and effected by the Company’s Board of Directors, management and other personnel, to provide reasonable assurance regarding the reliability of financial reporting and the preparation of financial statements for external purposes in accordance with U.S. generally accepted accounting principles.
Internal control over financial reporting includes those policies and procedures that:
All internal control systems, no matter how well designed, have inherent limitations. Because of the inherent limitations, internal control over financial reporting may not prevent or detect misstatements. Projections of any evaluation of effectiveness to future periods are subject to the risk that controls may become inadequate because of changes in conditions or the degree of compliance with the policies or procedures may deteriorate. Accordingly, even those systems determined to be effective can provide only reasonable assurance with respect to financial statement preparation and presentation.
Management performed an assessment of the effectiveness of the Company’s internal control over financial reporting as of December 31, 2016 using the criteria set forth in the Internal Control-Integrated Framework issued by the Committee of Sponsoring Organizations of the Treadway Commission (2013 framework). Based on this assessment, management has determined that the Company’s internal control over financial reporting as of December 31, 2016 is effective.
The effectiveness of the Company’s internal control over financial reporting as of December 31, 2016 has been audited by Ernst & Young LLP, an independent registered public accounting firm, as stated in their report.
50
• Pertain to the maintenance of records that, in reasonable detail, accurately and fairly reflect the transactions and dispositions of the assets of the Company;
• Provide reasonable assurance that transactions are recorded as necessary to permit the preparation of financial statements
in accordance with U.S. generally accepted accounting principles and that receipts and expenditures of the Company are being made only in accordance with authorizations of management and directors of the Company; and
• Provide reasonable assurance regarding prevention or timely detection of unauthorized acquisition, use or disposition of the Company’s assets that could have a material effect on the financial statements.

Report of Independent Registered Public Accounting Firm
To the Board of Directors and Stockholders of Lifetime Brands, Inc.
We have audited Lifetime Brands, Inc.’s internal control over financial reporting as of December 31, 2016, based on criteria established in Internal Control—Integrated Framework issued by the Committee of Sponsoring Organizations of the Treadway Commission (2013 framework) (the COSO criteria). Lifetime Brands, Inc.’s management is responsible for maintaining effective internal control over financial reporting, and for its assessment of the effectiveness of internal control over financial reporting included in the accompanying Management’s Report on Internal Control over Financial Reporting. Our responsibility is to express an opinion on the company’s internal control over financial reporting based on our audit.
We conducted our audit in accordance with the standards of the Public Company Accounting Oversight Board (United States). Those standards require that we plan and perform the audit to obtain reasonable assurance about whether effective internal control over financial reporting was maintained in all material respects. Our audit included obtaining an understanding of internal control over financial reporting, assessing the risk that a material weakness exists, testing and evaluating the design and operating effectiveness of internal control based on the assessed risk, and performing such other procedures as we considered necessary in the circumstances. We believe that our audit provides a reasonable basis for our opinion.
A company’s internal control over financial reporting is a process designed to provide reasonable assurance regarding the reliability of financial reporting and the preparation of financial statements for external purposes in accordance with generally accepted accounting principles. A company’s internal control over financial reporting includes those policies and procedures that (1) pertain to the maintenance of records that, in reasonable detail, accurately and fairly reflect the transactions and dispositions of the assets of the company; (2) provide reasonable assurance that transactions are recorded as necessary to permit preparation of financial statements in accordance with generally accepted accounting principles, and that receipts and expenditures of the company are being made only in accordance with authorizations of management and directors of the company; and (3) provide reasonable assurance regarding prevention or timely detection of unauthorized acquisition, use, or disposition of the company’s assets that could have a material effect on the financial statements.
Because of its inherent limitations, internal control over financial reporting may not prevent or detect misstatements. Also, projections of any evaluation of effectiveness to future periods are subject to the risk that controls may become inadequate because of changes in conditions, or that the degree of compliance with the policies or procedures may deteriorate.
In our opinion, Lifetime Brands, Inc. maintained, in all material respects, effective internal control over financial reporting as of December 31, 2016 based on the COSO criteria.
We also have audited, in accordance with the standards of the Public Company Accounting Oversight Board (United States), the consolidated balance sheets of Lifetime Brands, Inc. as of December 31, 2016 and 2015, and the related consolidated statements of operations, comprehensive (loss) income, stockholders’ equity and cash flows for each of the three years in the period ended December 31, 2016 of Lifetime Brands, Inc. and our report dated March 16, 2017 expressed an unqualified opinion thereon.
/s/ ERNST & YOUNG LLP
Jericho, New York March 16, 2017
51

Item 9B. Other Information
Not applicable.
PART III
Items 10, 11, 12, 13 and 14
The information required under these items is contained in the Company’s 2017 Proxy Statement, which will be filed with the SEC within 120 days after the close of the Company’s fiscal year covered by this Annual Report on Form 10-K and is incorporated herein by reference.
52

PART IV
Item 15. Exhibits and Financial Statement Schedules
53
(a) See Financial Statements and Financial Statement Schedule on page F-1.
(b) Exhibits*:
ExhibitNo. Description
3.1
Second Restated Certificate of Incorporation of the Company (incorporated by reference to Exhibit 3.2 to the Registrant’s Annual Report on Form 10-K for the year ended December 31, 2005)
3.2
Certificate of Amendment to Second Restated Certificate of Incorporation of Lifetime Brands, Inc. (incorporated by reference to Exhibit 3.1 to the Registrant’s Current Report on Form 8-K filed June 10, 2016)
3.3
Amended and Restated By-Laws of the Company (incorporated by reference to Exhibit 3.1 to the Registrant’s Current Report on Form 8-K filed on December 8, 2016)
4.1
Indenture dated as of June 27, 2006, Lifetime Brands, Inc. as issuer, and HSBC Bank USA, National Association as trustee, $75,000,000 4.75% Convertible Senior Notes due 2011 (incorporated by reference to Exhibit 4.2 to Amendment No. 1 to the Registrant’s registration statement No. 333-137575 on Form S-3)
10.1
License Agreement dated December 14, 1989 between the Company and Farberware, Inc. (incorporated by reference to the Registrant’s registration statement No. 33-40154 on Form S-1)
10.2
Evan Miller employment agreement dated July 1, 2003 (incorporated by reference to Exhibit 10.41 to the Registrant’s Quarterly Report on Form 10-Q for the quarter ended September 30, 2003)*
10.3
Evan Miller Amendment of Employment Agreement dated June 29, 2007 (incorporated by reference to Exhibit 10.1 to the Registrant’s Current Report on Form 8-K filed July 3, 2007)*
10.4
Employment Agreement, dated March 4, 2011, by and between Lifetime Brands, Inc. and Jeffrey Siegel (incorporated by reference to Exhibit 10.1 to the Registrant’s Current Report on Form 8-K filed March 8, 2011)*
10.5
First Amendment to Employment Agreement, dated April 30, 2012, between Lifetime Brands, Inc. and Jeffrey Siegel (incorporated by reference to Exhibit 10.1 to the Registrant’s Current Report on Form 8-K filed April 30, 2012)*
10.6
Employment Agreement, dated March 12, 2014, by and between Lifetime Brands, Inc. and Jeffrey Siegel (incorporated by reference to Exhibit 10.1 to the Registrant’s Current Report on Form 8-K filed March 18, 2014)*
10.7
Employment Agreement, dated January 12, 2017, by and between Lifetime Brands, Inc. and Jeffrey Siegel (incorporated by reference to Exhibit 10.1 to the Registrant’s Current Report on Form 8-K filed January 19, 2017)*
10.8
Lease Agreement dated as of May 10, 2006 between AG Metropolitan Endo, L.L.C and Lifetime Brands, Inc. for the property located at 1000 Stewart Avenue in Garden City, New York (incorporated by reference to Exhibit 99.1 to the Registrant’s Current Report on Form 8-K filed May 15, 2006)
10.9
First Amendment to the Lease Agreement dated as of May 10, 2006 between AG Metropolitan Endo, L.L.C and Lifetime Brands, Inc. for the property located at 1000 Stewart Avenue in Garden City, New York (incorporated by reference to Exhibit 10.1 to the Registrant’s Quarterly Report on Form 10-Q for the quarter ended September 30, 2006)

54
10.10
Amended 2000 Long-Term Incentive Plan (incorporated by reference to Exhibit 10.1 to the Registrant’s Current Report on Form 8-K filed June 9, 2006)*
10.11
Amendment to the Lifetime Brands, Inc. 2000 Long-Term Incentive Plan dated November 1, 2007 (incorporated by reference to Exhibit 10.1 to the Registrant’s Current Report on Form 8-K filed November 5, 2007)*
10.12
Amendment of the Lifetime Brands, Inc. 2000 Long-Term Incentive Plan dated June 11, 2009 (incorporated by reference to Exhibit 10.1 to the Registrant’s Current Report on Form 8-K filed June 12, 2009)*
10.13
Amendment of the Lifetime Brands, Inc. 2000 Long-Term Incentive Plan dated June 13, 2012 (incorporated by reference to Exhibit 10.1 to the Registrant’s Current Report on Form 8-K filed June 15, 2012)*
10.14
Lifetime Brands Inc. Amended and Restated 2000 Long-Term Incentive Plan dated June 10, 2015 (incorporated by reference to Exhibit 10.1 to the Registrant’s Current Report on Form 8-K filed June 11, 2015) *
10.15
Form of Restricted Stock Award Agreement under the Amended and Restated 2000 Long-term Incentive Plan (incorporated by reference to Exhibit 10.1 to the Registrant’s Quarterly Report on Form 10-Q filed August 10, 2015) *
10.16
Form of Deferred Stock (Performance-Vesting) Award Agreement under the Amended and Restated 2000 Long-term Incentive Plan (incorporated by reference to Exhibit 10.1 to the Registrant’s Quarterly Report on Form 10-Q filed August 10, 2015) *
10.17
Amended 2000 Incentive Bonus Compensation Plan (incorporated by reference to Exhibit 10.2 to the Registrant’s Current Report on Form 8-K filed June 9, 2006)*
10.18
Employment Agreement dated June 28, 2007 between Lifetime Brands, Inc. and Laurence Winoker (incorporated by reference to Exhibit 10.1 to the Registrant’s Current Report on Form 8-K filed July 3, 2007)*
10.19
Amendment to Employment Agreement, dated March 8, 2010, between Lifetime Brands, Inc. and Laurence Winoker (incorporated by reference to Exhibit 10.1 to the Registrant’s Current Report on Form 8-K filed March 10, 2010)*
10.20
Amendment of Employment Agreement, dated April 12, 2012, between Lifetime Brands, Inc. and Laurence Winoker (incorporated by reference to Exhibit 10.1 to the Registrant’s Current Report on Form 8-K filed April 16, 2012)*
10.21
Amended and Restated Employment Agreement, dated September 10, 2015, between Lifetime Brands, Inc. and Laurence Winoker (incorporated by reference to Exhibit 10.1 to the Registrant’s Current Report on Form 8-K filed September 16, 2015) *
10.22
Shares Subscription Agreement by and among Lifetime Brands, Inc., Ekco, S.A.B. and Mr. José Ramón Elizondo Anaya and Mr. Miguel Ángel Huerta Pando, dated as of June 8, 2007 (incorporated by reference to Exhibit 99.1 to the Registrant’s Current Report on Form 8-K filed June 11, 2007)
10.23
Amendment No.1 dated September 5, 2007 to the Shares Subscription Agreement by and among Lifetime Brands, Inc., Ekco, S.A.B. and Mr. José Ramón Elizondo Anaya and Mr. Miguel Ángel Huerta Pando, dated as of June 8, 2007 (incorporated by reference to Exhibit 10.17 to the Registrant’s Annual Report on Form 10-K for the year ended December 31, 2008)
10.24
Amendment No. 2 dated September 25, 2008 to the Shares Subscription Agreement by and among Lifetime Brands, Inc., Ekco, S.A.B. and Mr. José Ramón Elizondo Anaya and Mr. Miguel Ángel Huerta Pando, dated as of June 8, 2007 (incorporated by reference to Exhibit 10.21 to the Registrant’s Annual Report on Form 10-K for the year ended December 31, 2008)

55
10.25
Lease Agreement between Granite Sierra Park LP and Lifetime Brands, Inc. dated June 29, 2007 (incorporated by reference to Exhibit 99.1 to the Registrant’s Current Report on Form 8-K filed July 6, 2007)
10.26
Asset Purchase Agreement between Mikasa, Inc. and Lifetime Brands, Inc. dated June, 6 2008 (incorporated by reference to Exhibit 99.1 to the Registrant’s Form 10-Q for the quarter ended June 30, 2008)
10.27
Amended and Restated Employment Agreement, dated August 10, 2009 by and between Lifetime Brands, Inc. and Ronald Shiftan (incorporated by reference to Exhibit 10.1 to the Registrant’s Current Report on Form 8-K filed August 12, 2009)*
10.28
Amendment of Amended and Restated Employment Agreement, dated November 9, 2010, by and between Lifetime Brands, Inc. and Ronald Shiftan (incorporated by reference to Exhibit 10.33 to the Registrant’s Annual Report on Form 10-K for the year ended December 31, 2010)*
10.29
Second Amended and Restated Employment Agreement, dated as of December 20, 2012, by and between Lifetime Brands, Inc. and Ronald Shiftan (incorporated by reference to Exhibit 10.1 to the Registrant’s Current Report on Form 8-K filed December 21, 2012)*
10.30
Third Amended and Restated Employment Agreement, dated as of November 24, 2015, by and between Lifetime Brands, Inc. and Ronald Shiftan (incorporated by reference to Exhibit 10.1 to the Registrant’s Current Report on Form 8-K filed November 30, 2015)*
10.31
Share Purchase Agreement, dated November 4, 2011, by and among Lifetime Brands, Inc. and Creative Tops Holding Limited and Creative Tops Far East Limited (incorporated by reference to Exhibit 99.2 to the Registrant’s Current Report on Form 8-K filed November 8, 2011)
10.32
Senior Secured Credit Agreement, dated as of July 27, 2012, among Lifetime Brands, Inc., the Subsidiary Guarantors, the Lenders and JPMorgan Chase Bank, N.A., as Administrative Agent and Collateral Agent (incorporated by reference to Exhibit 10.6 to the Registrant’s Quarterly Report on Form 10-Q for the quarter ended September 30, 2013)
10.33
Amendment No. 1 to the Senior Secured Credit Agreement, dated as of November 13, 2012, among Lifetime Brands, Inc., the Subsidiary Guarantors party thereto, the Swap Agreement Counterparty, the financial institutions party thereto and JPMorgan Chase Bank, N.A., as Administrative Agent (incorporated by reference to Exhibit 99.3 to the Registrant’s Current Report on Form 8-K filed June 27, 2013)
10.34
Amendment No. 2 to the Senior Secured Credit Agreement, dated as of June 21, 2013, among Lifetime Brands, Inc., the Subsidiary Guarantors party thereto, the financial institutions party thereto and JPMorgan Chase Bank, N.A., as Administrative Agent (incorporated by reference to Exhibit 99.1 to the Registrant’s Current Report on Form 8-K filed June 27, 2013)
10.35
Share Purchase Agreement, dated January 15, 2014, relating to Thomas Plant (Birmingham) Limited (incorporated by reference to Exhibit 99.2 to the Registrant’s Current Report on Form 8-K filed January 17, 2014)
10.36
Deed of Variation and Settlement, dated April 1, 2015, by and among Lifetime Brands, Inc. and the sellers of Thomas Plant (Birmingham) Limited (incorporated by reference to Exhibit 10.1 to the Registrant’s Quarterly Report on Form 10-Q filed May 8, 2015)
10.37
Second Amended and Restated Credit Agreement, dated as of January 13, 2014, among Lifetime Brands, Inc., as Borrower, the Subsidiary Guarantors Party Thereto, as Subsidiary Guarantors, the Lenders Party Thereto and JPMorgan Chase Bank, N.A., as Administrative Agent and a Co-Collateral Agent, and HSBC Bank USA, National Association, as Syndication Agent and a Co-Collateral Agent, with exhibits. (incorporated by reference to Exhibit 99.3 to the Registrant’s Current Report on Form 8-K filed January 17, 2014)

10.38
Amendment No. 1 to the Second Amended and Restated Credit Agreement, dated as of September 23, 2014 among Lifetime Brands, Inc., as Borrower, the Subsidiary Guarantors Party Thereto, as Subsidiary Guarantors, the Lenders Party Thereto and JPMorgan Chase Bank, N.A., as Administrative Agent and a Co-Collateral Agent, and HSBC Bank USA, National Association, as Syndication Agent and a Co-Collateral Agent. (incorporated by reference to Exhibit 10.1 to the Registrant’s Current Report on Form 8-K filed September 26, 2014)
10.39
Amendment No. 2 to the Second Amended and Restated Credit Agreement, dated as of February 17, 2015 among Lifetime Brands, Inc., as Borrower, the Subsidiary Guarantors Party Thereto, as Subsidiary Guarantors, The Lenders Party Thereto and JPMorgan Chase Bank, N.A., as Administrative Agent and a Co-Collateral Agent, and HSBC Bank USA, National Association, as Syndication Agent and a Co-Collateral Agent. (incorporated by reference to Exhibit 10.1 to the Registrant’s Current Report on Form 8-K filed February 23, 2015)
10.40
Amendment No. 3 to Second Amended and Restated Credit Agreement, dated as of May 29, 2015, among Lifetime Brands, Inc., as the Company, the financial institutions party thereto as lenders, and JPMorgan Chase Bank, N.A., as Administrative Agent (incorporated by reference to Exhibit 10.1 to the Registrant’s Current Report on Form 8-K filed on June 2, 2015)
10.41
Amendment No. 4 to Second Amended and Restated Credit Agreement, dated as of August 4, 2016, among Lifetime Brands, Inc., as the Company, the financial institutions party thereto as Lenders, and JPMorgan Chase Bank, N.A., as Administrative Agent (incorporated by reference to Exhibit 10.1 to the Registrant’s Quarterly Report on Form 10-Q filed on August 9, 2016)
10.42
Employment Agreement, dated November 28, 2014, by and between Lifetime Brands, Inc. and Daniel Siegel (incorporated by reference to Exhibit 10.1 to the Registrant’s Current Report on Form 8-K filed December 3, 2014)*
10.43
Amendment of Employment Agreement dated April 27, 2015 between Lifetime Brands, Inc. and Daniel Siegel (incorporated by reference to Exhibit 10.1 to the Registrant’s Current Report on Form 8-K filed April 29, 2015)*
10.44
Form of Amended and Restated Director’s and Officer’s Indemnification Agreement (incorporated by reference to Exhibit 10.1 to the Registrant’s Current Report on Form 8-K filed on January 28, 2016)
10.45
Receivables Purchase Agreement, dated as of September 30, 2016 by and among Lifetime Brands, Inc., as a Seller and as a Seller Agent and initial Servicer, for itself and each of its subsidiaries thereto as a Seller, and HSBC Bank USA, National Association, as Purchaser (incorporated by reference to Exhibit 10.1 to the Registrant’s Current Report on Form 8-K filed October 4, 2016)
14.1
Code of Ethics dated February 28, 2013 (incorporated by reference to Exhibit 14.1 to the Registrant’s Current Report on Form 8-K filed March 6, 2013)
18.1
Letter from Ernst & Young LLP stating an acceptable change in accounting method for the impairment of goodwill dated October 28, 2008 (incorporated by reference to Exhibit 18 to the Registrant’s Quarterly Report on Form 10-Q for the quarter ended September, 30 2008)
21.1 Subsidiaries of the registrant
23.1 Consent of Ernst & Young LLP
23.2 Consent of KPMG Cardenas Dosal, S. C. (Mexico)
31.1
Certification by Jeffrey Siegel, Chief Executive Officer and Chairman of the Board of Directors, pursuant to Rule 13a-14(a) or Rule 15d-14(a) of the Securities and Exchange Act of 1934, as adopted pursuant to Section 302 of the Sarbanes-Oxley Act of 2002
31.2
Certification by Laurence Winoker, Senior Vice President – Finance, Treasurer and Chief Financial Officer, pursuant to Rule 13a-14(a) or Rule 15d-14(a) of the Securities and Exchange Act of 1934, as adopted pursuant to Section 302 of the Sarbanes-Oxley Act of 2002
32.1
Certification by Jeffrey Siegel, Chief Executive Officer and Chairman of the Board of Directors, and Laurence Winoker, Senior Vice President – Finance, Treasurer and Chief Financial Officer, pursuant to 18 U.S.C. Section 1350, as adopted pursuant to Section 906 of the Sarbanes-Oxley Act of 2002
99.1
Report of Independent Registered Accounting Firm on Grupo Vasconia, S.A.B. (formerly Ekco, S.A.B.), consolidated financial statements
101.INS XBRL Instance Document
101.SCH XBRL Taxonomy Extension Schema Document
101.DEF XBRL Taxonomy Extension Definition Linkbase Document
Notes to exhibits:
The Company will furnish a copy of any of the exhibits listed above upon payment of $5.00 per exhibit to cover the cost of the Company furnishing the exhibit.
56
101.CAL XBRL Taxonomy Extension Calculation Linkbase Document
101.LAB XBRL Taxonomy Extension Labels Linkbase Document
101.PRE XBRL Taxonomy Extension Presentation Linkbase Document
* Compensatory plans in which the directors and executive officers of the Company participate.
(c) Financial Statement Schedules — the response to this portion of Item 15 is submitted as a separate section of this Annual Report.

SIGNATURES
Pursuant to the requirements of Section 13 or 15(d) of the Securities Exchange Act of 1934, the registrant has duly caused this report to be signed on its behalf by the undersigned, thereunto duly authorized.
Pursuant to the requirements of the Securities Exchange Act of 1934, this report has been signed below by the following persons on behalf of the registrant and in the capacities and on the dates indicated.
57
Lifetime Brands, Inc.
/s/ Jeffrey SiegelJeffrey SiegelChairman of the Board of Directors,Chief Executive Officer and DirectorDate: March 16, 2017
Signature Title Date
/s/ Jeffrey Siegel Chairman of the Board of Directors, Chief Executive Officer and Director (Principal Executive Officer)
March 16, 2017Jeffrey Siegel
/s/ Ronald Shiftan Vice Chairman of the Board of Directors, Chief Operating Officer and Director
March 16, 2017Ronald Shiftan
/s/ Laurence Winoker Senior Vice President – Finance, Treasurer and Chief Financial Officer (Principal Financial and Accounting Officer)
March 16, 2017Laurence Winoker
/s/ Michael J. Jeary Director March 16, 2017Michael J. Jeary
/s/ John Koegel Director March 16, 2017John Koegel
/s/ Cherrie Nanninga Director March 16, 2017Cherrie Nanninga
/s/ Craig Phillips Director March 16, 2017Craig Phillips
/s/ Dennis E. Reaves Director March 16, 2017Dennis E. Reaves
/s/ Michael J. Regan Director March 16, 2017Michael J. Regan
/s/ Sara Genster Robling Director March 16, 2017Sara Genster Robling
/s/ William U. Westerfield Director March 16, 2017William U. Westerfield

Item 15
LIFETIME BRANDS, INC.
LIST OF FINANCIAL STATEMENTS AND FINANCIAL STATEMENT SCHEDULE
The following consolidated financial statements of Lifetime Brands, Inc. are filed as part of this Annual Report under Item 8 – Financial Statements and Supplementary Data.
All other financial schedules are not required under the related instructions or are inapplicable, and therefore have been omitted.
The unaudited supplementary data regarding quarterly results of operations are incorporated by reference to the information set forth in Item 8 – Financial Statements and Supplementary Data.
F-1
Report of Independent Registered Public Accounting Firm F-2Consolidated Balance Sheets as of December 31, 2016 and 2015 F-3Consolidated Statements of Operations for the Years ended December 31, 2016, 2015, and 2014 F-4Consolidated Statements of Comprehensive (Loss) Income for the Years ended December 31, 2016, 2015 and 2014 F-5Consolidated Statements of Stockholders’ Equity for the Years ended December 31, 2016, 2015, and 2014 F-6Consolidated Statements of Cash Flows for the Years ended December 31, 2016, 2015, and 2014 F-7Notes to Consolidated Financial Statements F-8
The following consolidated financial statement schedule of Lifetime Brands, Inc. required pursuant to Item 15(a) is submitted herewith:
Schedule II – Valuation and Qualifying Accounts S-1

Report of Independent Registered Public Accounting Firm
To the Board of Directors and Stockholders of Lifetime Brands, Inc.
We have audited the accompanying consolidated balance sheets of Lifetime Brands, Inc. (the “Company”) as of December 31, 2016 and 2015, and the related consolidated statements of operations, comprehensive (loss) income, stockholders’ equity and cash flows for each of the three years in the period ended December 31, 2016. Our audits also included the financial statement schedule listed in the Index at Item 15(a). These financial statements and schedule are the responsibility of the Company’s management. Our responsibility is to express an opinion on these financial statements and schedule based on our audits. We did not audit the consolidated financial statements of Grupo Vasconia, S.A.B. and Subsidiaries, a corporation in which the Company has a 30% interest. In the consolidated financial statements, the Company’s investment in Grupo Vasconia, S.A.B. and Subsidiaries is stated at $22.5 million and $24.7 million at December 31, 2016 and 2015, respectively, and the Company’s equity in the net income of Grupo Vasconia, S.A.B. and Subsidiaries is stated at $0.6 million, $0.6 million and $0.2 million for the three years in the period ended December 31, 2016. Those statements were audited by other auditors whose report has been furnished to us, and our opinion, insofar as it relates to the amounts included for Grupo Vasconia, S.A.B. and Subsidiaries, is based solely on the report of the other auditors.
We conducted our audits in accordance with the standards of the Public Company Accounting Oversight Board (United States). Those standards require that we plan and perform the audit to obtain reasonable assurance about whether the financial statements are free of material misstatement. An audit includes examining, on a test basis, evidence supporting the amounts and disclosures in the financial statements. An audit also includes assessing the accounting principles used and significant estimates made by management, as well as evaluating the overall financial statement presentation. We believe that our audits and the report of other auditors provide a reasonable basis for our opinion.
In our opinion, based on our audits and the report of other auditors, the financial statements referred to above present fairly, in all material respects, the consolidated financial position of Lifetime Brands, Inc. at December 31, 2016 and 2015, and the consolidated results of its operations and its cash flows for each of the three years in the period ended December 31, 2016, in conformity with U.S. generally accepted accounting principles. Also, in our opinion, the related financial statement schedule, when considered in relation to the basic financial statements taken as a whole, presents fairly in all material respects the information set forth therein.
We also have audited, in accordance with the standards of the Public Company Accounting Oversight Board (United States), Lifetime Brands, Inc.’s internal control over financial reporting as of December 31, 2016, based on criteria established in Internal Control – Integrated Framework issued by the Committee of Sponsoring Organizations of the Treadway Commission (2013 framework) and our report dated March 16, 2017 expressed an unqualified opinion thereon.
F-2
/s/ ERNST & YOUNG LLP
Jericho, New York March 16, 2017

LIFETIME BRANDS, INC. CONSOLIDATED BALANCE SHEETS
(in thousands-except share data)
See notes to consolidated financial statements.
F-3
December 31, 2016 2015
ASSETS CURRENT ASSETS
Cash and cash equivalents $ 7,883 $ 7,131Accounts receivable, less allowances of $5,725 at December 31, 2016 and
$5,300 at December 31, 2015 104,556 90,576Inventory (Note N) 135,212 136,890Prepaid expenses and other current assets 8,796 8,783
TOTAL CURRENT ASSETS 256,447 243,380
PROPERTY AND EQUIPMENT, net (Note N) 21,131 24,877INVESTMENTS (Note D) 22,712 24,973INTANGIBLE ASSETS, net (Note E) 89,219 96,593DEFERRED INCOME TAXES (Note J) 8,459 6,486OTHER ASSETS 1,886 2,022
TOTAL ASSETS $399,854 $398,331
LIABILITIES AND STOCKHOLDERS’ EQUITY CURRENT LIABILITIES
Current maturity of Credit Agreement Term Loan (Note F) $ 9,343 $ 19,646Short term loan (Note F) 113 252Accounts payable 29,698 27,245Accrued expenses (Note N) 45,212 40,154Income taxes payable (Note J) 6,920 4,064
TOTAL CURRENT LIABILITIES 91,286 91,361
DEFERRED RENT & OTHER LONG-TERM LIABILITIES (Note N) 18,973 18,556DEFERRED INCOME TAXES (Note J) 5,666 8,596REVOLVING CREDIT FACILITY (Note F) 86,201 65,617CREDIT AGREEMENT TERM LOAN (Note F) — 14,733
STOCKHOLDERS’ EQUITY Preferred stock, $1.00 par value, shares authorized: 100 shares of Series A and
2,000,000 shares of Series B; none issued and outstanding — — Common stock, $.01 par value, shares authorized: 50,000,000 at December 31, 2016
and 25,000,000 at December 31, 2015; shares issued and outstanding: 14,555,936 at December 31, 2016 and 14,030,221 at December 31, 2015 146 140
Paid-in capital 173,600 165,780Retained earnings 60,981 47,733Accumulated other comprehensive loss (Note N) (36,999) (14,185)
TOTAL STOCKHOLDERS’ EQUITY 197,728 199,468
TOTAL LIABILITIES AND STOCKHOLDERS’ EQUITY $399,854 $398,331

LIFETIME BRANDS, INC. CONSOLIDATED STATEMENTS OF OPERATIONS
(in thousands – except per share data)
See notes to consolidated financial statements.
F-4
Year Ended December 31, 2016 2015 2014
Net sales $592,619 $587,670 $586,010Cost of sales 375,719 373,284 373,129
Gross margin 216,900 214,386 212,881Distribution expenses 57,006 54,815 54,202Selling, general and administrative expenses 130,397 134,903 133,786Intangible asset impairment (Note E) — — 3,384Restructuring expenses 2,420 437 125
Income from operations 27,077 24,231 21,384Interest expense (Note F) (4,803) (5,746) (6,418) Financing expense — (154) (758) Loss on early retirement of debt (Note F) (272) — (346)
Income before income taxes and equity in earnings 22,002 18,331 13,862Income tax provision (Note J) (7,030) (6,627) (5,825) Equity in earnings (losses), net of taxes (Note D) 748 574 (6,493)
NET INCOME $ 15,720 $ 12,278 $ 1,544
BASIC INCOME PER COMMON SHARE (NOTE I) $ 1.11 $ 0.89 $ 0.11
DILUTED INCOME PER COMMON SHARE (NOTE I) $ 1.08 $ 0.86 $ 0.11

LIFETIME BRANDS, INC. CONSOLIDATED STATEMENTS OF COMPREHENSIVE (LOSS) INCOME
(in thousands)
See notes to consolidated financial statements.
F-5
Year ended December 31, 2016 2015 2014Net income $ 15,720 $12,278 $ 1,544Other comprehensive (loss) income, net of tax:
Translation adjustment (Note N) (23,061) (5,281) (4,736) Less: Amount reclassified 378 — —
Total translation loss (22,683) (5,281) (4,736)
Deferred (losses) gains on cash flow hedges (Notes G & N): Fair value adjustment, net of tax of $11 in 2016,$1 in 2015 and $9 in 2014 17 (2) 13
Total deferred gains (losses) on cash flow hedges 17 (2) 13
Effect of retirement benefit obligations (Note N): Net (loss) income arising from retirement benefit obligations, net of tax of ($135) in
2016, $211 in 2015 and ($589) in 2014 (202) 941 (1,507) Less: amortization of loss included in net income, net of tax of $36 in 2016, $53 in
2015 and $19 in 2014 54 79 28
Total effects of retirement benefit obligations (148) 1,020 (1,479)
Other comprehensive loss, net of tax (22,814) (4,263) (6,202)
Comprehensive (loss) income $ (7,094) $ 8,015 $(4,658)

LIFETIME BRANDS, INC. CONSOLIDATED STATEMENTS OF STOCKHOLDERS’ EQUITY
(in thousands)
See notes to consolidated financial statements.
F-6
Common stock Paid-in Retained Accumulated other
comprehensive Shares Amount capital earnings loss TotalBALANCE AT DECEMBER 31, 2013 12,777 $ 128 $146,273 $38,224 $ (3,720) $180,905Comprehensive (loss) income:
Net income — — — 1,544 — 1,544Translation adjustment — — — — (4,736) (4,736) Derivative fair value adjustment (Note G) — — — — 13 13Effect of retirement benefit obligations — — — — (1,479) (1,479)
Total comprehensive loss (4,658)
Shares issued to directors (Note H) 23 — 344 — — 344Shares issued to employee (Note H) 5 — 2 — — 2Stock compensation expense (Note H) — — 2,489 — — 2,489Issuance of 581,432 shares of common stock for
acquisition of Kitchen Craft (Note B) 581 6 8,376 — — 8,382Excess tax benefit from stock options, net — — 343 — — 343Exercise of stock options 326 3 2,488 — — 2,491Dividends (Note H) — — — (2,065) — (2,065)
BALANCE AT DECEMBER 31, 2014 13,712 $ 137 $160,315 $37,703 $ (9,922) $188,233
Comprehensive (loss) income: Net income — — — 12,278 — 12,278Translation adjustment — — — — (5,281) (5,281) Derivative fair value adjustment (Note G) — — — — (2) (2) Effect of retirement benefit obligations — — — — 1,020 1,020
Total comprehensive income 8,015
Shares issued to directors (Note H) 28 — 416 — — 416Shares issued to employees (Note H) 189 2 1,655 — — 1,657Stock compensation expense (Note H) — — 2,689 — — 2,689Reduction of tax benefit from stock options, net — — (138) — — (138) Exercise of stock options 101 1 843 — — 844Dividends (Note H) — — — (2,248) — (2,248)
BALANCE AT DECEMBER 31, 2015 14,030 $ 140 $165,780 $47,733 $ (14,185) $199,468
Comprehensive (loss) income: Net income — — — 15,720 — 15,720Translation adjustment — — — — (22,683) (22,683) Derivative fair value adjustment (Note G) — — — — 17 17Effect of retirement benefit obligations — — — — (148) (148)
Total comprehensive loss (7,094)
Shares issued to directors (Note H) 27 — 421 — — 421Net shares issued to employees (Note H) 234 3 2,124 — — 2,127Stock compensation expense (Note H) — — 2,490 — — 2,490Excess tax benefit from stock options, net — — 435 — — 435Exercise of stock options 265 3 2,350 — — 2,353Dividends (Note H) — — — (2,472) — (2,472)
BALANCE AT DECEMBER 31, 2016 14,556 $ 146 $173,600 $60,981 $ (36,999) $197,728

LIFETIME BRANDS, INC. CONSOLIDATED STATEMENTS OF CASH FLOWS
(in thousands)
See notes to consolidated financial statements
F-7
Year ended December 31, 2016 2015 2014OPERATING ACTIVITIES
Net income $ 15,720 $ 12,278 $ 1,544Adjustments to reconcile net income to net cash provided by operating activities:
Depreciation and amortization 14,148 14,203 14,200Amortization of financing costs 650 641 617Deferred rent (243) 848 (722) Deferred income taxes (1,951) (1,440) (3,757) Net loss on disposal of fixed assets 84 — — Stock compensation expense 2,942 5,286 4,493Undistributed equity (earnings) losses (544) (348) 6,724Intangible asset impairment (Note E) — — 3,384Loss on early retirement of debt (Note F) 272 — 346Contingent consideration fair value adjustment — 650 (4,203)
Changes in operating assets and liabilities (excluding the effects of business acquisitions)
Accounts receivable (17,977) 15,527 (5,923) Inventory 4,491 (308) (6,354) Prepaid expenses, other current assets and other assets (1,199) 1,087 (2,063) Accounts payable, accrued expenses and other liabilities 12,255 (397) (950) Income taxes receivable 132 — — Income taxes payable 969 (1,517) (2,747)
NET CASH PROVIDED BY OPERATING ACTIVITIES 29,749 46,510 4,589
INVESTING ACTIVITIES Purchases of property and equipment (3,380) (5,166) (6,171) Equity investments 567 112 (764) Kitchen Craft acquisition, net of cash acquired — — (59,977) Other acquisitions, net of cash acquired (21,699) — (5,389) Net proceeds from sale of property 64 26 68
NET CASH USED IN INVESTING ACTIVITIES (24,448) (5,028) (72,233)
FINANCING ACTIVITIES Proceeds from Revolving Credit Facility (Note F) 268,242 263,632 278,014Repayments from Revolving Credit Facility (Note F) (246,756) (290,346) (234,067) Repayments of Senior Secured Term Loan (Note F) — — (20,625) Proceeds from Credit Agreement Term Loan (Note F) — — 50,000Repayments of Credit Agreement Term Loan (Note F) (25,500) (10,000) (5,000) Proceeds from Short Term Loan (Note F) 118 289 1,645Payments from Short Term Loan (Note F) (248) (802) (880) Payments for stock repurchase (86) — — Payment of financing costs (30) (212) (2,283) Cash dividends paid (Note H) (2,413) (2,150) (2,031) Payment of capital lease obligations (68) (50) — Payment of contingent consideration — (391) — Proceeds from the exercise of stock options 2,353 843 2,488Excess tax benefit from stock options 223 43 553
NET CASH (USED IN) PROVIDED BY FINANCING ACTIVITIES (4,165) (39,144) 67,814
Effect of foreign exchange on cash (384) (275) (49)
INCREASE IN CASH AND CASH EQUIVALENTS 752 2,063 121
Cash and cash equivalents at beginning of year 7,131 5,068 4,947
CASH AND CASH EQUIVALENTS AT END OF YEAR $ 7,883 $ 7,131 $ 5,068

LIFETIME BRANDS, INC. NOTES TO CONSOLIDATED FINANCIAL STATEMENTS
DECEMBER 31, 2016
NOTE A — SIGNIFICANT ACCOUNTING POLICIES
Organization and business
Lifetime Brands, Inc. (the “Company”) designs, sources and sells branded kitchenware, tableware and other products used in the home and markets its products under a number of brand names and trademarks, which are either owned or licensed by the Company or through retailers’ private labels. The Company markets and sells its products principally on a wholesale basis to retailers. The Company also markets and sells a limited selection of its products directly to consumers through its Pfaltzgraff, Mikasa, Fred and Friends, Built NY, Lifetime Sterling and The English Table Internet websites.
Basis of presentation
The accompanying consolidated financial statements have been prepared in accordance with U.S. generally accepted accounting principles (“U.S. GAAP”) for financial information and with the instructions to Form 10-K.
The accompanying consolidated financial statements include estimates and assumptions relating to the reporting of assets and liabilities and the disclosure of contingent assets and liabilities to prepare these financial statements in conformity with U.S. GAAP. The most significant of these estimates and assumptions relate to revenue recognition, allowances for doubtful accounts, reserves for sales returns and allowances and customer chargebacks, inventory mark-down provisions, impairment of tangible and intangible assets, stock based compensation expense, estimates for unpaid healthcare claims, derivative valuations, accruals related to the Company’s tax positions and tax valuation allowances. Although these and other estimates and assumptions are based on the best available information, actual results could be materially different from these estimates.
Principles of consolidation
The accompanying consolidated financial statements include the accounts of the Company and its subsidiaries. All intercompany accounts and transactions have been eliminated in consolidation.
Foreign currency
All foreign wholly-owned subsidiaries use the local currency of their respective countries as their functional currency. Assets and liabilities are translated into U.S. dollars at exchange rates prevailing at the balance sheet dates. Revenues, costs and expenses are translated into U.S. dollars at average exchange rates for the relevant period. Income and losses resulting from translation are recorded as a component of accumulated other comprehensive income (loss). Gains and losses from foreign currency transactions, including the unrealized gain or loss on the fair value of foreign exchange contracts not designated as hedges and the realized gain or loss on all foreign exchange contracts, whether or not designated as hedges, are recognized in selling, general and administrative expenses in the consolidated statements of operations. Foreign currency gain/loss included within selling, general and administrative expenses was a $4.2 million gain in 2016, a $714,000 loss in 2015, and a $1.4 million loss in 2014.
Revenue recognition
The Company sells products wholesale, to retailers and distributors, and retail, directly to consumers. Wholesale sales and retail direct sales are recognized when title passes to the customer, which is primarily at the shipping point for wholesale sales and upon delivery to the customer for retail direct sales. Shipping and handling fees that are billed to customers in sales transactions are included in net sales and amounted to $2.6 million in 2016, $2.4 million in 2015 and $2.1 million in 2014. Net sales exclude taxes that are collected from customers and remitted to the taxing authorities.
F-8

LIFETIME BRANDS, INC. NOTES TO CONSOLIDATED FINANCIAL STATEMENTS
DECEMBER 31, 2016 The Company offers various sales incentives and promotional programs to its customers from time to time in the normal course of business. These incentives and promotions typically include arrangements such as cooperative advertising, buydowns, volume rebates and discounts. These arrangements and an estimate of sales returns are reflected as reductions in net sales in the Company’s consolidated statements of operations.
Cost of sales
Cost of sales consist primarily of costs associated with the production and procurement of product, inbound freight costs, purchasing costs, royalties and other product procurement related charges.
Distribution expenses
Distribution expenses consist primarily of warehousing expenses and freight-out expenses. Freight-out expenses were $11.0 million, $11.3 million and $11.4 million for the years ended December 31, 2016, 2015 and 2014, respectively. Handling costs of products sold are included in cost of sales.
In 2016, the Company identified and corrected an error in the accumulated depreciation balance relating to certain leasehold improvements at one of its U.S. warehouses. Accordingly, distribution expense for the year ended December 31, 2016 includes $1.2 million of additional depreciation expense to properly reflect the accumulated depreciation balance of these assets as of December 31, 2016.
Advertising expenses
Advertising expenses are expensed as incurred and are included in selling, general and administrative expenses. Advertising expenses were $3.7 million, $3.9 million and $4.2 million for the years ended December 31, 2016, 2015, and 2014, respectively.
Accounts receivable
The Company periodically reviews the collectability of its accounts receivable and establishes allowances for estimated losses that could result from the inability of its customers to make required payments. A considerable amount of judgment is required to assess the ultimate realization of these receivables including assessing the initial and on-going creditworthiness of the Company’s customers. The Company also maintains an allowance for anticipated customer deductions. The allowances for deductions are primarily based on contracts with customers.
However, in certain cases the Company does not have a formal contract and, therefore, customer deductions are non-contractual. To evaluate the reasonableness of non-contractual customer deductions, the Company analyzes currently available information and historical trends of deductions.
The sale of accounts receivable, under the Company’s Receivable Purchase Agreement with HSBC, are reflected as a reduction of accounts receivable in the Company’s consolidated balance sheet at the time of sale and any related expense is included in selling, general and administrative expenses in the Company’s consolidated statements of operations.
Inventory
Inventory consists principally of finished goods sourced from third-party suppliers. Inventory also includes finished goods, work in process and raw materials related to the Company’s manufacture of sterling silver products. Inventory is priced using the lower of cost (first-in, first-out basis) or market method. The Company estimates the selling price of its inventory on a product by product basis based on the current selling environment. If the estimated selling price is lower than the inventory’s cost, the Company reduces the value of the inventory to its net realizable value.
F-9
LIFETIME BRANDS, INC. NOTES TO CONSOLIDATED FINANCIAL STATEMENTS
DECEMBER 31, 2016 Property and equipment
Property and equipment is stated at cost. Property and equipment, other than leasehold improvements, are depreciated using the straight-line method over the estimated useful lives of the assets. Building and improvements are being depreciated over 30 years and machinery, furniture and equipment over periods ranging from 3 to 10 years. Leasehold improvements are amortized over the term of the lease or the estimated useful lives of the improvements, whichever is shorter. Advances paid towards the acquisition of property and equipment and the cost of property and equipment not ready for use before the end of the period are classified as construction in progress.
Cash equivalents
The Company considers all highly liquid instruments with a maturity of three months or less when purchased to be cash equivalents.
Concentration of credit risk
The Company’s cash and cash equivalents are potentially subject to concentration of credit risk. The Company maintains cash with several financial institutions that, in some cases, is in excess of Federal Deposit Insurance Corporation insurance limits.
Concentrations of credit risk with respect to trade accounts receivable are limited due to the large number of entities comprising the Company’s customer base.
During the years ended December 31, 2016, 2015, and 2014, Wal-Mart Stores, Inc., including Sam’s Club and, in the United Kingdom, Asda Superstore, (“Walmart”), accounted for 16% of net sales in each period. During the year ended December 31, 2016, Costco Wholesale Corporation, (“Costco”), accounted for 10% of net sales. Sales to Walmart are included in the Company’s U.S. Wholesale and International segments. Sales to Costco are primarily included in the U.S. Wholesale segment. No other customers accounted for 10% or more of the Company’s sales during these periods.
Fair value measurements
Financial Accounting Standards Board (“FASB”) Accounting Standards Codification (“ASC”) Topic No. 820, Fair Value Measurements and Disclosures, provides enhanced guidance for using fair value to measure assets and liabilities and establishes a common definition of fair value, provides a framework for measuring fair value under U.S. generally accepted accounting principles and expands disclosure requirements about fair value measurements. Fair value measurements included in the Company’s consolidated financial statements relate to the Company’s annual goodwill and other intangible asset impairment tests and derivatives, described in Notes E and G, respectively.
Fair value of financial instruments
The Company determined the carrying amounts of cash and cash equivalents, accounts receivable and accounts payable are reasonable estimates of their fair values because of their short-term nature. The Company determined that the carrying amounts of borrowings outstanding under its Revolving Credit Facility and Term Loan approximate fair value since such borrowings bear interest at variable market rates.
Derivatives
The Company accounts for derivative instruments in accordance with ASC Topic No. 815, Derivatives and Hedging. ASC Topic No. 815 requires that all derivative instruments be recognized on the balance sheet at fair value as either an asset or liability. Changes in the fair value of derivatives that qualify as hedges and have been designated as part
F-10
LIFETIME BRANDS, INC. NOTES TO CONSOLIDATED FINANCIAL STATEMENTS
DECEMBER 31, 2016 of a hedging relationship for accounting purposes have no net impact on earnings to the extent the derivative is considered highly effective in achieving offsetting changes in fair value or cash flows attributable to the risk being hedged, until the hedge item is recognized in earnings. If the derivative which is designated as part of a hedging relationship is considered ineffective in achieving offsetting changes in fair value or cash flows attributable to the risk being hedged, the changes in fair value are recorded in operations. For derivatives that do not qualify or are not designated as hedging instruments for accounting purposes, changes in fair value are recorded in operations.
Goodwill, intangible assets and long-lived assets
Goodwill and intangible assets deemed to have indefinite lives are not amortized but, instead, are subject to an annual impairment assessment. Additionally, if events or conditions were to indicate the carrying value of a reporting unit may not be recoverable, the Company would evaluate goodwill and other intangible assets for impairment at that time. As it relates to the goodwill assessment, the Company first assesses qualitative factors to determine whether it is more likely than not that the fair value of a reporting unit is less than its carrying amount as a basis for determining whether it is necessary to perform the two-step goodwill impairment testing described in ASU Topic No. 350, Intangibles – Goodwill and Other. If, after assessing qualitative factors, the Company determines that it is not more likely than not that the fair value of a reporting unit is less than its carrying amount, then performing the two-step impairment test is unnecessary and the Company’s goodwill is considered to be unimpaired. However, if based on the Company’s qualitative assessment it concludes that it is more likely than not that the fair value of the reporting unit is less than its carrying amount, or if the Company elects to bypass the qualitative assessment, the Company will proceed with performing the two-step process. The first step in the two-step process compares the carrying value of each reporting unit that has goodwill with the estimated fair value of the respective reporting unit. Should the carrying value of a reporting unit be in excess of the estimated fair value of that reporting unit, the second step must be performed. The second step represents a hypothetical purchase price allocation as if the Company had acquired the reporting unit on that date. The Company also evaluates qualitative factors to determine whether or not its indefinite lived intangibles have been impaired and then performs quantitative tests if required. These tests can include the royalty savings model or other valuation models.
Long-lived assets, including intangible assets deemed to have finite lives, are reviewed for impairment whenever events or changes in circumstances indicate that the carrying amount of an asset may not be recoverable. Impairment indicators include, among other conditions, cash flow deficits, historic or anticipated declines in revenue or operating profit or material adverse changes in the business climate that indicate that the carrying amount of an asset may be impaired. When impairment indicators are present, the recoverability of the asset is measured by comparing the carrying value of the asset to the estimated undiscounted future cash flows expected to be generated by the asset. If the asset is considered to be impaired, the impairment to be recognized is measured by the amount by which the carrying amount of the asset exceeds the fair value of the asset.
Income taxes
The Company accounts for income taxes using the asset and liability method. Under this method, deferred tax assets and liabilities are determined based on differences between financial reporting and tax bases of assets and liabilities and are measured using the enacted tax rates and laws that are expected to be in effect when the differences are expected to reverse. The Company accounts for foreign income taxes based upon anticipated reinvestment of profits into respective foreign tax jurisdictions.
The Company applies the authoritative guidance for the financial statement recognition, measurement and disclosure of uncertain tax positions recognized in the Company’s financial statements. In accordance with this guidance, tax positions must meet a more-likely-than-not recognition threshold and measurement attribute for the financial statement recognition and measurement of a tax position. A valuation allowance is required to be established or maintained when it is “more likely than not” that all or a portion of deferred tax assets will not be realized.
F-11

LIFETIME BRANDS, INC. NOTES TO CONSOLIDATED FINANCIAL STATEMENTS
DECEMBER 31, 2016 Share-based compensation
The Company accounts for its share-based compensation arrangements in accordance with ASC Topic 718, “Stock Compensation”, which requires the measurement of compensation expense for all share-based compensation granted to employees and non-employee directors at fair value on the date of grant and recognition of compensation expense over the related service period for awards expected to vest.
The Company uses the Black-Scholes option valuation model to estimate the fair value of its stock options. The Black-Scholes option valuation model requires the input of highly subjective assumptions including the expected stock price volatility of the Company’s common stock and the risk-free interest rate. Changes in these subjective input assumptions can materially affect the fair value estimate of the Company’s stock options on the date of the option grant.
Performance share awards are initially valued at the Company’s closing stock price on the date of grant. Each performance award represents the right to receive up to 150% of the target number of shares of common stock. The number of shares of common stock earned will be determined based on the attainment of specified performance goals by the end of the performance period, as determined by the Compensation Committee. Compensation expense for performance awards is recognized over the vesting period, and will vary based on remeasurement during the performance period. If the performance metrics are not probable of achievement during the performance period, compensation expense is reversed. The awards are forfeited if the performance metrics are not achieved as of the end of the performance period. The performance share awards vest in full at the end of a three year period.
The Company bases the estimated fair value of restricted stock awards on the date of grant. The estimated fair value is determined based on the closing price of the Company’s common stock on the date of grant multiplied by the number of shares awarded. Compensation expense is recognized on a straight-line basis over the vesting period, reduced by an estimated forfeiture rate.
Employee healthcare
The Company self-insures certain portions of its health insurance plan. The Company maintains an accrual for estimated unpaid claims and claims incurred but not yet reported (“IBNR”). Although management believes that it uses the best information available to estimate IBNR claims, actual claims may vary significantly from estimated claims.
Restructuring expenses
Costs associated with restructuring activities are recorded at fair value when a liability has been incurred. A liability has been incurred at the point of closure for any remaining operating lease obligations and at the communication date for severance.
In December 2015, the Company commenced an in-depth review of its U.S. Wholesale business segment, which included the evaluation of the segment’s efficiency and effectiveness, with the objective of developing a plan to restructure its operations as appropriate. The Company expanded this restructuring plan in 2016 to focus on specific actions required to achieve the plan’s objectives. The Company recorded $2.4 million and $437,000 of restructuring expenses during the years ended December 31, 2016 and 2015, respectively, related to the execution of this plan. The expense for the 2016 period includes severance of approximately $0.7 million and consulting expense of approximately $1.6 million.
As of December 31, 2016, $525,000 was accrued related to severance and consulting expenses from the restructuring plan. The Company does not expect to incur additional charges related to the execution of this plan.
F-12

LIFETIME BRANDS, INC. NOTES TO CONSOLIDATED FINANCIAL STATEMENTS
DECEMBER 31, 2016 In May 2014, the Company commenced a plan to consolidate its customer service and call center functions and eliminated certain employee positions in connection with this consolidation. The Company recorded $125,000 of restructuring expenses during the year ended December 31, 2014 related to the execution of this plan. The Company does not anticipate that it will incur any further restructuring expenses related to this plan.
Adopted accounting pronouncements
Effective January 1, 2016, the Company adopted Accounting Standards Update (“ASU”) 2015-03, Simplifying the Presentation of Debt Issuance Costs and ASU 2015-15, Presentation and Subsequent Measurement of Debt Issuance Costs Associated with Line-of-Credit Arrangements. This guidance requires debt issuance costs to be presented in the balance sheet as a direct deduction from the associated debt liability. ASU 2015-15 clarifies that the SEC staff would not object to an entity deferring and presenting debtissuance costs as an asset and subsequently amortizing the deferred debt issuance costs ratably over the term of the line-of-credit arrangement, regardless of whether there are any outstanding borrowings on the line-of-credit arrangement. In connection with the adoption of this standard, debt issuance costs associated with the Company’s Term Loan are presented as a deduction from the Term Loan balance as of December 31, 2016 and December 31, 2015. The retrospective adoption of this pronouncement results in a reduction of other assets of $621,000, a reduction of the current maturity of the Credit Agreement Term Loan of $354,000 and a reduction of the Credit Agreement Term Loan of $267,000 on the consolidated balance sheet as of December 31, 2015. The debt issuance costs associated with the Company’s Revolving Credit Facility are presented as other assets as of December 31, 2016 and 2015.
Effective January 1, 2016, the Company adopted ASU 2015-05, Customer’s Accounting for Fees Paid in a Cloud Computing Arrangement, which provides guidance about whether a cloud computing arrangement includes a software license. The Company will apply the guidance prospectively to all arrangements entered into or materially modified after January 1, 2016. The adoption of this standard did not have a significant impact on the Company’s consolidated financial statements.
Effective January 1, 2016, the Company adopted ASU 2015-16, Simplifying the Accounting for Measurement-Period Adjustments, which eliminates the requirement to restate prior period financial statements for measurement period adjustments. The Company will apply the new guidance prospectively to adjustments to provisional amounts that occur after the January 1, 2016 effective date. The adoption of this standard did not have a significant impact on the Company’s consolidated financial statements.
In August 2014, the FASB issued ASU 2014-15, Disclosures of Uncertainties about an Entity’s Ability to continue as a Going Concern, which requires an entity’s management to evaluate whether there are conditions or events, considered in the aggregate, that raise substantial doubt about the entity’s ability to continue as a going concern within one year after the date that financial statements are issued. The standard also requires footnote disclosures if management concludes that substantial doubts exists or that its future plans alleviate substantial doubt that was raised. The Company adopted ASU No. 2014-15 for the year ended December 31, 2016, with no impact to its financial statements and concluded that there were no conditions or events that raise substantial doubt about the Company’s ability to continue as a going concern.
Accounting pronouncements to be adopted in future periods
In January 2017, the Financial Accounting Standards Board (“FASB”) issued ASU 2017-04, Simplifying the Test for Goodwill Impairment, to simplify the subsequent measurement of goodwill by eliminating the second step of the goodwill impairment test. Under this standard, an entity should perform its annual or interim goodwill impairment test by comparing the fair value of a reporting unit with its carrying amount. An entity should recognize an impairment charge for the amount by which the carrying amount exceeds the reporting unit’s fair value. The loss recognized should not exceed the total amount of goodwill allocated to that reporting unit. This guidance is effective for interim and annual goodwill impairment tests in fiscal years beginning after December 15, 2019. Early adoption is permitted for interim or annual goodwill impairment tests performed on testing dates after January 1, 2017. The Company is evaluating if it will early adopt this pronouncement.
F-13
LIFETIME BRANDS, INC. NOTES TO CONSOLIDATED FINANCIAL STATEMENTS
DECEMBER 31, 2016 In January 2017, the FASB issued ASU 2017-01, Clarifying the Definition of a Business, to assist with evaluating whether transactions should be accounted for as acquisitions (or disposals) of assets or businesses. This guidance is effective for fiscal years beginning after December 15, 2017, and interim periods within those years. Early adoption is permitted for transactions not reported in financial statements that have been issued or made available for issuance.
In August 2016, the FASB issued ASU 2016-15, Statement of Cash Flows: Classification of Certain Cash Receipts and Cash Payments, which reduces the diversity in practice on how certain transactions are classified in the statement of cash flows. The guidance is effective for fiscal years beginning after December 15, 2018, and interim periods within fiscal years beginning after December 15, 2019. Early adoption is permitted. The Company is evaluating the effect of adopting this pronouncement.
In March 2016, the FASB issued ASU 2016-09, Improvements to Employee Share-Based Payment Accounting. This standard will require all income tax effects of awards to be recognized in the income statement when the awards vest or are settled. The standard will also allow an employer to repurchase more of an employee’s shares than is currently allowed for tax withholding purposes without triggering liability accounting, and will allow companies to make a policy election to account for forfeitures as they occur. The guidance is effective for fiscal years beginning after December 15, 2016, and interim periods within those years. Early adoption is permitted. The Company is evaluating the effect of adopting this pronouncement.
In February 2016, the FASB issued ASU 2016-02, Leases, which requires a lessee, in most leases, to initially recognize a lease liability for the obligation to make lease payments and a right-of-use asset for the right to use the underlying asset for the lease term. The guidance is effective for fiscal years beginning after December 15, 2018, and interim periods within with those years. Early adoption is permitted. The Company is evaluating the effect of adopting this pronouncement.
In July 2015, the FASB issued ASU 2015-11, Inventory: Simplifying the Measurement of Inventory, which affects reporting entities that measure inventory using either the first-in, first-out or average cost method. Specifically, the guidance requires that inventory be measured at the lower of cost and net realizable value. Net realizable value is the estimated selling price in the ordinary course of business, less reasonably predictable cost of completion, disposal, and transportation. The guidance is effective for fiscal years beginning after December 15, 2016, with early adoption permitted. The Company is evaluating the effect of adopting this pronouncement, but when adopted, this pronouncement is not expected to have a material impact on the Company’s consolidated financial statements.
In May 2014, the FASB issued ASU 2014-09, Revenue from Contracts with Customers, to clarify the principles of recognizing revenue and create common revenue recognition guidance under U.S. GAAP and International Financial Reporting Standards. Following the FASB’s finalization of a one year deferral of this standard, the ASU is now effective for fiscal years and interim periods within those fiscal years beginning after December 15, 2017, with early adoption permitted for fiscal years, and interim periods within those fiscal years, beginning on or after December 15, 2016. This ASU can be adopted either retrospectively to each reporting period presented or as a cumulative effect adjustment as of the date of the adoption. The standard supersedes existing revenue recognition guidance and replaces it with a five step revenue model with a core principle that an entity recognizes revenue to reflect the transfer of promised goods or services to customers in an amount that reflects the consideration to which the entity expects to be entitled to in exchange for those goods or services. In March 2016, the FASB issued Accounting Standards Update No. 2016-08, Revenue from Contracts with Customers (Topic 606): Principal versus Agent Considerations (Reporting Revenue Gross versus Net) which clarifies the implementation guidance on principal versus agent considerations
The Company intends to adopt the new guidance on January 1, 2018, with a cumulative-effect adjustment to opening retained earnings under the modified retrospective approach. Currently, the Company recognizes revenue when title passes to customers and incentives and promotions are recognized as a reduction of revenue, which generally reflects the consideration the Company expects to receive in exchange for the goods sold. The Company’s implementation of
F-14

LIFETIME BRANDS, INC. NOTES TO CONSOLIDATED FINANCIAL STATEMENTS
DECEMBER 31, 2016 this ASU includes the evaluation of its customer agreements to identify terms or conditions that could be considered a performance obligation such that, if material to the terms of the contract, consideration would be allocated to the performance obligation and could accelerate or defer the timing of recognizing revenue. The Company continues to evaluate the presentation of certain contract costs (whether presented gross or offset against revenues) and its principal versus agent arrangements.
The Company’s evaluation of the new guidance is not yet complete; however, based on the nature of the Company’s primary revenue sources and current policies, the Company does not expect a significant change in the timing and presentation of recognizing its revenue.
NOTE B —ACQUISITIONS
Focus
In September 2016, the Company acquired the Amco Houseworks®, Chicago™ Metallic and Swing-A-Way® kitchenware and bakeware brands, together with their related inventory, from Focus Products Group International, LLC (“Focus”) for cash in the amount of $8.8 million. The assets and operating results of the Focus brands are reflected in the Company’s consolidated financial statements in accordance with ASC Topic No. 805, Business Combinations, commencing from the acquisition date. The consolidated statement of operations for the year ended December 31, 2016 includes $3.6 million of net sales attributable to the Focus brands. The purchase price was allocated based on the Company’s preliminary estimate of the fair values of the assets acquired including, inventory ($3.5 million) and customer relationships and trade names ($5.3 million). Customer relationships and trade names are amortized on a straight-line basis over their estimated useful lives of 15 years.
Copco
In October 2016, the Company acquired the Copco® product line from Wilton Industries, Inc., for cash in the amount of $12.3 million. The product line includes thermal and hydration beverageware, tea kettles and kitchen organization products. The assets and operating results of the Copco brands are reflected in the Company’s consolidated financial statements in accordance with ASC Topic No. 805, Business Combinations, commencing from the acquisition date. The consolidated statement of operations for the year ended December 31, 2016 includes $3.9 million of net sales attributable to the Copco® brands. The purchase price was allocated based on the Company’s preliminary estimate of the fair values of the assets acquired including, inventory ($3.9 million) and customer relationships and trade names ($8.4 million). Customer relationships and trade names are amortized on a straight-line basis over their estimated useful lives of 15 and 10 years, respectively.
Kitchen Craft
In January 2014, the Company acquired 100% of the share capital of Thomas Plant (Birmingham) Limited (“Kitchen Craft”) for cash in the amount of £37.4 million (approximately $61.3 million) and 581,432 shares of common stock of the Company with an intrinsic value of £5.5 million ($9.0 million). The purchase price also included contingent cash consideration of up to £5.5 million ($9.0 million) which was to be payable in future years if Kitchen Craft achieved certain financial targets. Kitchen Craft is a leading supplier of kitchenware products and accessories in the United Kingdom. The assets, liabilities and operating results of Kitchen Craft are reflected in the Company’s consolidated financial statements in accordance with ASC Topic No. 805, Business Combinations, commencing from the acquisition date.
In April 2015, the Company entered into a Deed of Variation and Settlement with the sellers of Kitchen Craft to amend the calculation and financial targets of the contingent consideration included in the share purchase agreement, (the “Amended Agreement”). The maximum undiscounted contingent consideration to be paid remains unchanged at £5.5 million. As a result of the Amended Agreement, in April 2015, a charge of £1.0 million (approximately $1.5 million) was recorded in selling, general and administration expenses. Pursuant to the terms of the Amended Agreement, during the year ended December 31, 2016, the Company paid £2.1 million (approximately $3.2 million) to the sellers of Kitchen Craft. At December 31, 2016, the fair value of the contingent consideration outstanding under the Amended Agreement is £0.6 million (approximately $0.7 million).
F-15
LIFETIME BRANDS, INC. NOTES TO CONSOLIDATED FINANCIAL STATEMENTS
DECEMBER 31, 2016 Kitchen Craft was the sponsor of a defined benefit pension plan (the “Plan”) for which service costs accrual ceased prior to the acquisition. Pursuant to the share purchase agreement, the Company and the sellers agreed to take action to settle the Plan’s obligation through the purchase of a group annuity contract, to individual annuity contracts and to terminate the Plan. The Plan was settled and terminated in the fourth quarter of 2015. There was no impact to the Company’s consolidated statement of operations for the year ended December 31, 2015 in connection with the 2015 settlement of the Plan.
The Company’s net periodic benefit costs for the years ended December 31, 2015 and 2014 are described in Note M.
The year ended December 31, 2014 includes the operations of Kitchen Craft for the period from January 15, 2014 to December 31, 2014. The consolidated statement of operations for the year ended December 31, 2014 includes $67.6 million of net sales and $4.1 million of income from operations attributable to Kitchen Craft.
NOTE C — SALE OF ACCOUNTS RECEIVABLE
In order to improve its liquidity during seasonally high working capital periods, in 2016 the Company entered into an uncommitted Receivables Purchase Agreement with HSBC Bank USA, National Association (“HSBC”), as Purchaser (the “Receivables Purchase Agreement”). Under the Receivables Purchase Agreement, the Company may offer to sell certain eligible accounts receivable (the “Receivables”) to HSBC, which may accept such offer, and purchase the offered Receivables. Under the Receivables Purchase Agreement, following each purchase of Receivables, the outstanding aggregate purchased Receivables shall not exceed $25.0 million. HSBC will assume credit risk of the Receivables purchased; provided, however, and the Company will continue to be responsible for all non-credit risk matters. The Company will service the Receivables, and as such servicer, collect and otherwise enforce the Receivables on behalf of HSBC. The term of the agreement is for 364 days and shall automatically be extended for annual successive terms unless terminated. Either party may terminate the agreement at any time upon sixty days’ prior written notice to the other party. Pursuant to this agreement, the Company sold $44.3 million of Receivables during the year ended December 31, 2016. A charge of $131,000 related to the sale of the Receivables is included in selling, general and administrative expenses in the consolidated statement of operations for the year ended December 31, 2016.
At December 31, 2016, the Company held approximately $3.3 million of restricted cash representing collections the Company received as servicer of the Receivables sold to HSBC. This restricted cash was held in trust at December 31, 2016 and restricted from being pledged by the Company. The restricted cash was subsequently remitted to HSBC in accordance with the terms of the Receivables Purchase Agreement.
NOTE D — EQUITY INVESTMENTS
The Company owns approximately 30% of the outstanding capital stock of Grupo Vasconia, S.A.B. (“Vasconia”) an integrated manufacturer of aluminum products and one of Mexico’s largest housewares companies. Shares of Vasconia’s capital stock are traded on the Bolsa Mexicana de Valores, the Mexican Stock Exchange. The Quotation Key is VASCONI. The Company accounts for its investment in Vasconia using the equity method of accounting and records its proportionate share of Vasconia’s net income in the Company’s statement of operations. Accordingly, the Company has recorded its proportionate share of Vasconia’s net income (reduced for amortization expense related to the customer relationships acquired) for the years ended December 31, 2016, 2015 and 2014 in the accompanying consolidated statements of operations. The value of the Company’s investment balance has been translated from Mexican Pesos (“MXN”) to U.S. Dollars (“USD”) using the spot rate of MXN 20.70 and MXN 17.38 at December 31, 2016 and 2015, respectively. The Company’s proportionate share of Vasconia’s net income has been translated from MXN to USD using the average exchange rates of MXN 18.02 to 19.85, MXN 14.94 to 16.76 and MXN 12.99 to 13.87, during the years ended December 31, 2016, 2015, and 2014, respectively. The effect of the translation of the
F-16

LIFETIME BRANDS, INC. NOTES TO CONSOLIDATED FINANCIAL STATEMENTS
DECEMBER 31, 2016 Company’s investment resulted in a decrease of the investment of $3.2 million, $4.9 million and $4.0 million during the years ended December 31, 2016, 2015 and 2014, respectively. These translation effects are recorded in accumulated other comprehensive loss. The Company received cash dividends of $205,000, $226,000 and $230,000, from Vasconia during the years ended December 31, 2016, 2015 and 2014, respectively. Included in prepaid expenses and other current assets at December 31, 2016 and 2015 was $83,000 and $55,000 due from Vasconia. Included within accounts payable and accrued expenses at December 31, 2016 and 2015 was $220,000 and $28,000 due to Vasconia.
Summarized income statement information for the years ended December 31, 2016, 2015, and 2014, as well as summarized balance sheet information as of December 31, 2016 and 2015, for Vasconia in USD and MXN is as follows:
The Company recorded equity in earnings of Vasconia, net of taxes, of $0.6 million, $0.6 million and $0.2 million for the years ended December 31, 2016, December 31, 2015, and 2014, respectively. Equity in earnings in 2016, 2015 and 2014 includes deferred tax expense of $0.5 million, $1.3 million and $1.1 million, respectively, due to the requirement to record tax benefits for foreign currency translation losses through other comprehensive income (loss), with a corresponding adjustment to deferred tax liabilities.
As of December 31, 2016, the fair value (based upon the quoted stock price) of the Company’s investment in Vasconia was $29.0 million. The carrying value of the Company’s investment in Vasconia was $22.5 million.
F-17
Year Ended December 31, 2016 2015 2014 (in thousands)Income Statement USD MXN USD MXN USD MXNNet Sales $149,533 $2,795,009 $178,832 $2,824,399 $188,863 $2,514,294Gross Profit 27,205 510,617 33,982 534,285 35,592 474,482Income from operations 5,611 105,334 10,551 165,507 7,790 103,658Net Income 3,491 68,230 7,353 117,194 5,328 71,732Adjustments (1) — — — — 1,131 15,679Net Income as reported by Vasconia (2) $ 3,491 $ 68,230 $ 7,353 $ 117,194 $ 6,459 $ 87,411
(1) Certain adjustments were identified and not recorded in Vasconia’s consolidated financial statements for the year ended December 31, 2013 and were subsequently recorded by Vasconia in the year ended December 31, 2014. The Company recorded its proportionate share of the adjustments, approximately $0.3 million, net of tax, in the correct period in connection with its equity method of accounting for its investment in Vasconia.
(2) Vasconia’s consolidated financial statements for the year ended December 31, 2014 were included as Exhibit 99.1 to Amendment 1 to the Company’s fiscal year 2014 Form 10-K.
December 31, 2016 2015 (in thousands)Balance Sheet USD MXN USD MXNCurrent assets $81,509 $1,687,396 $100,482 $1,745,922Non-current assets 83,890 1,736,681 87,118 1,513,724Current liabilities 31,303 648,028 38,983 677,355Non-current liabilities 49,408 1,022,842 56,339 978,910
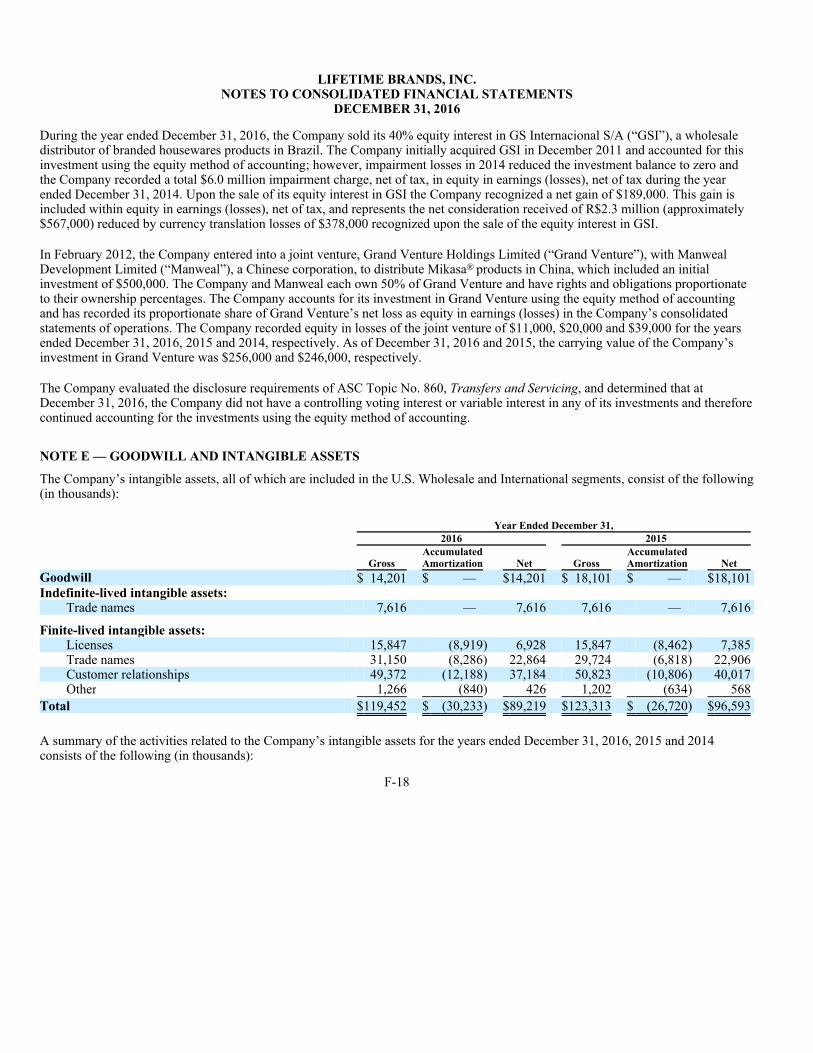
LIFETIME BRANDS, INC. NOTES TO CONSOLIDATED FINANCIAL STATEMENTS
DECEMBER 31, 2016 During the year ended December 31, 2016, the Company sold its 40% equity interest in GS Internacional S/A (“GSI”), a wholesale distributor of branded housewares products in Brazil. The Company initially acquired GSI in December 2011 and accounted for this investment using the equity method of accounting; however, impairment losses in 2014 reduced the investment balance to zero and the Company recorded a total $6.0 million impairment charge, net of tax, in equity in earnings (losses), net of tax during the year ended December 31, 2014. Upon the sale of its equity interest in GSI the Company recognized a net gain of $189,000. This gain is included within equity in earnings (losses), net of tax, and represents the net consideration received of R$2.3 million (approximately $567,000) reduced by currency translation losses of $378,000 recognized upon the sale of the equity interest in GSI.
In February 2012, the Company entered into a joint venture, Grand Venture Holdings Limited (“Grand Venture”), with Manweal Development Limited (“Manweal”), a Chinese corporation, to distribute Mikasa® products in China, which included an initial investment of $500,000. The Company and Manweal each own 50% of Grand Venture and have rights and obligations proportionate to their ownership percentages. The Company accounts for its investment in Grand Venture using the equity method of accounting and has recorded its proportionate share of Grand Venture’s net loss as equity in earnings (losses) in the Company’s consolidated statements of operations. The Company recorded equity in losses of the joint venture of $11,000, $20,000 and $39,000 for the years ended December 31, 2016, 2015 and 2014, respectively. As of December 31, 2016 and 2015, the carrying value of the Company’s investment in Grand Venture was $256,000 and $246,000, respectively.
The Company evaluated the disclosure requirements of ASC Topic No. 860, Transfers and Servicing, and determined that at December 31, 2016, the Company did not have a controlling voting interest or variable interest in any of its investments and therefore continued accounting for the investments using the equity method of accounting.
NOTE E — GOODWILL AND INTANGIBLE ASSETS
The Company’s intangible assets, all of which are included in the U.S. Wholesale and International segments, consist of the following (in thousands):
A summary of the activities related to the Company’s intangible assets for the years ended December 31, 2016, 2015 and 2014 consists of the following (in thousands):
F-18
Year Ended December 31, 2016 2015
Gross AccumulatedAmortization Net Gross
Accumulated Amortization Net
Goodwill $ 14,201 $ — $14,201 $ 18,101 $ — $18,101Indefinite-lived intangible assets:
Trade names 7,616 — 7,616 7,616 — 7,616
Finite-lived intangible assets: Licenses 15,847 (8,919) 6,928 15,847 (8,462) 7,385Trade names 31,150 (8,286) 22,864 29,724 (6,818) 22,906Customer relationships 49,372 (12,188) 37,184 50,823 (10,806) 40,017Other 1,266 (840) 426 1,202 (634) 568
Total $119,452 $ (30,233) $89,219 $123,313 $ (26,720) $96,593

LIFETIME BRANDS, INC. NOTES TO CONSOLIDATED FINANCIAL STATEMENTS
DECEMBER 31, 2016
The weighted-average amortization periods for the Company’s finite-lived intangible assets as of December 31, 2016 are as follows:
Estimated amortization expense for each of the five succeeding fiscal years is as follows (in thousands):
Amortization expense for the years ended December 31, 2016, 2015 and 2014 was $6.2 million, $7.0 million and $6.6 million, respectively.
F-19
Intangible
Assets Goodwill
Total IntangibleAssets and Goodwill
Goodwill and Intangible Assets, December 31, 2013 $ 50,064 $ 5,085 $ 55,149 Acquisition of trade names 12,348 — 12,348 Acquisition of customer relationships 32,417 — 32,417 Acquisition of other intangible assets 618 — 618 Goodwill from Kitchen Craft acquisition — 13,016 13,016 Impairment of trade names (3,384) — (3,384) Amortization (6,567) — (6,567)
Goodwill and Intangible Assets, December 31, 2014 85,496 18,101 103,597 Amortization (7,004) — (7,004)
Goodwill and Intangible Assets, December 31, 2015 78,492 18,101 96,593 Acquisition of trade names 5,159 — 5,159 Acquisition of customer relationships 8,878 — 8,878 Acquisition of other intangible assets 50 — 50 Foreign currency translation adjustment (11,400) (3,900) (15,300)
Amortization (6,161) — (6,161)
Goodwill and Intangible Assets, December 31, 2016 $ 75,018 $14,201 $ 89,219
Years Trade names 14 Licenses 33 Customer relationships 13 Other 11
Year ending December 31, 2017 $6,669 2018 6,669 2019 6,669 2020 6,654 2021 6,176
LIFETIME BRANDS, INC. NOTES TO CONSOLIDATED FINANCIAL STATEMENTS
DECEMBER 31, 2016 Annual indefinite-lived trade name impairment test
For the Company’s 2016 and 2015 annual impairment tests for its indefinite-lived trade names as of October 1, 2016 and 2015, the Company elected to first perform a qualitative assessment to determine if it was more likely than not that the fair values of the Company’s indefinite-lived trade names were less than the carrying values. The Company considered events and circumstances that could affect the significant inputs used to determine the fair values of the indefinite-lived trade names. Based on the qualitative assessment, the Company determined it was not more likely than not that the fair values of the Company’s indefinite-lived trade names were less than the carrying values as of October 1, 2016 and 2015.
In 2014, the Company performed quantitative impairment test for its indefinite-lived trade names which involved the assessment of the fair market values of the Company’s indefinite-lived trade names based on Level 3 unobservable inputs, using a relief from royalty approach, assuming a discount rate of 14.0%-15.5% and an average long term growth rate of 2.5%-3%. The result of the impairment assessment of the Company’s indefinite-lived trade names indicated that the carrying values of the Elements® and Melannco® trade names exceeded their fair values as of October 1, 2014. The Company’s home décor products category had experienced a decline in sales and profit in recent years. The Company believed the most significant factor resulting in the decline was the reduction in retail space allocated by the Company’s customers to the category which had also contributed to pricing pressure. As a result of these factors, the Company recorded an impairment charge of $3.4 million, related to these brands, in its consolidated statement of operations for the year ended December 31, 2014.
Annual goodwill impairment test
The Company bypassed the optional qualitative impairment analysis for its three reporting units with goodwill for its October 1, 2016 impairment test. Accordingly, the first step of the two step goodwill impairment test was performed. Under the first step, the estimated fair value of each of the reporting units was determined using the income approach or a combined income and market approach with equal weighting. The significant assumptions used under the income approach, or discounted cash flow method, are projected net sales, projected earnings before interest, tax, depreciation and amortization (“EBITDA”), terminal growth rates, and the cost of capital. Projected net sales, projected EBITDA and terminal growth rates were determined to be significant assumptions because they are three primary drivers of the projected cash flows in the discounted cash flow fair value model. Cost of capital was also determined to be a significant assumption as it is the discount rate used to calculate the current fair value of those projected cash flows. The market approach is based on a market multiple (revenue and EBITDA) and requires an estimate of appropriate multiples based on market date. Under the combined income and market approach, the resultant estimated fair value of two of the three reporting units exceeded their carrying value as of October 1, 2016.
For the Creative Tops reporting unit, which carried goodwill of $2.1 million, the market approach was not used as it was concluded that the selected industry market data was not consistent with a business with the future growth expectations of this reporting unit. The reporting unit’s fair value, as calculated under the income approach, was approximately 3% less than the carrying value. The decline in fair value was due to the forecasted sales and profits for the reporting unit falling below expectations relative to the Company’s previous projections and the macroeconomic conditions in Europe contributing to a decline in EBITDA. With the assistance of a third party valuation specialist, the Company performed the second step of the impairment test by estimating the fair value of the assets and liabilities to determine the implied fair value of goodwill. The implied fair value of goodwill was determined to be greater than the carrying value and no impairment charge was recorded. Changes in any of the significant assumptions used in the calculation of the fair value of the reporting unit or changes in the assumptions used in the calculation of the fair value of the assets and liabilities of the reporting unit, could lead to a potentially material non-cash impairment charge.
The excess of fair value of the Kitchen Craft reporting unit, which carried goodwill of $9.7 million, was approximately 3% over its carrying value. Macroeconomic conditions in Europe have contributed to a decline in EBITDA. Management’s projections used to estimate the cash flows included increasing net sales and operational improvements designed to reduce costs. Changes in any of the significant assumptions used can materially affect the
F-20

LIFETIME BRANDS, INC. NOTES TO CONSOLIDATED FINANCIAL STATEMENTS
DECEMBER 31, 2016 expected cash flows, and such impacts can result in the requirement to proceed to the second step of the test and potentially a material non-cash impairment charge could result. The Company is not currently aware of any negative changes in its assumptions that could lead to the fair value of the reporting unit being less than the carrying value.
As of December 31, 2016, the Company assessed the carrying value of goodwill and determined based on qualitative factors, no impairment existed.
NOTE F — DEBT
Credit Agreement
In January 2014, the Company entered into the Second Amended and Restated Credit Agreement, which has been amended, with JPMorgan Chase Bank, N.A, as Administrative Agent and Co-Collateral Agent, and HSBC Bank USA, National Association, as Syndication Agent and Co-Collateral Agent (the “Credit Agreement”). The Credit Agreement, which expires in January 2019, provides for, among other things, a Revolving Credit Facility commitment totaling $175.0 million ($40.0 million of which is available for multi-currency borrowings) and a Term Loan facility.
At December 31, 2016 and 2015, under the Revolving Credit Facility, borrowings outstanding were $86.2 million and $65.6 million, respectively. At December 31, 2016 and 2015, open letters of credit were $2.4 million and $1.4 million, respectively and availability under the Revolving Credit Facility was approximately $76.5 million and $86.2 million, respectively. The borrowing capacity under the Revolving Credit Facility depends, in part, on eligible levels of accounts receivable and inventory, each of which fluctuates based upon the seasonality of the business, and certain trademark values, based upon periodic appraisals. Therefore, the actual borrowing capacity may be less than the $175.0 million commitment.
The Company classifies a portion of the Revolving Credit Facility as a current liability if the Company’s intent and ability is to repay the loan from cash flows from operations which are expected to occur within the next 12 months. Repayments and borrowings under the facility can vary significantly from planned levels based on cash flow needs and general economic conditions. The Company expects that it will continue to borrow and repay funds, subject to availability, under the facility based on working capital and other corporate needs.
The Company’s payment obligations under the Revolving Credit Facility are unconditionally guaranteed by each of its existing U.S. subsidiaries and will be unconditionally guaranteed by each of its future U.S. subsidiaries. Certain payment obligations under the Revolving Credit Facility are also direct obligations of its foreign subsidiary borrowers designated as such under the Credit Agreement and, subject to limitations on such guaranties, are guaranteed by the foreign subsidiary borrowers, as well as by the Company. The obligations of the Company under the Revolving Credit Facility and any hedging arrangements and cash management services and the guarantees by its domestic subsidiaries in respect of those obligations are secured by substantially all of the assets and stock (but in the case of foreign subsidiaries, limited to 65% of the capital stock in first-tier foreign subsidiaries and not including the stock of subsidiaries of such first-tier foreign subsidiaries) owned by the Company and the U.S. subsidiary guarantors, subject to certain exceptions. Such security interests consist of a first-priority lien, subject to certain permitted liens, with respect to the assets of the Company and its domestic subsidiaries pledged as collateral in favor of lenders under the Revolving Credit Facility.
As of December 31, 2016 and 2015, $9.5 million and $35.0 million, respectively, was outstanding under the Term Loan and unamortized debt issuance costs were $157,000 and $621,000, respectively. In May 2015 the Credit Agreement was amended to provide for a $10.0 million prepayment of the Term Loan, if such amount was greater than the payment that would have been required pursuant to the agreement’s original terms (50% of the Company’s excess cash flow for the 2015 fiscal year). In April 2016, the Company made a prepayment of $15.2 million in accordance with the amended terms. In connection therewith, the Company wrote-off debt issuance costs of $0.3 million.
F-21

LIFETIME BRANDS, INC. NOTES TO CONSOLIDATED FINANCIAL STATEMENTS
DECEMBER 31, 2016 Interest rates on outstanding borrowings at December 31, 2016 ranged from 2.5% to 5.125%. In addition, the Company pays a commitment fee of 0.375% on the unused portion of the Revolving Credit Facility.
The Credit Agreement provides for customary restrictions and events of default. Restrictions include limitations on additional indebtedness, acquisitions, investments and payment of dividends, among other things. Further, the Credit Agreement provides that at any time any Term Loan is outstanding or at any time no Term Loan is outstanding and availability under the Revolving Credit Facility is less than $17.5 million and continuing until availability of at least $20.0 million is maintained for three consecutive months, the Company is required to maintain a minimum fixed charge coverage ratio of 1.20 to 1.00 for each of four consecutive fiscal quarter periods. The Credit Agreement also provides that when the Term Loan is outstanding, the Company is required to maintain a Senior Leverage Ratio within defined parameters not to exceed 3.75 to 1.00 for each fiscal quarter ending thereafter. For any fiscal quarter of the Company ending on September 30th, the maximum Senior Leverage Ratio is increased by an additional 0.25:1.00 in excess of the applicable level otherwise provided.
Pursuant to the Credit Agreement, as of December 31, 2016 the maximum additional permitted indebtedness other than certain subordinated indebtedness was $78.9 million. The Company was in compliance with the financial covenants of the Credit Agreement at December 31, 2016.
In August 2016, the Company amended the Credit Agreement to, among other things, allow the sale of certain accounts receivable by the Company to other financial institutions (subject to the approval of the Credit Agreement’s administrative agent) and revise the definition of EBITDA to provide that non-recurring charges shall not exceed $5.0 million during the term of the Credit Agreement (the previous limit was $2.0 million).
Other Credit Agreements
A subsidiary of the Company has a credit facility (“HSBC Facility” or “Short term loan”) with HSBC Bank (China) Company Limited, Shanghai Branch (“HSBC”) for up to RMB 18.0 million ($2.6 million). The HSBC Facility is subject to annual renewal and may be used to fund general working capital needs of the Company’s subsidiary which is a trading company in the People’s Republic of China. Borrowings under the HSBC Facility are guaranteed by the Company and are granted at the sole discretion of HSBC. At December 31, 2016 and 2015, RMB 0.8 million ($113,000) and RMB 1.6 million ($252,000), respectively, was outstanding under the HSBC Facility. Outstanding borrowings at December 31, 2016 carried an interest rate of 5.0%.
NOTE G — DERIVATIVES
The Company is a party to interest rate swap agreements with an aggregate notional amount of $14.0 million to manage interest rate exposure in connection with its variable interest rate borrowings. The hedge periods of these agreements commenced in March 2013 and expire in June 2018 and the notional amounts amortize over these periods. The interest rate swap agreements were designated as cash flow hedges under ASC Topic No. 815. The effective portion of the fair value gain or loss on these agreements is recorded as a component of accumulated other comprehensive loss.
The Company has also entered into foreign exchange contracts, primarily to offset the earnings impact related to fluctuations in foreign currency exchange rates associated with inventory purchases denominated in foreign currencies. The aggregate gross notional amount of foreign exchange contracts at December 31, 2016 was $38.3 million. These foreign exchange contracts have not been designated as hedges as required in order to apply hedge accounting. The changes in the fair value of these contracts are recorded in earnings immediately.
F-22

LIFETIME BRANDS, INC. NOTES TO CONSOLIDATED FINANCIAL STATEMENTS
DECEMBER 31, 2016 The fair values of the Company’s derivative financial instruments included in the consolidated balance sheets are presented as follows (in thousands):
The fair value of the derivatives have been obtained from the counterparties to the agreements and were based on Level 2 observable inputs using proprietary models and estimates about relevant future market conditions.
The amounts of the gains and losses related to the Company’s derivative financial instruments designated as hedging instruments are recognized in other comprehensive (loss) income as follows (in thousands):
No amounts recorded in accumulated other comprehensive loss are expected to be reclassified to interest expense in the next twelve months.
The amounts of the gains and losses related to the Company’s derivative financial instruments not designated as hedging instruments are recognized in earnings as follows (in thousands):
NOTE H — CAPITAL STOCK
Long-term incentive plan
The Company’s Amended and Restated 2000 Long-Term Incentive Plan (the “Plan”) provides for the granting of awards of up to 4,850,000 shares of common stock. These shares of the Company’s common stock are available for grants to directors, officers, employees, consultants and service providers and affiliates in the form of stock options or other equity-based awards. The Plan authorizes the Board of Directors of the Company, or a duly appointed committee thereof, to issue incentive stock options, non-qualified options, restricted stock, performance based awards
F-23
December 31,Derivatives designated as hedging instruments Balance Sheet Location 2016 2015
Interest rate swaps Accrued expenses $ 4 $ 10
Deferred rent &other long-term liabilities 3 25
December 31,Derivatives not designated as hedging instruments Balance Sheet Location 2016 2015
Foreign exchange contracts
Prepaid expenses and other current assets $924 $261
Year ended December 31,Derivatives designated as hedging instruments 2016 2015 2014
Interest rate swaps $ 17 $ (2) $ 13
Derivatives not designated as hedging instruments Location of
Gain or (Loss) Year Ended December 31,
2016 2015 2014
Foreign exchange contracts
Selling,general and administrativeexpense $2,182 $272 $694
LIFETIME BRANDS, INC. NOTES TO CONSOLIDATED FINANCIAL STATEMENTS
DECEMBER 31, 2016 and other stock-based awards. Options that have been granted under the Plan expire over a range of five to ten years from the date of grant and vest over a range of up to five years from the date of grant. Shares of restricted stock that have been granted under the Plan vest over a range of up to four years from the date of grant. Performance based awards that have been granted under the Plan vest after three years based upon the attainment of specified performance goals. As of December 31, 2016, there were 414,352 shares available for the grant of awards.
Cash dividends
Dividends were declared in 2016 and 2015 as follows:
On March 8, 2017, the Board of Directors declared a quarterly dividend of $0.0425 per share payable on May 15, 2017 to shareholders of record on May 1, 2017.
Stock repurchase program
On April 30, 2013, Lifetime’s Board of Directors authorized the repurchase of up to $10.0 million of the Company’s common stock. The repurchase authorization permits the Company to effect repurchases from time to time through open market purchases and privately negotiated transactions. No shares were repurchased during the years ended December 31, 2016, 2015 and 2014.
Preferred stock
The Company is authorized to issue 100 shares of Series A Preferred Stock and 2,000,000 shares of Series B Preferred Stock, none of which has been issued or is outstanding at December 31, 2016.
Stock options
A summary of the Company’s stock option activity and related information for the three years ended December 31, 2016, is as follows:
F-24
Dividend per share Date declared Date of record Payment date$0.0375 March 4, 2015 May 1, 2015 May 15, 2015$0.0375 June 10, 2015 July 31, 2015 August 14, 2015$0.0425 August 4, 2015 October 30, 2015 November 13, 2015$0.0425 November 3, 2015 February 1, 2016 February 15, 2016$0.0425 March 3, 2016 May 2, 2016 May 16, 2016$0.0425 June 9, 2016 August 1, 2016 August 15, 2016$0.0425 August 4, 2016 November 1, 2016 November 15, 2016$0.0425 November 3, 2016 February 1, 2017 February 15, 2017

LIFETIME BRANDS, INC. NOTES TO CONSOLIDATED FINANCIAL STATEMENTS
DECEMBER 31, 2016
The aggregate intrinsic value in the table above represents the total pre-tax intrinsic value that would have been received by the option holders had all option holders exercised their in-the-money stock options on December 31, 2016. The intrinsic value is calculated for each in-the-money stock option as the difference between the closing price of the Company’s common stock on December 31, 2016 and the exercise price.
The total intrinsic values of those stock options that were exercised in the years ended December 31, 2016, 2015 and 2014 were $1,848,000, $639,000 and $3,103,000, respectively. The intrinsic value of a stock option that is exercised is calculated at the date of exercise.
Total unrecognized stock option compensation expense at December 31, 2016, before the effect of income taxes, was $1.5 million and is expected to be recognized over a weighted-average period of 1.8 years.
The Company values stock options using the Black-Scholes option valuation model. The Black-Scholes option valuation model, as well as other available models, was developed for use in estimating the fair value of traded options, which have no vesting restrictions and are fully transferable. The Black-Scholes option valuation model requires the input of highly subjective assumptions including the expected stock price volatility and risk-free interest rate. Because the Company’s stock options have characteristics significantly different from those of traded options, changes in the subjective input assumptions can materially affect the fair value estimates of the Company’s stock options. The weighted-average per share grant date fair value of stock options granted during the years ended December 31, 2016, 2015, and 2014 was $5.43, $4.68 and $9.73, respectively.
The fair values for these stock options were estimated at the dates of grant using the following weighted-average assumptions:
F-25
Options
Weighted-averageexercise
price
Weighted- average
remaining contractuallife (years)
Aggregateintrinsic
valueOptions outstanding at December 31, 2013 2,371,650 $ 12.75
Grants 394,400 18.83 Exercises (365,223) 8.63 Cancellations (32,200) 12.23 Expirations (42,000) 26.61
Options outstanding at December 31, 2014 2,326,627 14.19 Grants 89,600 13.99 Exercises (110,375) 8.84 Cancellations (37,750) 15.57 Expirations (25,900) 26.60
Options outstanding at December 31, 2015 2,242,202 14.28 Grants 66,850 15.44 Exercises (272,325) 9.01 Cancellations (30,750) 15.39 Expirations (230,577) 27.16
Options outstanding at December 31, 2016 1,775,400 13.44 4.7 8,305,300
Options exercisable at December 31, 2016 1,469,967 $ 12.85 4.2 $7,667,500

LIFETIME BRANDS, INC. NOTES TO CONSOLIDATED FINANCIAL STATEMENTS
DECEMBER 31, 2016
Restricted Stock
A summary of the Company’s restricted stock activity and related information for the three years ended December 31, 2016 is as follows:
The total fair value of restricted stock that vested during the year ended December 31, 2016 was $712,000.
Performance shares
Each performance award represents the right to receive up to 150% of the target number of shares of common stock. The number of shares of common stock earned will be determined based on the attainment of specified performance goals at the end of the performance period, as determined by the Compensation Committee. The shares are subject to the terms and conditions of the Plan.
A summary of the Company’s performance-based award activity and related information for the two years ended December 31, 2016 is as follows:
F-26
2016 2015 2014 Historical volatility 39% 39% 58% Expected term (years) 6.0 5.2 6.0 Risk-free interest rate 1.37% 1.67% 1.95% Expected dividend yield 1.10% 1.18% 0.77%
Restricted
Shares
Weighted-average
grant date fair value
Non-vested restricted shares, December 31, 2013 22,459 $ 13.26 Grants 26,511 15.86 Vested (22,459) 13.26
Non-vested restricted shares, December 31, 2014 26,511 15.86 Grants 100,073 14.78 Vested (24,649) 15.97 Cancellations (500) 14.84
Non-vested restricted shares, December 31, 2015 101,435 14.77 Grants 109,170 15.64 Vested (46,306) 14.79 Cancellations (2,475) 14.93
Non-vested restricted shares, December 31, 2016 161,824 $ 15.35
Total unrecognized compensation expense remaining $1,837,700 Weighted-average years expected to be recognized over 2.6

LIFETIME BRANDS, INC. NOTES TO CONSOLIDATED FINANCIAL STATEMENTS
DECEMBER 31, 2016
The Company recognized total stock compensation expense of $2.9 million for the year ended December 31, 2016, of which $1.4 million represents stock option compensation expense, $1.5 million represents restricted stock, including restricted stock granted to directors and performance based compensation expense, and $32,000 represents stock awards. The Company recognized total stock compensation expense of $5.3 million for the year ended December 31, 2015, of which $2.2 million represents stock option compensation expense, $0.8 million represents restricted stock including restricted stock granted to directors and performance based compensation expense, and $2.2 million represents stock awards. For the year ended December 31, 2014 the Company recognized total stock compensation expense of $4.5 million, of which $2.5 million represents stock option compensation expense, $0.3 million represents restricted stock compensation expense and $1.7 million represents stock awards.
NOTE I — INCOME PER COMMON SHARE
Basic income per common share has been computed by dividing net income by the weighted-average number of shares of the Company’s common stock outstanding. Diluted income per common share adjusts net income and basic income per common share for the effect of all potentially dilutive shares of the Company’s common stock. The calculations of basic and diluted income per common share for the years ended December 31, 2016, 2015 and 2014, are as follows:
F-27
Performance-based
awards (1)
Weighted-average
grant date fair value
Non-vested performance-based awards, January 1, 2015 — $ — Grants 66,650 14.84 Cancellations (500) 14.84
Non-vested performance-based awards, December 31, 2015 66,150 14.84 Grants 82,000 15.69 Cancellations (2,188) 14.94
Non-vested performance-based awards, December 31, 2016 145,962 $ 15.32
Total unrecognized compensation expense remaining $ 1,313,200 Weighted-average years expected to be recognized over 1.6
(1) Represents the target number of shares to be issued for each performance-based award.
2016 2015 2014 (in thousands - except per share amounts)Net income – Basic and Diluted $ 15,720 $ 12,278 $ 1,544Weighted-average shares outstanding – Basic 14,174 13,850 13,519Effect of dilutive securities:
Stock options and restricted stock 375 416 455
Weighted-average shares outstanding – Diluted 14,549 14,266 13,974
Basic income per common share $ 1.11 $ 0.89 $ 0.11
Diluted income per common share $ 1.08 $ 0.86 $ 0.11
LIFETIME BRANDS, INC. NOTES TO CONSOLIDATED FINANCIAL STATEMENTS
DECEMBER 31, 2016 The computations of diluted income per common share for the years ended December 31, 2016, 2015 and 2014 excludes options to purchase 1,268,240, 1,467,857 and 2,004,836 shares of the Company’s common stock, respectively. The computation of diluted income per common share for the year ended December 31, 2016 excludes 66,873 restricted shares. These shares were excluded due to their antidilutive effect.
NOTE J — INCOME TAXES
The components of income before income taxes, equity in earnings and extraordinary item are as follows:
The provision for income taxes (before equity in earnings) consists of:
Deferred income taxes reflect the net tax effects of temporary differences between the carrying amounts of assets and liabilities for financial reporting purposes and the amounts used for income tax purposes. Significant components of the Company’s deferred income tax assets are as follows:
Significant components of the Company’s net deferred income tax asset (liability) are as follows:
F-28
Year Ended December 31, 2016 2015 2014 (in thousands)Domestic $22,114 $22,096 $10,251Foreign (112) (3,765) 3,611
Total income before income taxes and equity in earnings $22,002 $18,331 $13,862
Year Ended December 31, 2016 2015 2014 (in thousands) Current:
Federal $ 8,000 $ 5,584 $ 4,709 State and local 498 1,879 1,284 Foreign 483 604 1,691
Deferred (1,951) (1,440) (1,859)
Income tax provision $ 7,030 $ 6,627 $ 5,825
December 31, 2016 2015 (in thousands) Deferred income tax assets:
Deferred rent expense $ 3,706 $ 4,028 Stock options 4,593 4,179 Inventory 1,190 1,298 Operating loss carry-forward 2,568 2,213 Accounts receivable allowances 463 217 Accrued compensation 944 867 Other 2,784 2,820
Total deferred income tax assets $16,248 $15,622
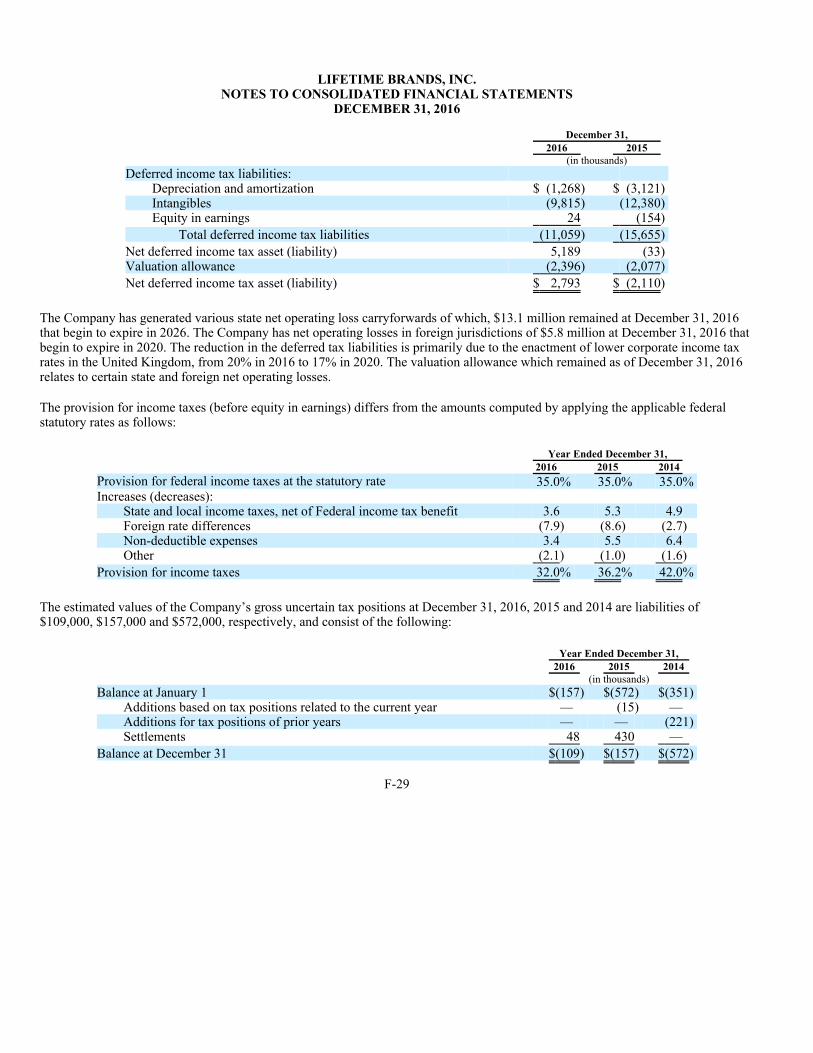
LIFETIME BRANDS, INC. NOTES TO CONSOLIDATED FINANCIAL STATEMENTS
DECEMBER 31, 2016
The Company has generated various state net operating loss carryforwards of which, $13.1 million remained at December 31, 2016 that begin to expire in 2026. The Company has net operating losses in foreign jurisdictions of $5.8 million at December 31, 2016 that begin to expire in 2020. The reduction in the deferred tax liabilities is primarily due to the enactment of lower corporate income tax rates in the United Kingdom, from 20% in 2016 to 17% in 2020. The valuation allowance which remained as of December 31, 2016 relates to certain state and foreign net operating losses.
The provision for income taxes (before equity in earnings) differs from the amounts computed by applying the applicable federal statutory rates as follows:
The estimated values of the Company’s gross uncertain tax positions at December 31, 2016, 2015 and 2014 are liabilities of $109,000, $157,000 and $572,000, respectively, and consist of the following:
F-29
December 31, 2016 2015 (in thousands) Deferred income tax liabilities:
Depreciation and amortization $ (1,268) $ (3,121) Intangibles (9,815) (12,380) Equity in earnings 24 (154)
Total deferred income tax liabilities (11,059) (15,655)
Net deferred income tax asset (liability) 5,189 (33) Valuation allowance (2,396) (2,077)
Net deferred income tax asset (liability) $ 2,793 $ (2,110)
Year Ended December 31, 2016 2015 2014 Provision for federal income taxes at the statutory rate 35.0% 35.0% 35.0% Increases (decreases):
State and local income taxes, net of Federal income tax benefit 3.6 5.3 4.9 Foreign rate differences (7.9) (8.6) (2.7) Non-deductible expenses 3.4 5.5 6.4 Other (2.1) (1.0) (1.6)
Provision for income taxes 32.0% 36.2% 42.0%
Year Ended December 31, 2016 2015 2014 (in thousands) Balance at January 1 $(157) $(572) $(351)
Additions based on tax positions related to the current year — (15) — Additions for tax positions of prior years — — (221) Settlements 48 430 —
Balance at December 31 $(109) $(157) $(572)
LIFETIME BRANDS, INC. NOTES TO CONSOLIDATED FINANCIAL STATEMENTS
DECEMBER 31, 2016 The Company had approximately $29,000 and $42,000, net of federal and state tax benefit, accrued at December 31, 2016 and 2015, respectively, for the payment of interest. The Company’s policy for recording interest and penalties is to record such items as a component of the provision for income taxes.
If the Company’s tax positions are ultimately sustained, the Company’s liability, including interest, would be reduced by $122,000 all of which would impact the Company’s tax provision. On a quarterly basis, the Company evaluates its tax positions and revises its estimates accordingly. The Company believes that it is reasonably possible that $54,000 of its tax positions will be resolved within the next twelve months.
The Company is no longer subject to U.S. Federal income tax examinations for the years prior to 2014. The Company has identified the following jurisdictions as “major” tax jurisdictions: U.S. Federal, California, Massachusetts, Illinois, New York, New Jersey and the United Kingdom. At December 31, 2016, the periods subject to examination by the Company’s major state jurisdictions are the years ended 2012 through 2015.
NOTE K — BUSINESS SEGMENTS
Segment information
The Company has three reportable segments, U.S. Wholesale, International and Retail Direct. The U.S. Wholesale segment includes the Company’s primary domestic business that designs, markets and distributes its products to retailers and distributors. The International Segment consists of certain business operations conducted outside the U.S. The Retail Direct segment is that in which the Company markets and sells a limited selection of its products to consumers through its Pfaltzgraff, Mikasa, Built NY, Fred & Friends and Lifetime Sterling websites.
The Company has segmented its operations to reflect the manner in which management reviews and evaluates the results of its operations. While the three segments distribute similar products, the segments have been distinct due to the different methods the Company uses to sell, market and distribute the products. Management evaluates the performance of the U.S. Wholesale, International and Retail Direct segments based on net sales and income (loss) from operations. Such measures give recognition to specifically identifiable operating costs such as cost of sales, distribution expenses and selling, general and administrative expenses. Certain general and administrative expenses, such as senior executive salaries and benefits, stock compensation, director fees and accounting, legal and consulting fees, are not allocated to the specific segments and are reflected as unallocated corporate expenses.
F-30

LIFETIME BRANDS, INC. NOTES TO CONSOLIDATED FINANCIAL STATEMENTS
DECEMBER 31, 2016
F-31
Year Ended December 31, 2016 2015 2014 (in thousands) Net sales:
U.S. Wholesale $470,981 $458,593 $441,293 International 101,070 108,000 125,230 Retail Direct 20,568 21,077 19,487
Total net sales $592,619 $587,670 $586,010
Income from operations: U.S. Wholesale(1) $ 39,745 $ 41,343 $ 34,874 International (2) 3,052 (1,600) 3,759 Retail Direct 770 (596) (1,034) Unallocated corporate expenses (16,490) (14,916) (16,215)
Total income from operations $ 27,077 $ 24,231 $ 21,384
Depreciation and amortization: U.S. Wholesale(3) $ 10,095 $ 8,784 $ 8,618 International 3,917 5,272 5,379 Retail Direct 136 147 203
Total depreciation and amortization $ 14,148 $ 14,203 $ 14,200
(1) In 2016 and 2015, income from operations for the U.S. Wholesale segment includes $2.4 million and $0.4 million, respectively, of restructuring expenses related to the U.S. Wholesale restructuring plan as described in Note A. The 2016 period also includes a $1.2 million charge to correct prior years’ depreciation of certain assets within the U.S. Wholesale segment. In 2014, income from operations for the U.S. Wholesale segment included a $3.4 million of intangible asset impairment charge and $4.2 million related to the reduction in certain contingent consideration accruals.
(2) In 2015, income from operations for the International segment includes a $1.0 million net charge related to the change in certain contingent consideration accruals.
(3) The 2016 period includes a $1.2 million charge to correct prior years’ depreciation of certain assets within the U.S. Wholesale segment.

LIFETIME BRANDS, INC. NOTES TO CONSOLIDATED FINANCIAL STATEMENTS
DECEMBER 31, 2016
F-32
Year Ended December 31, 2016 2015 2014 (in thousands)Assets:
U.S. Wholesale $287,313 $269,143 $287,744International 95,698 115,128 128,055Retail Direct 501 443 535Unallocated/ corporate/ other 16,342 13,617 5,068
Total assets $399,854 $398,331 $421,402
Capital expenditures: U.S. Wholesale $ 2,767 $ 4,087 $ 5,431International 424 1,004 650Retail Direct 189 75 90
Total capital expenditures $ 3,380 $ 5,166 $ 6,171
Year Ended December 31, 2016 2015 2014 (in thousands)Goodwill:
U.S. Wholesale Beginning balance $ 2,412 $ 2,412 $ 2,412Acquisition activity — — —
Ending balance 2,412 2,412 2,412
International Beginning balance 15,689 15,689 2,673Acquisition activity — — 13,016Foreign currency translation adjustment (3,900) — —
Ending balance 11,789 15,689 15,689
Total goodwill (1) $ 14,201 $ 18,101 $ 18,101
(1) No goodwill is allocated to the Company’s Retail Direct reportable segment.

LIFETIME BRANDS, INC. NOTES TO CONSOLIDATED FINANCIAL STATEMENTS
DECEMBER 31, 2016 Geographical information
The following table sets forth net sales and long-lived assets by the major geographic locations:
Product category information – net sales
In 2016, in connection with the Company’s U.S. Wholesale restructuring plan the Company realigned its product categories to best achieve the Company’s strategic plan and implementation of cost reduction initiatives. The revenue source categories disclosed below for the U.S. Wholesale operating segment reflect this realignment. Product categories in 2015 and 2014 have been reclassified to conform to current year presentation for comparative purposes. The following table sets forth net sales by major product categories included within the Company’s U.S. Wholesale operating segment:
F-33
Year ended December 31, 2016 2015 2014 (in thousands)
Net sales: United States $472,962 $462,234 $436,049United Kingdom 74,991 81,347 93,432Rest of World 44,666 44,089 56,529
Total $592,619 $587,670 $586,010
December 31, 2016 2015 (in thousands) Long-lived assets, excluding intangible assets, at period-end:
United States $43,431 $49,369 United Kingdom 1,186 1,550 Rest of World 1,112 953
Total $45,729 $51,872
Year Ended December 31, 2016 2015 2014 (in thousands)Category:
Kitchenware $286,815 $295,592 $293,904Tableware 135,901 125,445 117,546Home Solutions 48,265 37,556 29,843
Total $470,981 $458,593 $441,293

LIFETIME BRANDS, INC. NOTES TO CONSOLIDATED FINANCIAL STATEMENTS
DECEMBER 31, 2016 The following table sets forth net sales by major product categories included within the Company’s International operating segment:
NOTE L — COMMITMENTS AND CONTINGENCIES
Operating leases
The Company has lease agreements for its corporate headquarters, distribution centers, showrooms and sales offices that expire through 2029. These leases generally provide for, among other things, annual base rent escalations and additional rent for real estate taxes and other costs.
Future minimum payments under non-cancelable operating leases are as follows (in thousands):
Rent and related expenses under operating leases were $16.6 million, $17.4 million and $15.8 million for the years ended December 31, 2016, 2015 and 2014, respectively. The Company received $108,000 in sublease rental income in 2016. No such sublease rental income was received in 2015 or 2014.
The Company leases one property from the trustees of an active retirement benefit plan in which former and current employees of the Company participate. Total lease payments made to this related party in 2016 was $434,000. The lease agreement expires in 2020.
F-34
Year Ended December 31, 2016 2015 2014 (in thousands)Category:
Kitchenware $ 59,742 $ 61,291 $ 67,604Tableware 41,328 46,709 57,626
Total $101,070 $108,000 $125,230
Year Ending December 31, 2017 $ 17,279 2018 13,478 2019 11,254 2020 10,145 2021 9,771 Thereafter 61,236
Total $123,163

LIFETIME BRANDS, INC. NOTES TO CONSOLIDATED FINANCIAL STATEMENTS
DECEMBER 31, 2016 Royalties
The Company has license agreements that require the payment of royalties on sales of licensed products which expire through 2023. Future minimum royalties payable under these agreements are as follows (in thousands):
Legal proceedings
Wallace Silversmiths de Puerto Rico, Ltd. (“WSPR”), a wholly-owned subsidiary of the Company, operates a manufacturing facility in San Germán, Puerto Rico that is leased from the Puerto Rico Industrial Development Company (“PRIDCO”). In March 2008, the United States Environmental Protection Agency (the “EPA”) announced that the San Germán Ground Water Contamination site in Puerto Rico (the “Site”) had been added to the Superfund National Priorities List due to contamination present in the local drinking water supply.
In May 2008, WSPR received from the EPA a Notice of Potential Liability and Request for Information Pursuant to 42 U.S.C. Sections 9607(a) and 9604(e) of the Comprehensive Environmental Response, Compensation, and Liability Act (“CERCLA”). In July 2011, WSPR received a letter from the EPA requesting access to the property that it leases from PRIDCO to conduct an environmental investigation, and the Company granted such access. In February 2013, the EPA requested access to conduct a further environmental investigation at the property. PRIDCO agreed to such access and the Company consented. EPA conducted a further investigation during 2013 and, in April 2015, notified the Company and PRIDCO that the results from vapor intrusion sampling may warrant implementation of measures to mitigate potential exposure to sub-slab soil gas. The Company reviewed the information provided by the EPA and requested that PRIDCO, as the property owner, find and implement a solution acceptable to the EPA. While WSPR did not cause the sub-surface condition that resulted in the potential for vapor intrusion, in order to protect the health of its employees and continue its business operations, it has nevertheless implemented corrective action measures to prevent vapor intrusion such as sealing floors of the building and conducting periodic air monitoring to address potential exposure. On August 13, 2015, the EPA released its remedial investigation and feasibility study (“RI/FS”) for the Site. On December 11, 2015, the EPA issued the Record of Decision (“ROD”) for OU-1, electing to implement its preferred remedy which consists of soil vapor extraction and dual-phase extraction/in-situ treatment. This selected remedy includes soil vapor extraction (“SVE”) to address soil (vadose zone) source areas at the Site, impermeable cover as necessary for the implementation of SVE, dual phase extraction in the shallow saprolite zone, and in-situ treatment as needed to address residual sources. The EPA’s estimated capital cost for its selected remedy is $7.3 million. The EPA also designated a second operable unit under which the EPA will conduct further investigations to determine the nature and extent of groundwater contamination, as well as a determination by the EPA on the necessity of any further response actions to address groundwater contamination. In February 2017, the EPA indicated that it plans to expand its field investigation for the RI/FS for the second operable unit to further determine the nature and extent of the groundwater contamination at and from the Site and to determine the nature of the remedial action needed to address the contamination. The EPA has requested access to the property occupied by WSPR to install monitoring wells and to undertake groundwater sampling as part of this expanded investigation. WSPR has consented to EPA’s access request, provided that the EPA receives PRIDCO’s consent, as the property
F-35
Year ending December 31, 2017 $ 6,199 2018 5,939 2019 248 2020 218 2021 222 Thereafter 382
Total $13,208
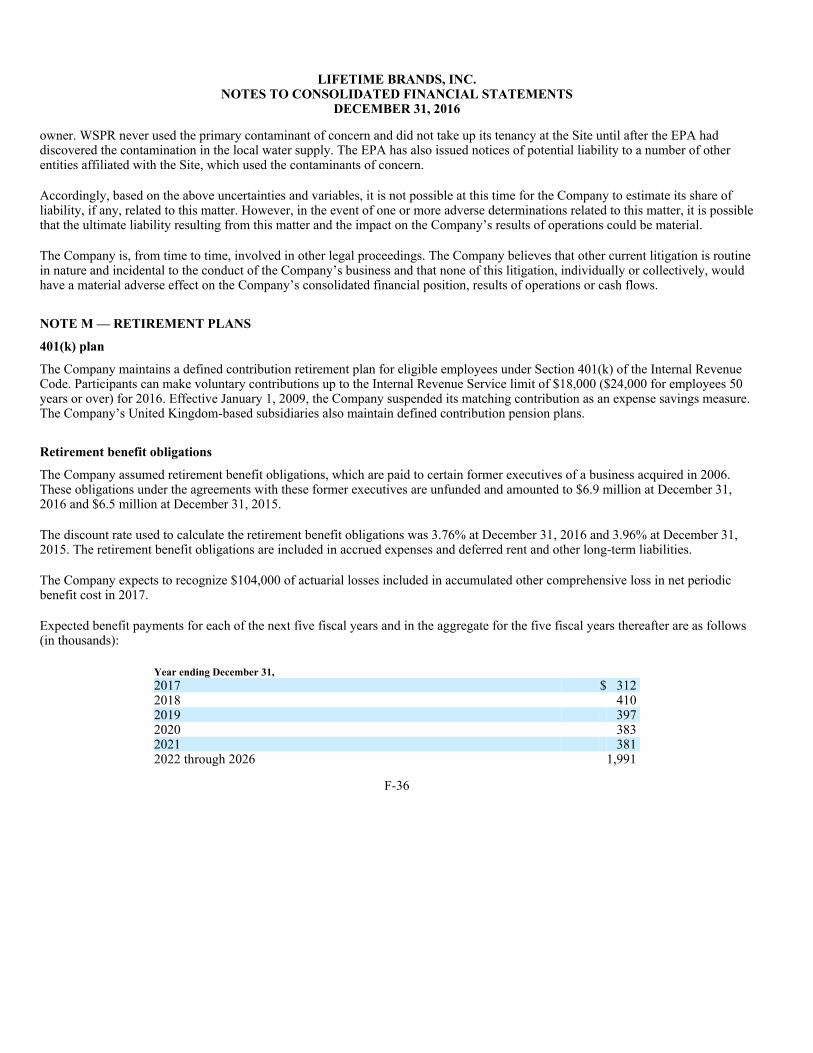
LIFETIME BRANDS, INC. NOTES TO CONSOLIDATED FINANCIAL STATEMENTS
DECEMBER 31, 2016 owner. WSPR never used the primary contaminant of concern and did not take up its tenancy at the Site until after the EPA had discovered the contamination in the local water supply. The EPA has also issued notices of potential liability to a number of other entities affiliated with the Site, which used the contaminants of concern.
Accordingly, based on the above uncertainties and variables, it is not possible at this time for the Company to estimate its share of liability, if any, related to this matter. However, in the event of one or more adverse determinations related to this matter, it is possible that the ultimate liability resulting from this matter and the impact on the Company’s results of operations could be material.
The Company is, from time to time, involved in other legal proceedings. The Company believes that other current litigation is routine in nature and incidental to the conduct of the Company’s business and that none of this litigation, individually or collectively, would have a material adverse effect on the Company’s consolidated financial position, results of operations or cash flows.
NOTE M — RETIREMENT PLANS
401(k) plan
The Company maintains a defined contribution retirement plan for eligible employees under Section 401(k) of the Internal Revenue Code. Participants can make voluntary contributions up to the Internal Revenue Service limit of $18,000 ($24,000 for employees 50 years or over) for 2016. Effective January 1, 2009, the Company suspended its matching contribution as an expense savings measure. The Company’s United Kingdom-based subsidiaries also maintain defined contribution pension plans.
Retirement benefit obligations
The Company assumed retirement benefit obligations, which are paid to certain former executives of a business acquired in 2006. These obligations under the agreements with these former executives are unfunded and amounted to $6.9 million at December 31, 2016 and $6.5 million at December 31, 2015.
The discount rate used to calculate the retirement benefit obligations was 3.76% at December 31, 2016 and 3.96% at December 31, 2015. The retirement benefit obligations are included in accrued expenses and deferred rent and other long-term liabilities.
The Company expects to recognize $104,000 of actuarial losses included in accumulated other comprehensive loss in net periodic benefit cost in 2017.
Expected benefit payments for each of the next five fiscal years and in the aggregate for the five fiscal years thereafter are as follows (in thousands):
F-36
Year ending December 31, 2017 $ 312 2018 410 2019 397 2020 383 2021 381 2022 through 2026 1,991

LIFETIME BRANDS, INC. NOTES TO CONSOLIDATED FINANCIAL STATEMENTS
DECEMBER 31, 2016 Kitchen Craft pension plan
Kitchen Craft was the sponsor of a defined benefit pension plan (the “Plan”) for which service costs accrual ceased prior to its acquisition in January 2014. In October 2014, the Plan trustees secured, in full, all benefits payable or contingently payable under the Plan (subject to adjustment as determined by the UK pension authority in connection with its approval of the Plan’s termination) through the purchase of a group annuity contract from a major UK-based insurance company. The share purchase agreement, pursuant to which the Company acquired Kitchen Craft, provides that any additional contributions required in connection with the settlement and termination of the Plan shall be offset by future amounts owed to the sellers or, if those amounts are insufficient, reimbursed to the Company by the sellers. Accordingly, there was no impact to the Company’s statement of operations in the years ended December 31, 2016 and 2015. The settlement and termination of the Plan occurred in 2015.
The following table summarizes the changes in the projected benefit obligations and plan assets for the year ended December 31, 2015:
No periodic pension costs were incurred during the years ended December 31, 2016 and 2015. The following table summarizes the components of net period pension costs for the year ended December 31, 2014 (in thousands).
The accumulated benefit obligations at December 31, 2016 and 2015 were $0. The amount in accumulated other comprehensive income at December 31, 2014 was $623,000.
F-37
Year Ended December 31, 2015 (in thousands) Change in projected benefit obligations
Projected benefit obligations, beginning of year $ 13,796 Interest cost — Actuarial (gain) loss (2,492) Benefits paid (58) Annuity purchase (11,008) Currency adjustment (238)
Projected benefit obligations, end of year $ —
Change in plan assets Fair value of plan assets, beginning of year $ 15,533 Actual return on plan assets (1,903) Employer (refund) contributions (2,295) Benefits paid (58) Annuity purchase (11,008) Currency adjustment (269)
Fair value of plan assets, end of year $ —
Net Plan funding, end of year $ —
Components of net periodic pension cost Expected return on plan assets $(390) Interest cost on projected benefit obligations 364
Net periodic pension cost $ (26)
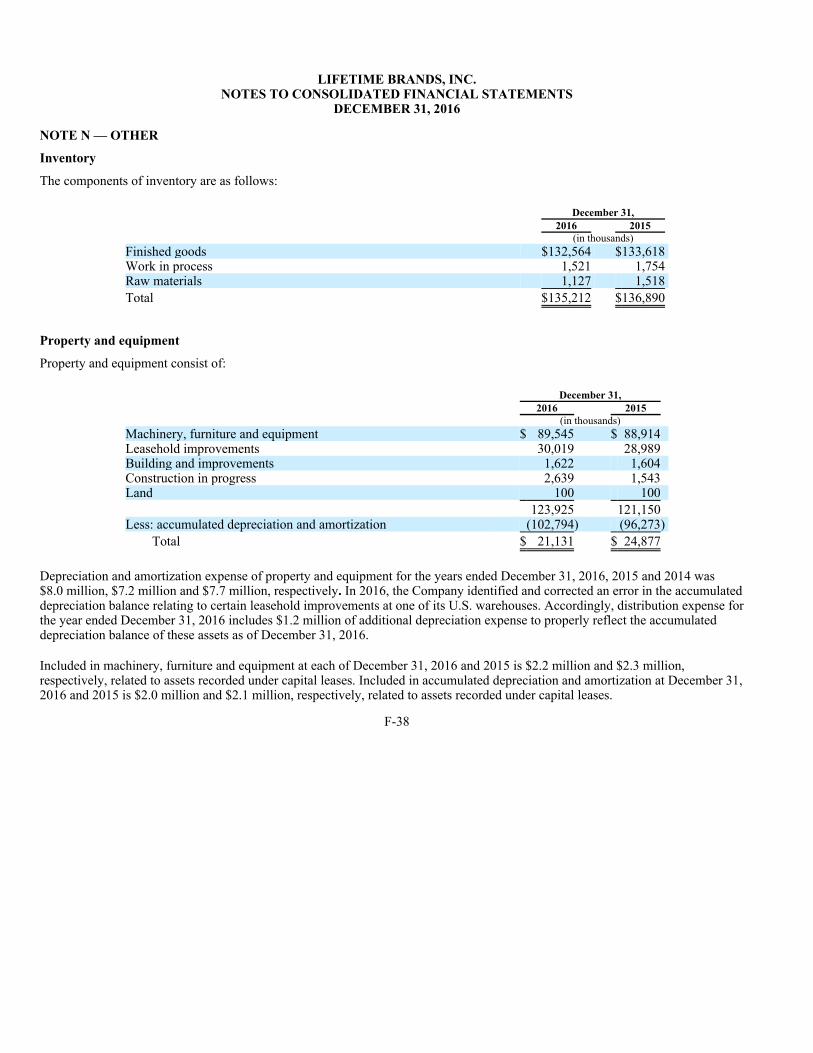
LIFETIME BRANDS, INC. NOTES TO CONSOLIDATED FINANCIAL STATEMENTS
DECEMBER 31, 2016 NOTE N — OTHER
Inventory
The components of inventory are as follows:
Property and equipment
Property and equipment consist of:
Depreciation and amortization expense of property and equipment for the years ended December 31, 2016, 2015 and 2014 was $8.0 million, $7.2 million and $7.7 million, respectively. In 2016, the Company identified and corrected an error in the accumulated depreciation balance relating to certain leasehold improvements at one of its U.S. warehouses. Accordingly, distribution expense for the year ended December 31, 2016 includes $1.2 million of additional depreciation expense to properly reflect the accumulated depreciation balance of these assets as of December 31, 2016.
Included in machinery, furniture and equipment at each of December 31, 2016 and 2015 is $2.2 million and $2.3 million, respectively, related to assets recorded under capital leases. Included in accumulated depreciation and amortization at December 31, 2016 and 2015 is $2.0 million and $2.1 million, respectively, related to assets recorded under capital leases.
F-38
December 31, 2016 2015 (in thousands) Finished goods $132,564 $133,618 Work in process 1,521 1,754 Raw materials 1,127 1,518
Total $135,212 $136,890
December 31, 2016 2015 (in thousands) Machinery, furniture and equipment $ 89,545 $ 88,914 Leasehold improvements 30,019 28,989 Building and improvements 1,622 1,604 Construction in progress 2,639 1,543 Land 100 100
123,925 121,150 Less: accumulated depreciation and amortization (102,794) (96,273)
Total $ 21,131 $ 24,877
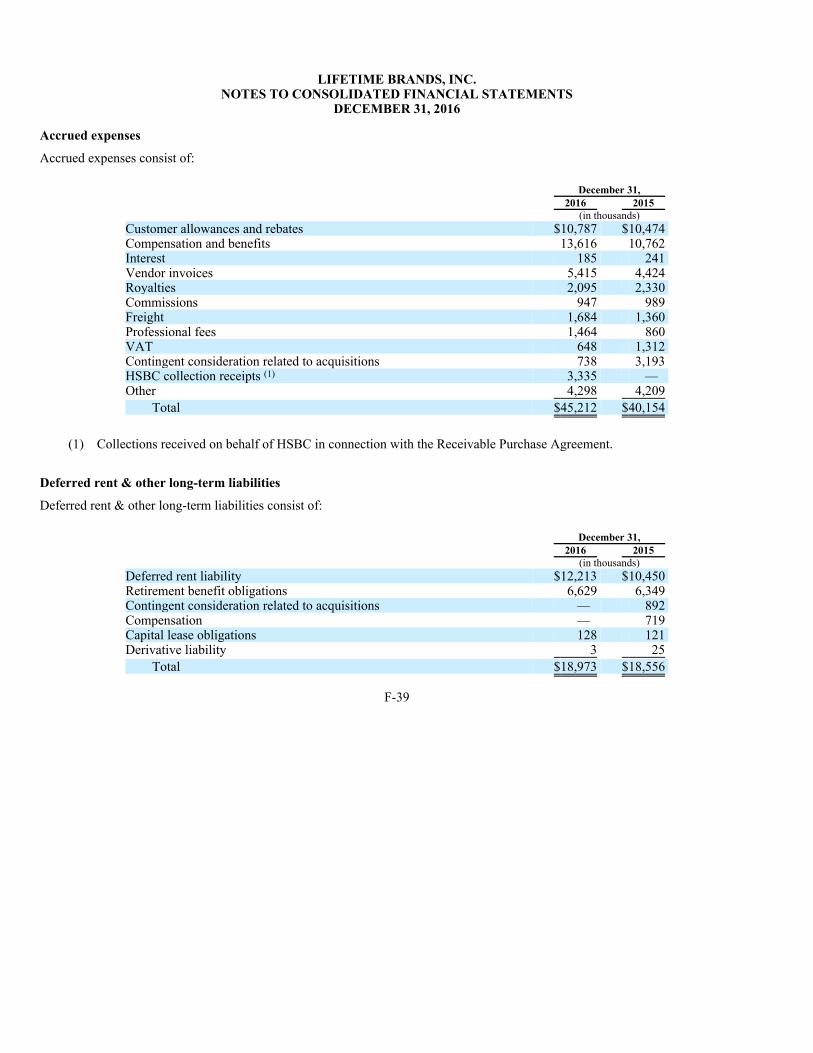
LIFETIME BRANDS, INC. NOTES TO CONSOLIDATED FINANCIAL STATEMENTS
DECEMBER 31, 2016 Accrued expenses
Accrued expenses consist of:
Deferred rent & other long-term liabilities
Deferred rent & other long-term liabilities consist of:
F-39
December 31, 2016 2015 (in thousands) Customer allowances and rebates $10,787 $10,474 Compensation and benefits 13,616 10,762 Interest 185 241 Vendor invoices 5,415 4,424 Royalties 2,095 2,330 Commissions 947 989 Freight 1,684 1,360 Professional fees 1,464 860 VAT 648 1,312 Contingent consideration related to acquisitions 738 3,193 HSBC collection receipts (1) 3,335 — Other 4,298 4,209
Total $45,212 $40,154
(1) Collections received on behalf of HSBC in connection with the Receivable Purchase Agreement.
December 31, 2016 2015 (in thousands) Deferred rent liability $12,213 $10,450 Retirement benefit obligations 6,629 6,349 Contingent consideration related to acquisitions — 892 Compensation — 719 Capital lease obligations 128 121 Derivative liability 3 25
Total $18,973 $18,556
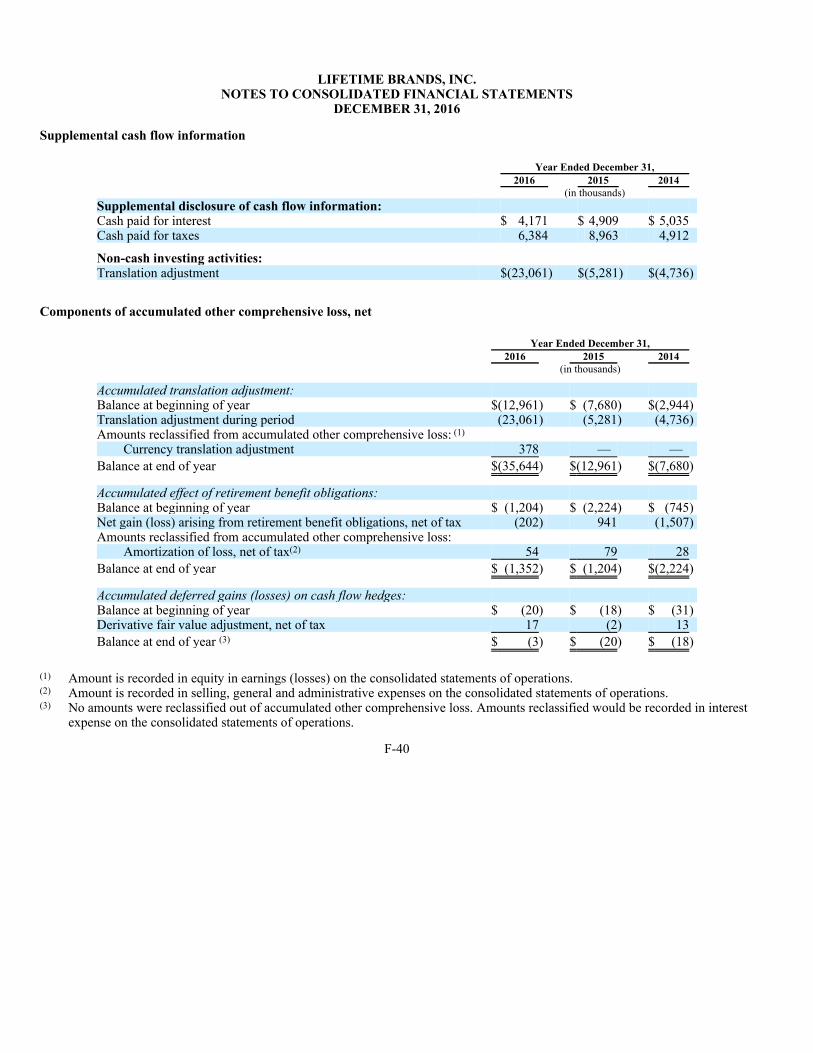
LIFETIME BRANDS, INC. NOTES TO CONSOLIDATED FINANCIAL STATEMENTS
DECEMBER 31, 2016 Supplemental cash flow information
Components of accumulated other comprehensive loss, net
F-40
Year Ended December 31, 2016 2015 2014 (in thousands) Supplemental disclosure of cash flow information: Cash paid for interest $ 4,171 $ 4,909 $ 5,035 Cash paid for taxes 6,384 8,963 4,912
Non-cash investing activities: Translation adjustment $(23,061) $(5,281) $(4,736)
Year Ended December 31, 2016 2015 2014 (in thousands)
Accumulated translation adjustment: Balance at beginning of year $(12,961) $ (7,680) $(2,944) Translation adjustment during period (23,061) (5,281) (4,736) Amounts reclassified from accumulated other comprehensive loss: (1)
Currency translation adjustment 378 — —
Balance at end of year $(35,644) $(12,961) $(7,680)
Accumulated effect of retirement benefit obligations: Balance at beginning of year $ (1,204) $ (2,224) $ (745) Net gain (loss) arising from retirement benefit obligations, net of tax (202) 941 (1,507) Amounts reclassified from accumulated other comprehensive loss:
Amortization of loss, net of tax(2) 54 79 28
Balance at end of year $ (1,352) $ (1,204) $(2,224)
Accumulated deferred gains (losses) on cash flow hedges: Balance at beginning of year $ (20) $ (18) $ (31) Derivative fair value adjustment, net of tax 17 (2) 13
Balance at end of year (3) $ (3) $ (20) $ (18)
(1) Amount is recorded in equity in earnings (losses) on the consolidated statements of operations. (2) Amount is recorded in selling, general and administrative expenses on the consolidated statements of operations. (3) No amounts were reclassified out of accumulated other comprehensive loss. Amounts reclassified would be recorded in interest
expense on the consolidated statements of operations.
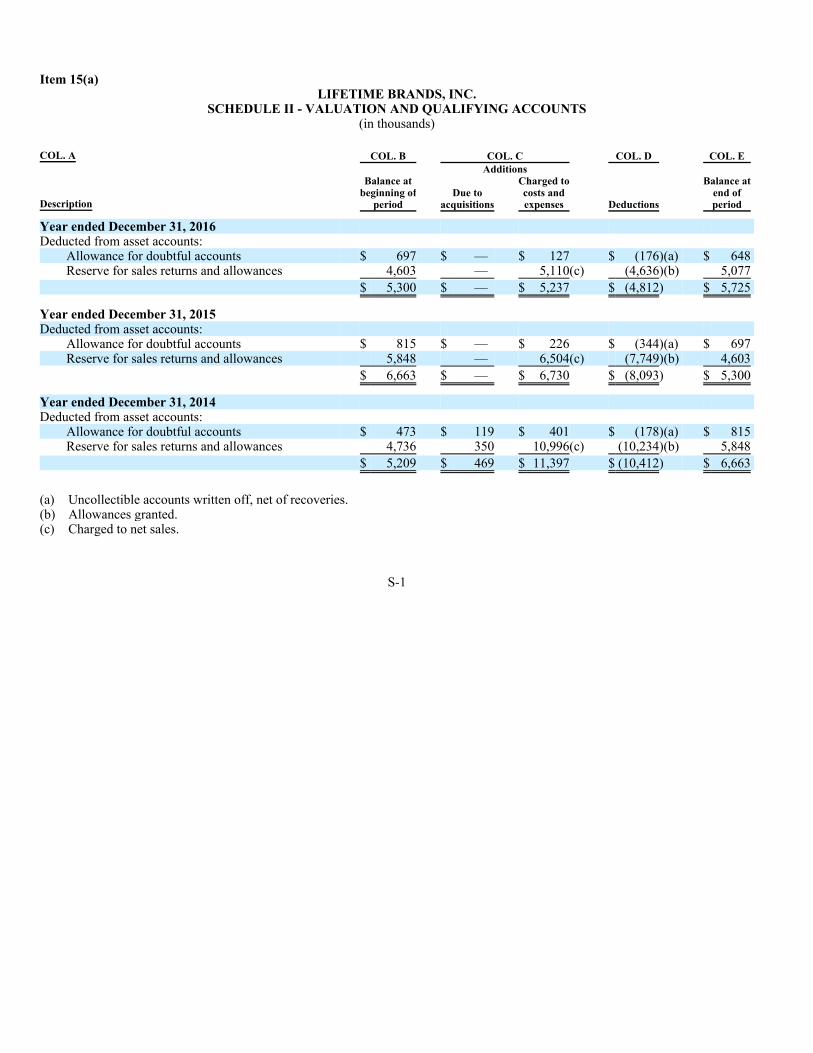
Item 15(a) LIFETIME BRANDS, INC.
SCHEDULE II - VALUATION AND QUALIFYING ACCOUNTS (in thousands)
S-1
COL. A COL. B COL. C COL. D COL. E Additions
Description
Balance atbeginning of
period Due to
acquisitions
Charged tocosts andexpenses Deductions
Balance atend of period
Year ended December 31, 2016 Deducted from asset accounts:
Allowance for doubtful accounts $ 697 $ — $ 127 $ (176)(a) $ 648Reserve for sales returns and allowances 4,603 — 5,110(c) (4,636)(b) 5,077
$ 5,300 $ — $ 5,237 $ (4,812) $ 5,725
Year ended December 31, 2015 Deducted from asset accounts:
Allowance for doubtful accounts $ 815 $ — $ 226 $ (344)(a) $ 697Reserve for sales returns and allowances 5,848 — 6,504(c) (7,749)(b) 4,603
$ 6,663 $ — $ 6,730 $ (8,093) $ 5,300
Year ended December 31, 2014 Deducted from asset accounts:
Allowance for doubtful accounts $ 473 $ 119 $ 401 $ (178)(a) $ 815Reserve for sales returns and allowances 4,736 350 10,996(c) (10,234)(b) 5,848
$ 5,209 $ 469 $ 11,397 $ (10,412) $ 6,663
(a) Uncollectible accounts written off, net of recoveries. (b) Allowances granted. (c) Charged to net sales.

Exhibit 21.1
Subsidiaries of the Registrant
Name of subsidiary State/Country of
Incorporation Ownership
Pfaltzgraff Factory Stores, Inc. Delaware 100% TMC Acquisition Inc. Delaware 100% Wallace Silversmiths de Puerto Rico Ltd. Cayman Islands 100% Lifetime Brands Global Trading (Shanghai) Company Limited China 100% New Goal Development Limited Hong Kong 100% Lifetime Brands UK Limited United Kingdom 100% Creative Tops Limited United Kingdom 100% La Cafetiere (UK) Limited United Kingdom 100% Creative Tops NL B.V. Netherlands 100% Lifetime Brands Holdings Limited United Kingdom 100% Lifetime Brands do Brasil Participacoes Ltda. Brazil 100% Grand Venture Enterprises Limited Hong Kong 100% Lifetime Brands Global Limited Hong Kong 100% Thomas Plant (Birmingham) Holdings Limited United Kingdom 100% Kitchen Craft (Asia) Limited Hong Kong 100% Lifetime Brands (Jersey) Limited Jersey, Channel Islands 100% Lifetime Brands Europe Limited United Kingdom 100% LTB de México, S.A. de C.V. Mexico 99.99%

Exhibit 23.1
CONSENT OF INDEPENDENT REGISTERED PUBLIC ACCOUNTING FIRM
We consent to the incorporation by reference in the Registration Statements on Form S-8 (Nos. 333-105382, 333-146017, 333-162734, 333-186208 and 333-208961) pertaining to the 2000 Long-Term Incentive Plan and the Registration Statement on Form S-3 (No. 333-137575) of Lifetime Brands, Inc. of our reports dated March 16, 2017, with respect to the consolidated financial statements and schedule of Lifetime Brands, Inc., and the effectiveness of internal control over financial reporting of Lifetime Brands, Inc. included in this Annual Report (Form 10-K) for the year ended December 31, 2016. /s/ ERNST & YOUNG LLP
Jericho, New York March 16, 2017

Exhibit 23.2
Consent of Independent Registered Public Accounting Firm
The Board of Directors and Stockholders Grupo Vasconia, S.A.B.
We consent to the incorporation by reference in the registration statements No. 333-105382, 333-146017, 333-162734, 333-186208 and 333-208961 on Forms S-8 and in the registration statement No. 333-137575 on Form S-3 of Lifetime Brands, Inc., of our report dated March 14, 2017, with respect to the consolidated statements of financial position of Grupo Vasconia, S.A.B. and subsidiaries (the “Company”) as of December 31, 2016 and 2015, and the related consolidated statements of comprehensive income, cash flows and changes in stockholders’ equity for each of the years in the three-year period ended December 31, 2016 not included herein, which report appears in the December 31, 2016 annual report on Form 10-K of Lifetime Brands, Inc.
Our report dated March 14, 2017 contains an explanatory paragraph that states that International Financial Reporting Standards as issued by the IASB vary in certain significant respects from generally accepted accounting principles in the United States of America. Information relating to the nature and effect of such differences is presented in note 22 to the consolidated financial statements of the Company. KPMG Cardenas Dosal, S.C.
/s/ Erick G. AguilarErick G. AguilarMexico City, MexicoMarch 15, 2017.
Exhibit 31.1
CERTIFICATION
I, Jeffrey Siegel, certify that:
Date: March 16, 2017
1. I have reviewed this Annual Report on Form 10-K of Lifetime Brands, Inc. (“the registrant”);
2. Based on my knowledge, this Annual Report does not contain any untrue statement of a material fact or omit to state a
material fact necessary to make the statements made, in light of the circumstances under which such statements were made, not misleading with respect to the period covered by this Annual Report;
3. Based on my knowledge, the financial statements, and other financial information included in this Annual Report, fairly
present in all material respects the financial condition, results of operations and cash flows of the registrant as of, and for, the periods presented in this Annual Report;
4. The registrant’s other certifying officers and I are responsible for establishing and maintaining disclosure controls and
procedures (as defined in Exchange Act Rules 13a-15(e) and 15d-15(e) and internal control over financial reporting (as defined in Exchange Act Rules 13a-15(f) and 15d-15(f))) for the registrant and have:
a. designed such disclosure controls and procedures, or caused such disclosure controls and procedures to be designed under our supervision, to ensure that material information relating to the registrant, including its consolidated subsidiaries, is made known to us by others within those entities, particularly during the period in which this Annual Report is being prepared;
b. designed such internal control over financial reporting, or caused such internal control over financial reporting to be designed under our supervision, to provide reasonable assurance regarding the reliability of financial reporting and the preparation of financial statements for external purposes in accordance with generally accepted accounting principles;
c. evaluated the effectiveness of the registrant’s disclosure controls and procedures and presented in this report
our conclusions about the effectiveness of the disclosure controls and procedures, as of the end of the period covered by this report based on such evaluation; and
d. disclosed in this report any change in the registrant’s internal control over financial reporting that occurred
during the registrant’s fourth fiscal quarter that has materially affected or is reasonably likely to materially affect the registrant’s internal control over financial reporting; and
5. The registrant’s other certifying officers and I have disclosed, based on our most recent evaluation of internal control over
financial reporting, to the registrant’s auditors and the audit committee of registrant’s Board of Directors (or persons performing the equivalent functions):
a. all significant deficiencies and material weaknesses in the design or operation of internal control over financial
reporting which are reasonably likely to adversely affect the registrant’s ability to record, process, summarize and report financial information; and
b. any fraud, whether or not material, that involves management or other employees who have a significant role in the registrant’s internal control over financial reporting.
/s/ Jeffrey Siegel Jeffrey SiegelChief Executive Officer and Chairman of the Board of Directors
Exhibit 31.2
CERTIFICATION
I, Laurence Winoker, certify that:
Date: March 16, 2017
1. I have reviewed this Annual Report on Form 10-K of Lifetime Brands, Inc. (“the registrant”);
2. Based on my knowledge, this Annual Report does not contain any untrue statement of a material fact or omit to state a
material fact necessary to make the statements made, in light of the circumstances under which such statements were made, not misleading with respect to the period covered by this Annual Report;
3. Based on my knowledge, the financial statements, and other financial information included in this Annual Report, fairly
present in all material respects the financial condition, results of operations and cash flows of the registrant as of, and for, the periods presented in this Annual Report;
4. The registrant’s other certifying officers and I are responsible for establishing and maintaining disclosure controls and
procedures (as defined in Exchange Act Rules 13a-15(e) and 15d-15(e) and internal control over financial reporting (as defined in Exchange Act Rules 13a-15(f) and 15d-15(f))) for the registrant and have:
a. designed such disclosure controls and procedures, or caused such disclosure controls and procedures to be designed under our supervision, to ensure that material information relating to the registrant, including its consolidated subsidiaries, is made known to us by others within those entities, particularly during the period in which this Annual Report is being prepared;
b. designed such internal control over financial reporting, or caused such internal control over financial reporting to be designed under our supervision, to provide reasonable assurance regarding the reliability of financial reporting and the preparation of financial statements for external purposes in accordance with generally accepted accounting principles;
c. evaluated the effectiveness of the registrant’s disclosure controls and procedures and presented in this report
our conclusions about the effectiveness of the disclosure controls and procedures, as of the end of the period covered by this report based on such evaluation; and
d. disclosed in this report any change in the registrant’s internal control over financial reporting that occurred
during the registrant’s fourth fiscal quarter that has materially affected or is reasonably likely to materially affect the registrant’s internal control over financial reporting; and
5. The registrant’s other certifying officers and I have disclosed, based on our most recent evaluation of internal control over
financial reporting, to the registrant’s auditors and the audit committee of registrant’s Board of Directors (or persons performing the equivalent functions):
a. all significant deficiencies and material weaknesses in the design or operation of internal control over financial
reporting which are reasonably likely to adversely affect the registrant’s ability to record, process, summarize and report financial information; and
b. any fraud, whether or not material, that involves management or other employees who have a significant role in the registrant’s internal control over financial reporting.
/s/ Laurence WinokerLaurence WinokerSenior Vice President – Finance, Treasurer and Chief Financial Officer

Exhibit 32.1
Certification by Jeffrey Siegel, Chief Executive Officer and Chairman of the Board of Directors, and Laurence Winoker, Senior Vice President – Finance, Treasurer and Chief Financial Officer, Pursuant to 18 U.S.C. Section 1350, as Adopted Pursuant to Section 906 of the Sarbanes-Oxley Act of 2002.
I, Jeffrey Siegel, Chief Executive Officer Chairman of the Board of Directors, and I, Laurence Winoker, Senior Vice President – Finance, Treasurer and Chief Financial Officer, of Lifetime Brands, Inc., a Delaware corporation (the “Company”), each hereby certifies that:
A signed original of this written statement required by Section 1350 has been provided to Lifetime Brands, Inc. and will be retained by Lifetime Brands, Inc. and furnished to the SEC or its staff, upon request.
(1) The Company’s Annual Report on Form 10-K for the year ended December 31, 2016 (the “Form 10-K”) fully complies with the requirements of Section 13(a) or 15(d) of the Securities Exchange Act of 1934, as amended; and
(2) The information contained in the Form 10-K fairly presents, in all material respects, the financial condition and results of operations of the Company.
/s/ Jeffrey Siegel /s/ Laurence WinokerJeffrey Siegel Laurence WinokerChief Executive Officer and Chairman of the Board of Directors
Senior Vice President- Finance, Treasurer and Chief Financial Officer
Date: March 16, 2017 Date: March 16, 2017

Exhibit 99.1
Report of Independent Registered Public Accounting Firm
The Board of Directors and Stockholders Grupo Vasconia, S. A. B.
We have audited the consolidated statements of financial position of Grupo Vasconia, S. A. B. and subsidiaries (the “Company”) as of December 31, 2016 and 2015, and the related consolidated statements of comprehensive income, cash flows and changes in stockholders’ equity for each of the years in the three-year period ended December 31, 2016. These consolidated financial statements are the responsibility of the Company’s Management. Our responsibility is to express an opinion on these consolidated financial statements based on our audits.
We conducted our audits in accordance with the standards of the Public Company Accounting Oversight Board (United States). Those standards require that we plan and perform the audit to obtain reasonable assurance about whether the financial statements are free of material misstatement. An audit includes examining, on a test basis, evidence supporting the amounts and disclosures in the financial statements. An audit also includes assessing the accounting principles used and significant estimates made by management, as well as evaluating the overall financial statement presentation. We believe that our audit provides a reasonable basis for our opinion.
In our opinion, the consolidated financial statements referred to above present fairly, in all material respects, the financial position of Grupo Vasconia, S. A. B. and subsidiaries as of December 31, 2016 and 2015, and the results of their operations and their cash flows for each of the years in the three-year period ended December 31, 2016, in conformity with International Financial Reporting Standards as issued by the International Accounting Standards Board (“IASB”).
International Financial Reporting Standards as issued by the IASB vary in certain significant respects from generally accepted accounting principles in the United States of America. Information relating to the nature and effect of such differences is presented in note 22 to the consolidated financial statements. KPMG CARDENAS DOSAL, S. C.
/s/ Erick G. Aguilar
Erick G. Aguilar Mexico City, MexicoMarch 14, 2017.

JEFFREY SIEGEL
Chairman of the Board of Directors
Chief Executive Officer
RONALD SHIFTAN
Vice Chairman of the Board of Directors
Chief Operating Officer
DANIEL SIEGEL
President
LAURENCE WINOKER
Senior Vice President – Finance
Treasurer and Chief Financial Officer
SARA SHINDEL
General Counsel and Secretary
MICHAEL J. JEARY
Director
JOHN KOEGEL
Director
CHERRIE NANNINGA
Director
CRAIG PHILLIPS
Director
DENNIS E. REAVES
Director
MICHAEL J. REGAN
Director
SARA GENSTER ROBLING
Director
WILLIAM U. WESTERFIELD
Director
Corporate Information
CORPORATE COUNSEL
Samuel B. Fortenbaugh III
New York, NY 10111
CODE OF ETHICS
A copy of the Company’s Code of Ethics
will be furnished to any stockholder, without
charge, upon written request to the Senior Vice
President - Finance of the Company.
INDEPENDENT REGISTERED PUBLIC ACCOUNTING FIRM
Ernst & Young LLP
Jericho, NY 11753
TRANSFER AGENT & REGISTRAR
Computershare
c/o Computershare Investor Services
211 Quality Circle
Suite 210
College Station, TX 77845
ANNUAL MEETING
The Annual Meeting of Stockholders will
be held at 10:30 a.m. Eastern Time
on Thursday, June 22, 2017,
at the Corporate Headquarters.
CORPORATE HEADQUARTERS1000 Stewart Avenue
Garden City, NY 11530
(516) 683-6000
Officers and Directors Offices

BUILTFORSUCCESSLifetime Brands Annual Report 2016
Lifetime Brands, Inc. 1000 Stewart Avenue, Garden City, New York 11530 www.lifetimebrands.com
Lifetime B
rands Annual R
eport 2016