LSAY 2009 wave 1 frequencies Web viewAnalysis Variable : ENTUSE ICT internet/entertainment use139....
184
Longitudinal Surveys of Australian Youth (LSAY) 2009 cohort: wave 1 (2009) – frequency tables National Centre for Vocational Education Research The views and opinions expressed in this document are those of the author/project team and do not necessarily reflect the views of the Australian Government OR state and territory governments. LONGITUDINAL SURVEYS OF AUSTRALIAN YOUTH TECHNICAL REPORT 70
Transcript of LSAY 2009 wave 1 frequencies Web viewAnalysis Variable : ENTUSE ICT internet/entertainment use139....

Longitudinal Surveys of Australian Youth (LSAY)
2009 cohort: wave 1 (2009) – frequency tables
National Centre for Vocational Education Research
The views and opinions expressed in this document are those of the author/project
team and do not necessarily reflect the views of the Australian Government OR state and territory governments.
LONGITUDINAL SURVEYS OF AUSTRALIAN YOUTH TECHNICAL REPORT 70

© Commonwealth of Australia, 2012
With the exception of the Commonwealth Coat of Arms, the Department’s logo, any material protected by a trade mark and where otherwise noted all material presented in this document is provided under a Creative Commons Attribution 3.0 Australia <http://creativecommons.org/licenses/by/3.0/au> licence. The details of the relevant licence conditions are available on the Creative Commons website (accessible using the links provided) as is the full legal code for the CC BY 3.0 AU licence <http://creativecommons.org/licenses/by/3.0/legalcode>.
The Creative Commons licence conditions do not apply to all logos, graphic design, artwork and photographs. Requests and enquiries concerning other reproduction and rights should be directed to the National Centre for Vocational Education Research (NCVER).
This document should be attributed as NCVER 2011, Longitudinal Surveys of Australian Youth (LSAY) 2009 cohort: wave 1 (2009) — frequency tables, NCVER, Adelaide.
This work has been produced by NCVER through the Longitudinal Surveys of Australian Youth (LSAY) Program, on behalf of the Australian Government and state and territory governments, with funding provided through the Australian Department of Education, Employment and Workplace Relations. The views and opinions expressed in this document are those of the author and do not necessarily reflect the views of the Australian Government or state and territory governments.
COVER IMAGE: GETTY IMAGES/THINKSTOCK
TD/TNC 109.24
Published by NCVER, ABN 87 007 967 311
Level 11, 33 King William Street, Adelaide, SA 5000PO Box 8288 Station Arcade, Adelaide SA 5000, Australia
P +61 8 8230 8400 F +61 8 8212 3436 E [email protected] W <http://www.ncver.edu.au>

ContentsIdentifying variables 17
State/Territory 17School sector 17Sch Geographic location (3 zones) 17
Section 1: About you 18Grade 18Study Program 18Birth Month 19Birth Year 19Sex 19Indigenous status 19Attend ISCED 0 - Kindergarten/Preschool 20Age at ISCED 1 - Primary school 20Repeat ISCED 1 - Primary school 20Repeat ISCED 2 - Lower secondary (up to and including Yr 10) 20Repeat ISCED 3 - Yr 11 or 12 21
Section 2: Your family and your home 22At Home - Mother 22At Home - Father 22At Home - Brothers 22At Home - Sisters 22At Home - Grandparents 23At Home - Others 23Mother Occupation 23Mother <Highest Schooling> 23Mother ISCED 6 - PhD or equivalent 24Mother ISCED 5A - Uni degree 24Mother ISCED 5B - TAFE Diploma 24Mother ISCED 4 - TAFE Training Certificate 24Mother Current Job Status 24Father Occupation 25Father <Highest Schooling> 25Father ISCED 6 - PhD or equivalent 25Father ISCED 5A - Uni degree 25Father ISCED 5B - TAFE Diploma 26Father ISCED 4 - TAFE Training Certificate 26
NCVER
3

Father Current Job Status 26Country of birth Self 26Country of birth Mother 26Country of birth Father 27Country of Birth National Categories- Father 27Country of Birth National Categories- Mother 28Country of Birth National Categories- Self 28Immigration status 29Immigrant Status (Australian definition) 29Country of birth Age 30Language at home 30English or other language spoken at home 30Language at home (3-digit) 31Possessions desk 31Possessions own room 31Possessions study place 32Possessions computer 32Possessions software 32Possessions Internet 32Possessions literature 32Possessions poetry 33Possessions art 33Possessions textbooks 33Possessions <technical reference books> 33Possessions dictionary 33Possessions dishwasher 34Possessions DVD or VCR player 34Possession Cntry Item 1 - Cable/Pay TV 34Possession Cntry Item 2 - iPhone 34Possession Cntry Item 3 - Plasma or LCD TV 34How many cellular phones 35How many televisions 35How many computers 35How many cars 35How many rooms bath or shower 36How many books at home 36
Section 3: Your reading activities 37Reading Enjoyment Time 37Read Attitude - Only if I have to 37
4 LSAY 2009 cohort: wave 1 (2009) – frequency tables

Read Attitude - Favourite hobbies 37Read Attitude - Talk about books 38Read Attitude - Hard to finish 38Read Attitude - Happy as present 38Read Attitude - Waste of time 38Read Attitude - Enjoy library 39Read Attitude - Need information 39Read Attitude - Cannot sit still 39Read Attitude - Express opinions 39Read Attitude - Exchange 40Like Read - Magazines 40Like Read - Comic Books 40Like Read - Fiction 41Like Read - Non-fiction books 41Like Read - Newspapers 41Online - Reading Emails 42Online - Chat on line 42Online - Reading News 42Online - Using Dictionary 43Online - Particular Topic 43Online - Group Discussions 43Online - Practical Information 44Study - Memorize Everything 44Study - Figure Out 44Study - Memorize Details 44Study - Relate New Information 45Study - Read Many Times 45Study - Check if Understand 45Study - Read Text Repeatedly 45Study - Useful Outside School 46Study - Haven't Understood 46Study - Relate to Experience 46Study - Important Points 46Study - Real Life 47Study - Additional Information 47
Section 4: Learning time 48Min in <class period> for <test lang> 48Analysis Variable : ST28Q01 Min in <class period> for <test lang> 48Min in <class period> for <Maths> 48
NCVER
5

Analysis Variable : ST28Q02 Min in <class period> for <Maths> 48Min in <class period> for <Science> 48Analysis Variable : ST28Q03 Min in <class period> for <Science> 48No of <class period> - <test lang> p/wk 49No of <class period> - <Maths> p/wk 49No of <class period> - <Sci> p/wk 50No of ALL <class period> a week 51<Enrich> in English 52<Enrich> in Maths 52<Enrich> in Science 52<Enrich> in other subjects 52<Remedial> in English 53<Remedial> in Maths 53<Remedial> in Science 53<Remedial> in other subjects 53Lessons to improve study skills 53Out of school lessons <test lang> 54Out of school lessons <maths> 54Out of school lessons <science> 54Out of school lessons other 55
Section 5: Your school 56Climate - Little for Adult Life 56Climate - Waste of Time 56Climate - Given Confidence 56Climate - Useful for Jobs 57Teachers - Get along well 57Teachers - Interested in well-being 57Teachers - Really listen 57Teachers - Extra help 58Teachers - Treat me fairly 58
Section 6: Your English lessons 59Attend language class 59Analysis Variable : ST35Q01 Attend language class 59Lessons - Students don’t listen 59Lessons - Noise and disorder 59Lessons - Wait for quiet 60Lessons - Cannot work well 60Lessons - Long time to start 60Stimulate - Explain text 60
6 LSAY 2009 cohort: wave 1 (2009) – frequency tables

Stimulate - Better understanding 61Stimulate - Time to think 61Stimulate - Recommend books 61Stimulate - Express opinion 61Stimulate - Relate to lives 62Stimulate - Build on knowledge 62Strategies - Explain Expectations 62Strategies - Check Concentrating 62Strategies - Discuss work 63Strategies - Explain judgements 63Strategies - Ask if understood 63Strategies - Mark work 63Strategies - Student questions 64Strategies - Motivating questions 64Strategies - Immediate feedback 64
Section 7: Libraries 65Library - Borrow for pleasure 65Library - Borrow for work 65Library - Work on homework 65Library - Read magazines 66Library - Read for fun 66Library - Learn things 66Library - Use internet 67Library at school 67
Section 8: Your strategies in reading and understanding texts 68Text - Easy to Understand 68Text - Read twice 68Text - Discuss content 69Text - Underline 69Text - Summarise 69Text - Read aloud 70Summary - Check paragraph 70Summary - Copy accurately 70Summary - Read many times 71Summary - Check important facts 71Summary - Write own words 71
Section 9: ICT 72At home - Desktop Computer 72At home - Portable laptop 72
NCVER
7

At home - Internet connection 72At home - Video games console 72At home - Cell Phone 73At home - Mp3/Mp4 Player 73At home - Printer 73At home - USB (memory) stick 73At School - Desktop Computer 74At School - Portable laptop 74At School - Internet connection 74At School - Printer 74At School - USB (memory) stick 75Ever Used Computer 75At Home - One Player Games 75At Home - Collaborative Games 75At Home - Homework 76At Home - Use email 76At Home - Chat on line 76At Home - Browse for fun 76At Home - Download music 77At Home - Website 77At Home - Online forums 77At Home - Internet for School 77At Home - Email students 78At Home - Email teachers 78At Home - Download from school 78At Home - Announcements 78At School - Chat 79At School - Email 79At School - Browse for school 79At School - Download from website 79At School - Post on website 80At School - Simulations 80At School - Practice and Drilling 80At School - Homework 80At School - Group Work 81Time - Language Lessons 81Time - Mathematics Lessons 81Time - Science Lessons 81Time - Other Language Lessons 82
8 LSAY 2009 cohort: wave 1 (2009) – frequency tables

How well - Edit graphics 82How well - Create database 82How well - Plot Graph 82How well - Presentation 83How well - Multi Media 83Time outside lessons 83Attitudes - Very Important 84Attitudes - Really Fun 84Attitudes - Very Interested 84Attitudes - Lose track of time 84
Section 10: Educational career 85Miss 2 months of <ISCED 1> 85Miss 2 months of <ISCED 2> 85Change schools in <ISCED1> 85Change schools in <ISCED2> 85Expected completed levels <ISCED level 2 86Expected completed levels <ISCED level 3B or C 86Expected completed levels <ISCED level 3A 86Expected completed levels <ISCED level 4 86Expected completed levels <ISCED level 5B 86Expected completed levels <ISCED level 5A or 6 87Enrichment in <test language> 87Remedial in <test language> 87One to one private tutoring 87Report Mark 87
Reading for school 88Reading Texts - Information 88Reading Texts - Poetry 88Reading Texts - Diagrams 88Reading Texts - Fiction 89Reading Texts - Newspapers 89Reading Texts - Manuals 89Reading Texts - Tables 89Reading Texts - Advertising 90Reading Tasks - Find information 90Reading Tasks - Explain cause 90Reading Tasks - Explain behaviour 90Reading Tasks - Learn about writer 91Reading Tasks - Explain purpose 91
NCVER
9

Reading Tasks - Memorise text 91Reading Tasks - Learn history 91Reading Tasks - Describe table 92Reading Tasks - Explain connection 92
Section 11: Time spent learning 93Time learn - science 93Time learn - maths 93Time learn - other 93
Section 12: Out-of-school activities 94OutSch - Work paid job 94Analysis Variable : ST61N01 OutSch - Work paid job 94OutSch - Watch TV 94Analysis Variable : ST61N02 OutSch - Watch TV 94OutSch - Listen music 94Analysis Variable : ST61N03 OutSch - Listen music 94OutSch - Play sport 95Analysis Variable : ST61N04 OutSch - Play sport 95OutSch - Read pleasure 95Analysis Variable : ST61N05 OutSch - Read pleasure 95OutSch - Unpaid/voluntary work 95Analysis Variable : ST61N06 OutSch - Unpaid/voluntary work 95OutSch - Using internet pleasure 95Analysis Variable : ST61N07 OutSch - Using internet pleasure 96
Section 13: Your life at school 97How well doing - English 97How well doing - Maths 97How well doing - Science 97How well doing - Subjects overall 98Sch - work interesting 98Sch - teacher fair and just 98Sch - things learn are important 99Sch - learnt to work hard 99Sch - feel happy 99Sch - teacher listen to students 99Sch - satisfactory standard in work 100Sch - like learning 100Sch - get enjoyment 100Sch - work I do is good preparation 100Sch - like asking questions in class 101
10 LSAY 2009 cohort: wave 1 (2009) – frequency tables

Sch - teacher give marks I deserve 101Sch - acquired skills that will be of use 101Sch - always achieve satisfactory standard 101Sch - like extra work 102Sch - teachers take interest 102Sch - like to go each day 102Sch - enjoy what I do in class 102Sch - always try best 103Sch - things learn help in adult life 103Sch - cope with work 103Sch - teacher help do best 103Sch - excited about work I do 104Sch - learning in fun 104Sch - given chance to do interesting work 104Sch - know can do well to be successful 104Sch - things taught worth learning 105Sch - feel safe and secure 105Sch - teachers treat fairly 105Sch - success as student 105Plan to complete Year 12 106
Section 14: Study plans after school 107Plans after sch - Your plans 107Plans after sch - Your parents 108Plans after sch - Friends plans 108Further plans after leave school 109
Section 15: Your views on science 110Views on sci - study at sec sch 110Views on sci - study after sec sch 110Views on sci - work in career 110
Section 17: Work 111ANZSCO code - Occupation at 30 years old 111Job - current part-time/casual 111Job - Mon to Fri hours 111Analysis Variable : ST71N01 Job - Mon to Fri hours 111Job - Sat and Sun hours 111Analysis Variable : ST71N02 Job - Sat and Sun hours 112Job - pay (dollars) 112Analysis Variable : ST72N01 Job - pay (dollars) 112Job - pay (cents) 112
NCVER
11

Analysis Variable : ST72N02 Job - pay (cents) 112Job - pay (frequency) 112ANZSCO code - part-time or casual job 113Reasons - work I want to do 113Reasons - enjoy the work 113Reasons - family needs money 114Reasons - sense of independence 114Reasons - help me get a job 114Reasons - family business 115Reasons - need money 115Reasons - own spending money 115Reasons - counts towards sch certificate 116
Section 18: Work experience 117Work experience 117Work experience - days 117Analysis Variable : ST76N01 Work experience - days 117Work experience - what work is like 117Work experience - getting along with others 118Work experience - Follow instructions 118Work experience - thinking for yourself 118Work experience - being confident 119Work experience - kind of skills needed for job 119Work experience - working conditions 119Work experience - career after school 120
Section 19: Courses at school 121IB 121VET - this year 121VET - apprenticeship/traineeship 121VET - don't spend any time 121VET - will spend time 122VET - will spend time (days) 122Analysis Variable : ST81N03 VET - will spend time (days) 122VET - I have spent time 122VET - have spent (days) 122Analysis Variable : ST81N05 VET - have spent (days) 123VET - what work is like 123VET - getting along with other 123VET - following instructions 123VET - thinking for yourself 124
12 LSAY 2009 cohort: wave 1 (2009) – frequency tables

VET - being confident 124VET - kind of skills needed for job 124VET - working conditions 125VET - career after school 125TAFE - this year 125TAFE - apprenticeship/traineehsip 125TAFE - don't spend any time 126TAFE - will spend time 126TAFE - will spend time (days) 126Analysis Variable : ST85N03 TAFE - will spend time (days) 126TAFE - I have spent time 126TAFE - have spent (days) 127Analysis Variable : ST85N05 TAFE - have spent (days) 127TAFE - what work is like 127TAFE - getting along with other 127TAFE - following instructions 128TAFE - thinking for yourself 128TAFE - Being confident 128TAFE - kind of skills needed for job 129TAFE - working conditions 129TAFE - career after school 129
Student-level simple indices 130Age of student 130Father SQ ISEI 130Analysis Variable : BFMJ Father SQ ISEI 130Mother SQ ISEI 130Analysis Variable : BMMJ Mother SQ ISEI 131Family Structure 131Educational level of father (ISCED) 131Educational level of mother (ISCED) 131Highest educational level of parents 132Father White collar/Blue collar classification 132Mother White collar/Blue collar classification 132Highest parent White collar/Blue collar classification 133Highest parental occupational status 133Analysis Variable : HISEI Highest parental occupational status 133ISCED designation 133ISCED level 133ISCED orientation 134
NCVER
13
Learning time (minutes per week) - Test Language 134Analysis Variable : LMINS Learning time (minutes per week) - Test Language134Learning time (minutes per week) - Mathematics 134Analysis Variable : MMINS Learning time (minutes per week) - Mathematics134Learning time (minutes per week) - Science 134Analysis Variable : SMINS Learning time (minutes per week) - Science 135
Student-level scale indices 136Meta-cognition: Summarising 136Analysis Variable : METASUM Meta-cognition: Summarising 136Meta-cognition: Understanding and Remembering 136Analysis Variable : UNDREM Meta-cognition: Understanding and Remembering 136Highest parental education in years 136Attitude towards computers 137Analysis Variable : ATTCOMP Attitude towards computers 137Attitude towards school 137Analysis Variable : ATSCHL Attitude towards school 137Use of control strategies 137Analysis Variable : CSTRAT Use of control strategies 137Cultural Possessions 137Analysis Variable : CULTPOSS Cultural Possessions 138Disciplinary climate 138Analysis Variable : DISCLIMA Disciplinary climate 138Diveristy reading 138Analysis Variable : DIVREAD Diveristy reading 138Use of elaboration strategies 138Analysis Variable : ELAB Use of elaboration strategies 138ICT internet/entertainment use 139Analysis Variable : ENTUSE ICT internet/entertainment use 139Index of economic, social and cultural status (WLE) 139Analysis Variable : ESCS Index of economic, social and cultural status (WLE)139Home educational resources 139Analysis Variable : HEDRES Home educational resources 139Self-confidence in ICT high level tasks 139Analysis Variable : HIGHCONF Self-confidence in ICT high level tasks 140Home Possessions 140Analysis Variable : HOMEPOS Home Possessions 140ICT for school related tasks 140Analysis Variable : HOMSCH ICT for school related tasks 140ICT availability at home 140
14 LSAY 2009 cohort: wave 1 (2009) – frequency tables
Analysis Variable : ICTHOME ICT availability at home 140ICT resources 141Analysis Variable : ICTRES ICT resources 141ICT availability at school 141Analysis Variable : ICTSCH ICT availability at school 141Joy/Like Reading 141Analysis Variable : JOYREAD Joy/Like Reading 141Use of Libraries 141Analysis Variable : LIBUSE Use of Libraries 142Use of memorisation strategies 142Analysis Variable : MEMOR Use of memorisation strategies 142Online Reading 142Analysis Variable : ONLNREAD Online Reading 142Teachers Stimulation of Reading Engagement 142Analysis Variable : STIMREAD Teachers Stimulation of Reading Engagement142Use of structuring and scaffolding strategies 143Analysis Variable : STRSTRAT Use of structuring and scaffolding strategies 143Teacher student Relations 143Analysis Variable : STUDREL Teacher student Relations 143Use of ICT at school 143Analysis Variable : USESCH Use of ICT at school 143Wealth 143Analysis Variable : WEALTH Wealth 144Reading for School: Interpretation of literary texts 144Analysis Variable : RFSINTRP Reading for School: Interpretation of literary texts 144Reading for School: Non-continuous materials 144Analysis Variable : RFSNCONT Reading for School: Non-continuous materials144Reading for School: Traditional literature courses 144Analysis Variable : RFSTRLIT Reading for School: Traditional literature courses144Reading for School: Functional reading materials 145Analysis Variable : RFSFUMAT Reading for School: Functional reading materials 145
PISA assessment results 146Analysis Variable : PV1MATH Plausible value in math 146Analysis Variable : PV2MATH Plausible value in math 146Analysis Variable : PV3MATH Plausible value in math 146Analysis Variable : PV4MATH Plausible value in math 146Analysis Variable : PV5MATH Plausible value in math 146Analysis Variable : PV1READ Plausible value in reading 146Analysis Variable : PV2READ Plausible value in reading 146
NCVER
15

Analysis Variable : PV3READ Plausible value in reading 146Analysis Variable : PV4READ Plausible value in reading 147Analysis Variable : PV5READ Plausible value in reading 147Analysis Variable : PV1SCIE Plausible value in science 147Analysis Variable : PV2SCIE Plausible value in science 147Analysis Variable : PV3SCIE Plausible value in science 147Analysis Variable : PV4SCIE Plausible value in science 147Analysis Variable : PV5SCIE Plausible value in science 147Analysis Variable : PV1READ1 Plausible value in reading - access and retrieve147Analysis Variable : PV2READ1 Plausible value in reading - access and retrieve148Analysis Variable : PV3READ1 Plausible value in reading - access and retrieve148Analysis Variable : PV4READ1 Plausible value in reading - access and retrieve148Analysis Variable : PV5READ1 Plausible value in reading - access and retrieve148Analysis Variable : PV1READ2 Plausible value in reading - integrate and interpret 148Analysis Variable : PV2READ2 Plausible value in reading - integrate and interpret 148Analysis Variable : PV3READ2 Plausible value in reading - integrate and interpret 148Analysis Variable : PV4READ2 Plausible value in reading - integrate and interpret 148Analysis Variable : PV5READ2 Plausible value in reading - integrate and interpret 149Analysis Variable : PV1READ3 Plausible value in reading - reflect and evaluate149Analysis Variable : PV2READ3 Plausible value in reading - reflect and evaluate149Analysis Variable : PV3READ3 Plausible value in reading - reflect and evaluate149Analysis Variable : PV4READ3 Plausible value in reading - reflect and evaluate149Analysis Variable : PV5READ3 Plausible value in reading - reflect and evaluate149Analysis Variable : PV1READ4 Plausible value in reading - continuous text 149Analysis Variable : PV2READ4 Plausible value in reading - continuous text 149Analysis Variable : PV3READ4 Plausible value in reading - continuous text 150Analysis Variable : PV4READ4 Plausible value in reading - continuous text 150Analysis Variable : PV5READ4 Plausible value in reading - continuous text 150Analysis Variable : PV1READ5 Plausible value in reading - non-continuous text150Analysis Variable : PV2READ5 Plausible value in reading - non-continuous text150Analysis Variable : PV3READ5 Plausible value in reading - non-continuous text150Analysis Variable : PV4READ5 Plausible value in reading - non-continuous text150Analysis Variable : PV5READ5 Plausible value in reading - non-continuous text151
16 LSAY 2009 cohort: wave 1 (2009) – frequency tables

Identifying variables State/Territory
STATE Frequency PercentCumulativeFrequency
CumulativePercent
1 ACT 1036 7.27 1036 7.27
2 NSW 3313 23.25 4349 30.52
3 VIC 2296 16.11 6645 46.63
4 QLD 2531 17.76 9176 64.39
5 SA 1524 10.69 10700 75.08
6 WA 1486 10.43 12186 85.51
7 TAS 1277 8.96 13463 94.47
8 NT 788 5.53 14251 100.00
School sector
SECTOR Frequency PercentCumulativeFrequency
CumulativePercent
1 Catholic 3098 21.74 3098 21.74
2 Government 8715 61.15 11813 82.89
3 Independent 2438 17.11 14251 100.00
Sch Geographic location (3 zones)
GEOLOC Frequency PercentCumulativeFrequency
CumulativePercent
1 Metropolitan 9890 69.40 9890 69.40
2 Provincial 3908 27.42 13798 96.82
3 Remote 453 3.18 14251 100.00
NCVER
17

Section 1: About youGrade
ST01Q01 Frequency PercentCumulativeFrequency
CumulativePercent
7 1 0.01 1 0.01
8 14 0.10 15 0.11
9 1602 11.24 1617 11.35
10 10163 71.31 11780 82.66
11 2461 17.27 14241 99.93
12 10 0.07 14251 100.00
Study Program
ST02Q01 Frequency PercentCumulativeFrequency
CumulativePercent
. 458 3.21 458 3.21
1 Yr 10 or below in a general academic program 10448 73.31 10906 76.53
2 Yr 10 or below in a general academic program with some VET subjects
957 6.72 11863 83.24
3 Yr 11 or 12 in a general academic program 1524 10.69 13387 93.94
4 Year 11 or 12 in a general academic program with some VET subjects
761 5.34 14148 99.28
5 Year 11 or 12 in a VET course 103 0.72 14251 100.00
18 LSAY 2009 cohort: wave 1 (2009) – frequency tables

Birth Month
ST03Q02 Frequency PercentCumulativeFrequency
CumulativePercent
01 1236 8.67 1236 8.67
02 1149 8.06 2385 16.74
03 1394 9.78 3779 26.52
04 1220 8.56 4999 35.08
05 1063 7.46 6062 42.54
06 1105 7.75 7167 50.29
07 1138 7.99 8305 58.28
08 1233 8.65 9538 66.93
09 1219 8.55 10757 75.48
10 1201 8.43 11958 83.91
11 1116 7.83 13074 91.74
12 1177 8.26 14251 100.00
Birth Year
ST03Q03 Frequency PercentCumulativeFrequency
CumulativePercent
1993 9252 64.92 9252 64.92
1994 4999 35.08 14251 100.00
Sex
ST04Q01 Frequency PercentCumulativeFrequency
CumulativePercent
1 Female 7231 50.74 7231 50.74
2 Male 7020 49.26 14251 100.00
Indigenous status
INDIG Frequency PercentCumulativeFrequency
CumulativePercent
0 Non-Indigenous student 13108 91.98 13108 91.98
1 Indigenous student 1143 8.02 14251 100.00
NCVER
19

Attend ISCED 0 - Kindergarten/Preschool
ST05Q01 Frequency PercentCumulativeFrequency
CumulativePercent
. 294 2.06 294 2.06
1 No 621 4.36 915 6.42
2 Yes, one year or less 6851 48.07 7766 54.49
3 Yes, more than one year 6485 45.51 14251 100.00
Age at ISCED 1 - Primary school
ST06Q01 Frequency PercentCumulativeFrequency
CumulativePercent
. 911 6.39 911 6.39
4 1722 12.08 2633 18.48
5 7738 54.30 10371 72.77
6 3344 23.47 13715 96.24
7 435 3.05 14150 99.29
8 101 0.71 14251 100.00
Repeat ISCED 1 - Primary school
ST07Q01 Frequency PercentCumulativeFrequency
CumulativePercent
. 336 2.36 336 2.36
1 No, never 12828 90.01 13164 92.37
2 Yes, once 1043 7.32 14207 99.69
3 Yes, twice or more 44 0.31 14251 100.00
Repeat ISCED 2 - Lower secondary (up to and including Yr 10)
ST07Q02 Frequency PercentCumulativeFrequency
CumulativePercent
. 1120 7.86 1120 7.86
1 No, never 12938 90.79 14058 98.65
2 Yes, once 174 1.22 14232 99.87
3 Yes, twice or more 19 0.13 14251 100.00
20 LSAY 2009 cohort: wave 1 (2009) – frequency tables

Repeat ISCED 3 - Yr 11 or 12
ST07Q03 Frequency PercentCumulativeFrequency
CumulativePercent
. 2919 20.48 2919 20.48
1 No, never 11309 79.36 14228 99.84
2 Yes, once 13 0.09 14241 99.93
3 Yes, twice or more 10 0.07 14251 100.00
NCVER
21

Section 2: Your family and your home
At Home - Mother
ST08Q01 Frequency PercentCumulativeFrequency
CumulativePercent
. 512 3.59 512 3.59
1 Yes 13221 92.77 13733 96.37
2 No 518 3.63 14251 100.00
At Home - Father
ST08Q02 Frequency PercentCumulativeFrequency
CumulativePercent
. 1066 7.48 1066 7.48
1 Yes 11447 80.32 12513 87.80
2 No 1738 12.20 14251 100.00
At Home - Brothers
ST08Q03 Frequency PercentCumulativeFrequency
CumulativePercent
. 2238 15.70 2238 15.70
1 Yes 8001 56.14 10239 71.85
2 No 4012 28.15 14251 100.00
At Home - Sisters
ST08Q04 Frequency PercentCumulativeFrequency
CumulativePercent
. 2496 17.51 2496 17.51
1 Yes 7530 52.84 10026 70.35
2 No 4225 29.65 14251 100.00
22 LSAY 2009 cohort: wave 1 (2009) – frequency tables

At Home - Grandparents
ST08Q05 Frequency PercentCumulativeFrequency
CumulativePercent
. 4752 33.35 4752 33.35
1 Yes 740 5.19 5492 38.54
2 No 8759 61.46 14251 100.00
At Home - Others
ST08Q06 Frequency PercentCumulativeFrequency
CumulativePercent
. 4697 32.96 4697 32.96
1 Yes 891 6.25 5588 39.21
2 No 8663 60.79 14251 100.00
Mother Occupation
ST09Q01 Frequency PercentCumulativeFrequency
CumulativePercent
1000 - 9996 4 digit ISCO code 13404 94.06 13404 94.06
9997 N/A 25 0.18 13429 94.23
9999 Miss 822 5.77 14251 100.00
Mother <Highest Schooling>
ST10Q01 Frequency PercentCumulativeFrequency
CumulativePercent
. 905 6.35 905 6.35
1 ISCED 3A completed Yr 12 7783 54.61 8688 60.96
2 ISCED 3B, 3C - completed Yr 10 or 11 4567 32.05 13255 93.01
3 ISCED 2 - completed some secondary but didn't complete Yr 10
827 5.80 14082 98.81
4 ISCED 1 - completed primary school only 93 0.65 14175 99.47
5 Didn't complete ISCED 1 - primary school 76 0.53 14251 100.00
NCVER
23

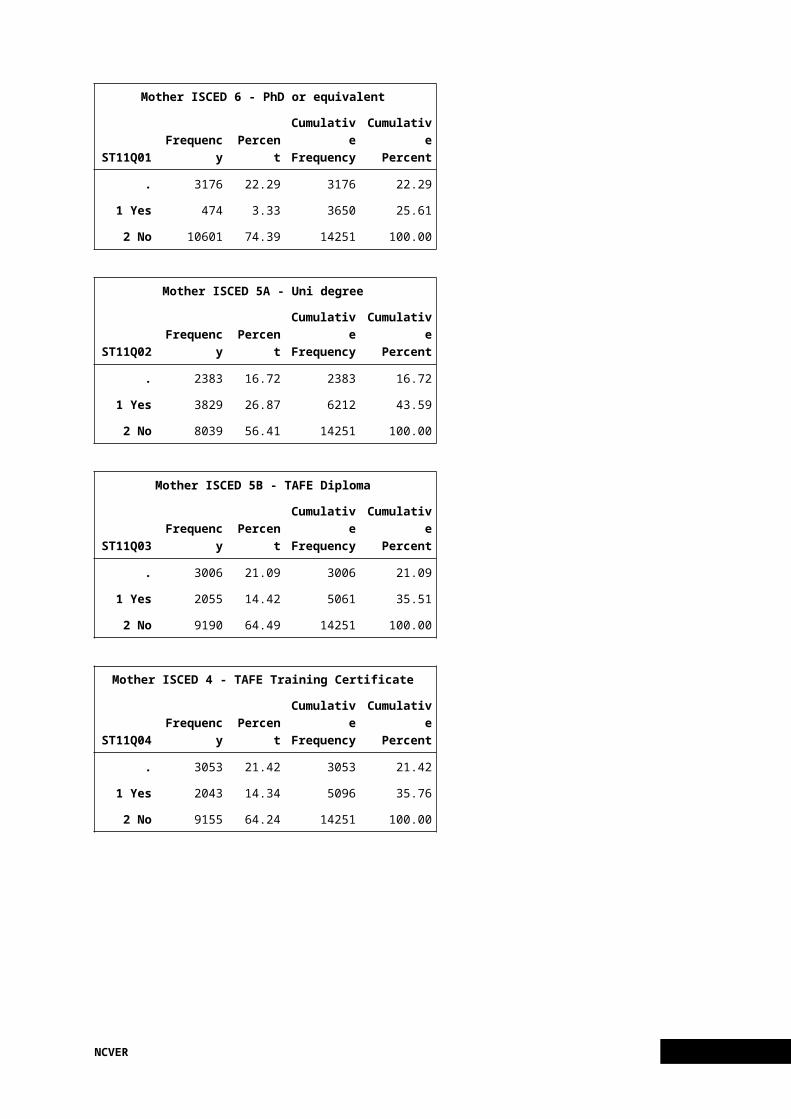
Mother ISCED 6 - PhD or equivalent
ST11Q01 Frequency PercentCumulativeFrequency
CumulativePercent
. 3176 22.29 3176 22.29
1 Yes 474 3.33 3650 25.61
2 No 10601 74.39 14251 100.00
Mother ISCED 5A - Uni degree
ST11Q02 Frequency PercentCumulativeFrequency
CumulativePercent
. 2383 16.72 2383 16.72
1 Yes 3829 26.87 6212 43.59
2 No 8039 56.41 14251 100.00
Mother ISCED 5B - TAFE Diploma
ST11Q03 Frequency PercentCumulativeFrequency
CumulativePercent
. 3006 21.09 3006 21.09
1 Yes 2055 14.42 5061 35.51
2 No 9190 64.49 14251 100.00
Mother ISCED 4 - TAFE Training Certificate
ST11Q04 Frequency PercentCumulativeFrequency
CumulativePercent
. 3053 21.42 3053 21.42
1 Yes 2043 14.34 5096 35.76
2 No 9155 64.24 14251 100.00
Mother Current Job Status
ST12Q01 Frequency PercentCumulativeFrequency
CumulativePercent
. 641 4.50 641 4.50
1 Working Full-time 6942 48.71 7583 53.21
2 Working Part-Time 3377 23.70 10960 76.91
3 Looking for work 528 3.71 11488 80.61
4 Other 2763 19.39 14251 100.00
24 LSAY 2009 cohort: wave 1 (2009) – frequency tables
Father Occupation
ST13Q01 Frequency PercentCumulativeFrequency
CumulativePercent
1000 - 9996 4 digit ISCO code 13202 92.64 13202 92.64
9997 N/A 58 0.41 13260 93.05
9999 Miss 991 6.95 14251 100.00
Father <Highest Schooling>
ST14Q01 Frequency PercentCumulativeFrequency
CumulativePercent
. 1456 10.22 1456 10.22
1 ISCED 3A completed Yr 12 6808 47.77 8264 57.99
2 ISCED 3B, 3C - completed Yr 10 or 11 4673 32.79 12937 90.78
3 ISCED 2 - completed some secondary but didn't complete Yr 10
1128 7.92 14065 98.69
4 ISCED 1 - completed primary school only 120 0.84 14185 99.54
5 Didn't complete ISCED 1 - primary school 66 0.46 14251 100.00
Father ISCED 6 - PhD or equivalent
ST15Q01 Frequency PercentCumulativeFrequency
CumulativePercent
. 3923 27.53 3923 27.53
1 Yes 538 3.78 4461 31.30
2 No 9790 68.70 14251 100.00
Father ISCED 5A - Uni degree
ST15Q02 Frequency PercentCumulativeFrequency
CumulativePercent
. 3140 22.03 3140 22.03
1 Yes 3604 25.29 6744 47.32
2 No 7507 52.68 14251 100.00
NCVER
25

Father ISCED 5B - TAFE Diploma
ST15Q03 Frequency PercentCumulativeFrequency
CumulativePercent
. 3815 26.77 3815 26.77
1 Yes 1671 11.73 5486 38.50
2 No 8765 61.50 14251 100.00
Father ISCED 4 - TAFE Training Certificate
ST15Q04 Frequency PercentCumulativeFrequency
CumulativePercent
. 3602 25.28 3602 25.28
1 Yes 2812 19.73 6414 45.01
2 No 7837 54.99 14251 100.00
Father Current Job Status
ST16Q01 Frequency PercentCumulativeFrequency
CumulativePercent
. 1034 7.26 1034 7.26
1 Working Full-time 11009 77.25 12043 84.51
2 Working Part-Time 876 6.15 12919 90.65
3 Looking for work 428 3.00 13347 93.66
4 Other 904 6.34 14251 100.00
Country of birth Self
ST17Q01 Frequency PercentCumulativeFrequency
CumulativePercent
. 244 1.71 244 1.71
1 Country of test 12426 87.19 12670 88.91
2 Other country 1581 11.09 14251 100.00
Country of birth Mother
ST17Q02 Frequency PercentCumulativeFrequency
CumulativePercent
. 262 1.84 262 1.84
1 Country of test 9884 69.36 10146 71.20
2 Other country 4105 28.80 14251 100.00
26 LSAY 2009 cohort: wave 1 (2009) – frequency tables

Country of birth Father
ST17Q03 Frequency PercentCumulativeFrequency
CumulativePercent
. 416 2.92 416 2.92
1 Country of test 9737 68.33 10153 71.24
2 Other country 4098 28.76 14251 100.00
Country of Birth National Categories- Father
COBN_F Frequency PercentCumulativeFrequency
CumulativePercent
003600 Australia 9731 68.28 9731 68.28
015600 China 140 0.98 9871 69.27
034400 Hong Kong-China 71 0.50 9942 69.76
035600 India 118 0.83 10060 70.59
041000 Republic of Korea 64 0.45 10124 71.04
055400 New Zealand 430 3.02 10554 74.06
060800 Philippines 93 0.65 10647 74.71
071000 South Africa 139 0.98 10786 75.69
082611 United Kingdom (England) 859 6.03 11645 81.71
084000 United States of America 102 0.72 11747 82.43
903600 Another country (AUS) 1226 8.60 12973 91.03
999997 N/A 146 1.02 13119 92.06
999998 Invalid 21 0.15 13140 92.20
999999 Missing 1111 7.80 14251 100.00
NCVER
27

Country of Birth National Categories- Mother
COBN_M Frequency PercentCumulativeFrequency
CumulativePercent
003600 Australia 9880 69.33 9880 69.33
015600 China 159 1.12 10039 70.44
034400 Hong Kong-China 71 0.50 10110 70.94
035600 India 112 0.79 10222 71.73
041000 Republic of Korea 67 0.47 10289 72.20
055400 New Zealand 430 3.02 10719 75.22
060800 Philippines 197 1.38 10916 76.60
071000 South Africa 147 1.03 11063 77.63
082611 United Kingdom (England) 813 5.70 11876 83.33
084000 United States of America 86 0.60 11962 83.94
903600 Another country (AUS) 1175 8.25 13137 92.18
999997 N/A 146 1.02 13283 93.21
999998 Invalid 16 0.11 13299 93.32
999999 Missing 952 6.68 14251 100.00
Country of Birth National Categories- Self
COBN_S Frequency PercentCumulativeFrequency
CumulativePercent
003600 Australia 12415 87.12 12415 87.12
015600 China 61 0.43 12476 87.54
034400 Hong Kong-China 37 0.26 12513 87.80
035600 India 62 0.44 12575 88.24
041000 Republic of Korea 60 0.42 12635 88.66
055400 New Zealand 207 1.45 12842 90.11
060800 Philippines 71 0.50 12913 90.61
071000 South Africa 115 0.81 13028 91.42
082611 United Kingdom (England) 216 1.52 13244 92.93
084000 United States of America 66 0.46 13310 93.40
903600 Another country (AUS) 385 2.70 13695 96.10
999997 N/A 146 1.02 13841 97.12
999998 Invalid 11 0.08 13852 97.20
999999 Missing 399 2.80 14251 100.00
28 LSAY 2009 cohort: wave 1 (2009) – frequency tables

Immigration status
IMMIG Frequency PercentCumulativeFrequency
CumulativePercent
. 296 2.08 296 2.08
1 Native 11183 78.47 11479 80.55
2 Second-Generation 1429 10.03 12908 90.58
3 First-Generation 1343 9.42 14251 100.00
Immigrant Status (Australian definition)
AUSIMMIG Frequency PercentCumulativeFrequency
CumulativePercent
. 387 2.72 387 2.72
1 Australian-born stds (stds born in Aust with both parents born in Aust)
8396 58.92 8783 61.63
2 First-generation stds (stds born in Australia with at least one parent born overseas)
4103 28.79 12886 90.42
3 Foreign-born stds(stds born overseas with both parents also born overseas)
1365 9.58 14251 100.00
NCVER
29

Country of birth Age
ST18Q01 Frequency PercentCumulativeFrequency
CumulativePercent
. 12708 89.17 12708 89.17
0 107 0.75 12815 89.92
1 83 0.58 12898 90.51
2 111 0.78 13009 91.28
3 103 0.72 13112 92.01
4 74 0.52 13186 92.53
5 76 0.53 13262 93.06
6 71 0.50 13333 93.56
7 81 0.57 13414 94.13
8 78 0.55 13492 94.67
9 68 0.48 13560 95.15
10 91 0.64 13651 95.79
11 87 0.61 13738 96.40
12 129 0.91 13867 97.31
13 139 0.98 14006 98.28
14 147 1.03 14153 99.31
15 94 0.66 14247 99.97
16 4 0.03 14251 100.00
Language at home
ST19Q01 Frequency PercentCumulativeFrequency
CumulativePercent
. 371 2.60 371 2.60
1 Language of test 12756 89.51 13127 92.11
2 Another language 1124 7.89 14251 100.00
English or other language spoken at home
LANGHOME Frequency PercentCumulativeFrequency
CumulativePercent
1 English spoken at home 12654 88.79 12654 88.79
2 Language other than English spoken at home 1226 8.60 13880 97.40
7 Not administered 146 1.02 14026 98.42
9 Missing 225 1.58 14251 100.00
30 LSAY 2009 cohort: wave 1 (2009) – frequency tables

Language at home (3-digit)
LANGN Frequency PercentCumulativeFrequency
CumulativePercent
108 Tagalog 47 0.33 47 0.33
156 Spanish 30 0.21 77 0.54
200 Italian 9 0.06 86 0.60
313 English 12752 89.48 12838 90.08
329 Vietnamese 110 0.77 12948 90.86
449 Greek 14 0.10 12962 90.96
463 Australian languages 55 0.39 13017 91.34
492 Macedonian 13 0.09 13030 91.43
500 Arabic 68 0.48 13098 91.91
625 Cantonese 119 0.84 13217 92.74
641 Mandarin 81 0.57 13298 93.31
801 Another language (AUS) 315 2.21 13613 95.52
997 N/A 146 1.02 13759 96.55
998 Invalid 242 1.70 14001 98.25
999 Missing 250 1.75 14251 100.00
Possessions desk
ST20Q01 Frequency PercentCumulativeFrequency
CumulativePercent
. 371 2.60 371 2.60
1 Yes 12739 89.39 13110 91.99
2 No 1141 8.01 14251 100.00
Possessions own room
ST20Q02 Frequency PercentCumulativeFrequency
CumulativePercent
. 268 1.88 268 1.88
1 Yes 13061 91.65 13329 93.53
2 No 922 6.47 14251 100.00
NCVER
31

Possessions study place
ST20Q03 Frequency PercentCumulativeFrequency
CumulativePercent
. 384 2.69 384 2.69
1 Yes 12287 86.22 12671 88.91
2 No 1580 11.09 14251 100.00
Possessions computer
ST20Q04 Frequency PercentCumulativeFrequency
CumulativePercent
. 299 2.10 299 2.10
1 Yes 13529 94.93 13828 97.03
2 No 423 2.97 14251 100.00
Possessions software
ST20Q05 Frequency PercentCumulativeFrequency
CumulativePercent
. 540 3.79 540 3.79
1 Yes 9527 66.85 10067 70.64
2 No 4184 29.36 14251 100.00
Possessions Internet
ST20Q06 Frequency PercentCumulativeFrequency
CumulativePercent
. 325 2.28 325 2.28
1 Yes 13222 92.78 13547 95.06
2 No 704 4.94 14251 100.00
Possessions literature
ST20Q07 Frequency PercentCumulativeFrequency
CumulativePercent
. 580 4.07 580 4.07
1 Yes 4757 33.38 5337 37.45
2 No 8914 62.55 14251 100.00
32 LSAY 2009 cohort: wave 1 (2009) – frequency tables

Possessions poetry
ST20Q08 Frequency PercentCumulativeFrequency
CumulativePercent
. 526 3.69 526 3.69
1 Yes 5477 38.43 6003 42.12
2 No 8248 57.88 14251 100.00
Possessions art
ST20Q09 Frequency PercentCumulativeFrequency
CumulativePercent
. 440 3.09 440 3.09
1 Yes 10438 73.24 10878 76.33
2 No 3373 23.67 14251 100.00
Possessions textbooks
ST20Q10 Frequency PercentCumulativeFrequency
CumulativePercent
. 413 2.90 413 2.90
1 Yes 10931 76.70 11344 79.60
2 No 2907 20.40 14251 100.00
Possessions <technical reference books>
ST20Q11 Frequency PercentCumulativeFrequency
CumulativePercent
. 647 4.54 647 4.54
1 Yes 6993 49.07 7640 53.61
2 No 6611 46.39 14251 100.00
Possessions dictionary
ST20Q12 Frequency PercentCumulativeFrequency
CumulativePercent
. 321 2.25 321 2.25
1 Yes 13511 94.81 13832 97.06
2 No 419 2.94 14251 100.00
NCVER
33

Possessions dishwasher
ST20Q13 Frequency PercentCumulativeFrequency
CumulativePercent
. 402 2.82 402 2.82
1 Yes 9358 65.67 9760 68.49
2 No 4491 31.51 14251 100.00
Possessions DVD or VCR player
ST20Q14 Frequency PercentCumulativeFrequency
CumulativePercent
. 276 1.94 276 1.94
1 Yes 13879 97.39 14155 99.33
2 No 96 0.67 14251 100.00
Possession Cntry Item 1 - Cable/Pay TV
ST20Q15 Frequency PercentCumulativeFrequency
CumulativePercent
. 447 3.14 447 3.14
1 Yes 7167 50.29 7614 53.43
2 No 6637 46.57 14251 100.00
Possession Cntry Item 2 - iPhone
ST20Q16 Frequency PercentCumulativeFrequency
CumulativePercent
. 570 4.00 570 4.00
1 Yes 2523 17.70 3093 21.70
2 No 11158 78.30 14251 100.00
Possession Cntry Item 3 - Plasma or LCD TV
ST20Q17 Frequency PercentCumulativeFrequency
CumulativePercent
. 378 2.65 378 2.65
1 Yes 10590 74.31 10968 76.96
2 No 3283 23.04 14251 100.00
34 LSAY 2009 cohort: wave 1 (2009) – frequency tables

How many cellular phones
ST21Q01 Frequency PercentCumulativeFrequency
CumulativePercent
. 357 2.51 357 2.51
1 None 42 0.29 399 2.80
2 One 181 1.27 580 4.07
3 Two 1007 7.07 1587 11.14
4 Three or more 12664 88.86 14251 100.00
How many televisions
ST21Q02 Frequency PercentCumulativeFrequency
CumulativePercent
. 379 2.66 379 2.66
1 None 52 0.36 431 3.02
2 One 970 6.81 1401 9.83
3 Two 3291 23.09 4692 32.92
4 Three or more 9559 67.08 14251 100.00
How many computers
ST21Q03 Frequency PercentCumulativeFrequency
CumulativePercent
. 403 2.83 403 2.83
1 None 222 1.56 625 4.39
2 One 3176 22.29 3801 26.67
3 Two 4387 30.78 8188 57.46
4 Three or more 6063 42.54 14251 100.00
How many cars
ST21Q04 Frequency PercentCumulativeFrequency
CumulativePercent
. 408 2.86 408 2.86
1 None 185 1.30 593 4.16
2 One 2530 17.75 3123 21.91
3 Two 5988 42.02 9111 63.93
4 Three or more 5140 36.07 14251 100.00
NCVER
35

How many rooms bath or shower
ST21Q05 Frequency PercentCumulativeFrequency
CumulativePercent
. 368 2.58 368 2.58
1 None 708 4.97 1076 7.55
2 One 4824 33.85 5900 41.40
3 Two 6480 45.47 12380 86.87
4 Three or more 1871 13.13 14251 100.00
How many books at home
ST22Q01 Frequency PercentCumulativeFrequency
CumulativePercent
. 315 2.21 315 2.21
0-10 books 1184 8.31 1499 10.52
11-25 books 1604 11.26 3103 21.77
26-100 books 4124 28.94 7227 50.71
101-200 books 2971 20.85 10198 71.56
201-500 books 2544 17.85 12742 89.41
6 More than 500 books 1509 10.59 14251 100.00
36 LSAY 2009 cohort: wave 1 (2009) – frequency tables

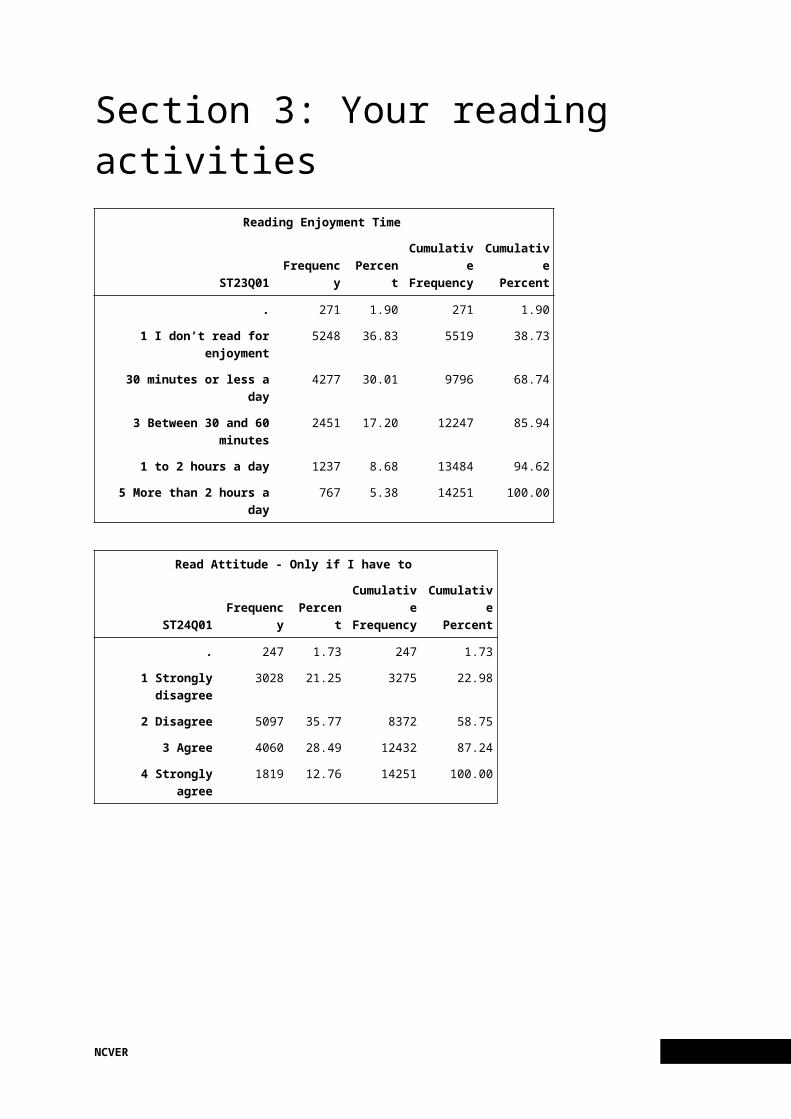
Section 3: Your reading activities
Reading Enjoyment Time
ST23Q01 Frequency PercentCumulativeFrequency
CumulativePercent
. 271 1.90 271 1.90
1 I don’t read for enjoyment 5248 36.83 5519 38.73
30 minutes or less a day 4277 30.01 9796 68.74
3 Between 30 and 60 minutes 2451 17.20 12247 85.94
1 to 2 hours a day 1237 8.68 13484 94.62
5 More than 2 hours a day 767 5.38 14251 100.00
Read Attitude - Only if I have to
ST24Q01 Frequency PercentCumulativeFrequency
CumulativePercent
. 247 1.73 247 1.73
1 Strongly disagree 3028 21.25 3275 22.98
2 Disagree 5097 35.77 8372 58.75
3 Agree 4060 28.49 12432 87.24
4 Strongly agree 1819 12.76 14251 100.00
Read Attitude - Favourite hobbies
ST24Q02 Frequency PercentCumulativeFrequency
CumulativePercent
. 257 1.80 257 1.80
1 Strongly disagree 4015 28.17 4272 29.98
2 Disagree 5119 35.92 9391 65.90
3 Agree 3239 22.73 12630 88.63
4 Strongly agree 1621 11.37 14251 100.00
NCVER
37

Read Attitude - Talk about books
ST24Q03 Frequency PercentCumulativeFrequency
CumulativePercent
. 264 1.85 264 1.85
1 Strongly disagree 3821 26.81 4085 28.66
2 Disagree 4881 34.25 8966 62.91
3 Agree 4219 29.60 13185 92.52
4 Strongly agree 1066 7.48 14251 100.00
Read Attitude - Hard to finish
ST24Q04 Frequency PercentCumulativeFrequency
CumulativePercent
. 258 1.81 258 1.81
1 Strongly disagree 3541 24.85 3799 26.66
2 Disagree 5748 40.33 9547 66.99
3 Agree 3219 22.59 12766 89.58
4 Strongly agree 1485 10.42 14251 100.00
Read Attitude - Happy as present
ST24Q05 Frequency PercentCumulativeFrequency
CumulativePercent
. 293 2.06 293 2.06
1 Strongly disagree 2777 19.49 3070 21.54
2 Disagree 4179 29.32 7249 50.87
3 Agree 5600 39.30 12849 90.16
4 Strongly agree 1402 9.84 14251 100.00
Read Attitude - Waste of time
ST24Q06 Frequency PercentCumulativeFrequency
CumulativePercent
. 277 1.94 277 1.94
1 Strongly disagree 4975 34.91 5252 36.85
2 Disagree 5288 37.11 10540 73.96
3 Agree 2214 15.54 12754 89.50
4 Strongly agree 1497 10.50 14251 100.00
38 LSAY 2009 cohort: wave 1 (2009) – frequency tables

Read Attitude - Enjoy library
ST24Q07 Frequency PercentCumulativeFrequency
CumulativePercent
. 267 1.87 267 1.87
1 Strongly disagree 3297 23.14 3564 25.01
2 Disagree 4324 30.34 7888 55.35
3 Agree 4430 31.09 12318 86.44
4 Strongly agree 1933 13.56 14251 100.00
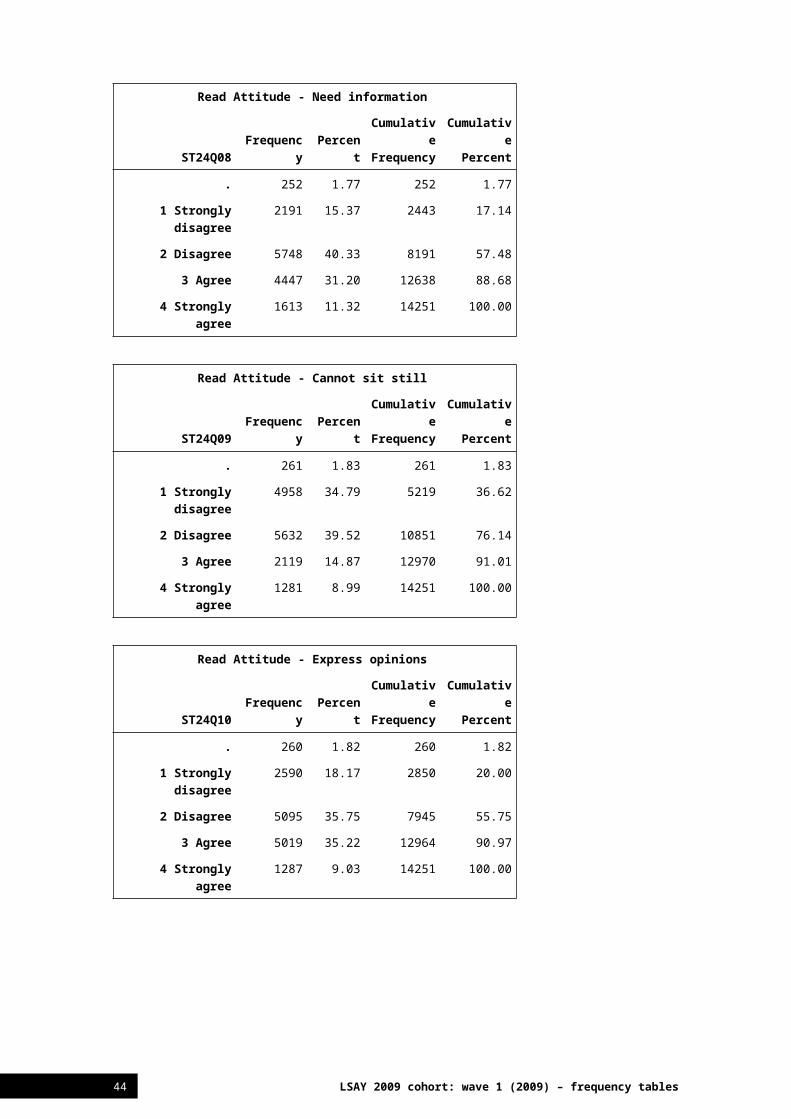
Read Attitude - Need information
ST24Q08 Frequency PercentCumulativeFrequency
CumulativePercent
. 252 1.77 252 1.77
1 Strongly disagree 2191 15.37 2443 17.14
2 Disagree 5748 40.33 8191 57.48
3 Agree 4447 31.20 12638 88.68
4 Strongly agree 1613 11.32 14251 100.00
Read Attitude - Cannot sit still
ST24Q09 Frequency PercentCumulativeFrequency
CumulativePercent
. 261 1.83 261 1.83
1 Strongly disagree 4958 34.79 5219 36.62
2 Disagree 5632 39.52 10851 76.14
3 Agree 2119 14.87 12970 91.01
4 Strongly agree 1281 8.99 14251 100.00
Read Attitude - Express opinions
ST24Q10 Frequency PercentCumulativeFrequency
CumulativePercent
. 260 1.82 260 1.82
1 Strongly disagree 2590 18.17 2850 20.00
2 Disagree 5095 35.75 7945 55.75
3 Agree 5019 35.22 12964 90.97
4 Strongly agree 1287 9.03 14251 100.00
NCVER
39

Read Attitude - Exchange
ST24Q11 Frequency PercentCumulativeFrequency
CumulativePercent
. 253 1.78 253 1.78
1 Strongly disagree 4465 31.33 4718 33.11
2 Disagree 5148 36.12 9866 69.23
3 Agree 3405 23.89 13271 93.12
4 Strongly agree 980 6.88 14251 100.00
Like Read - Magazines
ST25Q01 Frequency PercentCumulativeFrequency
CumulativePercent
. 234 1.64 234 1.64
1 Never or almost never 1000 7.02 1234 8.66
2 A few times a year 2265 15.89 3499 24.55
3 About once a month 3693 25.91 7192 50.47
4 Several times a month 4421 31.02 11613 81.49
5 Several times a week 2638 18.51 14251 100.00
Like Read - Comic Books
ST25Q02 Frequency PercentCumulativeFrequency
CumulativePercent
. 289 2.03 289 2.03
1 Never or almost never 8113 56.93 8402 58.96
2 A few times a year 3229 22.66 11631 81.62
3 About once a month 1355 9.51 12986 91.12
4 Several times a month 794 5.57 13780 96.69
5 Several times a week 471 3.31 14251 100.00
40 LSAY 2009 cohort: wave 1 (2009) – frequency tables
Like Read - Fiction
ST25Q03 Frequency PercentCumulativeFrequency
CumulativePercent
. 292 2.05 292 2.05
1 Never or almost never 2479 17.40 2771 19.44
2 A few times a year 3682 25.84 6453 45.28
3 About once a month 2565 18.00 9018 63.28
4 Several times a month 2559 17.96 11577 81.24
5 Several times a week 2674 18.76 14251 100.00
Like Read - Non-fiction books
ST25Q04 Frequency PercentCumulativeFrequency
CumulativePercent
. 303 2.13 303 2.13
1 Never or almost never 3394 23.82 3697 25.94
2 A few times a year 4736 33.23 8433 59.17
3 About once a month 3067 21.52 11500 80.70
4 Several times a month 1978 13.88 13478 94.58
5 Several times a week 773 5.42 14251 100.00
Like Read - Newspapers
ST25Q05 Frequency PercentCumulativeFrequency
CumulativePercent
. 269 1.89 269 1.89
1 Never or almost never 1810 12.70 2079 14.59
2 A few times a year 2089 14.66 4168 29.25
3 About once a month 2451 17.20 6619 46.45
4 Several times a month 3743 26.26 10362 72.71
5 Several times a week 3889 27.29 14251 100.00
NCVER
41

Online - Reading Emails
ST26Q01 Frequency PercentCumulativeFrequency
CumulativePercent
. 242 1.70 242 1.70
1 Don’t know what it is 152 1.07 394 2.76
2 Never or almost never 1491 10.46 1885 13.23
3 Several times a month 3164 22.20 5049 35.43
4 Several times a week 6126 42.99 11175 78.42
5 Several times a day 3076 21.58 14251 100.00
Online - Chat on line
ST26Q02 Frequency PercentCumulativeFrequency
CumulativePercent
. 275 1.93 275 1.93
1 Don’t know what it is 140 0.98 415 2.91
2 Never or almost never 2019 14.17 2434 17.08
3 Several times a month 1605 11.26 4039 28.34
4 Several times a week 4855 34.07 8894 62.41
5 Several times a day 5357 37.59 14251 100.00
Online - Reading News
ST26Q03 Frequency PercentCumulativeFrequency
CumulativePercent
. 353 2.48 353 2.48
1 Don’t know what it is 403 2.83 756 5.30
2 Never or almost never 5617 39.41 6373 44.72
3 Several times a month 3658 25.67 10031 70.39
4 Several times a week 2952 20.71 12983 91.10
5 Several times a day 1268 8.90 14251 100.00
42 LSAY 2009 cohort: wave 1 (2009) – frequency tables

Online - Using Dictionary
ST26Q04 Frequency PercentCumulativeFrequency
CumulativePercent
. 276 1.94 276 1.94
1 Don’t know what it is 394 2.76 670 4.70
2 Never or almost never 3661 25.69 4331 30.39
3 Several times a month 5392 37.84 9723 68.23
4 Several times a week 3492 24.50 13215 92.73
5 Several times a day 1036 7.27 14251 100.00
Online - Particular Topic
ST26Q05 Frequency PercentCumulativeFrequency
CumulativePercent
. 260 1.82 260 1.82
1 Don’t know what it is 162 1.14 422 2.96
2 Never or almost never 1284 9.01 1706 11.97
3 Several times a month 4807 33.73 6513 45.70
4 Several times a week 5670 39.79 12183 85.49
5 Several times a day 2068 14.51 14251 100.00
Online - Group Discussions
ST26Q06 Frequency PercentCumulativeFrequency
CumulativePercent
. 275 1.93 275 1.93
1 Don’t know what it is 1067 7.49 1342 9.42
2 Never or almost never 8531 59.86 9873 69.28
3 Several times a month 2095 14.70 11968 83.98
4 Several times a week 1429 10.03 13397 94.01
5 Several times a day 854 5.99 14251 100.00
NCVER
43
Online - Practical Information
ST26Q07 Frequency PercentCumulativeFrequency
CumulativePercent
. 254 1.78 254 1.78
1 Don’t know what it is 356 2.50 610 4.28
2 Never or almost never 3554 24.94 4164 29.22
3 Several times a month 5741 40.28 9905 69.50
4 Several times a week 3342 23.45 13247 92.95
5 Several times a day 1004 7.05 14251 100.00
Study - Memorize Everything
ST27Q01 Frequency PercentCumulativeFrequency
CumulativePercent
. 241 1.69 241 1.69
1 Almost Never 1650 11.58 1891 13.27
2 Sometimes 6615 46.42 8506 59.69
3 Often 4337 30.43 12843 90.12
4 Almost always 1408 9.88 14251 100.00
Study - Figure Out
ST27Q02 Frequency PercentCumulativeFrequency
CumulativePercent
. 268 1.88 268 1.88
1 Almost Never 870 6.10 1138 7.99
2 Sometimes 3422 24.01 4560 32.00
3 Often 6160 43.23 10720 75.22
4 Almost always 3531 24.78 14251 100.00
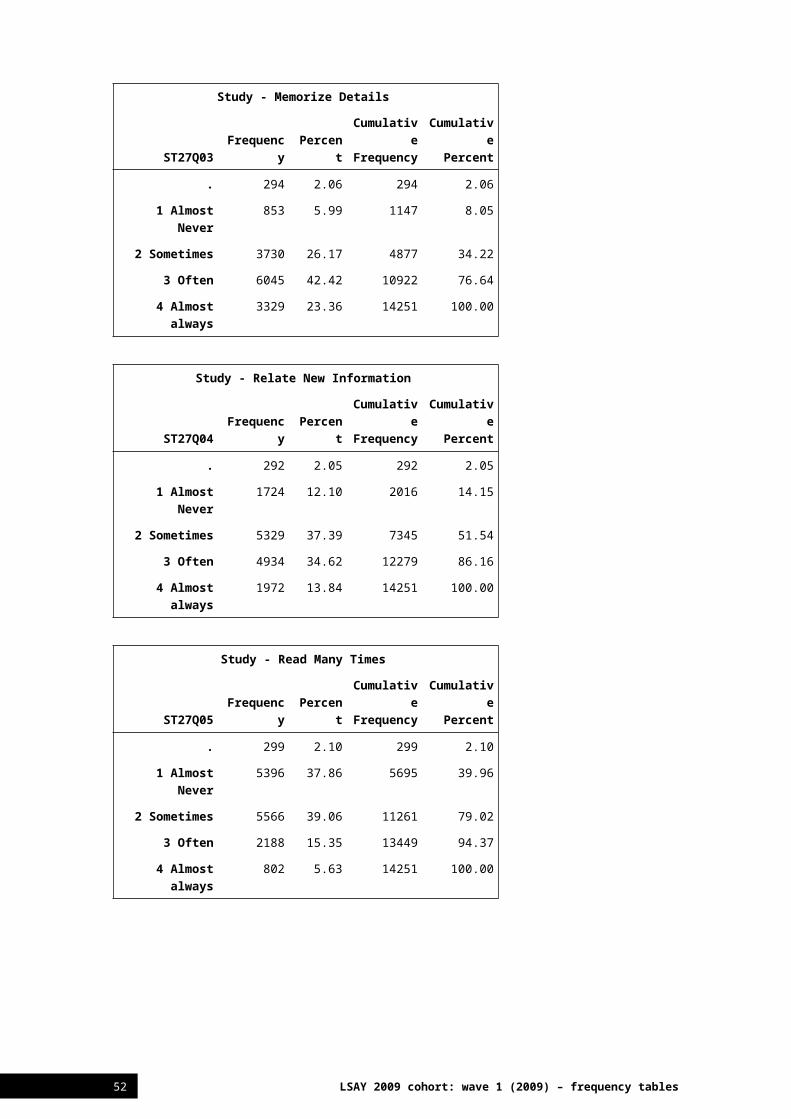
Study - Memorize Details
ST27Q03 Frequency PercentCumulativeFrequency
CumulativePercent
. 294 2.06 294 2.06
1 Almost Never 853 5.99 1147 8.05
2 Sometimes 3730 26.17 4877 34.22
3 Often 6045 42.42 10922 76.64
4 Almost always 3329 23.36 14251 100.00
44 LSAY 2009 cohort: wave 1 (2009) – frequency tables

Study - Relate New Information
ST27Q04 Frequency PercentCumulativeFrequency
CumulativePercent
. 292 2.05 292 2.05
1 Almost Never 1724 12.10 2016 14.15
2 Sometimes 5329 37.39 7345 51.54
3 Often 4934 34.62 12279 86.16
4 Almost always 1972 13.84 14251 100.00
Study - Read Many Times
ST27Q05 Frequency PercentCumulativeFrequency
CumulativePercent
. 299 2.10 299 2.10
1 Almost Never 5396 37.86 5695 39.96
2 Sometimes 5566 39.06 11261 79.02
3 Often 2188 15.35 13449 94.37
4 Almost always 802 5.63 14251 100.00
Study - Check if Understand
ST27Q06 Frequency PercentCumulativeFrequency
CumulativePercent
. 319 2.24 319 2.24
1 Almost Never 908 6.37 1227 8.61
2 Sometimes 3843 26.97 5070 35.58
3 Often 5602 39.31 10672 74.89
4 Almost always 3579 25.11 14251 100.00
Study - Read Text Repeatedly
ST27Q07 Frequency PercentCumulativeFrequency
CumulativePercent
. 316 2.22 316 2.22
1 Almost Never 2157 15.14 2473 17.35
2 Sometimes 5594 39.25 8067 56.61
3 Often 4179 29.32 12246 85.93
4 Almost always 2005 14.07 14251 100.00
NCVER
45

Study - Useful Outside School
ST27Q08 Frequency PercentCumulativeFrequency
CumulativePercent
. 293 2.06 293 2.06
1 Almost Never 4644 32.59 4937 34.64
2 Sometimes 5903 41.42 10840 76.06
3 Often 2624 18.41 13464 94.48
4 Almost always 787 5.52 14251 100.00
Study - Haven't Understood
ST27Q09 Frequency PercentCumulativeFrequency
CumulativePercent
. 289 2.03 289 2.03
1 Almost Never 1327 9.31 1616 11.34
2 Sometimes 4871 34.18 6487 45.52
3 Often 5411 37.97 11898 83.49
4 Almost always 2353 16.51 14251 100.00
Study - Relate to Experience
ST27Q10 Frequency PercentCumulativeFrequency
CumulativePercent
. 309 2.17 309 2.17
1 Almost Never 3582 25.14 3891 27.30
2 Sometimes 5827 40.89 9718 68.19
3 Often 3390 23.79 13108 91.98
4 Almost always 1143 8.02 14251 100.00
Study - Important Points
ST27Q11 Frequency PercentCumulativeFrequency
CumulativePercent
. 314 2.20 314 2.20
1 Almost Never 741 5.20 1055 7.40
2 Sometimes 3029 21.25 4084 28.66
3 Often 5705 40.03 9789 68.69
4 Almost always 4462 31.31 14251 100.00
46 LSAY 2009 cohort: wave 1 (2009) – frequency tables

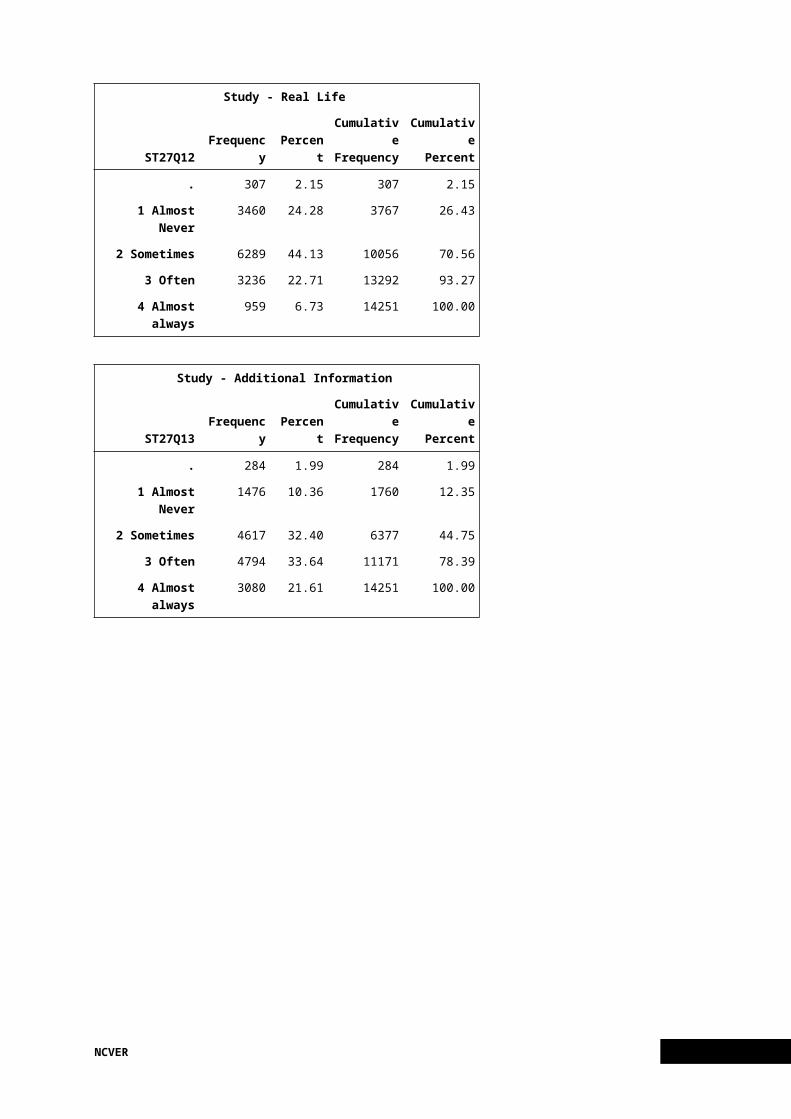
Study - Real Life
ST27Q12 Frequency PercentCumulativeFrequency
CumulativePercent
. 307 2.15 307 2.15
1 Almost Never 3460 24.28 3767 26.43
2 Sometimes 6289 44.13 10056 70.56
3 Often 3236 22.71 13292 93.27
4 Almost always 959 6.73 14251 100.00
Study - Additional Information
ST27Q13 Frequency PercentCumulativeFrequency
CumulativePercent
. 284 1.99 284 1.99
1 Almost Never 1476 10.36 1760 12.35
2 Sometimes 4617 32.40 6377 44.75
3 Often 4794 33.64 11171 78.39
4 Almost always 3080 21.61 14251 100.00
NCVER
47

Section 4: Learning timeMin in <class period> for <test lang>
ST28Q01 Frequency PercentCumulativeFrequency
CumulativePercent
. 921 6.46 921 6.46
30 to 120 minutes 13330 93.54 14251 100.00
Analysis Variable : ST28Q01 Min in <class period> for <test lang>
N Mean Median Std Dev Minimum Maximum
13330 55.99 50.00 14.49 30.00 120.00
Min in <class period> for <Maths>
ST28Q02 Frequency PercentCumulativeFrequency
CumulativePercent
. 978 6.86 978 6.86
30 to 120 minutes 13273 93.14 14251 100.00
Analysis Variable : ST28Q02 Min in <class period> for <Maths>
N Mean Median Std Dev Minimum Maximum
13273 56.04 50.00 14.56 30.00 120.00
Min in <class period> for <Science>
ST28Q03 Frequency PercentCumulativeFrequency
CumulativePercent
. 1640 11.51 1640 11.51
30 to 120 minutes 12611 88.49 14251 100.00
Analysis Variable : ST28Q03 Min in <class period> for <Science>
N Mean Median Std Dev Minimum Maximum
12611 56.04 50.00 14.71 30.00 120.00
48 LSAY 2009 cohort: wave 1 (2009) – frequency tables

No of <class period> - <test lang> p/wk
ST29Q01 Frequency PercentCumulativeFrequency
CumulativePercent
. 726 5.09 726 5.09
0 21 0.15 747 5.24
1 26 0.18 773 5.42
2 431 3.02 1204 8.45
3 2318 16.27 3522 24.71
4 5346 37.51 8868 62.23
5 3775 26.49 12643 88.72
6 1063 7.46 13706 96.18
7 206 1.45 13912 97.62
8 213 1.49 14125 99.12
9 71 0.50 14196 99.61
10 55 0.39 14251 100.00
No of <class period> - <Maths> p/wk
ST29Q02 Frequency PercentCumulativeFrequency
CumulativePercent
. 721 5.06 721 5.06
0 117 0.82 838 5.88
1 32 0.22 870 6.10
2 448 3.14 1318 9.25
3 2235 15.68 3553 24.93
4 5115 35.89 8668 60.82
5 3725 26.14 12393 86.96
6 1119 7.85 13512 94.81
7 251 1.76 13763 96.58
8 282 1.98 14045 98.55
9 111 0.78 14156 99.33
10 95 0.67 14251 100.00
NCVER
49

No of <class period> - <Sci> p/wk
ST29Q03 Frequency PercentCumulativeFrequency
CumulativePercent
. 895 6.28 895 6.28
0 1469 10.31 2364 16.59
1 113 0.79 2477 17.38
2 608 4.27 3085 21.65
3 2479 17.40 5564 39.04
4 4385 30.77 9949 69.81
5 2739 19.22 12688 89.03
6 805 5.65 13493 94.68
7 152 1.07 13645 95.75
8 364 2.55 14009 98.30
9 89 0.62 14098 98.93
10 153 1.07 14251 100.00
50 LSAY 2009 cohort: wave 1 (2009) – frequency tables

No of ALL <class period> a week
ST30Q01 Frequency PercentCumulativeFrequency
CumulativePercent
. 1426 10.01 1426 10.01
5 74 0.52 1500 10.53
6 155 1.09 1655 11.61
7 135 0.95 1790 12.56
8 74 0.52 1864 13.08
9 47 0.33 1911 13.41
10 29 0.20 1940 13.61
11 22 0.15 1962 13.77
12 54 0.38 2016 14.15
13 35 0.25 2051 14.39
14 25 0.18 2076 14.57
15 365 2.56 2441 17.13
16 75 0.53 2516 17.65
17 25 0.18 2541 17.83
18 155 1.09 2696 18.92
19 75 0.53 2771 19.44
20 1231 8.64 4002 28.08
21 78 0.55 4080 28.63
22 59 0.41 4139 29.04
23 156 1.09 4295 30.14
24 363 2.55 4658 32.69
25 1953 13.70 6611 46.39
26 230 1.61 6841 48.00
27 370 2.60 7211 50.60
28 379 2.66 7590 53.26
29 399 2.80 7989 56.06
30 3143 22.05 11132 78.11
31 121 0.85 11253 78.96
32 149 1.05 11402 80.01
33 84 0.59 11486 80.60
34 106 0.74 11592 81.34
35 1537 10.79 13129 92.13
36 355 2.49 13484 94.62
NCVER
51
No of ALL <class period> a week
ST30Q01 Frequency PercentCumulativeFrequency
CumulativePercent
37 72 0.51 13556 95.12
38 34 0.24 13590 95.36
39 66 0.46 13656 95.82
40 595 4.18 14251 100.00
<Enrich> in English
ST31Q01 Frequency PercentCumulativeFrequency
CumulativePercent
. 522 3.66 522 3.66
1 Yes 1042 7.31 1564 10.97
2 No 12687 89.03 14251 100.00
<Enrich> in Maths
ST31Q02 Frequency PercentCumulativeFrequency
CumulativePercent
. 533 3.74 533 3.74
1 Yes 1795 12.60 2328 16.34
2 No 11923 83.66 14251 100.00
<Enrich> in Science
ST31Q03 Frequency PercentCumulativeFrequency
CumulativePercent
. 565 3.96 565 3.96
1 Yes 812 5.70 1377 9.66
2 No 12874 90.34 14251 100.00
<Enrich> in other subjects
ST31Q04 Frequency PercentCumulativeFrequency
CumulativePercent
. 582 4.08 582 4.08
1 Yes 1531 10.74 2113 14.83
2 No 12138 85.17 14251 100.00
52 LSAY 2009 cohort: wave 1 (2009) – frequency tables

<Remedial> in English
ST31Q05 Frequency PercentCumulativeFrequency
CumulativePercent
. 619 4.34 619 4.34
1 Yes 677 4.75 1296 9.09
2 No 12955 90.91 14251 100.00
<Remedial> in Maths
ST31Q06 Frequency PercentCumulativeFrequency
CumulativePercent
. 613 4.30 613 4.30
1 Yes 1001 7.02 1614 11.33
2 No 12637 88.67 14251 100.00
<Remedial> in Science
ST31Q07 Frequency PercentCumulativeFrequency
CumulativePercent
. 621 4.36 621 4.36
1 Yes 508 3.56 1129 7.92
2 No 13122 92.08 14251 100.00
<Remedial> in other subjects
ST31Q08 Frequency PercentCumulativeFrequency
CumulativePercent
. 640 4.49 640 4.49
1 Yes 785 5.51 1425 10.00
2 No 12826 90.00 14251 100.00
Lessons to improve study skills
ST31Q09 Frequency PercentCumulativeFrequency
CumulativePercent
. 618 4.34 618 4.34
1 Yes 1148 8.06 1766 12.39
2 No 12485 87.61 14251 100.00
NCVER
53

Out of school lessons <test lang>
ST32Q01 Frequency PercentCumulativeFrequency
CumulativePercent
. 2460 17.26 2460 17.26
1 Do not attend 10559 74.09 13019 91.35
2 Less than 2 hours a week 652 4.58 13671 95.93
2 up to 4 Hours a week 354 2.48 14025 98.41
4 up to 6 hours per week 151 1.06 14176 99.47
6 or more hours a week 75 0.53 14251 100.00
Out of school lessons <maths>
ST32Q02 Frequency PercentCumulativeFrequency
CumulativePercent
. 2505 17.58 2505 17.58
1 Do not attend 9678 67.91 12183 85.49
2 Less than 2 hours a week 1245 8.74 13428 94.22
2 up to 4 Hours a week 533 3.74 13961 97.97
4 up to 6 hours per week 194 1.36 14155 99.33
6 or more hours a week 96 0.67 14251 100.00
Out of school lessons <science>
ST32Q03 Frequency PercentCumulativeFrequency
CumulativePercent
. 2618 18.37 2618 18.37
1 Do not attend 10567 74.15 13185 92.52
2 Less than 2 hours a week 560 3.93 13745 96.45
2 up to 4 Hours a week 308 2.16 14053 98.61
4 up to 6 hours per week 132 0.93 14185 99.54
6 or more hours a week 66 0.46 14251 100.00
54 LSAY 2009 cohort: wave 1 (2009) – frequency tables
Out of school lessons other
ST32Q04 Frequency PercentCumulativeFrequency
CumulativePercent
. 3208 22.51 3208 22.51
1 Do not attend 9377 65.80 12585 88.31
2 Less than 2 hours a week 789 5.54 13374 93.85
2 up to 4 Hours a week 424 2.98 13798 96.82
4 up to 6 hours per week 234 1.64 14032 98.46
6 or more hours a week 219 1.54 14251 100.00
NCVER
55

Section 5: Your schoolClimate - Little for Adult Life
ST33Q01 Frequency PercentCumulativeFrequency
CumulativePercent
. 352 2.47 352 2.47
1 Strongly disagree 5073 35.60 5425 38.07
2 Disagree 6176 43.34 11601 81.40
3 Agree 2040 14.31 13641 95.72
4 Strongly Agree 610 4.28 14251 100.00
Climate - Waste of Time
ST33Q02 Frequency PercentCumulativeFrequency
CumulativePercent
. 373 2.62 373 2.62
1 Strongly disagree 6674 46.83 7047 49.45
2 Disagree 6102 42.82 13149 92.27
3 Agree 837 5.87 13986 98.14
4 Strongly Agree 265 1.86 14251 100.00
Climate - Given Confidence
ST33Q03 Frequency PercentCumulativeFrequency
CumulativePercent
. 354 2.48 354 2.48
1 Strongly disagree 435 3.05 789 5.54
2 Disagree 1917 13.45 2706 18.99
3 Agree 8674 60.87 11380 79.85
4 Strongly Agree 2871 20.15 14251 100.00
56 LSAY 2009 cohort: wave 1 (2009) – frequency tables

Climate - Useful for Jobs
ST33Q04 Frequency PercentCumulativeFrequency
CumulativePercent
. 332 2.33 332 2.33
1 Strongly disagree 330 2.32 662 4.65
2 Disagree 842 5.91 1504 10.55
3 Agree 7045 49.44 8549 59.99
4 Strongly Agree 5702 40.01 14251 100.00
Teachers - Get along well
ST34Q01 Frequency PercentCumulativeFrequency
CumulativePercent
. 309 2.17 309 2.17
1 Strongly disagree 457 3.21 766 5.38
2 Disagree 1683 11.81 2449 17.18
3 Agree 9132 64.08 11581 81.26
4 Strong agree 2670 18.74 14251 100.00
Teachers - Interested in well-being
ST34Q02 Frequency PercentCumulativeFrequency
CumulativePercent
. 371 2.60 371 2.60
1 Strongly disagree 563 3.95 934 6.55
2 Disagree 2581 18.11 3515 24.66
3 Agree 9028 63.35 12543 88.01
4 Strong agree 1708 11.99 14251 100.00
Teachers - Really listen
ST34Q03 Frequency PercentCumulativeFrequency
CumulativePercent
. 351 2.46 351 2.46
1 Strongly disagree 708 4.97 1059 7.43
2 Disagree 3371 23.65 4430 31.09
3 Agree 8373 58.75 12803 89.84
4 Strong agree 1448 10.16 14251 100.00
NCVER
57

Teachers - Extra help
ST34Q04 Frequency PercentCumulativeFrequency
CumulativePercent
. 359 2.52 359 2.52
1 Strongly disagree 422 2.96 781 5.48
2 Disagree 1813 12.72 2594 18.20
3 Agree 9329 65.46 11923 83.66
4 Strong agree 2328 16.34 14251 100.00
Teachers - Treat me fairly
ST34Q05 Frequency PercentCumulativeFrequency
CumulativePercent
. 348 2.44 348 2.44
1 Strongly disagree 474 3.33 822 5.77
2 Disagree 1673 11.74 2495 17.51
3 Agree 9583 67.24 12078 84.75
4 Strong agree 2173 15.25 14251 100.00
58 LSAY 2009 cohort: wave 1 (2009) – frequency tables

Section 6: Your English lessonsAttend language class
ST35Q01 Frequency PercentCumulativeFrequency
CumulativePercent
. 538 3.78 538 3.78
1 to 40 students 13713 96.22 14251 100.00
Analysis Variable : ST35Q01 Attend language class
N Mean Median Std Dev Minimum Maximum
13713 22.82 24.00 5.19 1.00 40.00
Lessons - Students don’t listen
ST36Q01 Frequency PercentCumulativeFrequency
CumulativePercent
. 315 2.21 315 2.21
1 Never or hardly ever 2118 14.86 2433 17.07
2 Some lessons 7187 50.43 9620 67.50
3 Most lessons 3424 24.03 13044 91.53
4 Every lesson 1207 8.47 14251 100.00
Lessons - Noise and disorder
ST36Q02 Frequency PercentCumulativeFrequency
CumulativePercent
. 327 2.29 327 2.29
1 Never or hardly ever 1790 12.56 2117 14.86
2 Some lessons 6562 46.05 8679 60.90
3 Most lessons 3984 27.96 12663 88.86
4 Every lesson 1588 11.14 14251 100.00
NCVER
59

Lessons - Wait for quiet
ST36Q03 Frequency PercentCumulativeFrequency
CumulativePercent
. 340 2.39 340 2.39
1 Never or hardly ever 3615 25.37 3955 27.75
2 Some lessons 6085 42.70 10040 70.45
3 Most lessons 3022 21.21 13062 91.66
4 Every lesson 1189 8.34 14251 100.00
Lessons - Cannot work well
ST36Q04 Frequency PercentCumulativeFrequency
CumulativePercent
. 331 2.32 331 2.32
1 Never or hardly ever 4463 31.32 4794 33.64
2 Some lessons 6886 48.32 11680 81.96
3 Most lessons 1869 13.11 13549 95.07
4 Every lesson 702 4.93 14251 100.00
Lessons - Long time to start
ST36Q05 Frequency PercentCumulativeFrequency
CumulativePercent
. 325 2.28 325 2.28
1 Never or hardly ever 4335 30.42 4660 32.70
2 Some lessons 6209 43.57 10869 76.27
3 Most lessons 2382 16.71 13251 92.98
4 Every lesson 1000 7.02 14251 100.00
Stimulate - Explain text
ST37Q01 Frequency PercentCumulativeFrequency
CumulativePercent
. 324 2.27 324 2.27
1 Never or hardly ever 694 4.87 1018 7.14
2 Some lessons 4751 33.34 5769 40.48
3 Most lessons 6643 46.61 12412 87.10
4 All Lessons 1839 12.90 14251 100.00
60 LSAY 2009 cohort: wave 1 (2009) – frequency tables

Stimulate - Better understanding
ST37Q02 Frequency PercentCumulativeFrequency
CumulativePercent
. 325 2.28 325 2.28
1 Never or hardly ever 743 5.21 1068 7.49
2 Some lessons 4127 28.96 5195 36.45
3 Most lessons 6692 46.96 11887 83.41
4 All Lessons 2364 16.59 14251 100.00
Stimulate - Time to think
ST37Q03 Frequency PercentCumulativeFrequency
CumulativePercent
. 348 2.44 348 2.44
1 Never or hardly ever 703 4.93 1051 7.37
2 Some lessons 3826 26.85 4877 34.22
3 Most lessons 6651 46.67 11528 80.89
4 All Lessons 2723 19.11 14251 100.00
Stimulate - Recommend books
ST37Q04 Frequency PercentCumulativeFrequency
CumulativePercent
. 372 2.61 372 2.61
1 Never or hardly ever 3943 27.67 4315 30.28
2 Some lessons 5756 40.39 10071 70.67
3 Most lessons 3182 22.33 13253 93.00
4 All Lessons 998 7.00 14251 100.00
Stimulate - Express opinion
ST37Q05 Frequency PercentCumulativeFrequency
CumulativePercent
. 370 2.60 370 2.60
1 Never or hardly ever 1116 7.83 1486 10.43
2 Some lessons 4181 29.34 5667 39.77
3 Most lessons 5822 40.85 11489 80.62
4 All Lessons 2762 19.38 14251 100.00
NCVER
61

Stimulate - Relate to lives
ST37Q06 Frequency PercentCumulativeFrequency
CumulativePercent
. 370 2.60 370 2.60
1 Never or hardly ever 3546 24.88 3916 27.48
2 Some lessons 5800 40.70 9716 68.18
3 Most lessons 3506 24.60 13222 92.78
4 All Lessons 1029 7.22 14251 100.00
Stimulate - Build on knowledge
ST37Q07 Frequency PercentCumulativeFrequency
CumulativePercent
. 353 2.48 353 2.48
1 Never or hardly ever 1551 10.88 1904 13.36
2 Some lessons 5501 38.60 7405 51.96
3 Most lessons 5199 36.48 12604 88.44
4 All Lessons 1647 11.56 14251 100.00
Strategies - Explain Expectations
ST38Q01 Frequency PercentCumulativeFrequency
CumulativePercent
. 368 2.58 368 2.58
1 Never or hardly ever 1114 7.82 1482 10.40
2 Some lessons 4568 32.05 6050 42.45
3 Most lessons 5663 39.74 11713 82.19
4 All Lessons 2538 17.81 14251 100.00
Strategies - Check Concentrating
ST38Q02 Frequency PercentCumulativeFrequency
CumulativePercent
. 375 2.63 375 2.63
1 Never or hardly ever 887 6.22 1262 8.86
2 Some lessons 3896 27.34 5158 36.19
3 Most lessons 6528 45.81 11686 82.00
4 All Lessons 2565 18.00 14251 100.00
62 LSAY 2009 cohort: wave 1 (2009) – frequency tables

Strategies - Discuss work
ST38Q03 Frequency PercentCumulativeFrequency
CumulativePercent
. 386 2.71 386 2.71
1 Never or hardly ever 1073 7.53 1459 10.24
2 Some lessons 4257 29.87 5716 40.11
3 Most lessons 6111 42.88 11827 82.99
4 All Lessons 2424 17.01 14251 100.00
Strategies - Explain judgements
ST38Q04 Frequency PercentCumulativeFrequency
CumulativePercent
. 386 2.71 386 2.71
1 Never or hardly ever 963 6.76 1349 9.47
2 Some lessons 3637 25.52 4986 34.99
3 Most lessons 5882 41.27 10868 76.26
4 All Lessons 3383 23.74 14251 100.00
Strategies - Ask if understood
ST38Q05 Frequency PercentCumulativeFrequency
CumulativePercent
. 391 2.74 391 2.74
1 Never or hardly ever 858 6.02 1249 8.76
2 Some lessons 3320 23.30 4569 32.06
3 Most lessons 5815 40.80 10384 72.87
4 All Lessons 3867 27.13 14251 100.00
Strategies - Mark work
ST38Q06 Frequency PercentCumulativeFrequency
CumulativePercent
. 427 3.00 427 3.00
1 Never or hardly ever 703 4.93 1130 7.93
2 Some lessons 3403 23.88 4533 31.81
3 Most lessons 4890 34.31 9423 66.12
4 All Lessons 4828 33.88 14251 100.00
NCVER
63

Strategies - Student questions
ST38Q07 Frequency PercentCumulativeFrequency
CumulativePercent
. 419 2.94 419 2.94
1 Never or hardly ever 424 2.98 843 5.92
2 Some lessons 2779 19.50 3622 25.42
3 Most lessons 5730 40.21 9352 65.62
4 All Lessons 4899 34.38 14251 100.00
Strategies - Motivating questions
ST38Q08 Frequency PercentCumulativeFrequency
CumulativePercent
. 396 2.78 396 2.78
1 Never or hardly ever 1148 8.06 1544 10.83
2 Some lessons 4314 30.27 5858 41.11
3 Most lessons 5834 40.94 11692 82.04
4 All Lessons 2559 17.96 14251 100.00
Strategies - Immediate feedback
ST38Q09 Frequency PercentCumulativeFrequency
CumulativePercent
. 387 2.72 387 2.72
1 Never or hardly ever 2121 14.88 2508 17.60
2 Some lessons 5186 36.39 7694 53.99
3 Most lessons 4678 32.83 12372 86.81
4 All Lessons 1879 13.19 14251 100.00
64 LSAY 2009 cohort: wave 1 (2009) – frequency tables

Section 7: LibrariesLibrary - Borrow for pleasure
ST39Q01 Frequency PercentCumulativeFrequency
CumulativePercent
. 362 2.54 362 2.54
1 Never 6228 43.70 6590 46.24
2 A few times a year 3910 27.44 10500 73.68
3 About once a month 1942 13.63 12442 87.31
4 Several times a month 1381 9.69 13823 97.00
5 Several times a week 428 3.00 14251 100.00
Library - Borrow for work
ST39Q02 Frequency PercentCumulativeFrequency
CumulativePercent
. 375 2.63 375 2.63
1 Never 4027 28.26 4402 30.89
2 A few times a year 5638 39.56 10040 70.45
3 About once a month 2655 18.63 12695 89.08
4 Several times a month 1342 9.42 14037 98.50
5 Several times a week 214 1.50 14251 100.00
Library - Work on homework
ST39Q03 Frequency PercentCumulativeFrequency
CumulativePercent
. 390 2.74 390 2.74
1 Never 4632 32.50 5022 35.24
2 A few times a year 3546 24.88 8568 60.12
3 About once a month 2317 16.26 10885 76.38
4 Several times a month 2243 15.74 13128 92.12
5 Several times a week 1123 7.88 14251 100.00
NCVER
65

Library - Read magazines
ST39Q04 Frequency PercentCumulativeFrequency
CumulativePercent
. 397 2.79 397 2.79
1 Never 7599 53.32 7996 56.11
2 A few times a year 2506 17.58 10502 73.69
3 About once a month 1430 10.03 11932 83.73
4 Several times a month 1350 9.47 13282 93.20
5 Several times a week 969 6.80 14251 100.00
Library - Read for fun
ST39Q05 Frequency PercentCumulativeFrequency
CumulativePercent
. 413 2.90 413 2.90
1 Never 7312 51.31 7725 54.21
2 A few times a year 2807 19.70 10532 73.90
3 About once a month 1462 10.26 11994 84.16
4 Several times a month 1344 9.43 13338 93.59
5 Several times a week 913 6.41 14251 100.00
Library - Learn things
ST39Q06 Frequency PercentCumulativeFrequency
CumulativePercent
. 387 2.72 387 2.72
1 Never 6436 45.16 6823 47.88
2 A few times a year 3075 21.58 9898 69.45
3 About once a month 1692 11.87 11590 81.33
4 Several times a month 1484 10.41 13074 91.74
5 Several times a week 1177 8.26 14251 100.00
66 LSAY 2009 cohort: wave 1 (2009) – frequency tables

Library - Use internet
ST39Q07 Frequency PercentCumulativeFrequency
CumulativePercent
. 398 2.79 398 2.79
1 Never 3894 27.32 4292 30.12
2 A few times a year 2141 15.02 6433 45.14
3 About once a month 1750 12.28 8183 57.42
4 Several times a month 2337 16.40 10520 73.82
5 Several times a week 3731 26.18 14251 100.00
Library at school
ST40Q01 Frequency PercentCumulativeFrequency
CumulativePercent
. 1042 7.31 1042 7.31
1 No 96 0.67 1138 7.99
2 Yes 13113 92.01 14251 100.00
NCVER
67

Section 8: Your strategies in reading and understanding texts
Text - Easy to Understand
ST41Q01 Frequency PercentCumulativeFrequency
CumulativePercent
. 490 3.44 490 3.44
1 (1) Not useful at all 773 5.42 1263 8.86
2 (2) 2375 16.67 3638 25.53
3 (3) 4658 32.69 8296 58.21
4 (4) 3343 23.46 11639 81.67
5 (5) 1532 10.75 13171 92.42
6 (6) Very Useful 1080 7.58 14251 100.00
Text - Read twice
ST41Q02 Frequency PercentCumulativeFrequency
CumulativePercent
. 499 3.50 499 3.50
1 (1) Not useful at all 2333 16.37 2832 19.87
2 (2) 4026 28.25 6858 48.12
3 (3) 3568 25.04 10426 73.16
4 (4) 2244 15.75 12670 88.91
5 (5) 1003 7.04 13673 95.94
6 (6) Very Useful 578 4.06 14251 100.00
68 LSAY 2009 cohort: wave 1 (2009) – frequency tables

Text - Discuss content
ST41Q03 Frequency PercentCumulativeFrequency
CumulativePercent
. 525 3.68 525 3.68
1 (1) Not useful at all 1212 8.50 1737 12.19
2 (2) 2055 14.42 3792 26.61
3 (3) 2981 20.92 6773 47.53
4 (4) 3303 23.18 10076 70.70
5 (5) 2633 18.48 12709 89.18
6 (6) Very Useful 1542 10.82 14251 100.00
Text - Underline
ST41Q04 Frequency PercentCumulativeFrequency
CumulativePercent
. 524 3.68 524 3.68
1 (1) Not useful at all 929 6.52 1453 10.20
2 (2) 1441 10.11 2894 20.31
3 (3) 2272 15.94 5166 36.25
4 (4) 3062 21.49 8228 57.74
5 (5) 3254 22.83 11482 80.57
6 (6) Very Useful 2769 19.43 14251 100.00
Text - Summarise
ST41Q05 Frequency PercentCumulativeFrequency
CumulativePercent
. 513 3.60 513 3.60
1 (1) Not useful at all 861 6.04 1374 9.64
2 (2) 1544 10.83 2918 20.48
3 (3) 2549 17.89 5467 38.36
4 (4) 2949 20.69 8416 59.06
5 (5) 3115 21.86 11531 80.91
6 (6) Very Useful 2720 19.09 14251 100.00
NCVER
69

Text - Read aloud
ST41Q06 Frequency PercentCumulativeFrequency
CumulativePercent
. 507 3.56 507 3.56
1 (1) Not useful at all 3209 22.52 3716 26.08
2 (2) 3265 22.91 6981 48.99
3 (3) 2993 21.00 9974 69.99
4 (4) 2106 14.78 12080 84.77
5 (5) 1400 9.82 13480 94.59
6 (6) Very Useful 771 5.41 14251 100.00
Summary - Check paragraph
ST42Q01 Frequency PercentCumulativeFrequency
CumulativePercent
. 568 3.99 568 3.99
1 (1) Not useful at all 1026 7.20 1594 11.19
2 (2) 1912 13.42 3506 24.60
3 (3) 3745 26.28 7251 50.88
4 (4) 3298 23.14 10549 74.02
5 (5) 2211 15.51 12760 89.54
6 (6) Very Useful 1491 10.46 14251 100.00
Summary - Copy accurately
ST42Q02 Frequency PercentCumulativeFrequency
CumulativePercent
. 587 4.12 587 4.12
1 (1) Not useful at all 2402 16.85 2989 20.97
2 (2) 3920 27.51 6909 48.48
3 (3) 3684 25.85 10593 74.33
4 (4) 2291 16.08 12884 90.41
5 (5) 939 6.59 13823 97.00
6 (6) Very Useful 428 3.00 14251 100.00
70 LSAY 2009 cohort: wave 1 (2009) – frequency tables

Summary - Read many times
ST42Q03 Frequency PercentCumulativeFrequency
CumulativePercent
. 627 4.40 627 4.40
1 (1) Not useful at all 842 5.91 1469 10.31
2 (2) 2008 14.09 3477 24.40
3 (3) 3453 24.23 6930 48.63
4 (4) 3404 23.89 10334 72.51
5 (5) 2420 16.98 12754 89.50
6 (6) Very Useful 1497 10.50 14251 100.00
Summary - Check important facts
ST42Q04 Frequency PercentCumulativeFrequency
CumulativePercent
. 597 4.19 597 4.19
1 (1) Not useful at all 416 2.92 1013 7.11
2 (2) 905 6.35 1918 13.46
3 (3) 2167 15.21 4085 28.66
4 (4) 2850 20.00 6935 48.66
5 (5) 3730 26.17 10665 74.84
6 (6) Very Useful 3586 25.16 14251 100.00
Summary - Write own words
ST42Q05 Frequency PercentCumulativeFrequency
CumulativePercent
. 590 4.14 590 4.14
1 (1) Not useful at all 734 5.15 1324 9.29
2 (2) 1184 8.31 2508 17.60
3 (3) 2303 16.16 4811 33.76
4 (4) 2470 17.33 7281 51.09
5 (5) 2960 20.77 10241 71.86
6 (6) Very Useful 4010 28.14 14251 100.00
NCVER
71

Section 9: ICTAt home - Desktop Computer
IC01Q01 Frequency PercentCumulativeFrequency
CumulativePercent
. 476 3.34 476 3.34
1 Yes, I use it 11258 79.00 11734 82.34
2 Yes, but I don't use it 1329 9.33 13063 91.66
3 No 1188 8.34 14251 100.00
At home - Portable laptop
IC01Q02 Frequency PercentCumulativeFrequency
CumulativePercent
. 473 3.32 473 3.32
1 Yes, I use it 8923 62.61 9396 65.93
2 Yes, but I don't use it 1861 13.06 11257 78.99
3 No 2994 21.01 14251 100.00
At home - Internet connection
IC01Q03 Frequency PercentCumulativeFrequency
CumulativePercent
. 500 3.51 500 3.51
1 Yes, I use it 12904 90.55 13404 94.06
2 Yes, but I don't use it 254 1.78 13658 95.84
3 No 593 4.16 14251 100.00
At home - Video games console
IC01Q04 Frequency PercentCumulativeFrequency
CumulativePercent
. 465 3.26 465 3.26
1 Yes, I use it 9413 66.05 9878 69.31
2 Yes, but I don't use it 3007 21.10 12885 90.41
3 No 1366 9.59 14251 100.00
72 LSAY 2009 cohort: wave 1 (2009) – frequency tables

At home - Cell Phone
IC01Q05 Frequency PercentCumulativeFrequency
CumulativePercent
. 451 3.16 451 3.16
1 Yes, I use it 12885 90.41 13336 93.58
2 Yes, but I don't use it 684 4.80 14020 98.38
3 No 231 1.62 14251 100.00
At home - Mp3/Mp4 Player
IC01Q06 Frequency PercentCumulativeFrequency
CumulativePercent
. 467 3.28 467 3.28
1 Yes, I use it 12416 87.12 12883 90.40
2 Yes, but I don't use it 775 5.44 13658 95.84
3 No 593 4.16 14251 100.00
At home - Printer
IC01Q07 Frequency PercentCumulativeFrequency
CumulativePercent
. 475 3.33 475 3.33
1 Yes, I use it 11590 81.33 12065 84.66
2 Yes, but I don't use it 1251 8.78 13316 93.44
3 No 935 6.56 14251 100.00
At home - USB (memory) stick
IC01Q08 Frequency PercentCumulativeFrequency
CumulativePercent
. 458 3.21 458 3.21
1 Yes, I use it 11884 83.39 12342 86.60
2 Yes, but I don't use it 1371 9.62 13713 96.22
3 No 538 3.78 14251 100.00
NCVER
73

At School - Desktop Computer
IC02Q01 Frequency PercentCumulativeFrequency
CumulativePercent
. 543 3.81 543 3.81
1 Yes, I use it 12225 85.78 12768 89.59
2 Yes, but I don't use it 1290 9.05 14058 98.65
3 No 193 1.35 14251 100.00
At School - Portable laptop
IC02Q02 Frequency PercentCumulativeFrequency
CumulativePercent
. 616 4.32 616 4.32
1 Yes, I use it 5186 36.39 5802 40.71
2 Yes, but I don't use it 2833 19.88 8635 60.59
3 No 5616 39.41 14251 100.00
At School - Internet connection
IC02Q03 Frequency PercentCumulativeFrequency
CumulativePercent
. 537 3.77 537 3.77
1 Yes, I use it 12778 89.66 13315 93.43
2 Yes, but I don't use it 802 5.63 14117 99.06
3 No 134 0.94 14251 100.00
At School - Printer
IC02Q04 Frequency PercentCumulativeFrequency
CumulativePercent
. 542 3.80 542 3.80
1 Yes, I use it 12007 84.25 12549 88.06
2 Yes, but I don't use it 1537 10.79 14086 98.84
3 No 165 1.16 14251 100.00
74 LSAY 2009 cohort: wave 1 (2009) – frequency tables

At School - USB (memory) stick
IC02Q05 Frequency PercentCumulativeFrequency
CumulativePercent
. 593 4.16 593 4.16
1 Yes, I use it 5185 36.38 5778 40.54
2 Yes, but I don't use it 1853 13.00 7631 53.55
3 No 6620 46.45 14251 100.00
Ever Used Computer
IC03Q01 Frequency PercentCumulativeFrequency
CumulativePercent
. 682 4.79 682 4.79
1 Yes 13515 94.84 14197 99.62
2 No 54 0.38 14251 100.00
At Home - One Player Games
IC04Q01 Frequency PercentCumulativeFrequency
CumulativePercent
. 553 3.88 553 3.88
1 Never or hardly ever 4532 31.80 5085 35.68
2 Once or twice a month 3685 25.86 8770 61.54
3 Once or twice a week 3548 24.90 12318 86.44
4 Almost every day 1933 13.56 14251 100.00
At Home - Collaborative Games
IC04Q02 Frequency PercentCumulativeFrequency
CumulativePercent
. 612 4.29 612 4.29
1 Never or hardly ever 7231 50.74 7843 55.03
2 Once or twice a month 2677 18.78 10520 73.82
3 Once or twice a week 2162 15.17 12682 88.99
4 Almost every day 1569 11.01 14251 100.00
NCVER
75

At Home - Homework
IC04Q03 Frequency PercentCumulativeFrequency
CumulativePercent
. 575 4.03 575 4.03
1 Never or hardly ever 991 6.95 1566 10.99
2 Once or twice a month 2565 18.00 4131 28.99
3 Once or twice a week 5870 41.19 10001 70.18
4 Almost every day 4250 29.82 14251 100.00
At Home - Use email
IC04Q04 Frequency PercentCumulativeFrequency
CumulativePercent
. 598 4.20 598 4.20
1 Never or hardly ever 1397 9.80 1995 14.00
2 Once or twice a month 2055 14.42 4050 28.42
3 Once or twice a week 4448 31.21 8498 59.63
4 Almost every day 5753 40.37 14251 100.00
At Home - Chat on line
IC04Q05 Frequency PercentCumulativeFrequency
CumulativePercent
. 598 4.20 598 4.20
1 Never or hardly ever 1940 13.61 2538 17.81
2 Once or twice a month 1196 8.39 3734 26.20
3 Once or twice a week 2895 20.31 6629 46.52
4 Almost every day 7622 53.48 14251 100.00
At Home - Browse for fun
IC04Q06 Frequency PercentCumulativeFrequency
CumulativePercent
. 571 4.01 571 4.01
1 Never or hardly ever 928 6.51 1499 10.52
2 Once or twice a month 1884 13.22 3383 23.74
3 Once or twice a week 4332 30.40 7715 54.14
4 Almost every day 6536 45.86 14251 100.00
76 LSAY 2009 cohort: wave 1 (2009) – frequency tables

At Home - Download music
IC04Q07 Frequency PercentCumulativeFrequency
CumulativePercent
. 572 4.01 572 4.01
1 Never or hardly ever 2078 14.58 2650 18.60
2 Once or twice a month 2631 18.46 5281 37.06
3 Once or twice a week 4151 29.13 9432 66.18
4 Almost every day 4819 33.82 14251 100.00
At Home - Website
IC04Q08 Frequency PercentCumulativeFrequency
CumulativePercent
. 598 4.20 598 4.20
1 Never or hardly ever 7141 50.11 7739 54.30
2 Once or twice a month 1899 13.33 9638 67.63
3 Once or twice a week 2197 15.42 11835 83.05
4 Almost every day 2416 16.95 14251 100.00
At Home - Online forums
IC04Q09 Frequency PercentCumulativeFrequency
CumulativePercent
. 587 4.12 587 4.12
1 Never or hardly ever 3908 27.42 4495 31.54
2 Once or twice a month 1498 10.51 5993 42.05
3 Once or twice a week 2855 20.03 8848 62.09
4 Almost every day 5403 37.91 14251 100.00
At Home - Internet for School
IC05Q01 Frequency PercentCumulativeFrequency
CumulativePercent
. 646 4.53 646 4.53
1 Never or hardly ever 1258 8.83 1904 13.36
2 Once or twice a month 3303 23.18 5207 36.54
3 Once or twice a week 5845 41.01 11052 77.55
4 Almost every day 3199 22.45 14251 100.00
NCVER
77

At Home - Email students
IC05Q02 Frequency PercentCumulativeFrequency
CumulativePercent
. 656 4.60 656 4.60
1 Never or hardly ever 5445 38.21 6101 42.81
2 Once or twice a month 3646 25.58 9747 68.40
3 Once or twice a week 2962 20.78 12709 89.18
4 Almost every day 1542 10.82 14251 100.00
At Home - Email teachers
IC05Q03 Frequency PercentCumulativeFrequency
CumulativePercent
. 680 4.77 680 4.77
1 Never or hardly ever 7542 52.92 8222 57.69
2 Once or twice a month 3727 26.15 11949 83.85
3 Once or twice a week 1714 12.03 13663 95.87
4 Almost every day 588 4.13 14251 100.00
At Home - Download from school
IC05Q04 Frequency PercentCumulativeFrequency
CumulativePercent
. 655 4.60 655 4.60
1 Never or hardly ever 8055 56.52 8710 61.12
2 Once or twice a month 3143 22.05 11853 83.17
3 Once or twice a week 1729 12.13 13582 95.31
4 Almost every day 669 4.69 14251 100.00
At Home - Announcements
IC05Q05 Frequency PercentCumulativeFrequency
CumulativePercent
. 666 4.67 666 4.67
1 Never or hardly ever 10120 71.01 10786 75.69
2 Once or twice a month 2010 14.10 12796 89.79
3 Once or twice a week 1051 7.37 13847 97.17
4 Almost every day 404 2.83 14251 100.00
78 LSAY 2009 cohort: wave 1 (2009) – frequency tables

At School - Chat
IC06Q01 Frequency PercentCumulativeFrequency
CumulativePercent
. 699 4.90 699 4.90
1 Never or hardly ever 11006 77.23 11705 82.13
2 Once or twice a month 1248 8.76 12953 90.89
3 Once or twice a week 911 6.39 13864 97.28
4 Almost every day 387 2.72 14251 100.00
At School - Email
IC06Q02 Frequency PercentCumulativeFrequency
CumulativePercent
. 747 5.24 747 5.24
1 Never or hardly ever 5426 38.07 6173 43.32
2 Once or twice a month 4161 29.20 10334 72.51
3 Once or twice a week 2865 20.10 13199 92.62
4 Almost every day 1052 7.38 14251 100.00
At School - Browse for school
IC06Q03 Frequency PercentCumulativeFrequency
CumulativePercent
. 803 5.63 803 5.63
1 Never or hardly ever 1222 8.57 2025 14.21
2 Once or twice a month 3167 22.22 5192 36.43
3 Once or twice a week 6525 45.79 11717 82.22
4 Almost every day 2534 17.78 14251 100.00
At School - Download from website
IC06Q04 Frequency PercentCumulativeFrequency
CumulativePercent
. 718 5.04 718 5.04
1 Never or hardly ever 7823 54.89 8541 59.93
2 Once or twice a month 2849 19.99 11390 79.92
3 Once or twice a week 2091 14.67 13481 94.60
4 Almost every day 770 5.40 14251 100.00
NCVER
79

At School - Post on website
IC06Q05 Frequency PercentCumulativeFrequency
CumulativePercent
. 729 5.12 729 5.12
1 Never or hardly ever 11469 80.48 12198 85.59
2 Once or twice a month 1216 8.53 13414 94.13
3 Once or twice a week 612 4.29 14026 98.42
4 Almost every day 225 1.58 14251 100.00
At School - Simulations
IC06Q06 Frequency PercentCumulativeFrequency
CumulativePercent
. 766 5.38 766 5.38
1 Never or hardly ever 8866 62.21 9632 67.59
2 Once or twice a month 2454 17.22 12086 84.81
3 Once or twice a week 1654 11.61 13740 96.41
4 Almost every day 511 3.59 14251 100.00
At School - Practice and Drilling
IC06Q07 Frequency PercentCumulativeFrequency
CumulativePercent
. 747 5.24 747 5.24
1 Never or hardly ever 9922 69.62 10669 74.86
2 Once or twice a month 2275 15.96 12944 90.83
3 Once or twice a week 1012 7.10 13956 97.93
4 Almost every day 295 2.07 14251 100.00
At School - Homework
IC06Q08 Frequency PercentCumulativeFrequency
CumulativePercent
. 745 5.23 745 5.23
1 Never or hardly ever 3506 24.60 4251 29.83
2 Once or twice a month 4585 32.17 8836 62.00
3 Once or twice a week 4163 29.21 12999 91.21
4 Almost every day 1252 8.79 14251 100.00
80 LSAY 2009 cohort: wave 1 (2009) – frequency tables

At School - Group Work
IC06Q09 Frequency PercentCumulativeFrequency
CumulativePercent
. 734 5.15 734 5.15
1 Never or hardly ever 5021 35.23 5755 40.38
2 Once or twice a month 4757 33.38 10512 73.76
3 Once or twice a week 2945 20.67 13457 94.43
4 Almost every day 794 5.57 14251 100.00
Time - Language Lessons
IC07Q01 Frequency PercentCumulativeFrequency
CumulativePercent
. 806 5.66 806 5.66
1 No time 5720 40.14 6526 45.79
0-30 minutes a week 4407 30.92 10933 76.72
31-60 minutes a week 2342 16.43 13275 93.15
4 More than 60 minutes a week 976 6.85 14251 100.00
Time - Mathematics Lessons
IC07Q02 Frequency PercentCumulativeFrequency
CumulativePercent
. 821 5.76 821 5.76
1 No time 9608 67.42 10429 73.18
0-30 minutes a week 2379 16.69 12808 89.87
31-60 minutes a week 1090 7.65 13898 97.52
4 More than 60 minutes a week 353 2.48 14251 100.00
Time - Science Lessons
IC07Q03 Frequency PercentCumulativeFrequency
CumulativePercent
. 846 5.94 846 5.94
1 No time 7284 51.11 8130 57.05
0-30 minutes a week 3839 26.94 11969 83.99
31-60 minutes a week 1691 11.87 13660 95.85
4 More than 60 minutes a week 591 4.15 14251 100.00
NCVER
81

Time - Other Language Lessons
IC07Q04 Frequency PercentCumulativeFrequency
CumulativePercent
. 940 6.60 940 6.60
1 No time 11535 80.94 12475 87.54
0-30 minutes a week 1033 7.25 13508 94.79
31-60 minutes a week 472 3.31 13980 98.10
4 More than 60 minutes a week 271 1.90 14251 100.00
How well - Edit graphics
IC08Q01 Frequency PercentCumulativeFrequency
CumulativePercent
. 860 6.03 860 6.03
1 Do well by myself 7783 54.61 8643 60.65
2 Do with Help 3842 26.96 12485 87.61
3 Know but can't do 1439 10.10 13924 97.71
4 Don’t know 327 2.29 14251 100.00
How well - Create database
IC08Q02 Frequency PercentCumulativeFrequency
CumulativePercent
. 878 6.16 878 6.16
1 Do well by myself 3487 24.47 4365 30.63
2 Do with Help 4098 28.76 8463 59.39
3 Know but can't do 3147 22.08 11610 81.47
4 Don’t know 2641 18.53 14251 100.00
How well - Plot Graph
IC08Q03 Frequency PercentCumulativeFrequency
CumulativePercent
. 918 6.44 918 6.44
1 Do well by myself 7404 51.95 8322 58.40
2 Do with Help 3805 26.70 12127 85.10
3 Know but can't do 1482 10.40 13609 95.50
4 Don’t know 642 4.50 14251 100.00
82 LSAY 2009 cohort: wave 1 (2009) – frequency tables

How well - Presentation
IC08Q04 Frequency PercentCumulativeFrequency
CumulativePercent
. 887 6.22 887 6.22
1 Do well by myself 11933 83.73 12820 89.96
2 Do with Help 945 6.63 13765 96.59
3 Know but can't do 309 2.17 14074 98.76
4 Don’t know 177 1.24 14251 100.00
How well - Multi Media
IC08Q05 Frequency PercentCumulativeFrequency
CumulativePercent
. 882 6.19 882 6.19
1 Do well by myself 8101 56.85 8983 63.03
2 Do with Help 3807 26.71 12790 89.75
3 Know but can't do 1195 8.39 13985 98.13
4 Don’t know 266 1.87 14251 100.00
Time outside lessons
IC09Q01 Frequency PercentCumulativeFrequency
CumulativePercent
. 1070 7.51 1070 7.51
1 Never 7249 50.87 8319 58.37
2 Half hour a week 2331 16.36 10650 74.73
3 Hour a week 1081 7.59 11731 82.32
4 Two hours a week 772 5.42 12503 87.73
5 Three hours a week 538 3.78 13041 91.51
6 Four hours or more a week 1210 8.49 14251 100.00
NCVER
83

Attitudes - Very Important
IC10Q01 Frequency PercentCumulativeFrequency
CumulativePercent
. 967 6.79 967 6.79
1 Strongly disagree 382 2.68 1349 9.47
2 Disagree 2280 16.00 3629 25.46
3 Agree 6548 45.95 10177 71.41
4 Strongly agree 4074 28.59 14251 100.00
Attitudes - Really Fun
IC10Q02 Frequency PercentCumulativeFrequency
CumulativePercent
. 974 6.83 974 6.83
1 Strongly disagree 297 2.08 1271 8.92
2 Disagree 1747 12.26 3018 21.18
3 Agree 7526 52.81 10544 73.99
4 Strongly agree 3707 26.01 14251 100.00
Attitudes - Very Interested
IC10Q03 Frequency PercentCumulativeFrequency
CumulativePercent
. 992 6.96 992 6.96
1 Strongly disagree 1046 7.34 2038 14.30
2 Disagree 5869 41.18 7907 55.48
3 Agree 4331 30.39 12238 85.87
4 Strongly agree 2013 14.13 14251 100.00
Attitudes - Lose track of time
IC10Q04 Frequency PercentCumulativeFrequency
CumulativePercent
. 988 6.93 988 6.93
1 Strongly disagree 738 5.18 1726 12.11
2 Disagree 3801 26.67 5527 38.78
3 Agree 5689 39.92 11216 78.70
4 Strongly agree 3035 21.30 14251 100.00
84 LSAY 2009 cohort: wave 1 (2009) – frequency tables

Section 10: Educational careerMiss 2 months of <ISCED 1>
EC01Q01 Frequency PercentCumulativeFrequency
CumulativePercent
. 923 6.48 923 6.48
1 No, never 11373 79.80 12296 86.28
2 Yes, once 1499 10.52 13795 96.80
3 Yes, twice or more 456 3.20 14251 100.00
Miss 2 months of <ISCED 2>
EC02Q01 Frequency PercentCumulativeFrequency
CumulativePercent
. 930 6.53 930 6.53
1 No, never 11683 81.98 12613 88.51
2 Yes, once 1279 8.97 13892 97.48
3 Yes, twice or more 359 2.52 14251 100.00
Change schools in <ISCED1>
EC03Q01 Frequency PercentCumulativeFrequency
CumulativePercent
. 917 6.43 917 6.43
1 No, never 7226 50.71 8143 57.14
2 Yes, once 3712 26.05 11855 83.19
3 Yes, twice or more 2396 16.81 14251 100.00
Change schools in <ISCED2>
EC04Q01 Frequency PercentCumulativeFrequency
CumulativePercent
. 943 6.62 943 6.62
1 No, never 10138 71.14 11081 77.76
2 Yes, once 2437 17.10 13518 94.86
3 Yes, twice or more 733 5.14 14251 100.00
NCVER
85

Expected completed levels <ISCED level 2
EC05Q01A Frequency PercentCumulativeFrequency
CumulativePercent
. 146 1.02 146 1.02
1 Tick 5938 41.67 6084 42.69
2 No Tick 8167 57.31 14251 100.00
Expected completed levels <ISCED level 3B or C
EC05Q01B Frequency PercentCumulativeFrequency
CumulativePercent
. 146 1.02 146 1.02
1 Tick 2083 14.62 2229 15.64
2 No Tick 12022 84.36 14251 100.00
Expected completed levels <ISCED level 3A
EC05Q01C Frequency PercentCumulativeFrequency
CumulativePercent
. 146 1.02 146 1.02
1 Tick 8750 61.40 8896 62.42
2 No Tick 5355 37.58 14251 100.00
Expected completed levels <ISCED level 4
EC05Q01D Frequency PercentCumulativeFrequency
CumulativePercent
. 146 1.02 146 1.02
1 Tick 1994 13.99 2140 15.02
2 No Tick 12111 84.98 14251 100.00
Expected completed levels <ISCED level 5B
EC05Q01E Frequency PercentCumulativeFrequency
CumulativePercent
. 146 1.02 146 1.02
1 Tick 1699 11.92 1845 12.95
2 No Tick 12406 87.05 14251 100.00
86 LSAY 2009 cohort: wave 1 (2009) – frequency tables

Expected completed levels <ISCED level 5A or 6
EC05Q01F Frequency PercentCumulativeFrequency
CumulativePercent
. 146 1.02 146 1.02
1 Tick 7868 55.21 8014 56.23
2 No Tick 6237 43.77 14251 100.00
Enrichment in <test language>
EC06Q01 Frequency PercentCumulativeFrequency
CumulativePercent
. 1416 9.94 1416 9.94
1 Yes 1092 7.66 2508 17.60
2 No 11743 82.40 14251 100.00
Remedial in <test language>
EC06Q02 Frequency PercentCumulativeFrequency
CumulativePercent
. 1512 10.61 1512 10.61
1 Yes 622 4.36 2134 14.97
2 No 12117 85.03 14251 100.00
One to one private tutoring
EC06Q03 Frequency PercentCumulativeFrequency
CumulativePercent
. 1291 9.06 1291 9.06
1 Yes 2088 14.65 3379 23.71
2 No 10872 76.29 14251 100.00
Report Mark
EC07Q01 Frequency PercentCumulativeFrequency
CumulativePercent
. 14251 100.00 14251 100.00
NCVER
87

Reading for school Reading Texts - Information
RFS1Q01 Frequency PercentCumulativeFrequency
CumulativePercent
. 877 6.15 877 6.15
1 Many times 2348 16.48 3225 22.63
2 Two or three times 4841 33.97 8066 56.60
3 Once 3434 24.10 11500 80.70
4 Not at all 2751 19.30 14251 100.00
Reading Texts - Poetry
RFS1Q02 Frequency PercentCumulativeFrequency
CumulativePercent
. 886 6.22 886 6.22
1 Many times 2070 14.53 2956 20.74
2 Two or three times 2782 19.52 5738 40.26
3 Once 2632 18.47 8370 58.73
4 Not at all 5881 41.27 14251 100.00
Reading Texts - Diagrams
RFS1Q03 Frequency PercentCumulativeFrequency
CumulativePercent
. 956 6.71 956 6.71
1 Many times 3696 25.94 4652 32.64
2 Two or three times 4767 33.45 9419 66.09
3 Once 2759 19.36 12178 85.45
4 Not at all 2073 14.55 14251 100.00
88 LSAY 2009 cohort: wave 1 (2009) – frequency tables

Reading Texts - Fiction
RFS1Q04 Frequency PercentCumulativeFrequency
CumulativePercent
. 939 6.59 939 6.59
1 Many times 3995 28.03 4934 34.62
2 Two or three times 4259 29.89 9193 64.51
3 Once 3223 22.62 12416 87.12
4 Not at all 1835 12.88 14251 100.00
Reading Texts - Newspapers
RFS1Q05 Frequency PercentCumulativeFrequency
CumulativePercent
. 925 6.49 925 6.49
1 Many times 2845 19.96 3770 26.45
2 Two or three times 4198 29.46 7968 55.91
3 Once 3131 21.97 11099 77.88
4 Not at all 3152 22.12 14251 100.00
Reading Texts - Manuals
RFS1Q06 Frequency PercentCumulativeFrequency
CumulativePercent
. 896 6.29 896 6.29
1 Many times 1465 10.28 2361 16.57
2 Two or three times 2740 19.23 5101 35.79
3 Once 3239 22.73 8340 58.52
4 Not at all 5911 41.48 14251 100.00
Reading Texts - Tables
RFS1Q07 Frequency PercentCumulativeFrequency
CumulativePercent
. 935 6.56 935 6.56
1 Many times 4733 33.21 5668 39.77
2 Two or three times 4615 32.38 10283 72.16
3 Once 2548 17.88 12831 90.04
4 Not at all 1420 9.96 14251 100.00
NCVER
89

Reading Texts - Advertising
RFS1Q08 Frequency PercentCumulativeFrequency
CumulativePercent
. 897 6.29 897 6.29
1 Many times 2420 16.98 3317 23.28
2 Two or three times 3706 26.01 7023 49.28
3 Once 3542 24.85 10565 74.14
4 Not at all 3686 25.86 14251 100.00
Reading Tasks - Find information
RFS2Q01 Frequency PercentCumulativeFrequency
CumulativePercent
. 861 6.04 861 6.04
1 Many times 5210 36.56 6071 42.60
2 Two or three times 4537 31.84 10608 74.44
3 Once 2208 15.49 12816 89.93
4 Not at all 1435 10.07 14251 100.00
Reading Tasks - Explain cause
RFS2Q02 Frequency PercentCumulativeFrequency
CumulativePercent
. 883 6.20 883 6.20
1 Many times 3762 26.40 4645 32.59
2 Two or three times 4985 34.98 9630 67.57
3 Once 2891 20.29 12521 87.86
4 Not at all 1730 12.14 14251 100.00
Reading Tasks - Explain behaviour
RFS2Q03 Frequency PercentCumulativeFrequency
CumulativePercent
. 908 6.37 908 6.37
1 Many times 4582 32.15 5490 38.52
2 Two or three times 4316 30.29 9806 68.81
3 Once 2547 17.87 12353 86.68
4 Not at all 1898 13.32 14251 100.00
90 LSAY 2009 cohort: wave 1 (2009) – frequency tables

Reading Tasks - Learn about writer
RFS2Q04 Frequency PercentCumulativeFrequency
CumulativePercent
. 940 6.60 940 6.60
1 Many times 1016 7.13 1956 13.73
2 Two or three times 2114 14.83 4070 28.56
3 Once 3636 25.51 7706 54.07
4 Not at all 6545 45.93 14251 100.00
Reading Tasks - Explain purpose
RFS2Q05 Frequency PercentCumulativeFrequency
CumulativePercent
. 920 6.46 920 6.46
1 Many times 4173 29.28 5093 35.74
2 Two or three times 4450 31.23 9543 66.96
3 Once 2928 20.55 12471 87.51
4 Not at all 1780 12.49 14251 100.00
Reading Tasks - Memorise text
RFS2Q06 Frequency PercentCumulativeFrequency
CumulativePercent
. 935 6.56 935 6.56
1 Many times 878 6.16 1813 12.72
2 Two or three times 1556 10.92 3369 23.64
3 Once 2818 19.77 6187 43.41
4 Not at all 8064 56.59 14251 100.00
Reading Tasks - Learn history
RFS2Q07 Frequency PercentCumulativeFrequency
CumulativePercent
. 969 6.80 969 6.80
1 Many times 1416 9.94 2385 16.74
2 Two or three times 2926 20.53 5311 37.27
3 Once 3818 26.79 9129 64.06
4 Not at all 5122 35.94 14251 100.00
NCVER
91

Reading Tasks - Describe table
RFS2Q08 Frequency PercentCumulativeFrequency
CumulativePercent
. 918 6.44 918 6.44
1 Many times 2106 14.78 3024 21.22
2 Two or three times 3623 25.42 6647 46.64
3 Once 3691 25.90 10338 72.54
4 Not at all 3913 27.46 14251 100.00
Reading Tasks - Explain connection
RFS2Q09 Frequency PercentCumulativeFrequency
CumulativePercent
. 875 6.14 875 6.14
1 Many times 2087 14.64 2962 20.78
2 Two or three times 3559 24.97 6521 45.76
3 Once 3545 24.88 10066 70.63
4 Not at all 4185 29.37 14251 100.00
92 LSAY 2009 cohort: wave 1 (2009) – frequency tables

Section 11: Time spent learning
Time learn - science
ST60N01 Frequency PercentCumulativeFrequency
CumulativePercent
1 No time 3601 25.27 3601 25.27
2 Less than 2 hours a week 5480 38.45 9081 63.72
2 or more but less than 4 hours a week 2675 18.77 11756 82.49
4 or more but less than 6 hours a week 981 6.88 12737 89.38
6 or more hours a week 355 2.49 13092 91.87
9 Missing 1159 8.13 14251 100.00
Time learn - maths
ST60N02 Frequency PercentCumulativeFrequency
CumulativePercent
1 No time 1970 13.82 1970 13.82
2 Less than 2 hours a week 5214 36.59 7184 50.41
2 or more but less than 4 hours a week 3680 25.82 10864 76.23
4 or more but less than 6 hours a week 1678 11.77 12542 88.01
6 or more hours a week 590 4.14 13132 92.15
9 Missing 1119 7.85 14251 100.00
Time learn - other
ST60N03 Frequency PercentCumulativeFrequency
CumulativePercent
1 No time 1580 11.09 1580 11.09
2 Less than 2 hours a week 4634 32.52 6214 43.60
2 or more but less than 4 hours a week 3747 26.29 9961 69.90
4 or more but less than 6 hours a week 2120 14.88 12081 84.77
6 or more hours a week 1063 7.46 13144 92.23
9 Missing 1107 7.77 14251 100.00
NCVER
93

Section 12: Out-of-school activities
OutSch - Work paid job
ST61N01 Frequency PercentCumulativeFrequency
CumulativePercent
0 to 998 hours 12416 87.12 12416 87.12
999 Missing 1835 12.88 14251 100.00
Analysis Variable : ST61N01 OutSch - Work paid job
N Mean Median Std Dev Minimum Maximum
12416 5.03 0.00 8.61 0.00 123.00
OutSch - Watch TV
ST61N02 Frequency PercentCumulativeFrequency
CumulativePercent
0 to 998 hours 12817 89.94 12817 89.94
999 Missing 1434 10.06 14251 100.00
Analysis Variable : ST61N02 OutSch - Watch TV
N Mean Median Std Dev Minimum Maximum
12817 12.49 9.00 14.96 0.00 150.00
OutSch - Listen music
ST61N03 Frequency PercentCumulativeFrequency
CumulativePercent
0 to 998 hours 12690 89.05 12690 89.05
999 Missing 1561 10.95 14251 100.00
Analysis Variable : ST61N03 OutSch - Listen music
N Mean Median Std Dev Minimum Maximum
12690 16.19 10.00 21.65 0.00 150.00
94 LSAY 2009 cohort: wave 1 (2009) – frequency tables

OutSch - Play sport
ST61N04 Frequency PercentCumulativeFrequency
CumulativePercent
0 to 998 hours 12728 89.31 12728 89.31
999 Missing 1523 10.69 14251 100.00
Analysis Variable : ST61N04 OutSch - Play sport
N Mean Median Std Dev Minimum Maximum
12728 7.43 5.00 12.18 0.00 150.00
OutSch - Read pleasure
ST61N05 Frequency PercentCumulativeFrequency
CumulativePercent
0 to 998 hours 12666 88.88 12666 88.88
999 Missing 1585 11.12 14251 100.00
Analysis Variable : ST61N05 OutSch - Read pleasure
N Mean Median Std Dev Minimum Maximum
12666 3.64 1.00 8.48 0.00 138.00
OutSch - Unpaid/voluntary work
ST61N06 Frequency PercentCumulativeFrequency
CumulativePercent
0 to 998 hours 12463 87.45 12463 87.45
999 Missing 1788 12.55 14251 100.00
Analysis Variable : ST61N06 OutSch - Unpaid/voluntary work
N Mean Median Std Dev Minimum Maximum
12463 1.35 0.00 5.70 0.00 131.00
OutSch - Using internet pleasure
ST61N07 Frequency PercentCumulativeFrequency
CumulativePercent
0 to 998 hours 12720 89.26 12720 89.26
999 Missing 1531 10.74 14251 100.00
NCVER
95

Analysis Variable : ST61N07 OutSch - Using internet pleasure
N Mean Median Std Dev Minimum Maximum
12720 14.71 10.00 18.69 0.00 150.00
96 LSAY 2009 cohort: wave 1 (2009) – frequency tables

Section 13: Your life at schoolHow well doing - English
ST62N01 Frequency PercentCumulativeFrequency
CumulativePercent
1 Very well 2220 15.58 2220 15.58
2 Better than average 3635 25.51 5855 41.08
3 About average 5894 41.36 11749 82.44
4 Not very well 1020 7.16 12769 89.60
5 Very poorly 229 1.61 12998 91.21
6 Not studying this subject 34 0.24 13032 91.45
9 Missing 1219 8.55 14251 100.00
How well doing - Maths
ST62N02 Frequency PercentCumulativeFrequency
CumulativePercent
1 Very well 2311 16.22 2311 16.22
2 Better than average 3298 23.14 5609 39.36
3 About average 5111 35.86 10720 75.22
4 Not very well 1772 12.43 12492 87.66
5 Very poorly 420 2.95 12912 90.60
6 Not studying this subject 105 0.74 13017 91.34
9 Missing 1234 8.66 14251 100.00
How well doing - Science
ST62N03 Frequency PercentCumulativeFrequency
CumulativePercent
1 Very well 1893 13.28 1893 13.28
2 Better than average 2907 20.40 4800 33.68
3 About average 5041 35.37 9841 69.05
4 Not very well 1425 10.00 11266 79.05
5 Very poorly 355 2.49 11621 81.55
6 Not studying this subject 1360 9.54 12981 91.09
9 Missing 1270 8.91 14251 100.00
NCVER
97

How well doing - Subjects overall
ST62N04 Frequency PercentCumulativeFrequency
CumulativePercent
1 Very well 2246 15.76 2246 15.76
2 Better than average 4290 30.10 6536 45.86
3 About average 5689 39.92 12225 85.78
4 Not very well 591 4.15 12816 89.93
5 Very poorly 139 0.98 12955 90.91
6 Not studying this subject 44 0.31 12999 91.21
9 Missing 1252 8.79 14251 100.00
Sch - work interesting
ST63N01 Frequency PercentCumulativeFrequency
CumulativePercent
1 Strongly agree 812 5.70 812 5.70
2 Agree 7573 53.14 8385 58.84
3 Disagree 3887 27.28 12272 86.11
4 Strongly disagree 637 4.47 12909 90.58
9 Missing 1342 9.42 14251 100.00
Sch - teacher fair and just
ST63N02 Frequency PercentCumulativeFrequency
CumulativePercent
1 Strongly agree 1158 8.13 1158 8.13
2 Agree 7571 53.13 8729 61.25
3 Disagree 3464 24.31 12193 85.56
4 Strongly disagree 656 4.60 12849 90.16
9 Missing 1402 9.84 14251 100.00
98 LSAY 2009 cohort: wave 1 (2009) – frequency tables

Sch - things learn are important
ST63N03 Frequency PercentCumulativeFrequency
CumulativePercent
1 Strongly agree 1495 10.49 1495 10.49
2 Agree 8837 62.01 10332 72.50
3 Disagree 2249 15.78 12581 88.28
4 Strongly disagree 261 1.83 12842 90.11
9 Missing 1409 9.89 14251 100.00
Sch - learnt to work hard
ST63N04 Frequency PercentCumulativeFrequency
CumulativePercent
1 Strongly agree 1923 13.49 1923 13.49
2 Agree 8319 58.37 10242 71.87
3 Disagree 2359 16.55 12601 88.42
4 Strongly disagree 256 1.80 12857 90.22
9 Missing 1394 9.78 14251 100.00
Sch - feel happy
ST63N05 Frequency PercentCumulativeFrequency
CumulativePercent
1 Strongly agree 1832 12.86 1832 12.86
2 Agree 8495 59.61 10327 72.47
3 Disagree 2018 14.16 12345 86.63
4 Strongly disagree 479 3.36 12824 89.99
9 Missing 1427 10.01 14251 100.00
Sch - teacher listen to students
ST63N06 Frequency PercentCumulativeFrequency
CumulativePercent
1 Strongly agree 1293 9.07 1293 9.07
2 Agree 9095 63.82 10388 72.89
3 Disagree 2073 14.55 12461 87.44
4 Strongly disagree 336 2.36 12797 89.80
9 Missing 1454 10.20 14251 100.00
NCVER
99

Sch - satisfactory standard in work
ST63N07 Frequency PercentCumulativeFrequency
CumulativePercent
1 Strongly agree 1990 13.96 1990 13.96
2 Agree 8804 61.78 10794 75.74
3 Disagree 1780 12.49 12574 88.23
4 Strongly disagree 218 1.53 12792 89.76
9 Missing 1459 10.24 14251 100.00
Sch - like learning
ST63N08 Frequency PercentCumulativeFrequency
CumulativePercent
1 Strongly agree 1455 10.21 1455 10.21
2 Agree 7639 53.60 9094 63.81
3 Disagree 3140 22.03 12234 85.85
4 Strongly disagree 525 3.68 12759 89.53
9 Missing 1492 10.47 14251 100.00
Sch - get enjoyment
ST63N09 Frequency PercentCumulativeFrequency
CumulativePercent
1 Strongly agree 1316 9.23 1316 9.23
2 Agree 6946 48.74 8262 57.97
3 Disagree 3690 25.89 11952 83.87
4 Strongly disagree 786 5.52 12738 89.38
9 Missing 1513 10.62 14251 100.00
Sch - work I do is good preparation
ST63N10 Frequency PercentCumulativeFrequency
CumulativePercent
1 Strongly agree 2700 18.95 2700 18.95
2 Agree 8199 57.53 10899 76.48
3 Disagree 1542 10.82 12441 87.30
4 Strongly disagree 304 2.13 12745 89.43
9 Missing 1506 10.57 14251 100.00
100 LSAY 2009 cohort: wave 1 (2009) – frequency tables

Sch - like asking questions in class
ST63N11 Frequency PercentCumulativeFrequency
CumulativePercent
1 Strongly agree 1434 10.06 1434 10.06
2 Agree 6374 44.73 7808 54.79
3 Disagree 4283 30.05 12091 84.84
4 Strongly disagree 650 4.56 12741 89.40
9 Missing 1510 10.60 14251 100.00
Sch - teacher give marks I deserve
ST63N12 Frequency PercentCumulativeFrequency
CumulativePercent
1 Strongly agree 1472 10.33 1472 10.33
2 Agree 9028 63.35 10500 73.68
3 Disagree 1923 13.49 12423 87.17
4 Strongly disagree 284 1.99 12707 89.17
9 Missing 1544 10.83 14251 100.00
Sch - acquired skills that will be of use
ST63N13 Frequency PercentCumulativeFrequency
CumulativePercent
1 Strongly agree 2620 18.38 2620 18.38
2 Agree 8642 60.64 11262 79.03
3 Disagree 1202 8.43 12464 87.46
4 Strongly disagree 238 1.67 12702 89.13
9 Missing 1549 10.87 14251 100.00
Sch - always achieve satisfactory standard
ST63N14 Frequency PercentCumulativeFrequency
CumulativePercent
1 Strongly agree 2015 14.14 2015 14.14
2 Agree 7972 55.94 9987 70.08
3 Disagree 2460 17.26 12447 87.34
4 Strongly disagree 229 1.61 12676 88.95
9 Missing 1575 11.05 14251 100.00
NCVER
101

Sch - like extra work
ST63N15 Frequency PercentCumulativeFrequency
CumulativePercent
1 Strongly agree 607 4.26 607 4.26
2 Agree 3127 21.94 3734 26.20
3 Disagree 7007 49.17 10741 75.37
4 Strongly disagree 1938 13.60 12679 88.97
9 Missing 1572 11.03 14251 100.00
Sch - teachers take interest
ST63N16 Frequency PercentCumulativeFrequency
CumulativePercent
1 Strongly agree 755 5.30 755 5.30
2 Agree 5995 42.07 6750 47.37
3 Disagree 5193 36.44 11943 83.80
4 Strongly disagree 696 4.88 12639 88.69
9 Missing 1612 11.31 14251 100.00
Sch - like to go each day
ST63N17 Frequency PercentCumulativeFrequency
CumulativePercent
1 Strongly agree 928 6.51 928 6.51
2 Agree 5051 35.44 5979 41.95
3 Disagree 5431 38.11 11410 80.06
4 Strongly disagree 1226 8.60 12636 88.67
9 Missing 1615 11.33 14251 100.00
Sch - enjoy what I do in class
ST63N18 Frequency PercentCumulativeFrequency
CumulativePercent
1 Strongly agree 868 6.09 868 6.09
2 Agree 7332 51.45 8200 57.54
3 Disagree 3689 25.89 11889 83.43
4 Strongly disagree 678 4.76 12567 88.18
9 Missing 1684 11.82 14251 100.00
102 LSAY 2009 cohort: wave 1 (2009) – frequency tables

Sch - always try best
ST63N19 Frequency PercentCumulativeFrequency
CumulativePercent
1 Strongly agree 2460 17.26 2460 17.26
2 Agree 7562 53.06 10022 70.32
3 Disagree 2283 16.02 12305 86.34
4 Strongly disagree 293 2.06 12598 88.40
9 Missing 1653 11.60 14251 100.00
Sch - things learn help in adult life
ST63N20 Frequency PercentCumulativeFrequency
CumulativePercent
1 Strongly agree 2568 18.02 2568 18.02
2 Agree 8360 58.66 10928 76.68
3 Disagree 1405 9.86 12333 86.54
4 Strongly disagree 294 2.06 12627 88.60
9 Missing 1624 11.40 14251 100.00
Sch - cope with work
ST63N21 Frequency PercentCumulativeFrequency
CumulativePercent
1 Strongly agree 1664 11.68 1664 11.68
2 Agree 8803 61.77 10467 73.45
3 Disagree 1864 13.08 12331 86.53
4 Strongly disagree 283 1.99 12614 88.51
9 Missing 1637 11.49 14251 100.00
Sch - teacher help do best
ST63N22 Frequency PercentCumulativeFrequency
CumulativePercent
1 Strongly agree 1380 9.68 1380 9.68
2 Agree 8734 61.29 10114 70.97
3 Disagree 2152 15.10 12266 86.07
4 Strongly disagree 341 2.39 12607 88.46
9 Missing 1644 11.54 14251 100.00
NCVER
103

Sch - excited about work I do
ST63N23 Frequency PercentCumulativeFrequency
CumulativePercent
1 Strongly agree 496 3.48 496 3.48
2 Agree 3835 26.91 4331 30.39
3 Disagree 6441 45.20 10772 75.59
4 Strongly disagree 1834 12.87 12606 88.46
9 Missing 1645 11.54 14251 100.00
Sch - learning in fun
ST63N24 Frequency PercentCumulativeFrequency
CumulativePercent
1 Strongly agree 627 4.40 627 4.40
2 Agree 5553 38.97 6180 43.37
3 Disagree 5415 38.00 11595 81.36
4 Strongly disagree 913 6.41 12508 87.77
9 Missing 1743 12.23 14251 100.00
Sch - given chance to do interesting work
ST63N25 Frequency PercentCumulativeFrequency
CumulativePercent
1 Strongly agree 1071 7.52 1071 7.52
2 Agree 7523 52.79 8594 60.30
3 Disagree 3266 22.92 11860 83.22
4 Strongly disagree 630 4.42 12490 87.64
9 Missing 1761 12.36 14251 100.00
Sch - know can do well to be successful
ST63N26 Frequency PercentCumulativeFrequency
CumulativePercent
1 Strongly agree 2503 17.56 2503 17.56
2 Agree 8886 62.35 11389 79.92
3 Disagree 912 6.40 12301 86.32
4 Strongly disagree 195 1.37 12496 87.69
9 Missing 1755 12.31 14251 100.00
104 LSAY 2009 cohort: wave 1 (2009) – frequency tables

Sch - things taught worth learning
ST63N27 Frequency PercentCumulativeFrequency
CumulativePercent
1 Strongly agree 1718 12.06 1718 12.06
2 Agree 8575 60.17 10293 72.23
3 Disagree 1838 12.90 12131 85.12
4 Strongly disagree 319 2.24 12450 87.36
9 Missing 1801 12.64 14251 100.00
Sch - feel safe and secure
ST63N28 Frequency PercentCumulativeFrequency
CumulativePercent
1 Strongly agree 2169 15.22 2169 15.22
2 Agree 8686 60.95 10855 76.17
3 Disagree 1272 8.93 12127 85.10
4 Strongly disagree 344 2.41 12471 87.51
9 Missing 1780 12.49 14251 100.00
Sch - teachers treat fairly
ST63N29 Frequency PercentCumulativeFrequency
CumulativePercent
1 Strongly agree 1545 10.84 1545 10.84
2 Agree 8999 63.15 10544 73.99
3 Disagree 1556 10.92 12100 84.91
4 Strongly disagree 353 2.48 12453 87.38
9 Missing 1798 12.62 14251 100.00
Sch - success as student
ST63N30 Frequency PercentCumulativeFrequency
CumulativePercent
1 Strongly agree 2064 14.48 2064 14.48
2 Agree 8138 57.10 10202 71.59
3 Disagree 1891 13.27 12093 84.86
4 Strongly disagree 335 2.35 12428 87.21
9 Missing 1823 12.79 14251 100.00
NCVER
105

Plan to complete Year 12
ST64N01 Frequency PercentCumulativeFrequency
CumulativePercent
1 Yes, I plan to complete Year 12 10684 74.97 10684 74.97
2 No, I do not plan to complete Year 12 659 4.62 11343 79.59
3 I am not sure at this time 1129 7.92 12472 87.52
9 Missing 1779 12.48 14251 100.00
106 LSAY 2009 cohort: wave 1 (2009) – frequency tables

Section 14: Study plans after school
Plans after sch - Your plans
ST65N01 Frequency PercentCumulativeFrequency
CumulativePercent
1 Go to University 4185 29.37 4185 29.37
2 Get an apprenticeship 1040 7.30 5225 36.66
3 Get a traineeship 133 0.93 5358 37.60
4 Go to a TAFE or VET (vocational) college 487 3.42 5845 41.01
5 Do some other study or training 228 1.60 6073 42.61
6 Look for work/get a job 500 3.51 6573 46.12
7 Gap year / time off 1715 12.03 8288 58.16
8 Don't know 856 6.01 9144 64.16
9 Something else 10 0.07 9154 64.23
10 Travel 121 0.85 9275 65.08
11 Self-development in sports or performing arts 131 0.92 9406 66.00
12 Defence force 153 1.07 9559 67.08
99 Missing / no response 4692 32.92 14251 100.00
NCVER
107

Plans after sch - Your parents
ST65N02 Frequency PercentCumulativeFrequency
CumulativePercent
1 Go to university 5029 35.29 5029 35.29
2 Get an apprenticeship 760 5.33 5789 40.62
3 Get a traineeship 121 0.85 5910 41.47
4 Go to a TAFE or VET college 370 2.60 6280 44.07
5 Do some other study or training 215 1.51 6495 45.58
6 Look for work/Get a job 533 3.74 7028 49.32
7 Gap year/Time off 619 4.34 7647 53.66
8 Don't know 1446 10.15 9093 63.81
9 Something else 12 0.08 9105 63.89
10 Travel 19 0.13 9124 64.02
11 Self-development in sports or performing arts 21 0.15 9145 64.17
12 Defence force 45 0.32 9190 64.49
13 Whatever I want - it's my choice 297 2.08 9487 66.57
99 Missing/No response 4764 33.43 14251 100.00
Plans after sch - Friends plans
ST65N03 Frequency PercentCumulativeFrequency
CumulativePercent
1 Go to university 3298 23.14 3298 23.14
2 Get an apprenticeship 845 5.93 4143 29.07
3 Get a traineeship 125 0.88 4268 29.95
4 Go to a TAFE or VET college 436 3.06 4704 33.01
5 Do some other study or training 205 1.44 4909 34.45
6 Look for work/Get a job 492 3.45 5401 37.90
7 Gap year/Time off 1312 9.21 6713 47.11
8 Don't know 2243 15.74 8956 62.84
9 Something else 42 0.29 8998 63.14
10 Travel 33 0.23 9031 63.37
11 Self-development in sports or performing arts 22 0.15 9053 63.53
12 Defence force 17 0.12 9070 63.64
99 Missing/No response 5181 36.36 14251 100.00
108 LSAY 2009 cohort: wave 1 (2009) – frequency tables

Further plans after leave school
ST66N01 Frequency PercentCumulativeFrequency
CumulativePercent
. 146 1.02 146 1.02
1 No 1384 9.71 1530 10.74
2 Yes, university course 6985 49.01 8515 59.75
3 Yes, apprenticeship 1290 9.05 9805 68.80
4 Yes, traineeship 247 1.73 10052 70.54
5 Yes, other TAFE or VET course 1180 8.28 11232 78.82
6 Other 146 1.02 11378 79.84
7 Don't know 96 0.67 11474 80.51
8 Defence force 97 0.68 11571 81.19
9 Performing / Creative arts training 30 0.21 11601 81.40
10 Professional sports 27 0.19 11628 81.59
99 Missing 2623 18.41 14251 100.00
NCVER
109

Section 15: Your views on science
Views on sci - study at sec sch
ST67N01 Frequency PercentCumulativeFrequency
CumulativePercent
1 Strongly agree 2216 15.55 2216 15.55
2 Agree 3637 25.52 5853 41.07
3 Disagree 3398 23.84 9251 64.91
4 Strongly disagree 2674 18.76 11925 83.68
9 Missing 2326 16.32 14251 100.00
Views on sci - study after sec sch
ST67N02 Frequency PercentCumulativeFrequency
CumulativePercent
1 Strongly agree 1566 10.99 1566 10.99
2 Agree 2721 19.09 4287 30.08
3 Disagree 4659 32.69 8946 62.77
4 Strongly disagree 2941 20.64 11887 83.41
9 Missing 2364 16.59 14251 100.00
Views on sci - work in career
ST67N03 Frequency PercentCumulativeFrequency
CumulativePercent
1 Strongly agree 1403 9.84 1403 9.84
2 Agree 2492 17.49 3895 27.33
3 Disagree 4640 32.56 8535 59.89
4 Strongly disagree 3356 23.55 11891 83.44
9 Missing 2360 16.56 14251 100.00
110 LSAY 2009 cohort: wave 1 (2009) – frequency tables

Section 17: WorkANZSCO code - Occupation at 30 years old
anzscoQ69 Frequency PercentCumulativeFrequency
CumulativePercent
0 Don't know 1058 7.42 1058 7.42
991 Student 3 0.02 1061 7.45
995 Home Duties 22 0.15 1083 7.60
1000 to 8999 ANZSCO 4 digit code 9385 65.86 10468 73.45
9000 Inadequate description 417 2.93 10885 76.38
9999 Missing 3366 23.62 14251 100.00
Job - current part-time/casual
ST70N01 Frequency PercentCumulativeFrequency
CumulativePercent
1 Yes, I have a part-time or casual job 4766 33.44 4766 33.44
2 No, I do not currently have a job 6817 47.84 11583 81.28
9 Missing 2668 18.72 14251 100.00
Job - Mon to Fri hours
ST71N01 Frequency PercentCumulativeFrequency
CumulativePercent
. 9485 66.56 9485 66.56
0 to 998 hours 4723 33.14 14208 99.70
999 Missing 43 0.30 14251 100.00
Analysis Variable : ST71N01 Job - Mon to Fri hours
N Mean Median Std Dev Minimum Maximum
4723 5.15 4.00 4.75 0.00 45.00
Job - Sat and Sun hours
ST71N02 Frequency PercentCumulativeFrequency
CumulativePercent
. 9485 66.56 9485 66.56
0 to 998 hours 4723 33.14 14208 99.70
999 Missing 43 0.30 14251 100.00
NCVER
111

Analysis Variable : ST71N02 Job - Sat and Sun hours
N Mean Median Std Dev Minimum Maximum
4723 6.11 6.00 4.28 0.00 36.00
Job - pay (dollars)
ST72N01 Frequency PercentCumulativeFrequency
CumulativePercent
. 9485 66.56 9485 66.56
0 to 9998 dollars 4462 31.31 13947 97.87
9999 Missing 304 2.13 14251 100.00
Analysis Variable : ST72N01 Job - pay (dollars)
N Mean Median Std Dev Minimum Maximum
4462 81.75 60.00 107.61 3.00 2500.00
Job - pay (cents)
ST72N02 Frequency PercentCumulativeFrequency
CumulativePercent
. 9485 66.56 9485 66.56
0 to 98 cents 4457 31.27 13942 97.83
99 Missing 309 2.17 14251 100.00
Analysis Variable : ST72N02 Job - pay (cents)
N Mean Median Std Dev Minimum Maximum
4457 13.95 0.00 26.67 0.00 98.00
Job - pay (frequency)
ST72N03 Frequency PercentCumulativeFrequency
CumulativePercent
. 9485 66.56 9485 66.56
1 Hour 1831 12.85 11316 79.40
2 Week 2362 16.57 13678 95.98
3 Fortnight 201 1.41 13879 97.39
4 Month 35 0.25 13914 97.64
9 Missing 337 2.36 14251 100.00
112 LSAY 2009 cohort: wave 1 (2009) – frequency tables

ANZSCO code - part-time or casual job
anzscoQ73 Frequency PercentCumulativeFrequency
CumulativePercent
. 9485 66.56 9485 66.56
0 Don't know 9 0.06 9494 66.62
1000 to 8999 ANZSCO 4 digit code 4699 32.97 14193 99.59
9000 Inadequate description 58 0.41 14251 100.00
Reasons - work I want to do
ST74N01 Frequency PercentCumulativeFrequency
CumulativePercent
. 9485 66.56 9485 66.56
1 Strongly agree 212 1.49 9697 68.04
2 Agree 513 3.60 10210 71.64
3 Disagree 2188 15.35 12398 87.00
4 Strongly disagree 1688 11.84 14086 98.84
9 Missing 165 1.16 14251 100.00
Reasons - enjoy the work
ST74N02 Frequency PercentCumulativeFrequency
CumulativePercent
. 9485 66.56 9485 66.56
1 Strongly agree 597 4.19 10082 70.75
2 Agree 2655 18.63 12737 89.38
3 Disagree 997 7.00 13734 96.37
4 Strongly disagree 369 2.59 14103 98.96
9 Missing 148 1.04 14251 100.00
NCVER
113

Reasons - family needs money
ST74N03 Frequency PercentCumulativeFrequency
CumulativePercent
. 9485 66.56 9485 66.56
1 Strongly agree 80 0.56 9565 67.12
2 Agree 424 2.98 9989 70.09
3 Disagree 2415 16.95 12404 87.04
4 Strongly disagree 1681 11.80 14085 98.84
9 Missing 166 1.16 14251 100.00
Reasons - sense of independence
ST74N04 Frequency PercentCumulativeFrequency
CumulativePercent
. 9485 66.56 9485 66.56
1 Strongly agree 862 6.05 10347 72.61
2 Agree 2934 20.59 13281 93.19
3 Disagree 619 4.34 13900 97.54
4 Strongly disagree 194 1.36 14094 98.90
9 Missing 157 1.10 14251 100.00
Reasons - help me get a job
ST74N05 Frequency PercentCumulativeFrequency
CumulativePercent
. 9485 66.56 9485 66.56
1 Strongly agree 674 4.73 10159 71.29
2 Agree 2350 16.49 12509 87.78
3 Disagree 1202 8.43 13711 96.21
4 Strongly disagree 377 2.65 14088 98.86
9 Missing 163 1.14 14251 100.00
114 LSAY 2009 cohort: wave 1 (2009) – frequency tables

Reasons - family business
ST74N06 Frequency PercentCumulativeFrequency
CumulativePercent
. 9485 66.56 9485 66.56
1 Strongly agree 145 1.02 9630 67.57
2 Agree 326 2.29 9956 69.86
3 Disagree 2050 14.38 12006 84.25
4 Strongly disagree 2072 14.54 14078 98.79
9 Missing 173 1.21 14251 100.00
Reasons - need money
ST74N07 Frequency PercentCumulativeFrequency
CumulativePercent
. 9485 66.56 9485 66.56
1 Strongly agree 297 2.08 9782 68.64
2 Agree 947 6.65 10729 75.29
3 Disagree 2045 14.35 12774 89.64
4 Strongly disagree 1298 9.11 14072 98.74
9 Missing 179 1.26 14251 100.00
Reasons - own spending money
ST74N08 Frequency PercentCumulativeFrequency
CumulativePercent
. 9485 66.56 9485 66.56
1 Strongly agree 2283 16.02 11768 82.58
2 Agree 2195 15.40 13963 97.98
3 Disagree 80 0.56 14043 98.54
4 Strongly disagree 40 0.28 14083 98.82
9 Missing 168 1.18 14251 100.00
NCVER
115

Reasons - counts towards sch certificate
ST74N09 Frequency PercentCumulativeFrequency
CumulativePercent
. 9485 66.56 9485 66.56
1 Strongly agree 218 1.53 9703 68.09
2 Agree 684 4.80 10387 72.89
3 Disagree 2280 16.00 12667 88.88
4 Strongly disagree 1387 9.73 14054 98.62
9 Missing 197 1.38 14251 100.00
116 LSAY 2009 cohort: wave 1 (2009) – frequency tables

Section 18: Work experienceWork experience
ST75N01 Frequency PercentCumulativeFrequency
CumulativePercent
. 2486 17.44 2486 17.44
1 No, I am not doing work experience this year 3405 23.89 5891 41.34
2 No, not yet but I will do work experience between now and the end of the year
2554 17.92 8445 59.26
3 Yes, I have done work experience this year 2963 20.79 11408 80.05
9 Missing / No response 2843 19.95 14251 100.00
Work experience - days
ST76N01 Frequency PercentCumulativeFrequency
CumulativePercent
. 11288 79.21 11288 79.21
1 to 998 days 2932 20.57 14220 99.78
999 Missing 31 0.22 14251 100.00
Analysis Variable : ST76N01 Work experience - days
N Mean Median Std Dev Minimum Maximum
2932 8.10 5.00 11.19 1.00 125.00
Work experience - what work is like
ST77N01 Frequency PercentCumulativeFrequency
CumulativePercent
. 11288 79.21 11288 79.21
1 Quite a lot 1401 9.83 12689 89.04
2 A fair bit 1168 8.20 13857 97.24
3 Not much 276 1.94 14133 99.17
4 Nothing 42 0.29 14175 99.47
5 Don't know 14 0.10 14189 99.56
9 Missing 62 0.44 14251 100.00
NCVER
117

Work experience - getting along with others
ST77N02 Frequency PercentCumulativeFrequency
CumulativePercent
. 11288 79.21 11288 79.21
1 Quite a lot 1220 8.56 12508 87.77
2 A fair bit 1328 9.32 13836 97.09
3 Not much 290 2.03 14126 99.12
4 Nothing 50 0.35 14176 99.47
5 Don't know 15 0.11 14191 99.58
9 Missing 60 0.42 14251 100.00
Work experience - Follow instructions
ST77N03 Frequency PercentCumulativeFrequency
CumulativePercent
. 11288 79.21 11288 79.21
1 Quite a lot 1387 9.73 12675 88.94
2 A fair bit 1259 8.83 13934 97.78
3 Not much 215 1.51 14149 99.28
4 Nothing 31 0.22 14180 99.50
5 Don't know 10 0.07 14190 99.57
9 Missing 61 0.43 14251 100.00
Work experience - thinking for yourself
ST77N04 Frequency PercentCumulativeFrequency
CumulativePercent
. 11288 79.21 11288 79.21
1 Quite a lot 1202 8.43 12490 87.64
2 A fair bit 1175 8.25 13665 95.89
3 Not much 440 3.09 14105 98.98
4 Nothing 72 0.51 14177 99.48
5 Don't know 10 0.07 14187 99.55
9 Missing 64 0.45 14251 100.00
118 LSAY 2009 cohort: wave 1 (2009) – frequency tables

Work experience - being confident
ST77N05 Frequency PercentCumulativeFrequency
CumulativePercent
. 11288 79.21 11288 79.21
1 Quite a lot 1484 10.41 12772 89.62
2 A fair bit 1118 7.85 13890 97.47
3 Not much 231 1.62 14121 99.09
4 Nothing 49 0.34 14170 99.43
5 Don't know 15 0.11 14185 99.54
9 Missing 66 0.46 14251 100.00
Work experience - kind of skills needed for job
ST77N06 Frequency PercentCumulativeFrequency
CumulativePercent
. 11288 79.21 11288 79.21
1 Quite a lot 1669 11.71 12957 90.92
2 A fair bit 1000 7.02 13957 97.94
3 Not much 181 1.27 14138 99.21
4 Nothing 37 0.26 14175 99.47
5 Don't know 13 0.09 14188 99.56
9 Missing 63 0.44 14251 100.00
Work experience - working conditions
ST77N07 Frequency PercentCumulativeFrequency
CumulativePercent
. 11288 79.21 11288 79.21
1 Quite a lot 1508 10.58 12796 89.79
2 A fair bit 1147 8.05 13943 97.84
3 Not much 196 1.38 14139 99.21
4 Nothing 31 0.22 14170 99.43
5 Don't know 17 0.12 14187 99.55
9 Missing 64 0.45 14251 100.00
NCVER
119

Work experience - career after school
ST77N08 Frequency PercentCumulativeFrequency
CumulativePercent
. 11288 79.21 11288 79.21
1 Quite a lot 1242 8.72 12530 87.92
2 A fair bit 762 5.35 13292 93.27
3 Not much 553 3.88 13845 97.15
4 Nothing 231 1.62 14076 98.77
5 Don't know 105 0.74 14181 99.51
9 Missing 70 0.49 14251 100.00
120 LSAY 2009 cohort: wave 1 (2009) – frequency tables

Section 19: Courses at schoolIB
ST78N01 Frequency PercentCumulativeFrequency
CumulativePercent
. 11780 82.66 11780 82.66
0 No 1352 9.49 13132 92.15
1 Yes 144 1.01 13276 93.16
9 Missing / No response 975 6.84 14251 100.00
VET - this year
ST79N01 Frequency PercentCumulativeFrequency
CumulativePercent
. 11924 83.67 11924 83.67
0 No 935 6.56 12859 90.23
1 Yes 401 2.81 13260 93.05
9 Missing / no response 991 6.95 14251 100.00
VET - apprenticeship/traineeship
ST80N01 Frequency PercentCumulativeFrequency
CumulativePercent
. 13850 97.19 13850 97.19
1 Yes, apprenticeship 50 0.35 13900 97.54
2 Yes, traineeship 60 0.42 13960 97.96
3 No, neither 284 1.99 14244 99.95
9 Missing / no response 7 0.05 14251 100.00
VET - don't spend any time
ST81N01 Frequency PercentCumulativeFrequency
CumulativePercent
. 13850 97.19 13850 97.19
1 No, I do not spend any time learing in a workplace as part of my VET study
200 1.40 14050 98.59
2 Not applicable (blank bubble) 201 1.41 14251 100.00
NCVER
121
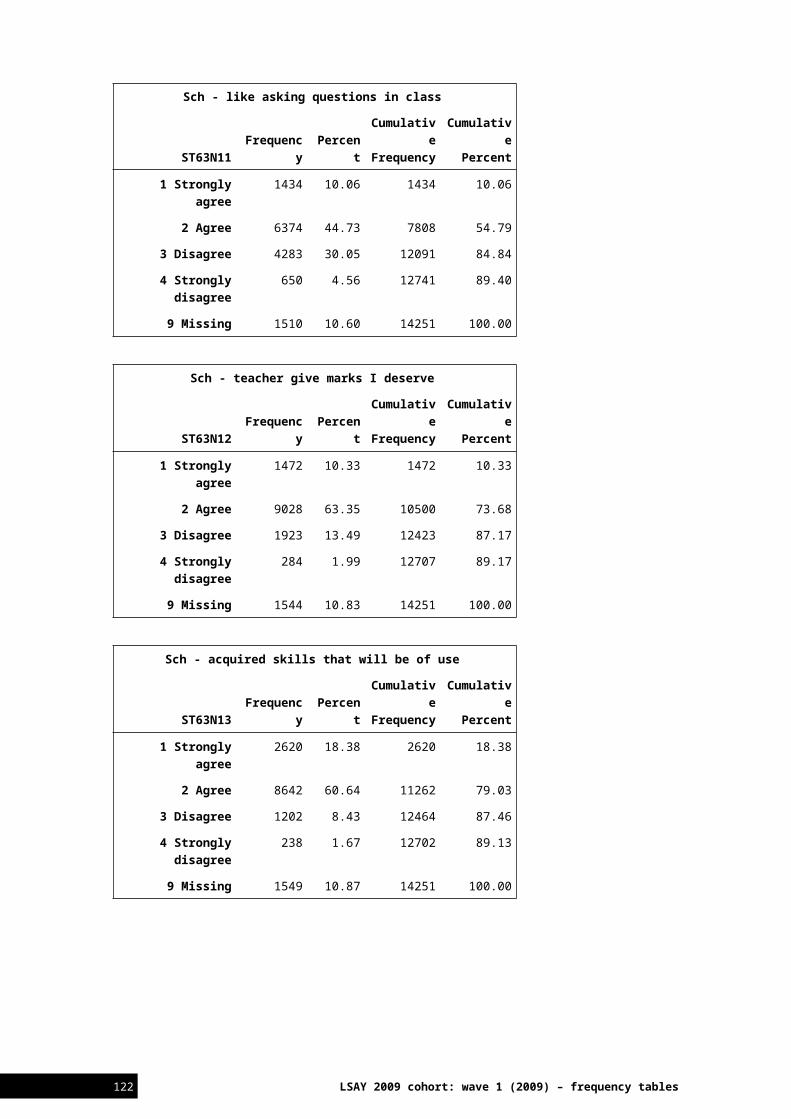
VET - will spend time
ST81N02 Frequency PercentCumulativeFrequency
CumulativePercent
. 13850 97.19 13850 97.19
1 Yes, I will spend time between now and the end of the year in a workplace
64 0.45 13914 97.64
2 Not applicable (blank bubble) 337 2.36 14251 100.00
VET - will spend time (days)
ST81N03 Frequency PercentCumulativeFrequency
CumulativePercent
. 14187 99.55 14187 99.55
1 to 998 days 49 0.34 14236 99.89
999 Missing 15 0.11 14251 100.00
Analysis Variable : ST81N03 VET - will spend time (days)
N Mean Median Std Dev Minimum Maximum
49 25.69 7.00 52.89 1.00 300.00
VET - I have spent time
ST81N04 Frequency PercentCumulativeFrequency
CumulativePercent
. 13850 97.19 13850 97.19
1 Yes, I have spent time learning in a workplace away from school
137 0.96 13987 98.15
2 Not applicable (blank bubble) 264 1.85 14251 100.00
VET - have spent (days)
ST81N05 Frequency PercentCumulativeFrequency
CumulativePercent
. 14114 99.04 14114 99.04
1 to 998 days 116 0.81 14230 99.85
999 Missing 21 0.15 14251 100.00
122 LSAY 2009 cohort: wave 1 (2009) – frequency tables

Analysis Variable : ST81N05 VET - have spent (days)
N Mean Median Std Dev Minimum Maximum
116 15.41 7.00 26.15 1.00 200.00
VET - what work is like
ST82N01 Frequency PercentCumulativeFrequency
CumulativePercent
. 14114 99.04 14114 99.04
1 Quite a lot 74 0.52 14188 99.56
2 A fair bit 52 0.36 14240 99.92
3 Not much 7 0.05 14247 99.97
4 Nothing 1 0.01 14248 99.98
9 Missing 3 0.02 14251 100.00
VET - getting along with other
ST82N02 Frequency PercentCumulativeFrequency
CumulativePercent
. 14114 99.04 14114 99.04
1 Quite a lot 70 0.49 14184 99.53
2 A fair bit 61 0.43 14245 99.96
3 Not much 3 0.02 14248 99.98
9 Missing 3 0.02 14251 100.00
VET - following instructions
ST82N03 Frequency PercentCumulativeFrequency
CumulativePercent
. 14114 99.04 14114 99.04
1 Quite a lot 78 0.55 14192 99.59
2 A fair bit 52 0.36 14244 99.95
3 Not much 4 0.03 14248 99.98
9 Missing 3 0.02 14251 100.00
NCVER
123

VET - thinking for yourself
ST82N04 Frequency PercentCumulativeFrequency
CumulativePercent
. 14114 99.04 14114 99.04
1 Quite a lot 64 0.45 14178 99.49
2 A fair bit 60 0.42 14238 99.91
3 Not much 8 0.06 14246 99.96
4 Nothing 2 0.01 14248 99.98
9 Missing 3 0.02 14251 100.00
VET - being confident
ST82N05 Frequency PercentCumulativeFrequency
CumulativePercent
. 14114 99.04 14114 99.04
1 Quite a lot 78 0.55 14192 99.59
2 A fair bit 51 0.36 14243 99.94
3 Not much 4 0.03 14247 99.97
4 Nothing 1 0.01 14248 99.98
9 Missing 3 0.02 14251 100.00
VET - kind of skills needed for job
ST82N06 Frequency PercentCumulativeFrequency
CumulativePercent
. 14114 99.04 14114 99.04
1 Quite a lot 84 0.59 14198 99.63
2 A fair bit 47 0.33 14245 99.96
3 Not much 2 0.01 14247 99.97
4 Nothing 1 0.01 14248 99.98
9 Missing 3 0.02 14251 100.00
124 LSAY 2009 cohort: wave 1 (2009) – frequency tables
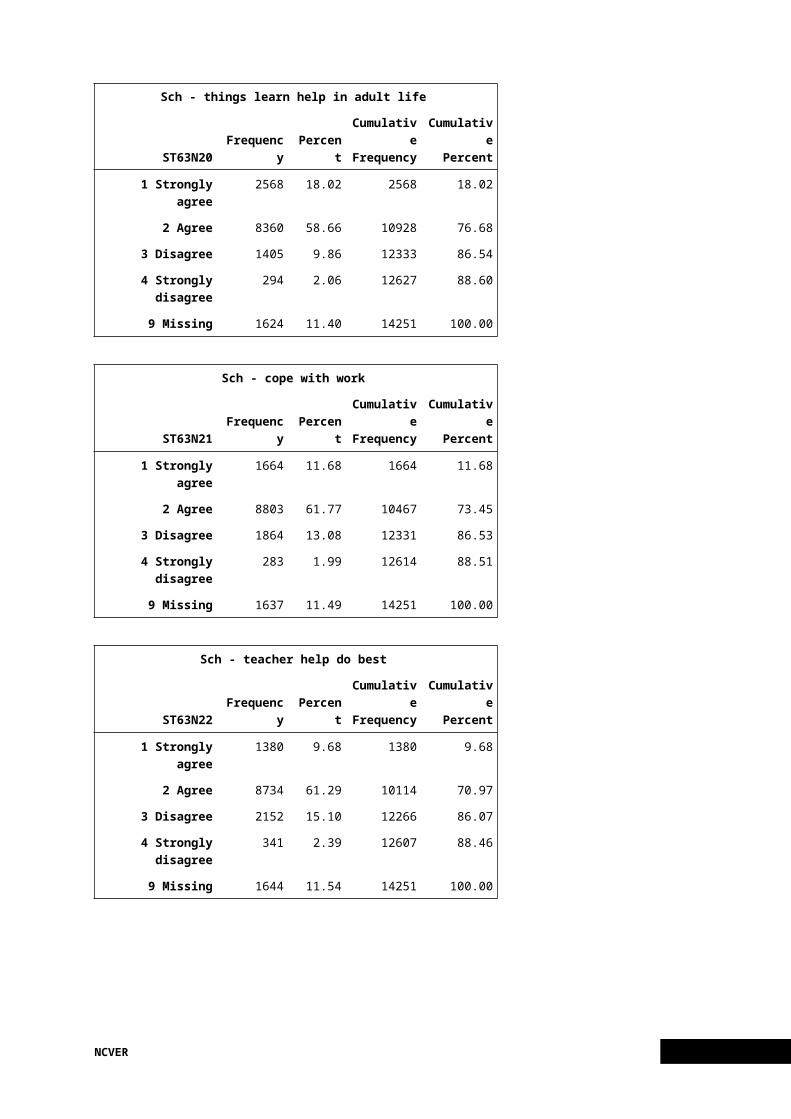
VET - working conditions
ST82N07 Frequency PercentCumulativeFrequency
CumulativePercent
. 14114 99.04 14114 99.04
1 Quite a lot 79 0.55 14193 99.59
2 A fair bit 51 0.36 14244 99.95
3 Not much 4 0.03 14248 99.98
9 Missing 3 0.02 14251 100.00
VET - career after school
ST82N08 Frequency PercentCumulativeFrequency
CumulativePercent
. 14114 99.04 14114 99.04
1 Quite a lot 63 0.44 14177 99.48
2 A fair bit 44 0.31 14221 99.79
3 Not much 20 0.14 14241 99.93
4 Nothing 4 0.03 14245 99.96
5 Don't know 3 0.02 14248 99.98
9 Missing 3 0.02 14251 100.00
TAFE - this year
ST83N01 Frequency PercentCumulativeFrequency
CumulativePercent
. 11924 83.67 11924 83.67
0 No 1078 7.56 13002 91.24
1 Yes 206 1.45 13208 92.68
9 Missing / no response 1043 7.32 14251 100.00
TAFE - apprenticeship/traineehsip
ST84N01 Frequency PercentCumulativeFrequency
CumulativePercent
. 14045 98.55 14045 98.55
1 Yes, apprenticeship 31 0.22 14076 98.77
2 Yes, traineeship 45 0.32 14121 99.09
3 No, neither 124 0.87 14245 99.96
9 Missing / no response 6 0.04 14251 100.00
NCVER
125

TAFE - don't spend any time
ST85N01 Frequency PercentCumulativeFrequency
CumulativePercent
. 14045 98.55 14045 98.55
1 No, I do not spend any time learning in a workplace as part of my TAFE study
97 0.68 14142 99.24
2 Not applicable (blank bubble) 109 0.76 14251 100.00
TAFE - will spend time
ST85N02 Frequency PercentCumulativeFrequency
CumulativePercent
. 14045 98.55 14045 98.55
1 Yes, I will spend time between now and the end of the year in a workplace
40 0.28 14085 98.84
2 Not applicable (blank bubble) 166 1.16 14251 100.00
TAFE - will spend time (days)
ST85N03 Frequency PercentCumulativeFrequency
CumulativePercent
. 14211 99.72 14211 99.72
1 to 998 days 29 0.20 14240 99.92
999 Missing 11 0.08 14251 100.00
Analysis Variable : ST85N03 TAFE - will spend time (days)
N Mean Median Std Dev Minimum Maximum
29 30.31 10.00 44.47 1.00 200.00
TAFE - I have spent time
ST85N04 Frequency PercentCumulativeFrequency
CumulativePercent
. 14045 98.55 14045 98.55
1 Yes, I have spent time learning in a workplace away from school
69 0.48 14114 99.04
2 Not applicable (blank bubble) 137 0.96 14251 100.00
126 LSAY 2009 cohort: wave 1 (2009) – frequency tables

TAFE - have spent (days)
ST85N05 Frequency PercentCumulativeFrequency
CumulativePercent
. 14182 99.52 14182 99.52
1 to 998 days 58 0.41 14240 99.92
999 Missing 11 0.08 14251 100.00
Analysis Variable : ST85N05 TAFE - have spent (days)
N Mean Median Std Dev Minimum Maximum
58 16.66 8.00 28.05 1.00 200.00
TAFE - what work is like
ST86N01 Frequency PercentCumulativeFrequency
CumulativePercent
. 14182 99.52 14182 99.52
1 Quite a lot 38 0.27 14220 99.78
2 A fair bit 27 0.19 14247 99.97
3 Not much 1 0.01 14248 99.98
4 Nothing 1 0.01 14249 99.99
9 Missing 2 0.01 14251 100.00
TAFE - getting along with other
ST86N02 Frequency PercentCumulativeFrequency
CumulativePercent
. 14182 99.52 14182 99.52
1 Quite a lot 35 0.25 14217 99.76
2 A fair bit 30 0.21 14247 99.97
4 Nothing 2 0.01 14249 99.99
9 Missing 2 0.01 14251 100.00
NCVER
127

TAFE - following instructions
ST86N03 Frequency PercentCumulativeFrequency
CumulativePercent
. 14182 99.52 14182 99.52
1 Quite a lot 42 0.29 14224 99.81
2 A fair bit 22 0.15 14246 99.96
3 Not much 1 0.01 14247 99.97
4 Nothing 2 0.01 14249 99.99
9 Missing 2 0.01 14251 100.00
TAFE - thinking for yourself
ST86N04 Frequency PercentCumulativeFrequency
CumulativePercent
. 14182 99.52 14182 99.52
1 Quite a lot 39 0.27 14221 99.79
2 A fair bit 24 0.17 14245 99.96
3 Not much 2 0.01 14247 99.97
4 Nothing 2 0.01 14249 99.99
9 Missing 2 0.01 14251 100.00
TAFE - Being confident
ST86N05 Frequency PercentCumulativeFrequency
CumulativePercent
. 14182 99.52 14182 99.52
1 Quite a lot 43 0.30 14225 99.82
2 A fair bit 21 0.15 14246 99.96
4 Nothing 2 0.01 14248 99.98
5 Don't know 1 0.01 14249 99.99
9 Missing 2 0.01 14251 100.00
128 LSAY 2009 cohort: wave 1 (2009) – frequency tables

TAFE - kind of skills needed for job
ST86N06 Frequency PercentCumulativeFrequency
CumulativePercent
. 14182 99.52 14182 99.52
1 Quite a lot 45 0.32 14227 99.83
2 A fair bit 21 0.15 14248 99.98
4 Nothing 1 0.01 14249 99.99
9 Missing 2 0.01 14251 100.00
TAFE - working conditions
ST86N07 Frequency PercentCumulativeFrequency
CumulativePercent
. 14182 99.52 14182 99.52
1 Quite a lot 44 0.31 14226 99.82
2 A fair bit 20 0.14 14246 99.96
3 Not much 1 0.01 14247 99.97
4 Nothing 1 0.01 14248 99.98
5 Don't know 1 0.01 14249 99.99
9 Missing 2 0.01 14251 100.00
TAFE - career after school
ST86N08 Frequency PercentCumulativeFrequency
CumulativePercent
. 14182 99.52 14182 99.52
1 Quite a lot 36 0.25 14218 99.77
2 A fair bit 17 0.12 14235 99.89
3 Not much 10 0.07 14245 99.96
4 Nothing 3 0.02 14248 99.98
5 Don't know 1 0.01 14249 99.99
9 Missing 2 0.01 14251 100.00
NCVER
129

Student-level simple indicesAge of student
AGE Frequency PercentCumulativeFrequency
CumulativePercent
15.25 320 2.25 320 2.25
15.33 1214 8.52 1534 10.76
15.42 1300 9.12 2834 19.89
15.5 1214 8.52 4048 28.41
15.58 1204 8.45 5252 36.85
15.67 1164 8.17 6416 45.02
15.75 1142 8.01 7558 53.03
15.83 1205 8.46 8763 61.49
15.92 1200 8.42 9963 69.91
16 1202 8.43 11165 78.35
16.08 1150 8.07 12315 86.41
16.17 1089 7.64 13404 94.06
16.25 813 5.70 14217 99.76
16.33 34 0.24 14251 100.00
Father SQ ISEI
BFMJ Frequency PercentCumulativeFrequency
CumulativePercent
. 2156 15.13 2156 15.13
16 to 90 ISEI score 12095 84.87 14251 100.00
Analysis Variable : BFMJ Father SQ ISEI
N Mean Median Std Dev Minimum Maximum
12095 46.52 45.00 17.51 16.00 90.00
Mother SQ ISEI
BMMJ Frequency PercentCumulativeFrequency
CumulativePercent
. 2764 19.40 2764 19.40
16 to 90 ISEI score 11487 80.60 14251 100.00
130 LSAY 2009 cohort: wave 1 (2009) – frequency tables

Analysis Variable : BMMJ Mother SQ ISEI
N Mean Median Std Dev Minimum Maximum
11487 48.07 51.00 16.04 16.00 90.00
Family Structure
FAMSTRUC Frequency PercentCumulativeFrequency
CumulativePercent
. 279 1.96 279 1.96
1 Single parent family 2722 19.10 3001 21.06
2 Nuclear family 10973 77.00 13974 98.06
3 Mixed 277 1.94 14251 100.00
Educational level of father (ISCED)
FISCED Frequency PercentCumulativeFrequency
CumulativePercent
. 1368 9.60 1368 9.60
0 None 61 0.43 1429 10.03
1 ISCED 1 - Primary school only 102 0.72 1531 10.74
2 ISCED 2 - Some secondary but didn't complete Yr 10 797 5.59 2328 16.34
3 ISCED 3B, 3C - Yr 10 or 11 2652 18.61 4980 34.94
4 ISCED 3A - Year 12, ISCED 4 - TAFE Training Certificate 4215 29.58 9195 64.52
5 ISCED 5B - TAFE Diploma 1292 9.07 10487 73.59
6 ISCED 5A - Uni degree, ISCED 6 - PhD or equivalent 3764 26.41 14251 100.00
Educational level of mother (ISCED)
MISCED Frequency PercentCumulativeFrequency
CumulativePercent
. 786 5.52 786 5.52
0 None 67 0.47 853 5.99
1 ISCED 1 - Primary school only 76 0.53 929 6.52
2 ISCED 2 - Some secondary but didn't complete Yr 10 604 4.24 1533 10.76
3 ISCED 3B, 3C - Yr 10 or 11 2810 19.72 4343 30.48
4 ISCED 3A - Year 12, ISCED 4 - TAFE Training Certificate 4264 29.92 8607 60.40
5 ISCED 5B - TAFE Diploma 1618 11.35 10225 71.75
6 ISCED 5A - Uni degree, ISCED 6 - PhD or equivalent 4026 28.25 14251 100.00
NCVER
131

Highest educational level of parents
HISCED Frequency PercentCumulativeFrequency
CumulativePercent
. 602 4.22 602 4.22
0 None 29 0.20 631 4.43
1 ISCED 1 - Primary school only 38 0.27 669 4.69
2 ISCED 2 - Some secondary but didn't complete Yr 10 251 1.76 920 6.46
3 ISCED 3B, 3C - Yr 10 or 11 1685 11.82 2605 18.28
4 ISCED 3A - Year 12, ISCED 4 - TAFE Training Certificate 4326 30.36 6931 48.64
5 ISCED 5B - TAFE Diploma 1824 12.80 8755 61.43
6 ISCED 5A - Uni degree, ISCED 6 - PhD or equivalent 5496 38.57 14251 100.00
Father White collar/Blue collar classification
FsECATEG Frequency PercentCumulativeFrequency
CumulativePercent
. 2156 15.13 2156 15.13
1 White collar high skilled 6056 42.50 8212 57.62
2 White collar low skilled 1158 8.13 9370 65.75
3 Blue collar high skilled 3019 21.18 12389 86.93
4 Blue collar low skilled 1862 13.07 14251 100.00
Mother White collar/Blue collar classification
MsECATEG Frequency PercentCumulativeFrequency
CumulativePercent
. 2764 19.40 2764 19.40
1 White collar high skilled 6780 47.58 9544 66.97
2 White collar low skilled 3328 23.35 12872 90.32
3 Blue collar high skilled 316 2.22 13188 92.54
4 Blue collar low skilled 1063 7.46 14251 100.00
132 LSAY 2009 cohort: wave 1 (2009) – frequency tables

Highest parent White collar/Blue collar classification
HsECATEG Frequency PercentCumulativeFrequency
CumulativePercent
. 905 6.35 905 6.35
1 White collar high skilled 9174 64.37 10079 70.72
2 White collar low skilled 2351 16.50 12430 87.22
3 Blue collar high skilled 1045 7.33 13475 94.55
4 Blue collar low skilled 776 5.45 14251 100.00
Highest parental occupational status
HISEI Frequency PercentCumulativeFrequency
CumulativePercent
. 905 6.35 905 6.35
16 to 90 ISEI score 13346 93.65 14251 100.00
Analysis Variable : HISEI Highest parental occupational status
N Mean Median Std Dev Minimum Maximum
13346 53.01 52.00 16.13 16.00 90.00
ISCED designation
ISCEDD Frequency PercentCumulativeFrequency
CumulativePercent
. 458 3.21 458 3.21
1 A 13690 96.06 14148 99.28
2 B 103 0.72 14251 100.00
ISCED level
ISCEDL Frequency PercentCumulativeFrequency
CumulativePercent
. 458 3.21 458 3.21
2 ISCED level 2 11405 80.03 11863 83.24
3 ISCED level 3 2388 16.76 14251 100.00
NCVER
133

ISCED orientation
ISCEDO Frequency PercentCumulativeFrequency
CumulativePercent
. 458 3.21 458 3.21
1 General 11972 84.01 12430 87.22
2 Pre-Vocational 1718 12.06 14148 99.28
3 Vocational 103 0.72 14251 100.00
Learning time (minutes per week) - Test Language
LMINS Frequency PercentCumulativeFrequency
CumulativePercent
. 1268 8.90 1268 8.90
1 to 9996 minutes 12983 91.10 14251 100.00
Analysis Variable : LMINS Learning time (minutes per week) - Test Language
N Mean Median Std Dev Minimum Maximum
12983 236.11 225.00 70.55 0.00 960.00
Learning time (minutes per week) - Mathematics
MMINS Frequency PercentCumulativeFrequency
CumulativePercent
. 1310 9.19 1310 9.19
1 to 9996 minutes 12941 90.81 14251 100.00
Analysis Variable : MMINS Learning time (minutes per week) - Mathematics
N Mean Median Std Dev Minimum Maximum
12941 239.33 225.00 79.59 0.00 1000.00
Learning time (minutes per week) - Science
SMINS Frequency PercentCumulativeFrequency
CumulativePercent
. 2059 14.45 2059 14.45
1 to 9996 minutes 12192 85.55 14251 100.00
134 LSAY 2009 cohort: wave 1 (2009) – frequency tables

Analysis Variable : SMINS Learning time (minutes per week) - Science
N Mean Median Std Dev Minimum Maximum
12192 218.57 210.00 103.61 0.00 1000.00
NCVER
135

Student-level scale indicesMeta-cognition: Summarising
METASUM Frequency PercentCumulativeFrequency
CumulativePercent
. 689 4.83 689 4.83
Scale indices 13562 95.17 14251 100.00
Analysis Variable : METASUM Meta-cognition: Summarising
N Mean Median Std Dev Minimum Maximum
13562 -0.12 0.09 1.04 -2.01 1.34
Meta-cognition: Understanding and Remembering
UNDREM Frequency PercentCumulativeFrequency
CumulativePercent
. 606 4.25 606 4.25
Scale indices 13645 95.75 14251 100.00
Analysis Variable : UNDREM Meta-cognition: Understanding and Remembering
N Mean Median Std Dev Minimum Maximum
13645 -0.02 -0.05 1.01 -1.88 1.42
Highest parental education in years
PARED Frequency PercentCumulativeFrequency
CumulativePercent
. 602 4.22 602 4.22
3 29 0.20 631 4.43
6 38 0.27 669 4.69
10 251 1.76 920 6.46
11 1685 11.82 2605 18.28
12 4326 30.36 6931 48.64
14 1824 12.80 8755 61.43
15 5496 38.57 14251 100.00
136 LSAY 2009 cohort: wave 1 (2009) – frequency tables

Attitude towards computers
ATTCOMP Frequency PercentCumulativeFrequency
CumulativePercent
. 921 6.46 921 6.46
Scale indices 13330 93.54 14251 100.00
Analysis Variable : ATTCOMP Attitude towards computers
N Mean Median Std Dev Minimum Maximum
13330 -0.17 -0.11 0.89 -2.44 0.86
Attitude towards school
ATSCHL Frequency PercentCumulativeFrequency
CumulativePercent
. 796 5.59 796 5.59
Scale indices 13455 94.41 14251 100.00
Analysis Variable : ATSCHL Attitude towards school
N Mean Median Std Dev Minimum Maximum
13455 0.15 0.02 1.02 -2.99 2.01
Use of control strategies
CSTRAT Frequency PercentCumulativeFrequency
CumulativePercent
. 247 1.73 247 1.73
Scale indices 14004 98.27 14251 100.00
Analysis Variable : CSTRAT Use of control strategies
N Mean Median Std Dev Minimum Maximum
14004 0.01 -0.04 1.10 -3.45 2.50
Cultural Possessions
CULTPOSS Frequency PercentCumulativeFrequency
CumulativePercent
. 387 2.72 387 2.72
Scale indices 13864 97.28 14251 100.00
NCVER
137

Analysis Variable : CULTPOSS Cultural Possessions
N Mean Median Std Dev Minimum Maximum
13864 -0.14 -0.54 1.01 -1.68 1.30
Disciplinary climate
DISCLIMA Frequency PercentCumulativeFrequency
CumulativePercent
. 290 2.03 290 2.03
Scale indices 13961 97.97 14251 100.00
Analysis Variable : DISCLIMA Disciplinary climate
N Mean Median Std Dev Minimum Maximum
13961 -0.10 0.03 1.01 -2.81 1.84
Diveristy reading
DIVREAD Frequency PercentCumulativeFrequency
CumulativePercent
. 202 1.42 202 1.42
Scale indices 14049 98.58 14251 100.00
Analysis Variable : DIVREAD Diveristy reading
N Mean Median Std Dev Minimum Maximum
14049 -0.12 -0.06 0.94 -3.95 4.65
Use of elaboration strategies
ELAB Frequency PercentCumulativeFrequency
CumulativePercent
. 266 1.87 266 1.87
Scale indices 13985 98.13 14251 100.00
Analysis Variable : ELAB Use of elaboration strategies
N Mean Median Std Dev Minimum Maximum
13985 -0.14 0.04 1.00 -2.41 2.76
138 LSAY 2009 cohort: wave 1 (2009) – frequency tables

ICT internet/entertainment use
ENTUSE Frequency PercentCumulativeFrequency
CumulativePercent
. 523 3.67 523 3.67
Scale indices 13728 96.33 14251 100.00
Analysis Variable : ENTUSE ICT internet/entertainment use
N Mean Median Std Dev Minimum Maximum
13728 0.04 0.15 0.91 -3.10 2.99
Index of economic, social and cultural status (WLE)
ESCS Frequency PercentCumulativeFrequency
CumulativePercent
. 318 2.23 318 2.23
Scale indices 13933 97.77 14251 100.00
Analysis Variable : ESCS Index of economic, social and cultural status (WLE)
N Mean Median Std Dev Minimum Maximum
13933 0.32 0.32 0.76 -3.40 2.98
Home educational resources
HEDRES Frequency PercentCumulativeFrequency
CumulativePercent
. 250 1.75 250 1.75
Scale indices 14001 98.25 14251 100.00
Analysis Variable : HEDRES Home educational resources
N Mean Median Std Dev Minimum Maximum
14001 -0.11 -0.10 0.97 -3.91 0.92
Self-confidence in ICT high level tasks
HIGHCONF Frequency PercentCumulativeFrequency
CumulativePercent
. 845 5.93 845 5.93
Scale indices 13406 94.07 14251 100.00
NCVER
139

Analysis Variable : HIGHCONF Self-confidence in ICT high level tasks
N Mean Median Std Dev Minimum Maximum
13406 0.11 -0.05 0.92 -3.59 1.62
Home Possessions
HOMEPOS Frequency PercentCumulativeFrequency
CumulativePercent
. 180 1.26 180 1.26
Scale indices 14071 98.74 14251 100.00
Analysis Variable : HOMEPOS Home Possessions
N Mean Median Std Dev Minimum Maximum
14071 0.56 0.59 0.83 -3.78 4.32
ICT for school related tasks
HOMSCH Frequency PercentCumulativeFrequency
CumulativePercent
. 630 4.42 630 4.42
Scale indices 13621 95.58 14251 100.00
Analysis Variable : HOMSCH ICT for school related tasks
N Mean Median Std Dev Minimum Maximum
13621 0.06 0.15 0.90 -1.92 3.04
ICT availability at home
ICTHOME Frequency PercentCumulativeFrequency
CumulativePercent
. 430 3.02 430 3.02
Scale indices 13821 96.98 14251 100.00
Analysis Variable : ICTHOME ICT availability at home
N Mean Median Std Dev Minimum Maximum
13821 0.42 0.19 0.83 -4.19 1.41
140 LSAY 2009 cohort: wave 1 (2009) – frequency tables

ICT resources
ICTRES Frequency PercentCumulativeFrequency
CumulativePercent
. 213 1.49 213 1.49
Scale indices 14038 98.51 14251 100.00
Analysis Variable : ICTRES ICT resources
N Mean Median Std Dev Minimum Maximum
14038 0.45 0.54 0.79 -2.53 1.30
ICT availability at school
ICTSCH Frequency PercentCumulativeFrequency
CumulativePercent
. 497 3.49 497 3.49
Scale indices 13754 96.51 14251 100.00
Analysis Variable : ICTSCH ICT availability at school
N Mean Median Std Dev Minimum Maximum
13754 0.67 0.80 0.73 -2.79 1.80
Joy/Like Reading
JOYREAD Frequency PercentCumulativeFrequency
CumulativePercent
. 514 3.61 514 3.61
Scale indices 13737 96.39 14251 100.00
Analysis Variable : JOYREAD Joy/Like Reading
N Mean Median Std Dev Minimum Maximum
13737 -0.03 -0.04 1.11 -3.23 3.50
Use of Libraries
LIBUSE Frequency PercentCumulativeFrequency
CumulativePercent
. 332 2.33 332 2.33
Scale indices 13919 97.67 14251 100.00
NCVER
141

Analysis Variable : LIBUSE Use of Libraries
N Mean Median Std Dev Minimum Maximum
13919 0.21 0.28 0.89 -1.85 3.99
Use of memorisation strategies
MEMOR Frequency PercentCumulativeFrequency
CumulativePercent
. 234 1.64 234 1.64
Scale indices 14017 98.36 14251 100.00
Analysis Variable : MEMOR Use of memorisation strategies
N Mean Median Std Dev Minimum Maximum
14017 -0.11 -0.21 1.01 -3.02 2.69
Online Reading
ONLNREAD Frequency PercentCumulativeFrequency
CumulativePercent
. 219 1.54 219 1.54
Scale indices 14032 98.46 14251 100.00
Analysis Variable : ONLNREAD Online Reading
N Mean Median Std Dev Minimum Maximum
14032 -0.12 -0.10 0.89 -5.35 3.51
Teachers Stimulation of Reading Engagement
STIMREAD Frequency PercentCumulativeFrequency
CumulativePercent
. 306 2.15 306 2.15
Scale indices 13945 97.85 14251 100.00
Analysis Variable : STIMREAD Teachers Stimulation of Reading Engagement
N Mean Median Std Dev Minimum Maximum
13945 0.11 0.17 1.00 -3.54 3.40
142 LSAY 2009 cohort: wave 1 (2009) – frequency tables

Use of structuring and scaffolding strategies
STRSTRAT Frequency PercentCumulativeFrequency
CumulativePercent
. 337 2.36 337 2.36
Scale indices 13914 97.64 14251 100.00
Analysis Variable : STRSTRAT Use of structuring and scaffolding strategies
N Mean Median Std Dev Minimum Maximum
13914 0.21 0.26 1.04 -3.98 3.39
Teacher student Relations
STUDREL Frequency PercentCumulativeFrequency
CumulativePercent
. 285 2.00 285 2.00
Scale indices 13966 98.00 14251 100.00
Analysis Variable : STUDREL Teacher student Relations
N Mean Median Std Dev Minimum Maximum
13966 0.09 0.17 0.98 -2.90 2.45
Use of ICT at school
USESCH Frequency PercentCumulativeFrequency
CumulativePercent
. 663 4.65 663 4.65
Scale indices 13588 95.35 14251 100.00
Analysis Variable : USESCH Use of ICT at school
N Mean Median Std Dev Minimum Maximum
13588 0.44 0.43 0.70 -1.64 4.10
Wealth
WEALTH Frequency PercentCumulativeFrequency
CumulativePercent
. 188 1.32 188 1.32
Scale indices 14063 98.68 14251 100.00
NCVER
143

Analysis Variable : WEALTH Wealth
N Mean Median Std Dev Minimum Maximum
14063 0.71 0.70 0.81 -4.63 3.45
Reading for School: Interpretation of literary texts
RFSINTRP Frequency PercentCumulativeFrequency
CumulativePercent
. 753 5.28 753 5.28
Scale indices 13498 94.72 14251 100.00
Analysis Variable : RFSINTRP Reading for School: Interpretation of literary texts
N Mean Median Std Dev Minimum Maximum
13498 0.11 0.15 0.94 -2.55 2.22
Reading for School: Non-continuous materials
RFSNCONT Frequency PercentCumulativeFrequency
CumulativePercent
. 753 5.28 753 5.28
Scale indices 13498 94.72 14251 100.00
Analysis Variable : RFSNCONT Reading for School: Non-continuous materials
N Mean Median Std Dev Minimum Maximum
13498 0.31 0.19 0.95 -2.14 2.53
Reading for School: Traditional literature courses
RFSTRLIT Frequency PercentCumulativeFrequency
CumulativePercent
. 734 5.15 734 5.15
Scale indices 13517 94.85 14251 100.00
Analysis Variable : RFSTRLIT Reading for School: Traditional literature courses
N Mean Median Std Dev Minimum Maximum
13517 -0.16 -0.04 0.93 -2.37 3.57
144 LSAY 2009 cohort: wave 1 (2009) – frequency tables

Reading for School: Functional reading materials
RFSFUMAT Frequency PercentCumulativeFrequency
CumulativePercent
. 774 5.43 774 5.43
Scale indices 13477 94.57 14251 100.00
Analysis Variable : RFSFUMAT Reading for School: Functional reading materials
N Mean Median Std Dev Minimum Maximum
13477 0.13 0.24 0.91 -1.69 2.68
NCVER
145

PISA assessment resultsAnalysis Variable : PV1MATH Plausible value in math
N Mean Median Std Dev Minimum Maximum
14251 508.75 511.15 94.42 129.93 890.10
Analysis Variable : PV2MATH Plausible value in math
N Mean Median Std Dev Minimum Maximum
14251 508.24 510.45 95.25 109.29 846.71
Analysis Variable : PV3MATH Plausible value in math
N Mean Median Std Dev Minimum Maximum
14251 508.50 511.15 95.14 154.47 836.43
Analysis Variable : PV4MATH Plausible value in math
N Mean Median Std Dev Minimum Maximum
14251 508.01 510.21 94.74 160.62 840.48
Analysis Variable : PV5MATH Plausible value in math
N Mean Median Std Dev Minimum Maximum
14251 508.73 512.32 95.33 138.11 873.82
Analysis Variable : PV1READ Plausible value in reading
N Mean Median Std Dev Minimum Maximum
14251 508.10 515.12 100.91 110.04 802.88
Analysis Variable : PV2READ Plausible value in reading
N Mean Median Std Dev Minimum Maximum
14251 507.91 515.20 101.32 89.28 809.66
Analysis Variable : PV3READ Plausible value in reading
N Mean Median Std Dev Minimum Maximum
14251 508.25 514.20 101.16 66.75 831.24
146 LSAY 2009 cohort: wave 1 (2009) – frequency tables

Analysis Variable : PV4READ Plausible value in reading
N Mean Median Std Dev Minimum Maximum
14251 507.99 514.83 101.20 86.71 846.57
Analysis Variable : PV5READ Plausible value in reading
N Mean Median Std Dev Minimum Maximum
14251 508.25 515.20 101.73 84.90 874.38
Analysis Variable : PV1SCIE Plausible value in science
N Mean Median Std Dev Minimum Maximum
14251 520.99 524.56 102.91 70.44 883.76
Analysis Variable : PV2SCIE Plausible value in science
N Mean Median Std Dev Minimum Maximum
14251 520.55 525.40 103.82 46.38 898.49
Analysis Variable : PV3SCIE Plausible value in science
N Mean Median Std Dev Minimum Maximum
14251 520.90 525.68 103.44 76.97 848.14
Analysis Variable : PV4SCIE Plausible value in science
N Mean Median Std Dev Minimum Maximum
14251 520.71 525.68 103.25 103.08 866.97
Analysis Variable : PV5SCIE Plausible value in science
N Mean Median Std Dev Minimum Maximum
14251 520.89 525.77 104.06 1.62 905.20
Analysis Variable : PV1READ1 Plausible value in reading - access and retrieve
N Mean Median Std Dev Minimum Maximum
14251 507.09 514.56 102.70 67.55 825.28
NCVER
147

Analysis Variable : PV2READ1 Plausible value in reading - access and retrieve
N Mean Median Std Dev Minimum Maximum
14251 506.74 515.31 102.51 79.10 833.86
Analysis Variable : PV3READ1 Plausible value in reading - access and retrieve
N Mean Median Std Dev Minimum Maximum
14251 507.01 516.01 102.99 70.44 868.74
Analysis Variable : PV4READ1 Plausible value in reading - access and retrieve
N Mean Median Std Dev Minimum Maximum
14251 507.07 515.45 102.84 60.02 826.79
Analysis Variable : PV5READ1 Plausible value in reading - access and retrieve
N Mean Median Std Dev Minimum Maximum
14251 506.97 514.99 102.65 74.65 879.62
Analysis Variable : PV1READ2 Plausible value in reading - integrate and interpret
N Mean Median Std Dev Minimum Maximum
14251 505.86 511.34 104.48 126.79 857.52
Analysis Variable : PV2READ2 Plausible value in reading - integrate and interpret
N Mean Median Std Dev Minimum Maximum
14251 505.50 510.86 104.55 99.94 884.78
Analysis Variable : PV3READ2 Plausible value in reading - integrate and interpret
N Mean Median Std Dev Minimum Maximum
14251 505.73 511.81 104.84 93.85 928.07
Analysis Variable : PV4READ2 Plausible value in reading - integrate and interpret
N Mean Median Std Dev Minimum Maximum
14251 505.85 511.57 104.76 80.14 900.59
148 LSAY 2009 cohort: wave 1 (2009) – frequency tables

Analysis Variable : PV5READ2 Plausible value in reading - integrate and interpret
N Mean Median Std Dev Minimum Maximum
14251 505.71 510.56 104.65 88.31 878.03
Analysis Variable : PV1READ3 Plausible value in reading - reflect and evaluate
N Mean Median Std Dev Minimum Maximum
14251 515.09 521.90 105.22 64.25 842.76
Analysis Variable : PV2READ3 Plausible value in reading - reflect and evaluate
N Mean Median Std Dev Minimum Maximum
14251 514.85 522.42 105.05 70.60 846.65
Analysis Variable : PV3READ3 Plausible value in reading - reflect and evaluate
N Mean Median Std Dev Minimum Maximum
14251 514.97 521.94 105.47 65.04 855.92
Analysis Variable : PV4READ3 Plausible value in reading - reflect and evaluate
N Mean Median Std Dev Minimum Maximum
14251 514.89 522.46 105.38 15.79 856.11
Analysis Variable : PV5READ3 Plausible value in reading - reflect and evaluate
N Mean Median Std Dev Minimum Maximum
14251 515.06 522.82 105.13 69.01 841.08
Analysis Variable : PV1READ4 Plausible value in reading - continuous text
N Mean Median Std Dev Minimum Maximum
14251 505.97 511.73 104.43 50.72 874.54
Analysis Variable : PV2READ4 Plausible value in reading - continuous text
N Mean Median Std Dev Minimum Maximum
14251 506.48 512.88 104.45 52.33 833.47
NCVER
149

Analysis Variable : PV3READ4 Plausible value in reading - continuous text
N Mean Median Std Dev Minimum Maximum
14251 506.12 512.93 104.11 77.89 846.26
Analysis Variable : PV4READ4 Plausible value in reading - continuous text
N Mean Median Std Dev Minimum Maximum
14251 506.22 512.69 104.61 80.30 863.26
Analysis Variable : PV5READ4 Plausible value in reading - continuous text
N Mean Median Std Dev Minimum Maximum
14251 506.22 512.29 104.51 92.85 850.70
Analysis Variable : PV1READ5 Plausible value in reading - non-continuous text
N Mean Median Std Dev Minimum Maximum
14251 516.53 523.14 102.05 68.03 855.71
Analysis Variable : PV2READ5 Plausible value in reading - non-continuous text
N Mean Median Std Dev Minimum Maximum
14251 516.92 524.26 101.94 93.00 841.17
Analysis Variable : PV3READ5 Plausible value in reading - non-continuous text
N Mean Median Std Dev Minimum Maximum
14251 516.79 524.58 101.65 104.75 883.59
Analysis Variable : PV4READ5 Plausible value in reading - non-continuous text
N Mean Median Std Dev Minimum Maximum
14251 516.58 524.05 102.34 62.02 871.99
150 LSAY 2009 cohort: wave 1 (2009) – frequency tables

Analysis Variable : PV5READ5 Plausible value in reading - non-continuous text
N Mean Median Std Dev Minimum Maximum
14251 516.36 524.13 101.70 104.76 845.89
NCVER
151