LOWER STEWART RIVER MOOSE MANAGEMENT UNIT · MOOSE SURVEY LOWER STEWART RIVER MOOSE MANAGEMENT UNIT...
18
MOOSE SURVEY LOWER STEWART RIVER MOOSE MANAGEMENT UNIT EARLY-WINTER 2001 Prepared by: Mark O'Donoghue 2013
Transcript of LOWER STEWART RIVER MOOSE MANAGEMENT UNIT · MOOSE SURVEY LOWER STEWART RIVER MOOSE MANAGEMENT UNIT...

MOOSE SURVEY
LOWER STEWART RIVER MOOSE MANAGEMENT UNIT
EARLY-WINTER 2001
Prepared by:
Mark O'Donoghue
2013

MOOSE SURVEY LOWER STEWART RIVER
MOOSE MANAGEMENT UNIT EARLY-WINTER 2001
Yukon Fish and Wildlife Branch
TR-13-08
Acknowledgements
Environment Yukon and Selkirk First Nation provided funding and staff for this survey. I thank
Derek Drinnan, Michel Menelon, and Craig Untershute for safe, efficient flying in often difficult
conditions. Kent Sinnott and Susan Westover acted as navigators and observers on the census
and did a fine job guiding the plane and recording data. Rick Ward acted as navigator for one day of the stratification. I also thank Alec Joe and Robert Van Bibber for providing their keen
eyesight and knowledge of the area as observers with the stratification crew.
© 2013 Yukon Department of Environment
Copies available from:
Yukon Department of Environment
Fish and Wildlife Branch, V-5A
Box 2703, Whitehorse, Yukon Y1A 2C6
Phone (867) 667-5721, Fax (867) 393-6263 Email: [email protected]
Also available online at www.env.gov.yk.ca
Suggested citation:
O’Donoghue, M. 2013. Moose Survey: Lower Stewart River Moose Management Unit, early-
winter 2001. Yukon Fish and Wildlife Branch Report TR-13-08. Whitehorse, Yukon,
Canada.

Lower Stewart River Early-winter Moose Survey - Nov.-Dec. 2001 i
Summary
We conducted an early-winter survey of moose in the Lower Stewart River
Moose Management Area 10 November-23 December 2001 using Super Cub aircraft. The main purposes of this survey were to estimate the abundance
and distribution of moose, and proportions of calves, yearlings, cows, and bulls in the population.
We counted all moose in survey blocks covering about 14% of the total area.
This was only about two-thirds of the area we had intended to survey
because a lack of aircraft availability, cold temperatures, and windy conditions precluded completing the full survey. We found a total of 106 moose, of which 48 were adult bulls, 48 were adult and yearling cows, 3
were yearling bulls, and 7 were calves.
We calculated a population estimate of 652 ± 35% moose for the area, which
is equal to a density of about 154 per 1,000 km2 over the whole area, or 156 per 1,000 km2 in suitable moose habitat. This estimate may be slightly low because we did not correct it for the number of moose that we missed
during the survey. In addition, poor weather prevented us from counting moose in much of the area and the precision of our estimate is low, so these
results may not be reliable.
We estimated that there were about 16 calves and 11 yearlings for every 100
adult cows in the survey area. This suggests that survival of calves and young moose was fairly low during 2000 and 2001.
We estimated that there were about 108 bulls for every 100 cows in the
survey area, which is a very high sex ratio compared to most areas in the Yukon. This estimate has low precision, however, because we were unable
to complete the survey, and it may be biased high because of the lower visibility of cows.
Harvest of moose in this area appears to be within but near maximum sustainable limits.
Lower Stewart River Early-winter Moose Survey - Nov.-Dec. 2001 ii
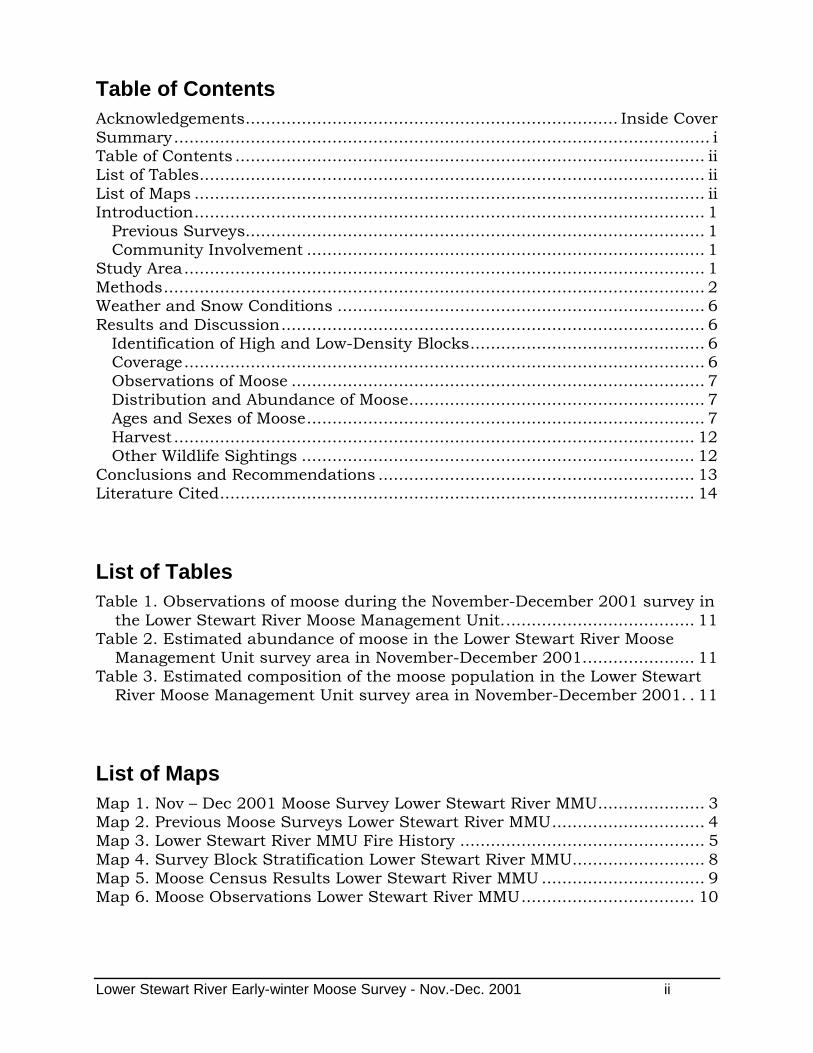
Table of Contents
Acknowledgements ......................................................................... Inside Cover
Summary ......................................................................................................... i Table of Contents ............................................................................................ ii List of Tables................................................................................................... ii
List of Maps .................................................................................................... ii Introduction .................................................................................................... 1
Previous Surveys.......................................................................................... 1
Community Involvement .............................................................................. 1
Study Area ...................................................................................................... 1
Methods .......................................................................................................... 2
Weather and Snow Conditions ........................................................................ 6
Results and Discussion ................................................................................... 6
Identification of High and Low-Density Blocks .............................................. 6
Coverage ...................................................................................................... 6
Observations of Moose ................................................................................. 7
Distribution and Abundance of Moose .......................................................... 7
Ages and Sexes of Moose .............................................................................. 7
Harvest ...................................................................................................... 12
Other Wildlife Sightings ............................................................................. 12
Conclusions and Recommendations .............................................................. 13
Literature Cited ............................................................................................. 14
List of Tables
Table 1. Observations of moose during the November-December 2001 survey in
the Lower Stewart River Moose Management Unit. ..................................... 11 Table 2. Estimated abundance of moose in the Lower Stewart River Moose
Management Unit survey area in November-December 2001. ..................... 11
Table 3. Estimated composition of the moose population in the Lower Stewart River Moose Management Unit survey area in November-December 2001. . 11
List of Maps
Map 1. Nov – Dec 2001 Moose Survey Lower Stewart River MMU ..................... 3 Map 2. Previous Moose Surveys Lower Stewart River MMU .............................. 4 Map 3. Lower Stewart River MMU Fire History ................................................ 5
Map 4. Survey Block Stratification Lower Stewart River MMU.......................... 8 Map 5. Moose Census Results Lower Stewart River MMU ................................ 9 Map 6. Moose Observations Lower Stewart River MMU .................................. 10

Lower Stewart River Early-winter Moose Survey - Nov.-Dec. 2001 1
Introduction
This report summarises the results
of the early-winter survey of moose in a part of the Lower Stewart River Moose Management Unit (see Map
1), conducted on 10 November - 23 December 2001. The main purposes
of this survey were to estimate abundance, distribution and population composition of the local
moose population.
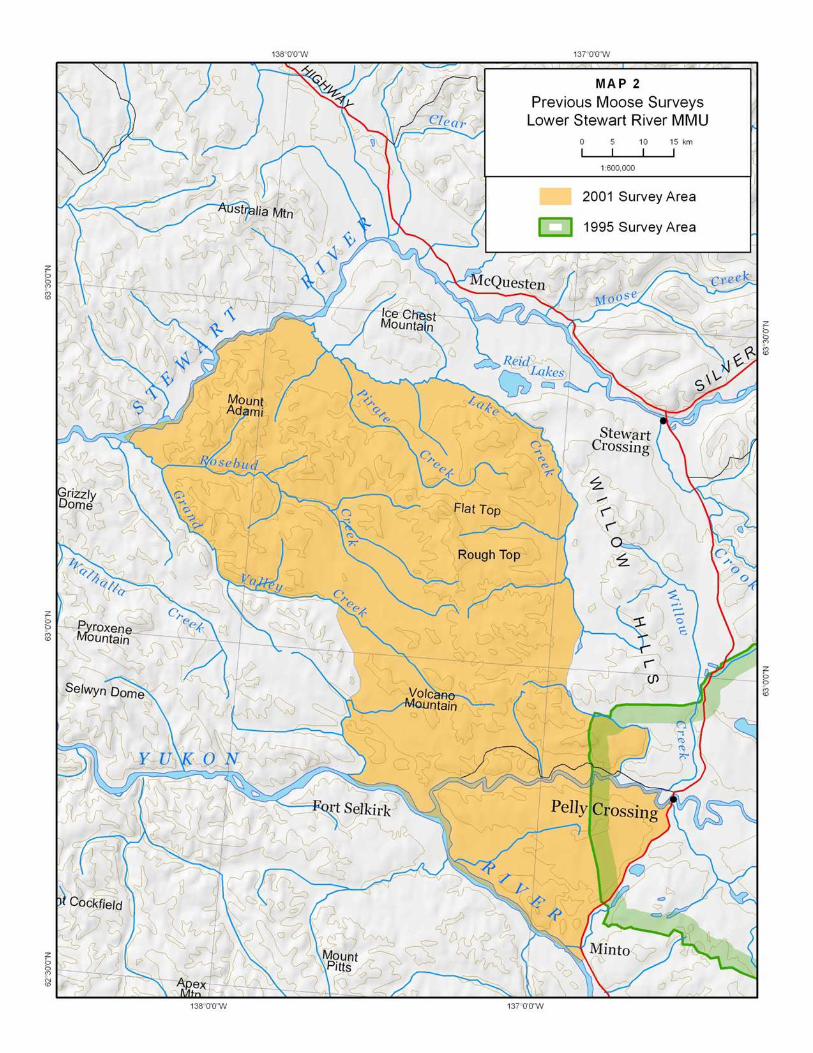
Previous Surveys
Environment Yukon has conducted
only one other moose survey in previous years in areas that overlapped substantially with this
survey area (see Map 2). We conducted an early-winter census that included part of the
southeastern survey area in 1995 (results in Ward et al. 1998).
Early winter is the best time of year to estimate abundance of moose because of their
concentration in high-altitude open habitats. Bull moose still have antlers at this time of year, so early-
winter surveys also allow us to estimate the proportion of bulls in
the population.
Community Involvement
Residents of the Mayo area have consistently placed a high priority
on monitoring the health of the local moose population. Regular
monitoring of moose populations in the Na-Cho Nyäk Dun traditional territory was recommended in the
Integrated Wildlife Management Plan for the Na-Cho Nyäk Dun Traditional Territory, May 1997, which was
developed cooperatively by the Mayo District Renewable Resources
Council, the First Nation of Na-Cho
Nyäk Dun, and the Yukon Fish and Wildlife Branch.
Study Area
The Lower Stewart River 2001 survey area was located to conform
to the boundaries of Yukon Moose Management Units. These Moose
Management Units were developed to help us more consistently monitor and manage moose in all areas
throughout the Yukon. We plan to monitor the health of moose
populations in priority moose management units using both aerial and ground-based surveys.
The Lower Stewart River Moose Management Unit is about 7,118 km², and includes Game
Management Subzones (GMS) 3-13, 3-14, 3-15, 3-16, and 3-19 (see Map
1). The survey area is about 4,224 km² and includes GMSs 3-16 and 3-19 in the eastern part of the Lower
Stewart Moose Management Unit, and also GMS 3-20 in the
northwestern Tatchun Moose Management Unit. The border runs along the Stewart River in the north,
Lake Creek and the Klondike Highway in the east, the Yukon River in the south, and Grand Valley
Creek in the west.
Most of the survey area (about
4,179 km²) is considered suitable moose habitat, except for approximately 1% of the area, which
includes large water bodies (0.5 km2
or more in size) and land at or over 1,524 m (5,000 feet) in elevation.
The survey area consists mostly of rolling hills and plateaus, dissected
by numerous creeks, in the drainages of the Stewart, Pelly, and Yukon rivers. Much of the area is
forest-covered with black and white spruce, aspen, paper birch, and

Lower Stewart River Early-winter Moose Survey - Nov.-Dec. 2001 2
lesser amounts of lodgepole pine; balsam poplar also grows along the
larger rivers. Forest cover varies from dense mature white spruce
and poplar in the main river valleys, to dense younger spruce in many lowlands, to more open mixed
spruce, birch and aspen on slopes. Many of the creek valleys have shrubby willow flats along them.
Willow and dwarf birch shrub habitats, alpine tundra, and
unvegetated rocky areas typify the higher plateaus and peaks of Flat Top and Rough Top in the White
Mountains and Mount Adami in the northern part of survey area.
Old and recent burns occur throughout the study area (see Map 3), and these vary in quality as
moose habitat. The most recent large fires were a 745 km² 1998 burn in the Willow Hills, a 589 km²
1995 burn around Minto in the southern part of the area, and a 421
km² 1980 burn along the Pelly River.
Methods
We have adopted a relatively new survey technique to survey moose, developed by the Alaska Department
of Fish and Game. This method is similar to the way we conducted our
moose surveys in the past, except it is less expensive because we use only fixed-wing aircraft for the entire
survey instead of helicopters. The technique involves 5 steps:
1. The survey area is divided into
uniform rectangular blocks about 15-16 km² (2' latitude x 5'
longitude) in size.
2. Observers in fixed-wing aircraft fly over all the blocks quickly,
and classify (or “stratify”) them
as having either high, medium, low, or very low expected moose
abundance, based on local knowledge, number of moose
seen, tracks, and habitat. This is called the “stratification” part of the survey.
3. We combine these categories of blocks into high and low “strata”, and then randomly select a
sample of each stratum for our census. We typically select a
higher proportion of the high blocks than the low blocks to survey.
4. We try to count every moose within the selected blocks (the
“census” part of our survey) using Super Cubs, at a search intensity of about 2 minutes per km². We classify all moose seen
by age (adult, yearling, or calf) and sex. Yearling cows are often
difficult to distinguish from adults, so we classify all cows as
adults, and later estimate the number of yearling cows that were present among the older
cows by assuming it equals the number of yearling bulls we saw.
5. We use a computer program
(Gasaway et al. 1986) to estimate the total number of moose by age
and sex in the entire survey area based on the numbers of moose counted in the blocks during the
census, the distribution of these blocks, and how we classified the
blocks we didn’t count. Generally, the more blocks that are searched during the census
part of the survey, the more precise and reliable is the resulting population estimate.

STUDY AREA


Lower Stewart River Early-winter Moose Survey - Nov.-Dec. 2001 6
Weather and Snow Conditions
Weather conditions made it difficult to fly and ultimately delayed the survey long enough that we were not
able to complete it. We had good weather conditions for the
stratification part of the survey in mid-November, but then had an 8–day delay before Super Cubs were
available for the census. Once we started the census on 20 November, we tried for over a month to
complete it. We were completely shut down by poor flying conditions
(high winds, snow, freezing drizzle, or low clouds) and 2 cold snaps on 27 days, and had to stop flying early
because of poor weather on 2 other days. Temperatures ranged from
-44°C to +1°C. Light conditions ranged from flat to bright and snow coverage was complete, so visibility
was generally good for spotting moose. Day lengths, however, were very short by the end of the survey,
greatly limiting the amount of time we could fly.
Results and Discussion
Identification of High and Low-Density Blocks
We flew over the entire survey area
in a 4-seat Cessna 185 with the pilot and 3 observers. We averaged 0.11 minutes per km2 during the
stratification flights.
We classified 31 (11%) of the 270
survey blocks as high, 62 (23%) as medium, 54 (20%) as low, and 123 (46%) as very low expected
abundance of moose (see Map 4), based on our observations from the air. Most of the blocks with higher
expected numbers of moose were located in the northern part of the
survey area in recent burns and mountainous areas, and in areas
burned in the 1970s and 1980s near the Pelly River. For the purpose of selecting blocks for the census,
we grouped the 93 blocks expected to have high and medium numbers of moose into a High stratum, and
the 177 blocks with low and very low expected numbers of moose into
the Low stratum.
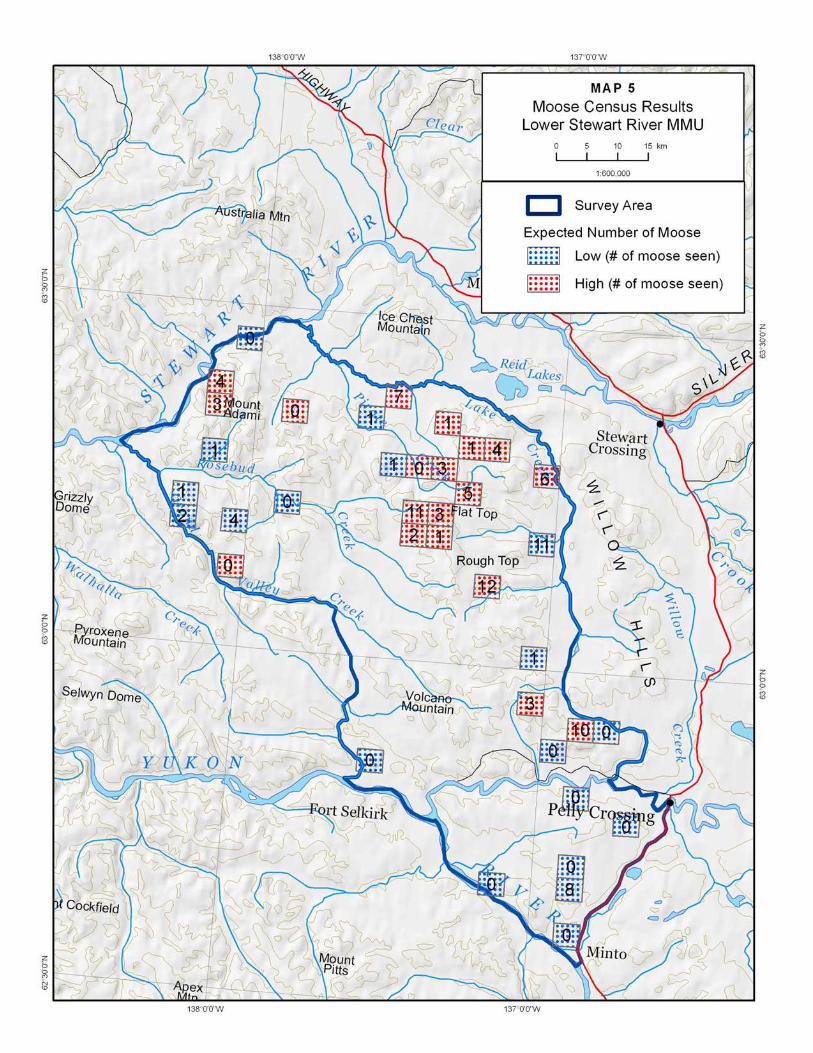
Coverage
We counted moose in 38 of the 270 blocks, or about 14% of the total
area (see Map 5). This was less than the 60 blocks we had originally intended to survey, but availability
of aircraft and poor weather prevented us from completing the
survey. It took us about 17.9 hours to count moose in these blocks, for a search intensity of 1.80 minutes per
km², which is slightly less than our target search intensity of 2 minutes
per km². Survey intensity was about the same in low-abundance (1.73 minutes per km²) and high-
abundance (1.87 minutes per km²) blocks. We used an additional 28.9 hours ferrying between survey
blocks, to fuel caches at the McQuesten and Pelly Crossing air
strips, and back and forth to Mayo. Ferry time (62% of total flying time) was far higher than for most surveys
because of poor weather and the remoteness of the survey area.

Lower Stewart River Early-winter Moose Survey - Nov.-Dec. 2001 7
Observations of Moose
We counted a total of 106 moose, 48 of them adult bulls, 48 adult and
yearling cows, 3 yearling bulls, and 7 calves (see Table 1). We observed
an average of 257 moose for every 1,000 km² in the high-abundance blocks, and 101 moose per 1,000
km² in the low blocks.
Distribution and Abundance of Moose
Moose were widely distributed in the survey area (see Maps 5 and 6), and
we found them in a variety of habitats. As expected for the early
winter, subalpine willow flats, higher altitude burns, and creek draws with abundant willows
generally had good numbers of moose in them. We saw few moose in forested lowlands and lower-
elevation slopes.
The estimated number of moose
in the entire survey area, based on
our census counts, was 652 35%
(see Table 2). The degree of
uncertainty ( 35%) is higher than
the target precision ( 20%) that we aim for in these surveys, largely
because of the relatively low number of blocks we were able to survey.
The estimated density of moose
in the survey area was 154 per 1,000 km² of total area, or 156 per
1,000 km² of suitable moose habitat (see Table 2). This is about equal to the Yukon-wide average of 153
moose per 1,000 km² of total area. We did not correct our estimates of
density for sightability in this survey, so this year’s estimate is likely an underestimate of the true
density because some moose (about 7% in early-winter moose surveys to
date) are inevitably missed by observers.
Ages and Sexes of Moose
Calf survival to the early winter was poor in 2001 in the survey area. Based on our survey results, there
were an estimated 16 calves for every 100 adult cows (see Table 3). In general, about 25-30 calves per
100 adult cows are considered necessary for maintaining stable
moose populations in areas with typical mortality rates. Calves made up an estimated 7% of the
population in 2001. We saw no cows with twins.
The estimated percentage of
yearlings in the population in the survey area—5%—was also low (see
Table 3). There were an estimated 11 yearlings per 100 adult cows, or about 5 per 100 adults. Depending
on mortality rates, about 10-20 yearlings per 100 adults are
required for maintaining stable populations (Yukon Fish and Wildlife Branch 1996). We estimate
that there were 108 adult bulls for every 100 adult cows in the survey area (see Table 3). This is
considerably higher than the Yukon-wide average of 69 bulls per 100
cows in areas that have been surveyed, and well above the minimum level of 30 bulls per 100
cows needed to ensure most cows are bred (Yukon Fish and Wildlife
Branch 1996). This estimate may be biased high, however, because cows are generally less visible than bulls
because of their use of denser cover.

Lower Stewart River Early-winter Moose Survey - Nov.-Dec. 2001 8
Lower Stewart River Early-winter Moose Survey - Nov.-Dec. 2001 9

Lower Stewart River Early-winter Moose Survey - Nov.-Dec. 2001 10

Lower Stewart River Early-winter Moose Survey - Nov.-Dec. 2001 11
Table 1. Observations of moose during the November-December 2001 survey in the Lower Stewart River Moose Management Unit.
High Blocks Low Blocks Total
Number of Blocks Counted 19 19 38 Number of Adult Bulls Observed 33 15 48 Number of Adult and Yearling Cows Observed* 35 13 48 Number of Yearling Bulls Observed 3 0 3 Number of Calves Observed 5 2 7 * Adult and yearling cows cannot always be reliably distinguished from the air, so they are counted together. Assuming that equal numbers of males and females are born and that they survive about equally well until they’re yearlings, the number of yearling cows in these totals should be about the same as the number of yearling bulls observed during the survey. We used this assumption to estimate the total number of yearlings in the survey area presented in Table 2.
Table 2. Estimated abundance of moose in the Lower Stewart River Moose Management Unit survey area in November-December 2001.
Best Estimate 90% Confidence Interval*
Estimates within 90% Confidence Interval*
Estimated Total Number of Moose 652 35% 423-881
Adult Bulls 302 47% 160-443
Adult Cows 278 39% 169-387
Yearlings 29 113% 0-63
Calves 43 58% 18-68
Density of Moose (per 1,000 km2) Whole Area 154 Moose Habitat Only** 156
* A “90% confidence interval” means that, based on our survey results, we are 90% sure that the true number lies within this range of numbers. Our best estimate is near the middle of this range.
** Suitable moose habitat is considered all areas at elevations lower than 1,524 m (5,000 ft.), excluding water bodies 0.5 km
2 or greater in size.
Table 3. Estimated composition of the moose population in the Lower Stewart River Moose Management Unit survey area in November-December 2001.
Best Estimate Estimates within 90% Confidence Interval*
% Adult Bulls 46% 37-56% % Adult Cows 43% 32-53% % Yearlings 5% 0-10% % Calves 7% 3-10% Bulls per 100 Adult Cows 108 61-156 Yearlings per 100 Adult Cows 11 0-24 Calves per 100 Adult Cows 16 6-25 % of Cow-Calf Groups with Twins 0% 0-0% * A “90% confidence interval” means that, based on our survey results, we are 90% sure that the true number lies within this range of numbers, and that our best estimate is near the middle of this range.
Lower Stewart River Early-winter Moose Survey - Nov.-Dec. 2001 12
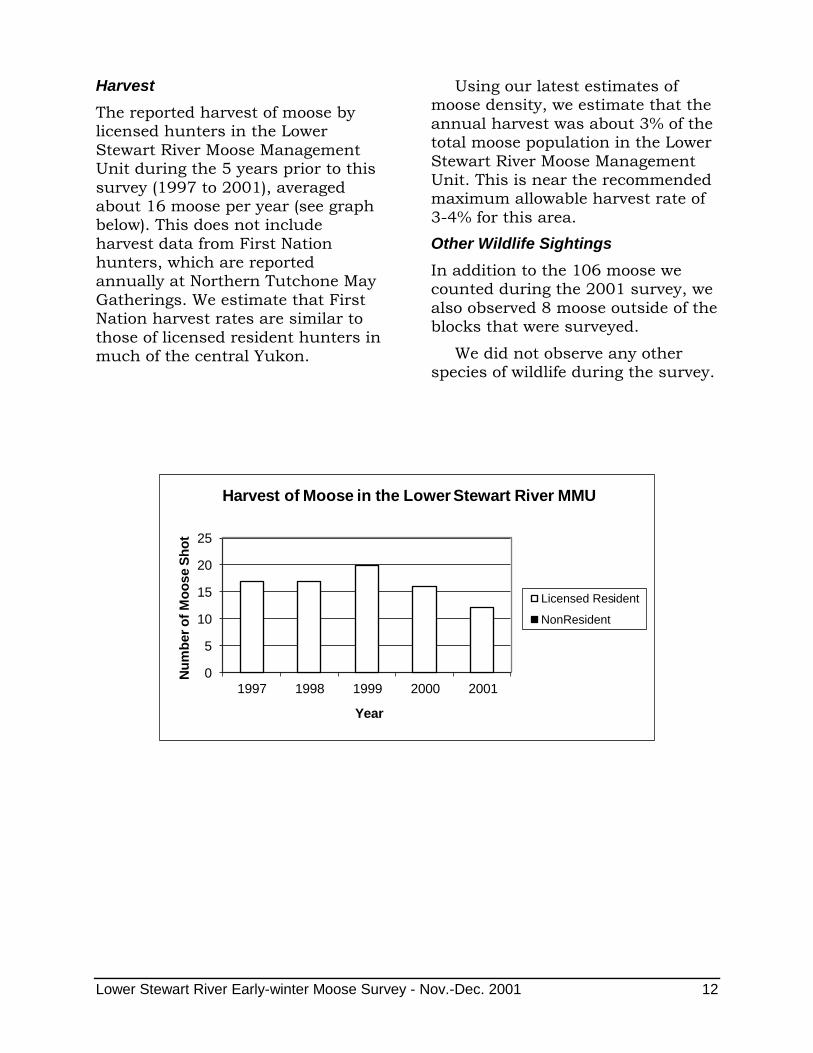
Harvest
The reported harvest of moose by licensed hunters in the Lower
Stewart River Moose Management Unit during the 5 years prior to this
survey (1997 to 2001), averaged about 16 moose per year (see graph below). This does not include
harvest data from First Nation hunters, which are reported annually at Northern Tutchone May
Gatherings. We estimate that First Nation harvest rates are similar to
those of licensed resident hunters in much of the central Yukon.
Using our latest estimates of moose density, we estimate that the
annual harvest was about 3% of the total moose population in the Lower
Stewart River Moose Management Unit. This is near the recommended maximum allowable harvest rate of
3-4% for this area.
Other Wildlife Sightings
In addition to the 106 moose we counted during the 2001 survey, we
also observed 8 moose outside of the blocks that were surveyed.
We did not observe any other species of wildlife during the survey.
0
5
10
15
20
25
1997 1998 1999 2000 2001
Nu
mb
er
of
Mo
ose S
ho
t
Year
Harvest of Moose in the Lower Stewart River MMU
Licensed Resident
NonResident

Lower Stewart River Early-winter Moose Survey - Nov.-Dec. 2001 13
Conclusions and Recommendations
We estimate that there were about 652 moose in the survey
area in the Lower Stewart River Moose Management Area. The estimated density was about 154
moose per 1,000 km2, which is about equal to the Yukon-wide
average.
There was poor survival of calves
in this area during the summer and fall of 2001. Survival of calves born in 2000 (yearlings in
this survey) was also quite poor. We have no data on long-term
trends in recruitment in the area.
The number of bulls in the
survey area, compared to the number of cows, was very high in this survey. The proportion of
bulls may be over-estimated, but we have no long-term data in the area.
Harvest of moose in the Lower Stewart River Moose
Management Unit was within but close to the maximum recommended allowable rate.
Using ground based monitoring and local knowledge we should
continue to closely monitor the status and harvest of the moose
population in the Lower Stewart River Moose Management Unit. If harvest levels approach upper
sustainable limits a census should be considered as an
action to update the population status.

Lower Stewart River Early-winter Moose Survey - Nov.-Dec. 2001 14
Literature Cited
GASAWAY, W. C., S. D. DUBOIS, D. J.
REED, AND S. J. HARBO. 1986. Estimating moose population parameters from aerial surveys.
Biological Papers of the University of Alaska, Fairbanks,
Alaska, USA.
WARD, R. M. P., B. MCLEAN, S. WESTOVER, R. FLORKIEWICZ, AND S.
P. WITHERS 1998. 1995-1996 moose surveys. Summary. Yukon
Fish and Wildlife Branch Progress Report PR-98-1. . Whitehorse, Yukon, Canada.
YUKON FISH AND WILDLIFE BRANCH.
1996. Moose management guidelines. Yukon Fish & Wildlife Branch.