Lower Snake River Juvenile Salmon Migration Feasibility … · Lower Snake River Juvenile Salmon...
178
Predecisional Documentation For Information Purposes Only - Not For Comment Predecisional Documentation For Information Purposes Only - Not For Comment US Army Corps of Engineers Walla Walla District Lower Snake River Juvenile Salmon Migration Feasibility Study Draft Social Analysis Report Prepared by Foster Wheeler Environmental Corporation June 1999
Transcript of Lower Snake River Juvenile Salmon Migration Feasibility … · Lower Snake River Juvenile Salmon...
Predecisional DocumentationFor Information Purposes Only - Not For Comment
Predecisional DocumentationFor Information Purposes Only - Not For Comment
US Army Corps of EngineersWalla Walla District
Lower Snake River Juvenile Salmon MigrationFeasibility Study
Draft Social Analysis Report
Prepared byFoster Wheeler Environmental Corporation
June 1999

Predecisional DocumentationFor Information Purposes Only - Not For Comment
Predecisional DocumentationFor Information Purposes Only - Not For Comment
FOREWORD
This document is the product of the US Army Corps of Engineers' (Corps) efforts toinvolve the region in the development of the Lower Snake River Juvenile SalmonMigration Feasibility Report/Environmental Impact Statement (FR/EIS). The Corps hasreached out to regional stakeholders (states, tribes, Federal agencies, organizations,and individuals) for the input and development of various work products. This andvarious other products associated with the development of the EIS process, theopinions and/or findings expressed herein do not necessarily reflect the official policy orposition of the Corps. The Corps will review and incorporate information from theseproducts into the analysis and development of the Draft FR/EIS
In addition, this analysis is only one part of the overall Economic Appendix of the EIS.Other critical components of the economic analysis include power, water supply,recreation, regional, and tribal impacts. For a true economic analysis of the implicationsof any of the study alternatives, economic costs and benefits of all the components ofthe analysis must be considered, but without any individual component taken out ofcontext.
This document is being released for information purposes only. The Corps will not beresponding to comments at this time. The formal comment period will coincide with therelease of the Draft FR/EIS, expected in Fall 1999.
Predecisional DocumentationFor Information Purposes Only - Not For Comment
Predecisional DocumentationFor Information Purposes Only - Not For Comment
Table of Contents
1. Introduction
1.1 - Organization of the Report
1.2 - Purpose
1.3 - Scope
1.4 - Methodology and Assumptions
2. Characterization of Study Region and Communities
2.1 - Regional Overview/Trends
2.2 - Characteristics of Communities
2.3 - Focus Community Baseline Profiles
3. Description of Social Impacts: Geographic and Temporal Scope
3.1 - Power
3.2 - Recreation
3.3 - Regional Transportation/Navigation
3.4 - Anadromous Fish
3.5 - Irrigation and Municipal and Industrial Water
3.6 - Implementation
3.7 - Air Quality
3.8 - Salmon Recovery
3.9 - Social Impact Evaluation
4. Description and Comparison of Community Social Impacts
4.1 - Allocation of Regional Employment Impacts to Study Regions and FocusCommunities
4.2 - Comparison of Alternatives by Community
Predecisional DocumentationFor Information Purposes Only - Not For Comment
Predecisional DocumentationFor Information Purposes Only - Not For Comment
5. Mitigation Analysis
5.1 - Summary of Mitigation
5.2 - Potential Mitigation for Employment Impacts
5.3 - Potential Mitigation Examples for Community Social Impacts
5.4 - Compensation Potential
6. Literature Cited
Annex A - Regional Information
Annex B - The Effects of Socioeconomic Changes on Rural Agricultural Communities: AReview of the Literature
List of Figures
Figure 1 - Study Subregions and Focus CommunitiesFigure 2 - Income by Subregion, 1970-1995Figure 3 - Farm Income as a Percentage of Total Income by Subregion, 1970-95Figure 4 - Total Farm Income by Subregion, 1970-95 (1995, thousands of dollars)Figure 5 - Farm Employment by Subregion, 1970-95Figure 6 - Number and Average Size of Farms in the Downriver Subregion, 1959-92Figure 7 - Number and Average Size of Farms in the Reservoir Subregion, 1959-92Figure 8 - Number and Average Size of Farms in the Upriver Subregion, 1959-92Figure 9 - Distribution of Communities Within the Lower Snake River SubregionsFigure 10 - Distribution of Community Size in the Lower Snake RegionFigure 11 - Percentage of Communities in LSR Region by Economic DiversityFigure 12 - Number of LSR Communities by Percentage of Direct Employment inIndustrial SectorsFigure 13 - 1997 BPA Sources of Revenue as Percentage of Total Revenue ($2,271million)Figure 14 - Percentage of Total Bushels Shipped on LSR by Place of OriginFigure 15 - Percent of Total Transportation Cost Increase A3 by State
Predecisional DocumentationFor Information Purposes Only - Not For Comment
Predecisional DocumentationFor Information Purposes Only - Not For Comment
List of Tables
Table 1 - Regional Analysis Study AreaTable 2 - Selected Focus CommunitiesTable 3 - Population by Subregion, 1970-95Table 4 - Per Capita Income by Subregion, 1970-95Table 5 - Employment in the 25 Study Counties, 1970-95Table 6 - Employment by Subregion, 1995Table 7 - Poverty Rates by Subregion, 1979-89Table 8 - Age by Subregion, 1980-90Table 9 - Race and Ethnicity in the 25 Study Counties, 1980 to 1990Table 10 - ERS Typologies by County, 1979-89Table 11 - Communities Located in the Lower Snake River SubregionsTable 12 - Communities in LSR Region by Economic DiversityTable 13 - 1995 Direct Employment by SectorTable 14 - Potential Monthly Electric Bill IncreasesTable 15 - Importance of Recreational Activities on the 4 Lower Snake PoolsTable 16 - Trends in Rural Agricultural CommunitiesTable 17 - Grain Movements and Share of Total Costs by Affected Study Area CountiesTable 18 - Increased Transportation Costs and Total Costs per Bushel by CountyTable 19 - Increased Transportation Costs and Total Costs per Acre by CountyTable 20 - Adams County and Whitman County Representative Farm BudgetsTable 21 - Net Farm ImpactsTable 22 - CRP Acres by Affected Counties in the Lower Snake River SubregionTable 23 - Potential Illustrative Impacts of Alternative A3 on Rural AgriculturalCommunitiesTable 24 - Pending Review by Whitman County Tax AssessorTable 25 - Road Congestion Effects of Drawdown Truck TrafficTable 26 - Regional Safety Impacts of Increased Truck TrafficTable 27 - Ice Harbor Acreage Contribution to Overall Agricultural Acreage in Franklinand Walla Walla CountiesTable 28 - Acreage Dedicated to Crops in Franklin and Walla Walla CountiesTable 29 - Distribution of Wells Within One Mile of the Lower Snake River and Costs ofModificationTable 30 - Rough Estimate of Traffic Flow Over Lower Snake River FacilitiesTable 31 - Criteria for Evaluating Significance of Changes in the Physical, Biological,and Socioeconomic EnvironmentTable 32 - Distribution of Long-term and Short-term Water Supply Employment ImpactsTable 33 - Transportation Employment Impacts by Subregion

Predecisional DocumentationFor Information Purposes Only - Not For Comment
Predecisional DocumentationFor Information Purposes Only - Not For Comment
Table 34 - Distribution of Long- and Short-Term Employment Impacts from Changes inPower Production and Cost for A3Table 35 - Employment Associated with Changes in Recreational Visitation bySubregionTable 36 - Distribution of Employment Impacts from Lost Operations and Short-TermConstruction for A3Table 37 - Long-term Employment Changes for A3 as Allocated by SubregionTable 38 - Forecast Direct, Indirect and Induced Long-term Employment Losses bySubregionTable 39 - Net Long-Term Changes by Subregion as Percentages of Total RegionalEmploymentTable 40 - Forecast Peak Short-Term Employment Impacts (A3) as Allocated bySubregionTable 41 - Net Short-Term Employment Changes by Subregion A3 as a Percentage ofSubregional EmploymentTable 42 - Clarkston Evaluation Matrix of ImpactsTable 43 - Colfax Evaluation Matrix of ImpactsTable 44 - Pomeroy Evaluation Matrix of ImpactsTable 45 - Kennewick Evaluation Matrix of ImpactsTable 46 - Pasco Evaluation Matrix of ImpactsTable 47 - Umatilla Evaluation Matrix of ImpactsTable 48 - Lewiston Evaluation Matrix of ImpactsTable 49 - Orofino Evaluation Matrix of ImpactsTable 50 - Riggins Evaluation Matrix of Impacts
Predecisional DocumentationFor Information Purposes Only - Not For Comment
Predecisional DocumentationFor Information Purposes Only - Not For Comment
Acronyms
BEABLSBoRBPACCCCorpsCRITFCCRPDREW HITESAEWITSFeasibility StudyFEMATHDRICBEMPI-OM&INEDNMFSP&GPATHPotlatchPUDSBCSORUSDA
Bureau of Economic AnalysisBureau of Labor StatisticsBureau of ReclamationBonneville Power AdministrationCivilian Conservation CorpsU.S. Army Corps of EngineersColumbia River Inter-Tribal Fish CommissionConservation Resource ProgramDrawdown Regional Economic Workgroup Hydropower Impact TeamEndangered Species ActEastern Washington Intermodal Transportation StudyLower Snake River Juvenile Salmon Migration Feasibility StudyForest Ecosystem Management Assessment TeamHDR Engineering, Inc.Interior Columbia Basin Ecosystem Management ProjectInput-Output ModelMunicipal and IndustrialNational Economic DevelopmentNational Marine Fisheries ServicePrinciples and GuidelinesPlan for Analyzing and Testing HypothesesPotlatch CorporationPublic Utilities DistrictSurface Bypass CollectorSystem Operation ReviewU.S. Department of Agriculture

Predecisional DocumentationFor Information Purposes Only - Not For Comment
Predecisional DocumentationFor Information Purposes Only - Not For Comment
1. Introduction
1.1 Organization of the Report
This report is divided into five sections. Section 1 details the purpose, scope,methodology, and assumptions that guide this study. Existing and historicsocioeconomic conditions are described in Section 2. Information is provided at theregional and community scale with emphasis also placed on selected focuscommunities. Section 3 describes the potential social impacts across the region andacross time under each of the proposed alternatives. Section 4 projects potential socialimpacts for each of the focus communities under consideration and compares thesecommunity level social impacts across the alternatives. Section 5 discusses potentialsocial mitigation activities and provides preliminary cost estimates.
1.2 Purpose
The purpose of this Social Analysis Report is to examine the range of potential socialimpacts that may occur as a result of actions designed to recover wild salmonpopulations on the lower Snake River through the Lower Snake River Juvenile SalmonMigration Feasibility Study (Feasibility Study). This report focuses on the potentialcommunity level impacts resulting from changes in the local and regional biological,economic, and physical environment. While other reports addressing the economicimpacts of the proposed alternatives focus on national economic development (NED),this report attempts to outline the distributional and equity effects on specificcommunities within the broader regional context. Communities are the focus of thisreport because it is at this level that social impacts resulting from resource policychanges may be most keenly felt (Force and Machlis, 1997). This study has beendesigned to meet the requirements specified in the U.S. Army Corps of Engineers(Corps) 1983 Principles and Guidelines for Water and Related Land ResourcesImplementation Studies (P&G). The key issues addressed include the following:
• what the social impacts will be and when (timing);
• who will be affected;
• how they will be affected (beneficial/adverse);
• how much they will be affected; and
• how the communities may respond.
Predecisional DocumentationFor Information Purposes Only - Not For Comment
Predecisional DocumentationFor Information Purposes Only - Not For Comment
By answering these questions through the use of qualitative and quantitative data, thesocial analysis provides a greater understanding of the anticipated impacts andhighlights the need for and location of potential mitigation measures. Uncertainty existsthroughout this analysis because of the uniqueness of the proposed actions and theunknown nature of how markets, communities, and political entities will respond to theimplementation of these actions, particularly the natural river drawdown alternative. Thedegree and magnitude to which the proposed alternative will affect communitiesthroughout the region depends in large part on how these communities respond topotential and actual changes.
1.3 Scope
The scope of the analysis in this report covers the potential social impacts associatedwith the four main alternatives under consideration by the Corps. These alternativesinclude the base case or existing condition (A1), existing conditions with maximumtransport (A2a), major system improvements (A2c), and natural river drawdown or dambreaching (A3). The effects on the human environment of A2a and A2c do not differsignificantly and therefore will be referred to as A2 unless a distinction is made.
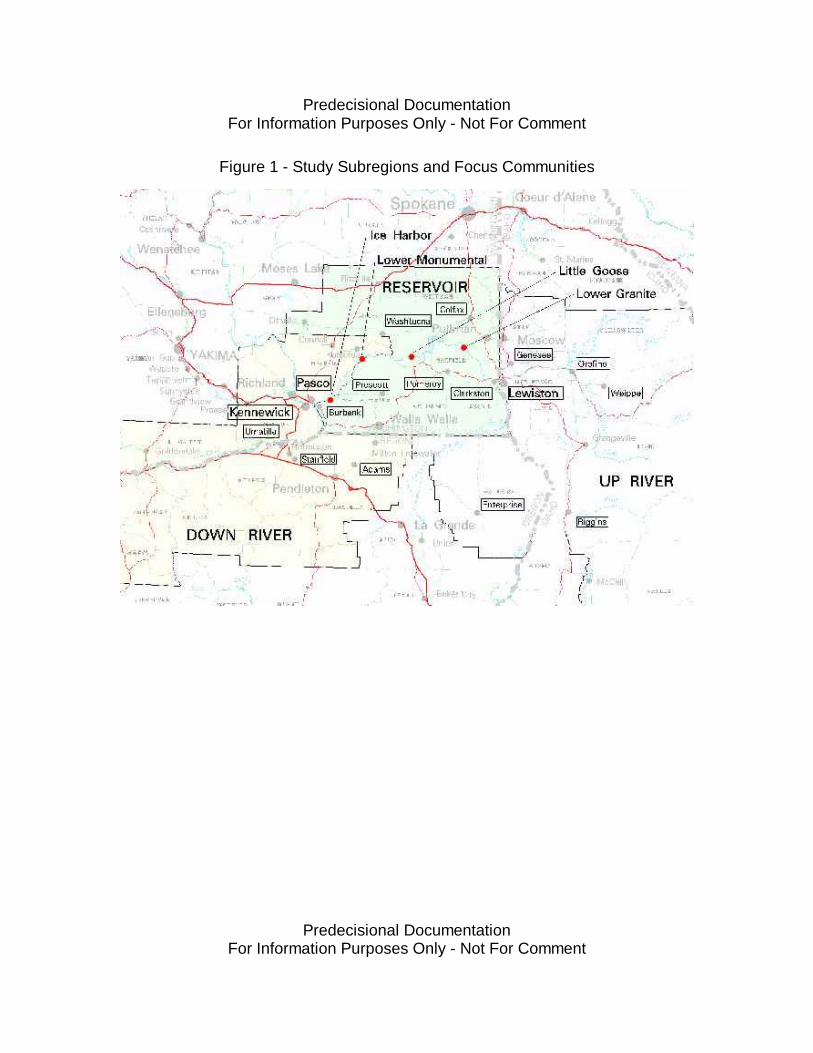
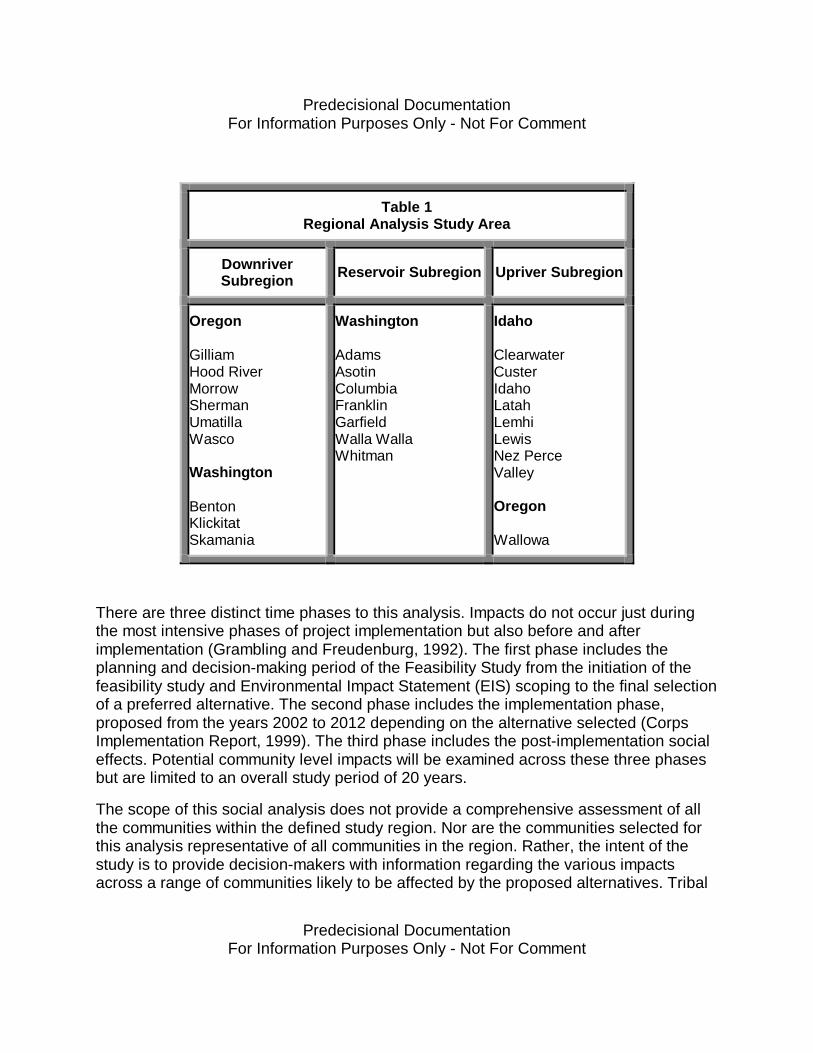
The geographic scope of the analysis will be limited to communities within the lowerSnake River region (Figure 1). This region includes the counties listed in Table 1 andthe communities listed in Table 2. For the purpose of analysis, the potentially affectedlower Snake River region was divided into three subregions: downriver, reservoir, andupriver. The counties that comprise these subregions and the combined lower SnakeRiver study area are identified in Table 1. Three distinct subregions were created tobetter understand the differential effects of the proposed alternatives. For a morecomplete description of the definition, justification, and delineation of the subregions seethe Regional Economic Report (AEI, 1999).
Predecisional DocumentationFor Information Purposes Only - Not For Comment
Predecisional DocumentationFor Information Purposes Only - Not For Comment
Figure 1 - Study Subregions and Focus Communities
Predecisional DocumentationFor Information Purposes Only - Not For Comment
Predecisional DocumentationFor Information Purposes Only - Not For Comment
Table 1Regional Analysis Study Area
DownriverSubregion Reservoir Subregion Upriver Subregion
Oregon
GilliamHood RiverMorrowShermanUmatillaWasco
Washington
BentonKlickitatSkamania
Washington
AdamsAsotinColumbiaFranklinGarfieldWalla WallaWhitman
Idaho
ClearwaterCusterIdahoLatahLemhiLewisNez PerceValley
Oregon
Wallowa
There are three distinct time phases to this analysis. Impacts do not occur just duringthe most intensive phases of project implementation but also before and afterimplementation (Grambling and Freudenburg, 1992). The first phase includes theplanning and decision-making period of the Feasibility Study from the initiation of thefeasibility study and Environmental Impact Statement (EIS) scoping to the final selectionof a preferred alternative. The second phase includes the implementation phase,proposed from the years 2002 to 2012 depending on the alternative selected (CorpsImplementation Report, 1999). The third phase includes the post-implementation socialeffects. Potential community level impacts will be examined across these three phasesbut are limited to an overall study period of 20 years.
The scope of this social analysis does not provide a comprehensive assessment of allthe communities within the defined study region. Nor are the communities selected forthis analysis representative of all communities in the region. Rather, the intent of thestudy is to provide decision-makers with information regarding the various impactsacross a range of communities likely to be affected by the proposed alternatives. Tribal
Predecisional DocumentationFor Information Purposes Only - Not For Comment
Predecisional DocumentationFor Information Purposes Only - Not For Comment
communities are not examined as part of this study. A study entitled, TribalCircumstances, prepared by the Columbia River Inter-Tribal Fish Commission(CRITFC), documents the potential social, cultural and economic effects of theproposed alternatives on tribal populations (Meyer, 1999).
1.4 Methodology and Assumptions
In order to address the key study questions, the following steps were taken to obtainreliable information on potential social impacts: 1) develop an understanding of theissues raised in the original scoping conducted by the Corps in 1995 and through thepublic information meetings conducted by the Corps during this study, 2) select keyfocus communities to capture the range of possible direct impacts, 3) select appropriatesocial indicators for the types of anticipated social impacts, 4) describe the trends andhistory of the region and case study communities, and 5) develop estimates of potentialimpacts, the magnitude of these impacts, and the range of community responses. Thisanalysis is supplemented by information obtained through a series of interactivecommunity forums, which included each of the focus communities. The communityforum information includes each community’s perceptions of its history, an assessmentof its current situation, and a projection of potential social impacts under each of theproposed alternatives. The data sources and methods for each step are described inthe following sections.
1.4.1 Selection of Focus Communities
Secondary data sources, including the 1990 Census of Population and Housing and the1992 Census of Agriculture, as well as preliminary impacts identified by the DrawdownRegional Economic Workgroup (DREW) study teams, were consulted to evaluatecommunities for inclusion as focus communities. The study team examined the potentialimpacts of the three alternatives under consideration to identify a group of focuscommunities that met the following criteria:
• Communities that might experience large potential impacts (positive or negative)as a result of the project alternatives; and
• Communities that are diverse in size, economic activity, and potentialsocioeconomic impacts (level, type, and timing of impacts).
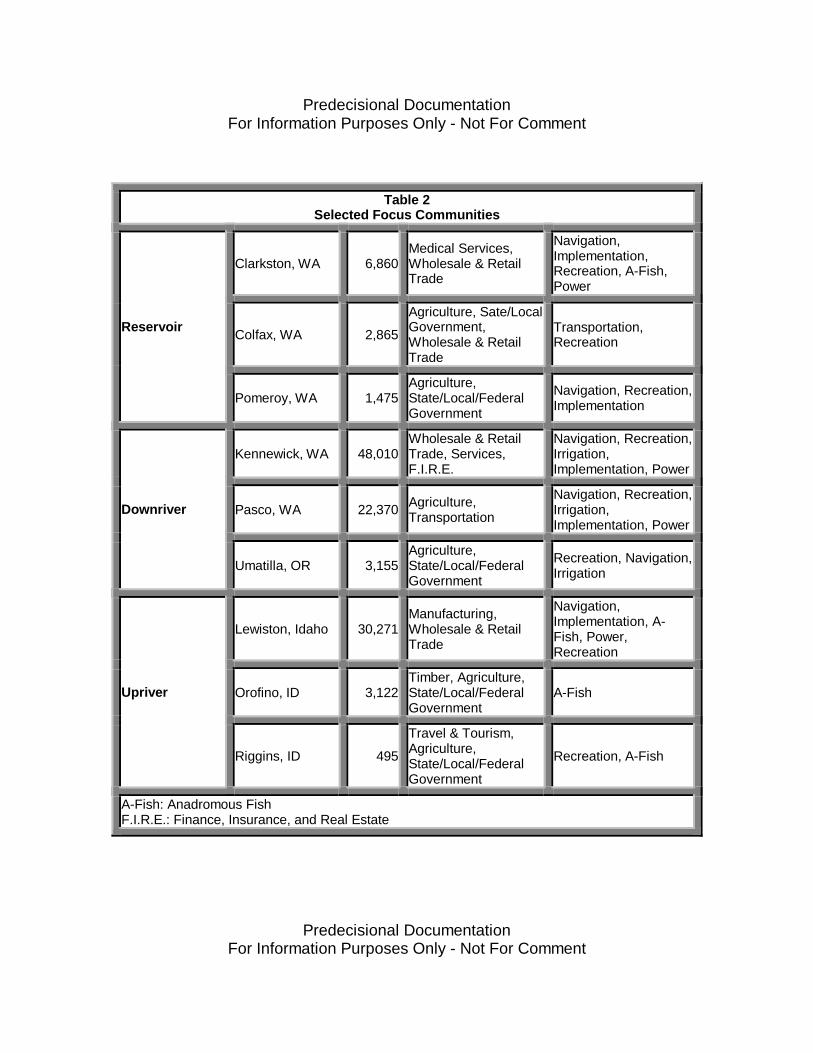
Table 2 lists the communities selected as focus communities for this study.
Predecisional DocumentationFor Information Purposes Only - Not For Comment
Predecisional DocumentationFor Information Purposes Only - Not For Comment
Table 2Selected Focus Communities
Clarkston, WA 6,860Medical Services,Wholesale & RetailTrade
Navigation,Implementation,Recreation, A-Fish,Power
Colfax, WA 2,865
Agriculture, Sate/LocalGovernment,Wholesale & RetailTrade
Transportation,Recreation
Reservoir
Pomeroy, WA 1,475Agriculture,State/Local/FederalGovernment
Navigation, Recreation,Implementation
Kennewick, WA 48,010Wholesale & RetailTrade, Services,F.I.R.E.
Navigation, Recreation,Irrigation,Implementation, Power
Pasco, WA 22,370 Agriculture,Transportation
Navigation, Recreation,Irrigation,Implementation, Power
Downriver
Umatilla, OR 3,155Agriculture,State/Local/FederalGovernment
Recreation, Navigation,Irrigation
Lewiston, Idaho 30,271Manufacturing,Wholesale & RetailTrade
Navigation,Implementation, A-Fish, Power,Recreation
Orofino, ID 3,122Timber, Agriculture,State/Local/FederalGovernment
A-FishUpriver
Riggins, ID 495
Travel & Tourism,Agriculture,State/Local/FederalGovernment
Recreation, A-Fish
A-Fish: Anadromous FishF.I.R.E.: Finance, Insurance, and Real Estate
Predecisional DocumentationFor Information Purposes Only - Not For Comment
Predecisional DocumentationFor Information Purposes Only - Not For Comment
1.4.2 Selection of Social Indicators
Social indicators were identified with the intent of providing basic facts about the focuscommunities and providing a baseline from which to assess and predict potential socialimpacts resulting from the proposed alternatives. Social indicators are secondarysources of information, collected over time that provide an integrated picture of thesocial and economic dimensions of the focus communities.
Social indicators are addressed at both the county and community level. It should benoted that because of recent changes in census methodology not all indicators areavailable for all communities across time. This is particularly the case with smallercommunities. If 1995 or 1996 data were not available at the community level, 1990community Census data were used rather than more recent county level data becausecounty level data may not reflect community level facts. These limitations are noted, asappropriate, in the baseline profiles developed for each community.
The study team selected social indicators by reviewing the literature on social indicatorsin natural resource management (US Department of Commerce, 1994; Burch andDeLuca, 1984; Machlis and Wright, 1984; Rossi and Gilmartin, 1980; and Burge, 1994)and considering the issues raised in the System Operation Review (SOR) EIS and thepotential impacts identified during the scoping process and public information meetingsrelated to this present study. The selected indicators were organized into four thematicareas: People, the Economy, Place, and Vision and Vitality. The People(Demographics) dimension relates to the characteristics of individuals or households inthe community and changes. The Economic (Jobs and Wealth) dimension relates to themajor businesses and sources of jobs in the community. The Place (Character)dimension refers to the built and natural environment of the community. The Vision andVitality (Organization and Leadership capacity) dimension refers to the characteristics ofthe community’s social organizations and ability to get things done.
1.4.3 Development of Baseline Profiles of Focus Communities
The following baseline profiles briefly describe each community’s geographic location inrelation to the lower Snake River, and identify historic and current conditions based onthe selected social indicators. These profiles, based on secondary data, are reinforcedand enriched with the self-assessment information gathered through the communityforum process.
Predecisional DocumentationFor Information Purposes Only - Not For Comment
Predecisional DocumentationFor Information Purposes Only - Not For Comment
1.4.4 Identification of Potential Economic, Physical, and Biological Impacts
A thorough review of the reports developed by the various Corps and National MarineFisheries Service (NMFS) workgroups provided the information critical in determiningthe projected impacts on the human environment. Reports reviewed include thefollowing: Anadromous Fish Economics, Anadromous Fish Biology, Water Supply,Recreation, Air Quality, Water Quality, Transportation, Power, Implementation,Mitigation, Regional Economics, and Flood Control. Wherever possible, study teamleaders were consulted to further allocate and identify the geographic distribution ofimpacts at the local level. It is important to note that the identified potential changes arenot limited to economics but also the effects of physical and biological changes uponthe human environment.
1.4.5 Evaluating the Significance of Potential Impacts
The significance of potential impacts was evaluated in four different ways. First, theemployment and income impacts at the subregion level from the input-output (I-O)model were allocated and estimated for each of the focus communities based on thecriteria outlined in Section 4. These impacts were evaluated based on the relativechanges they represent for each study community and are reported as negative orpositive. Attention was paid to how special populations (poor, minority, and elderly)would be affected. Second, other non-economic changes that might result from theprojected economic, physical, and biological impacts were identified and allocated toeach of the focus communities. Determination of the significance of impact was limitedto negative, positive, or unable to determine. Third, by consulting the literature on howrural communities are affected by social and economic changes and their possibleresponses to these changes, we present a comparative evaluative method forunderstanding the scope and dimensions of potential social impacts. Finally, the issuesraised during the course of public involvement and through the community interactiveforums provide a community perspective on the significance of potential impacts andpossible community responses.
A summary of the impacts across alternatives was prepared describing who will beaffected, how they will be affected, and when they will be affected.
Predecisional DocumentationFor Information Purposes Only - Not For Comment
Predecisional DocumentationFor Information Purposes Only - Not For Comment
1.4.6 Determination of Mitigation Measure
Mitigation measures for potential jobs losses identified through the I-O model wereexamined, as well as potential measures for non-direct job losses and community socialimpacts. A review was conducted of recent Federal natural resource policy decisionsand mitigation, as well as other employment mitigation programs, to estimate thecontent and budgetary scope of these programs. Additionally, community members whoattended the community interactive forums listed potential mitigation measures for theircommunity.
2. Characterization of Study Region and Communities
2.1 Regional Overview/Trends
The social resources of communities located in the vicinity of the lower Snake River willbe affected by the proposed action. These effects would be felt primarily withincommunities in the immediate vicinity of the lower Snake River. Effects would also befelt in nearby upland areas that draw water supplies from the river and more distantcommodity production areas that rely on the river for transportation. The proposedaction also has the potential to generate indirect economic effects throughout theregion. Potential sources of indirect regional economic effects include changes inrecreational activities, commercial fisheries, navigation, and power. The followingsections discuss regional trends in population, income and employment, poverty, age,race, industry specialization, and land tenure. For ease of presentation, trends arediscussed at the subregional level (see Table 1). Reference is made to individualcounties, as appropriate.
2.1.1 Population
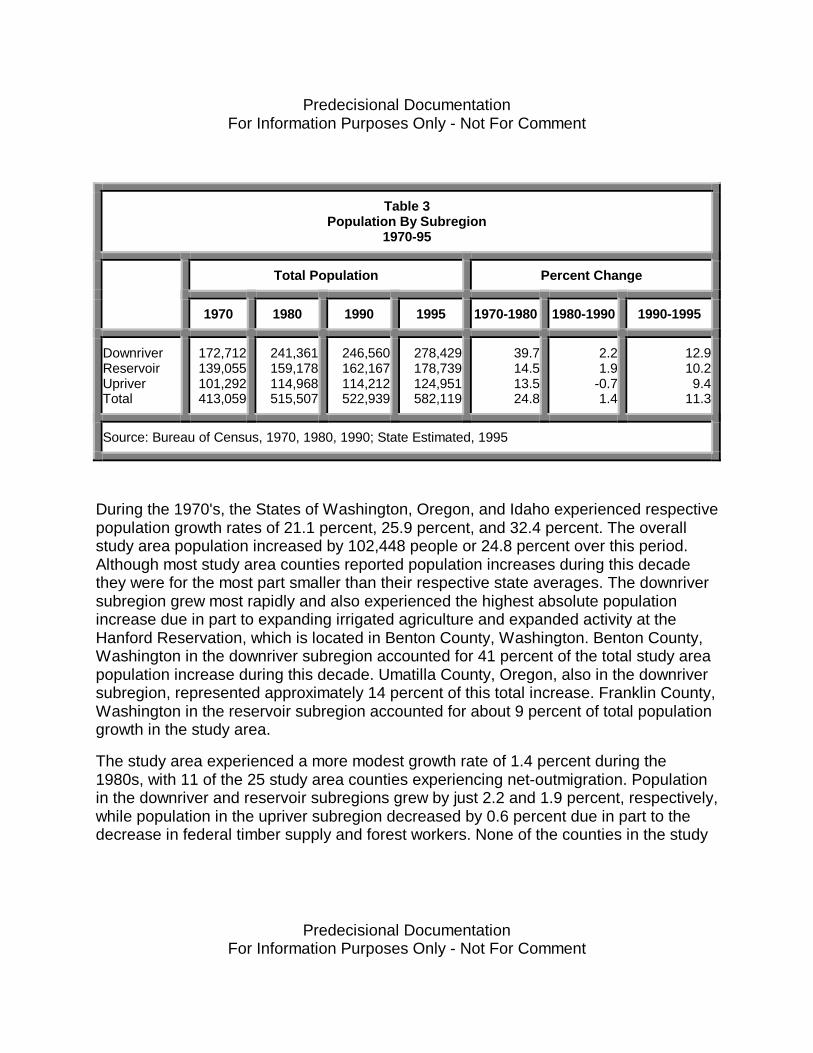
The majority of the area surrounding the lower Snake River is sparsely populated. Thetotal population of the study area was approximately 582,124 in 1995 (Table 3).Population is distributed unevenly among the 25 counties and three subregions thatcomprise the study area. The downriver subregion, which extends from the confluenceof the Snake and Columbia rivers to below Bonneville Dam, is the most populated,accounting for 278,429 or approximately 48 percent of the study region’s 1995population (Table 3). More populated counties in the region include Benton (133,070)and Walla Walla (52,982) counties in Washington, and Umatilla County, Oregon(64,040). These counties accounted for 22.9 percent, 9.1 percent, and 11.0 percent ofthe 1995 study area population, respectively.
Predecisional DocumentationFor Information Purposes Only - Not For Comment
Predecisional DocumentationFor Information Purposes Only - Not For Comment
Table 3Population By Subregion
1970-95
Total Population Percent Change
1970 1980 1990 1995 1970-1980 1980-1990 1990-1995
DownriverReservoirUpriverTotal
172,712139,055101,292413,059
241,361159,178114,968515,507
246,560162,167114,212522,939
278,429178,739124,951582,119
39.714.513.524.8
2.21.9
-0.71.4
12.910.29.4
11.3
Source: Bureau of Census, 1970, 1980, 1990; State Estimated, 1995
During the 1970's, the States of Washington, Oregon, and Idaho experienced respectivepopulation growth rates of 21.1 percent, 25.9 percent, and 32.4 percent. The overallstudy area population increased by 102,448 people or 24.8 percent over this period.Although most study area counties reported population increases during this decadethey were for the most part smaller than their respective state averages. The downriversubregion grew most rapidly and also experienced the highest absolute populationincrease due in part to expanding irrigated agriculture and expanded activity at theHanford Reservation, which is located in Benton County, Washington. Benton County,Washington in the downriver subregion accounted for 41 percent of the total study areapopulation increase during this decade. Umatilla County, Oregon, also in the downriversubregion, represented approximately 14 percent of this total increase. Franklin County,Washington in the reservoir subregion accounted for about 9 percent of total populationgrowth in the study area.
The study area experienced a more modest growth rate of 1.4 percent during the1980s, with 11 of the 25 study area counties experiencing net-outmigration. Populationin the downriver and reservoir subregions grew by just 2.2 and 1.9 percent, respectively,while population in the upriver subregion decreased by 0.6 percent due in part to thedecrease in federal timber supply and forest workers. None of the counties in the study

Predecisional DocumentationFor Information Purposes Only - Not For Comment
Predecisional DocumentationFor Information Purposes Only - Not For Comment
area had growth rates that exceeded their respective state averages, which were 17.8percent, 8 percent, and 6.7 percent for the states of Washington, Oregon, and Idaho,respectively. The modest population increase for the study area as a whole also reflectsthe relatively small growth rates in the more populated study area counties. Thepopulation of Benton County, which increased by 62 percent over the precedingdecade, increased by just 2.8 percent between 1980 and 1990.
All but one of the study area counties reported population growth between 1990 and1995. Benton County accounted for approximately 35 percent of the net study areaincrease of 59,165 or 11.3 percent. Population growth rates in the subregions rangedfrom 9.4 percent in the upriver subregion to 12.9 percent in the downriver subregion.Population in the reservoir subregion increased by 10.2 percent over this period. Thestates of Washington, Oregon, and Idaho experienced corresponding respective growthrates of 11.6 percent, 10.5 percent, and 15.5 percent. The reservoir counties of Adams,Asotin, and Franklin all experienced population increases greater than 10 percent overthis period. Valley County, Idaho in the upriver subregion experienced the mostsignificant growth rate in the study area with a population increase of 28.9 percent.Lemhi and Lewis counties, Idaho, in the upriver subregion also grew by more than 10percent over this period.
2.1.2 Income and Employment
Per Capita Income
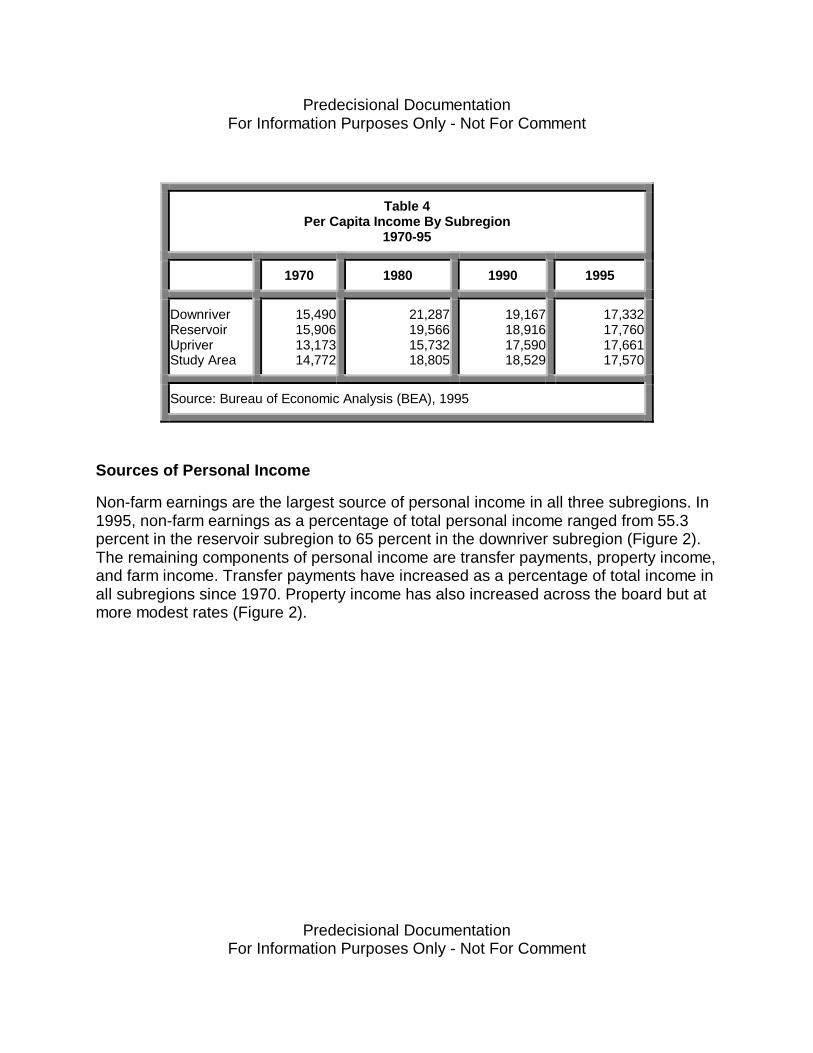
Average per capita income in the 25 county study area was $17,570 in 1995, with littlevariation across the three subregions (Table 4). The states of Washington, Oregon, andIdaho had respective per capita incomes of $23,974, $21,915, and $19,199 in 1995.U.S. per capita income in 1995 was $23,359. Viewed in 1995 dollars, per capita incomeincreased in the study area and all three subregions during the 1970s and ranged in1980 from $15,732 in the upriver subregion to $21,287 in the downriver region. Since1980, however, this figure has declined in both the downriver and reservoir subregions,while the upriver subregion has experienced modest increases (Table 4). In 1995 percapita income in the 25 study area counties ranged from $14,576 in Morrow County,Oregon in the downriver subregion to $22,058 in Benton County, Washington also in thedownriver subregion.
Predecisional DocumentationFor Information Purposes Only - Not For Comment
Predecisional DocumentationFor Information Purposes Only - Not For Comment
Table 4Per Capita Income By Subregion
1970-95
1970 1980 1990 1995
DownriverReservoirUpriverStudy Area
15,49015,90613,17314,772
21,28719,56615,73218,805
19,16718,91617,59018,529
17,33217,76017,66117,570
Source: Bureau of Economic Analysis (BEA), 1995
Sources of Personal Income
Non-farm earnings are the largest source of personal income in all three subregions. In1995, non-farm earnings as a percentage of total personal income ranged from 55.3percent in the reservoir subregion to 65 percent in the downriver subregion (Figure 2).The remaining components of personal income are transfer payments, property income,and farm income. Transfer payments have increased as a percentage of total income inall subregions since 1970. Property income has also increased across the board but atmore modest rates (Figure 2).
Predecisional DocumentationFor Information Purposes Only - Not For Comment
Predecisional DocumentationFor Information Purposes Only - Not For Comment
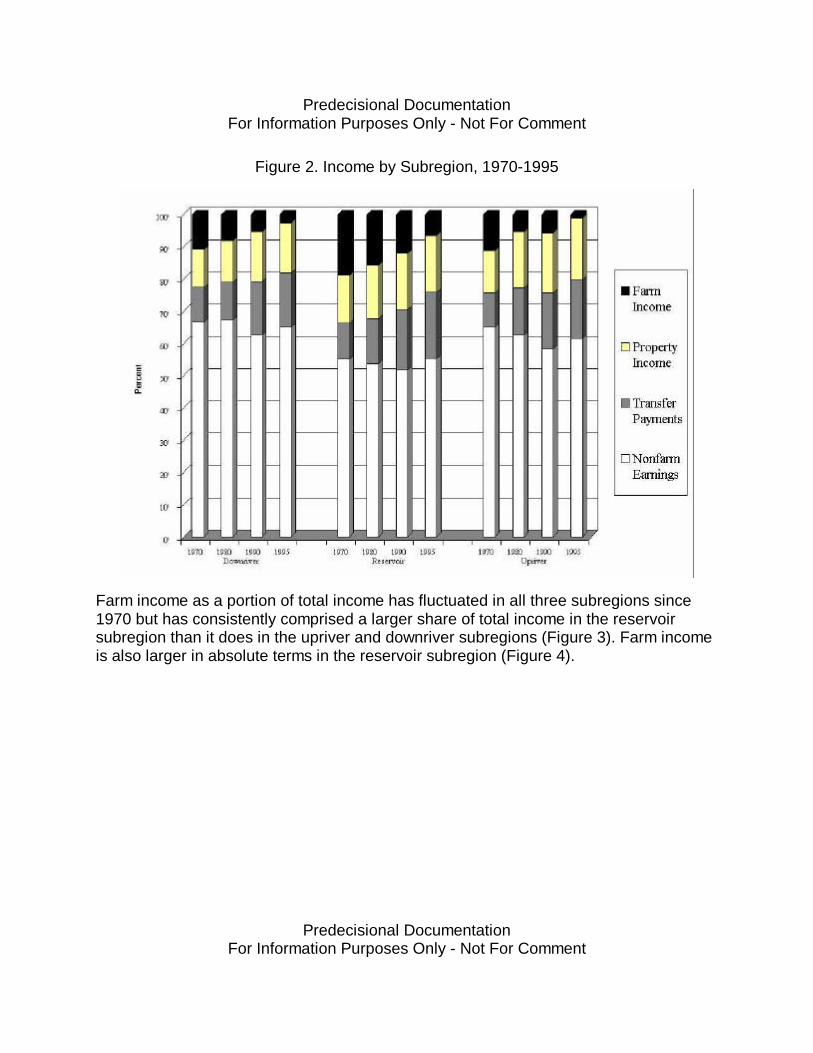
Figure 2. Income by Subregion, 1970-1995
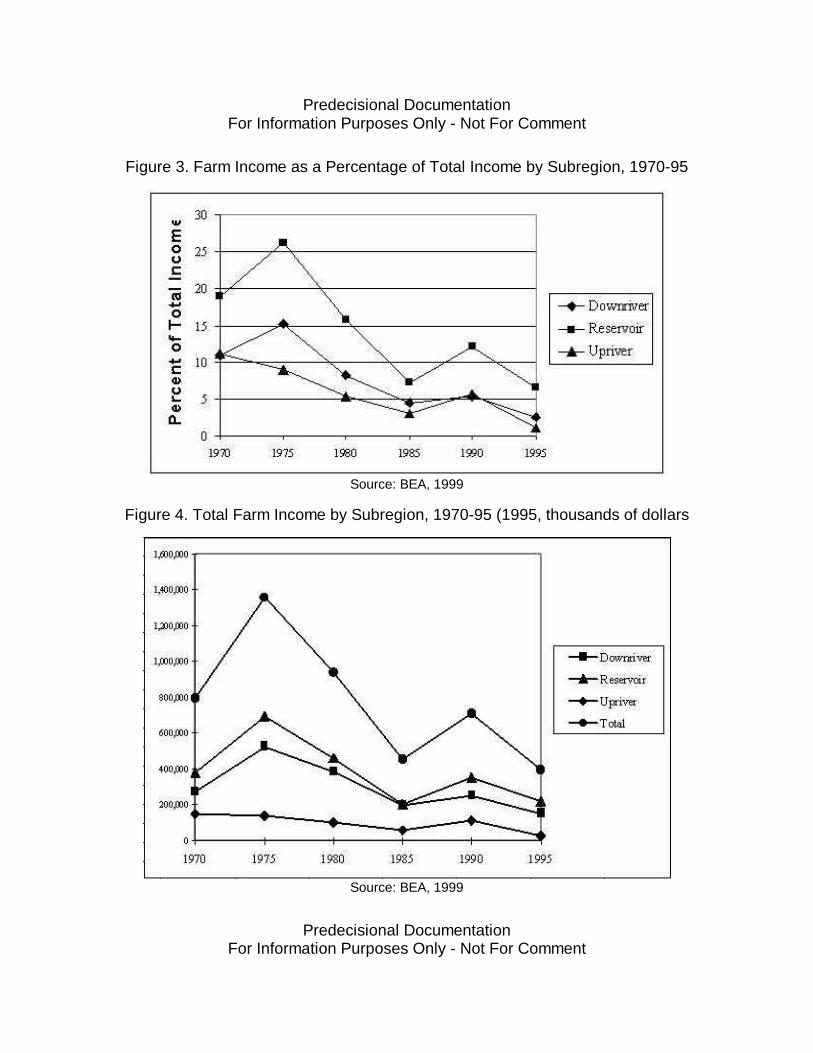
Farm income as a portion of total income has fluctuated in all three subregions since1970 but has consistently comprised a larger share of total income in the reservoirsubregion than it does in the upriver and downriver subregions (Figure 3). Farm incomeis also larger in absolute terms in the reservoir subregion (Figure 4).
Predecisional DocumentationFor Information Purposes Only - Not For Comment
Predecisional DocumentationFor Information Purposes Only - Not For Comment
Figure 3. Farm Income as a Percentage of Total Income by Subregion, 1970-95
Source: BEA, 1999
Figure 4. Total Farm Income by Subregion, 1970-95 (1995, thousands of dollars
Source: BEA, 1999
Predecisional DocumentationFor Information Purposes Only - Not For Comment
Predecisional DocumentationFor Information Purposes Only - Not For Comment
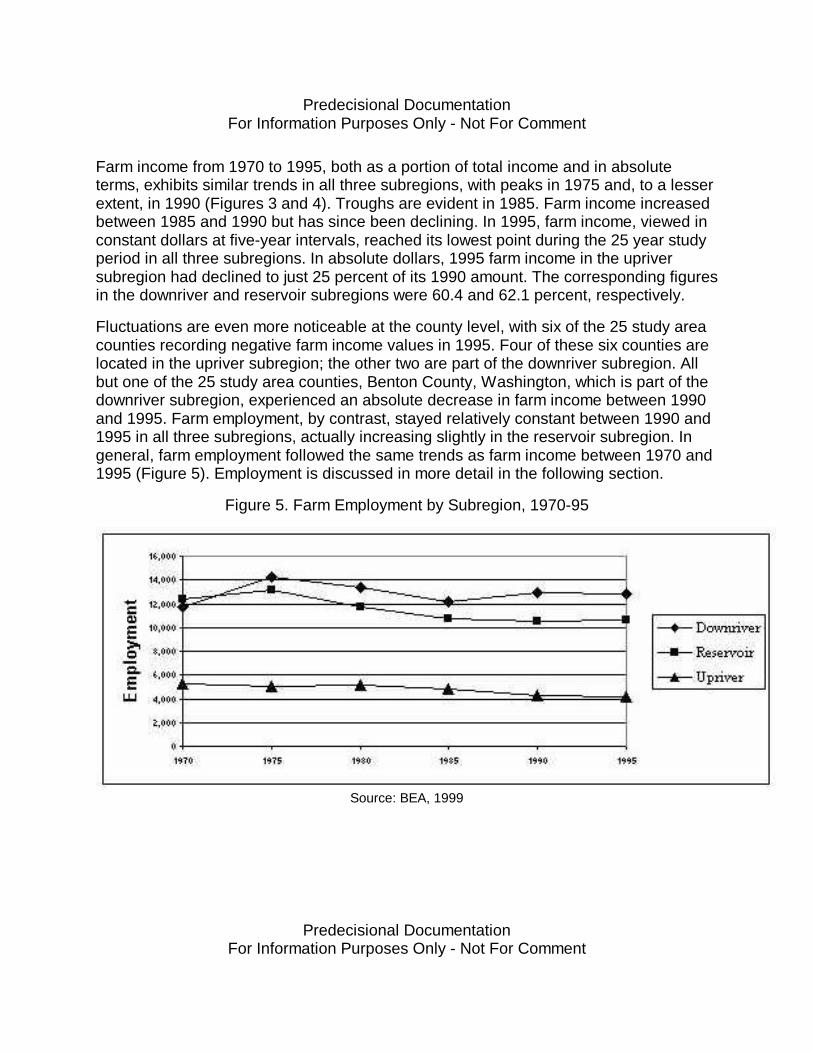
Farm income from 1970 to 1995, both as a portion of total income and in absoluteterms, exhibits similar trends in all three subregions, with peaks in 1975 and, to a lesserextent, in 1990 (Figures 3 and 4). Troughs are evident in 1985. Farm income increasedbetween 1985 and 1990 but has since been declining. In 1995, farm income, viewed inconstant dollars at five-year intervals, reached its lowest point during the 25 year studyperiod in all three subregions. In absolute dollars, 1995 farm income in the upriversubregion had declined to just 25 percent of its 1990 amount. The corresponding figuresin the downriver and reservoir subregions were 60.4 and 62.1 percent, respectively.
Fluctuations are even more noticeable at the county level, with six of the 25 study areacounties recording negative farm income values in 1995. Four of these six counties arelocated in the upriver subregion; the other two are part of the downriver subregion. Allbut one of the 25 study area counties, Benton County, Washington, which is part of thedownriver subregion, experienced an absolute decrease in farm income between 1990and 1995. Farm employment, by contrast, stayed relatively constant between 1990 and1995 in all three subregions, actually increasing slightly in the reservoir subregion. Ingeneral, farm employment followed the same trends as farm income between 1970 and1995 (Figure 5). Employment is discussed in more detail in the following section.
Figure 5. Farm Employment by Subregion, 1970-95
Source: BEA, 1999
Predecisional DocumentationFor Information Purposes Only - Not For Comment
Predecisional DocumentationFor Information Purposes Only - Not For Comment
Employment
The economy of the Pacific Northwest has undergone substantial change over the pastthree decades. In terms of job formation it has grown much faster than the nation as awhole with total employment in the states of Washington, Oregon, and Idaho increasingby more than 210 percent. Jobs in the 25 county study area increased by about 74percent from 1970 to 1995 (Table 5). The total number of jobs in both the region and thestudy area has increased even as employment in historically important job sectors, suchas manufacturing, logging, mining, and farming and ranching has declined or remainedstagnant. At the aggregate level, employment in the study area increased in nearly allsectors between 1970 and 1995. Exceptions include the farm and military sectors, bothof which experienced an absolute decline in the numbers employed. Employment inservice industries has increased significantly. These increases include gains inrecreation and tourism, business, education, and management and engineeringservices. The study area also experienced large gains in the retail trade and state andlocal government sectors. Growth was also evident in the wholesale trade and thefinance, insurance and real estate sectors (Table 5).

Predecisional DocumentationFor Information Purposes Only - Not For Comment
Predecisional DocumentationFor Information Purposes Only - Not For Comment
Table 5Employment in the 25 Study Counties
1970-95
1970 1995 Change1970-95
Employed Percent Employed PercentChange
inEmployment
PercentChange
Total full- and part-time employment 183,686 318,740 135,054 73.5
Farm employmentNon-farm employment
29,417154,269
16.084.0
27,625291,115
8.791.3
-1,792136,846
-6.0988.7
Ag. Serv., forestry, fishing, other 1,894 1.2 7,721 2.7 5,827 308.0
Mining 430 0.3 738 0.3 308 71.6
Construction 8,238 5.4 14,715 5.1 6,477 78.6
Manufacturing 24,343 15.9 30,955 10.8 6,612 27.2
Transportation and public utilities 7,745 5.0 11,726 4.1 3,981 51.4
Wholesale trade 4,580 3.0 10,540 3.7 5,960 130.0
Retail trade 26,732 17.4 53,079 18.6 26,347 98.6
Finance, insurance, and real estate 8,184 5.3 13,290 4.6 5,106 62.4
Services 32,948 21.5 83,390 29.2 50,442 153.0
Government and government enterprises 38,376 25.0 59,740 20.9 21,364 55.7
Federal, civilianMilitary
State and local
6,4443,570
28,362
4.22.0
18.5
7,1332,581
50,003
2.51.0
17.5
689-989
21,641
10.7-27.776.3
Source: BEA, 1999

Predecisional DocumentationFor Information Purposes Only - Not For Comment
Predecisional DocumentationFor Information Purposes Only - Not For Comment
These patterns appear to be broadly similar across all three subregions, with absoluteincreases in all sectors with the exception of the farm and military sectors in thereservoir and upriver subregions and the mining sector in the downriver subregion.Employment in the farm sector declined by 14.1 and 20.9 percent in the reservoir andupriver subregions, respectively. The downriver subregion, by contrast, experienced a 9percent increase in farm employment. A simple comparison between the two years,1970 and 1995, may, however, mask substantial fluctuations in the intervening period.This is evident, for example, in the farm employment trends presented by subregion inFigure 5.
Total full-time and part-time employment increased most rapidly in the downriversubregion over the study period, with a 99 percent increase in the number employedcompared to 47.5 and 66.4 percent increases in the reservoir and upriver subregions,respectively. The downriver subregion labor force was already larger than that in thereservoir and upriver subregions in 1970. As a result, growth trends viewed at the studyarea level largely reflect those in the downriver subregion. The downriver subregionexperienced larger relative and absolute employment gains than the other twosubregions in almost all sectors. This was particularly noticeable in the services, retailtrade, and state and local government sectors.
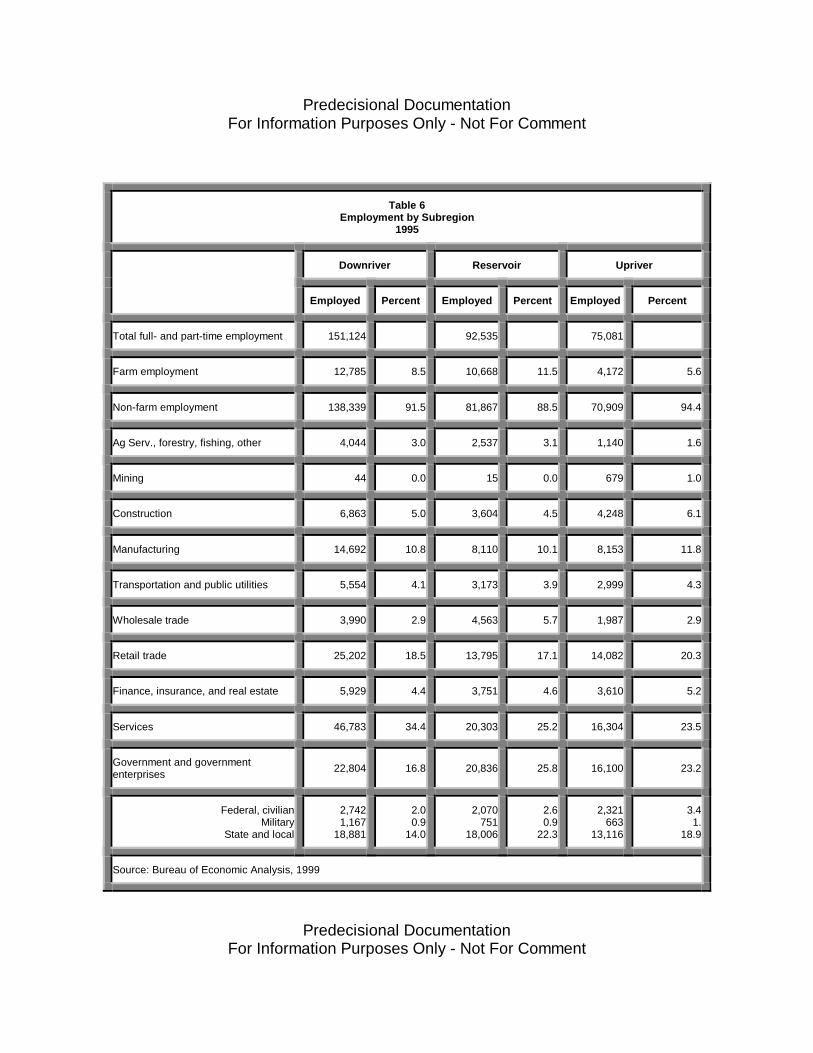
The 1995 employment profiles of the three subregions are fairly similar (Table 6). Thedownriver subregion, however, has a much larger portion of total employmentconcentration in the services sector, 34.4 percent compared to 25.2 and 23.5 percent inthe reservoir and downriver subregions, respectively. The reservoir and upriversubregions, in turn, have larger concentrations of employment in the government andgovernment enterprises section.
Predecisional DocumentationFor Information Purposes Only - Not For Comment
Predecisional DocumentationFor Information Purposes Only - Not For Comment
Table 6Employment by Subregion
1995
Downriver Reservoir Upriver
Employed Percent Employed Percent Employed Percent
Total full- and part-time employment 151,124 92,535 75,081
Farm employment 12,785 8.5 10,668 11.5 4,172 5.6
Non-farm employment 138,339 91.5 81,867 88.5 70,909 94.4
Ag Serv., forestry, fishing, other 4,044 3.0 2,537 3.1 1,140 1.6
Mining 44 0.0 15 0.0 679 1.0
Construction 6,863 5.0 3,604 4.5 4,248 6.1
Manufacturing 14,692 10.8 8,110 10.1 8,153 11.8
Transportation and public utilities 5,554 4.1 3,173 3.9 2,999 4.3
Wholesale trade 3,990 2.9 4,563 5.7 1,987 2.9
Retail trade 25,202 18.5 13,795 17.1 14,082 20.3
Finance, insurance, and real estate 5,929 4.4 3,751 4.6 3,610 5.2
Services 46,783 34.4 20,303 25.2 16,304 23.5
Government and governmententerprises 22,804 16.8 20,836 25.8 16,100 23.2
Federal, civilianMilitary
State and local
2,7421,167
18,881
2.00.9
14.0
2,070751
18,006
2.60.9
22.3
2,321663
13,116
3.41.
18.9
Source: Bureau of Economic Analysis, 1999
Predecisional DocumentationFor Information Purposes Only - Not For Comment
Predecisional DocumentationFor Information Purposes Only - Not For Comment
2.1.3 Poverty
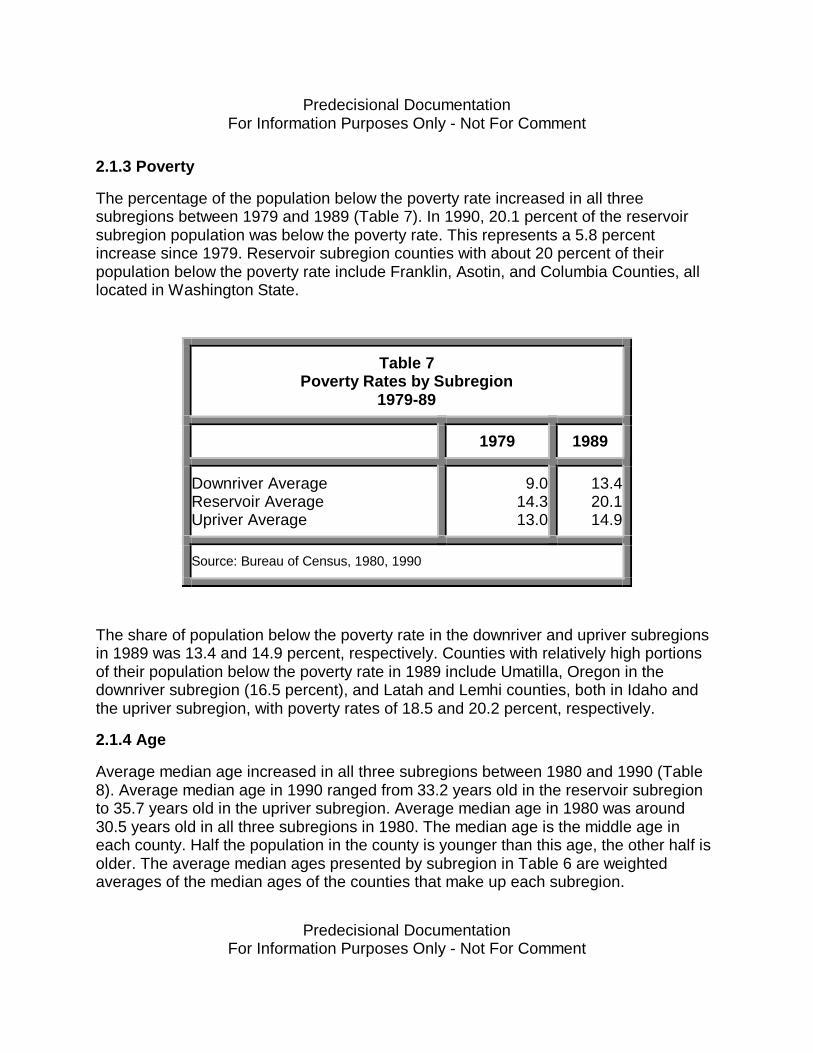
The percentage of the population below the poverty rate increased in all threesubregions between 1979 and 1989 (Table 7). In 1990, 20.1 percent of the reservoirsubregion population was below the poverty rate. This represents a 5.8 percentincrease since 1979. Reservoir subregion counties with about 20 percent of theirpopulation below the poverty rate include Franklin, Asotin, and Columbia Counties, alllocated in Washington State.
Table 7Poverty Rates by Subregion
1979-89
1979 1989
Downriver AverageReservoir AverageUpriver Average
9.014.313.0
13.420.114.9
Source: Bureau of Census, 1980, 1990
The share of population below the poverty rate in the downriver and upriver subregionsin 1989 was 13.4 and 14.9 percent, respectively. Counties with relatively high portionsof their population below the poverty rate in 1989 include Umatilla, Oregon in thedownriver subregion (16.5 percent), and Latah and Lemhi counties, both in Idaho andthe upriver subregion, with poverty rates of 18.5 and 20.2 percent, respectively.
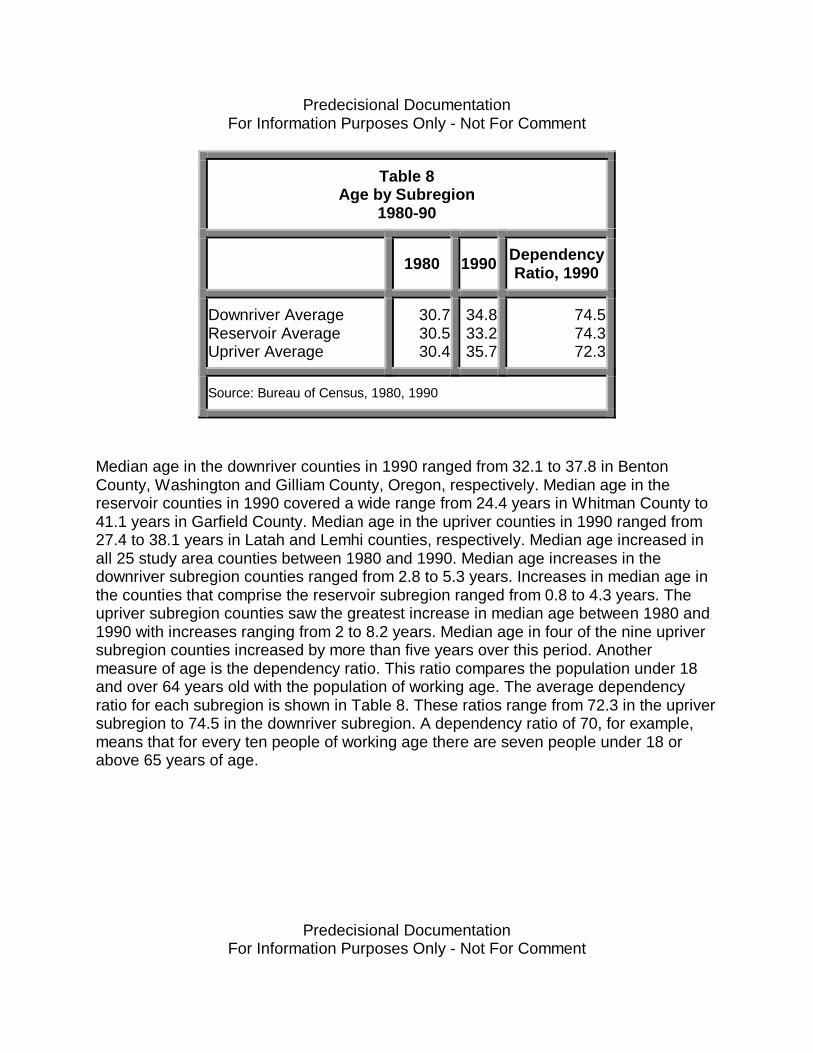
2.1.4 Age
Average median age increased in all three subregions between 1980 and 1990 (Table8). Average median age in 1990 ranged from 33.2 years old in the reservoir subregionto 35.7 years old in the upriver subregion. Average median age in 1980 was around30.5 years old in all three subregions in 1980. The median age is the middle age ineach county. Half the population in the county is younger than this age, the other half isolder. The average median ages presented by subregion in Table 6 are weightedaverages of the median ages of the counties that make up each subregion.
Predecisional DocumentationFor Information Purposes Only - Not For Comment
Predecisional DocumentationFor Information Purposes Only - Not For Comment
Table 8Age by Subregion
1980-90
1980 1990 DependencyRatio, 1990
Downriver AverageReservoir AverageUpriver Average
30.730.530.4
34.833.235.7
74.574.372.3
Source: Bureau of Census, 1980, 1990
Median age in the downriver counties in 1990 ranged from 32.1 to 37.8 in BentonCounty, Washington and Gilliam County, Oregon, respectively. Median age in thereservoir counties in 1990 covered a wide range from 24.4 years in Whitman County to41.1 years in Garfield County. Median age in the upriver counties in 1990 ranged from27.4 to 38.1 years in Latah and Lemhi counties, respectively. Median age increased inall 25 study area counties between 1980 and 1990. Median age increases in thedownriver subregion counties ranged from 2.8 to 5.3 years. Increases in median age inthe counties that comprise the reservoir subregion ranged from 0.8 to 4.3 years. Theupriver subregion counties saw the greatest increase in median age between 1980 and1990 with increases ranging from 2 to 8.2 years. Median age in four of the nine upriversubregion counties increased by more than five years over this period. Anothermeasure of age is the dependency ratio. This ratio compares the population under 18and over 64 years old with the population of working age. The average dependencyratio for each subregion is shown in Table 8. These ratios range from 72.3 in the upriversubregion to 74.5 in the downriver subregion. A dependency ratio of 70, for example,means that for every ten people of working age there are seven people under 18 orabove 65 years of age.
Predecisional DocumentationFor Information Purposes Only - Not For Comment
Predecisional DocumentationFor Information Purposes Only - Not For Comment
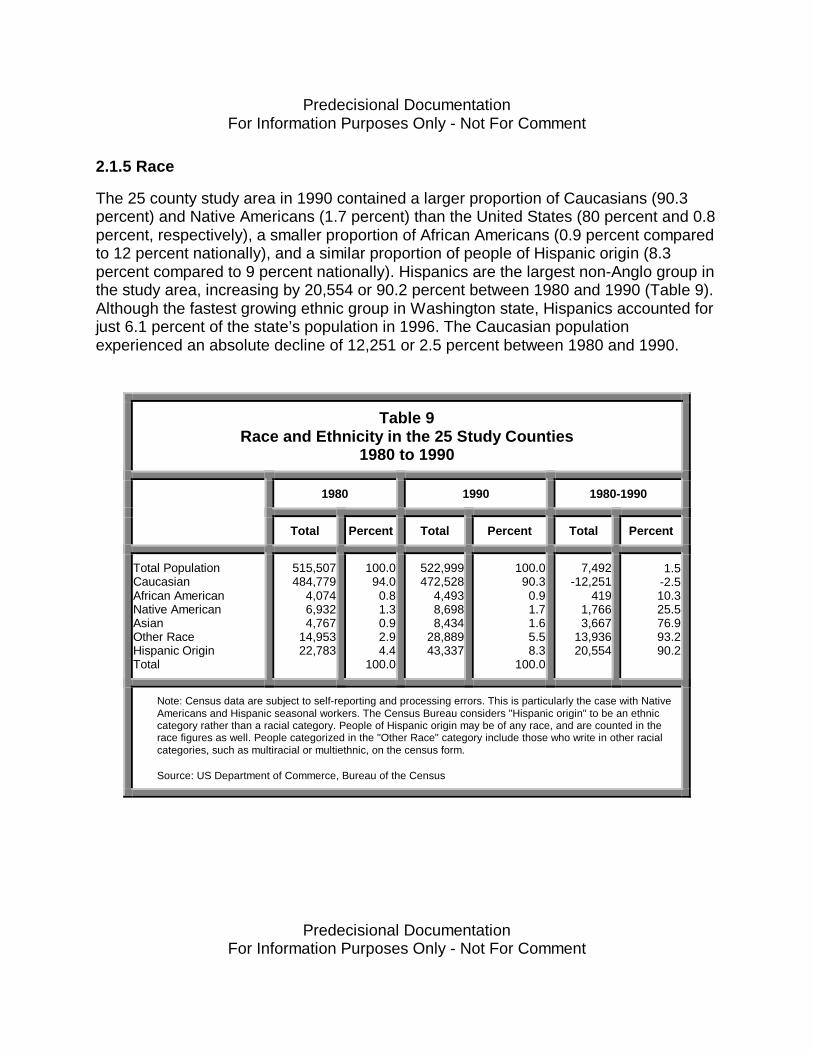
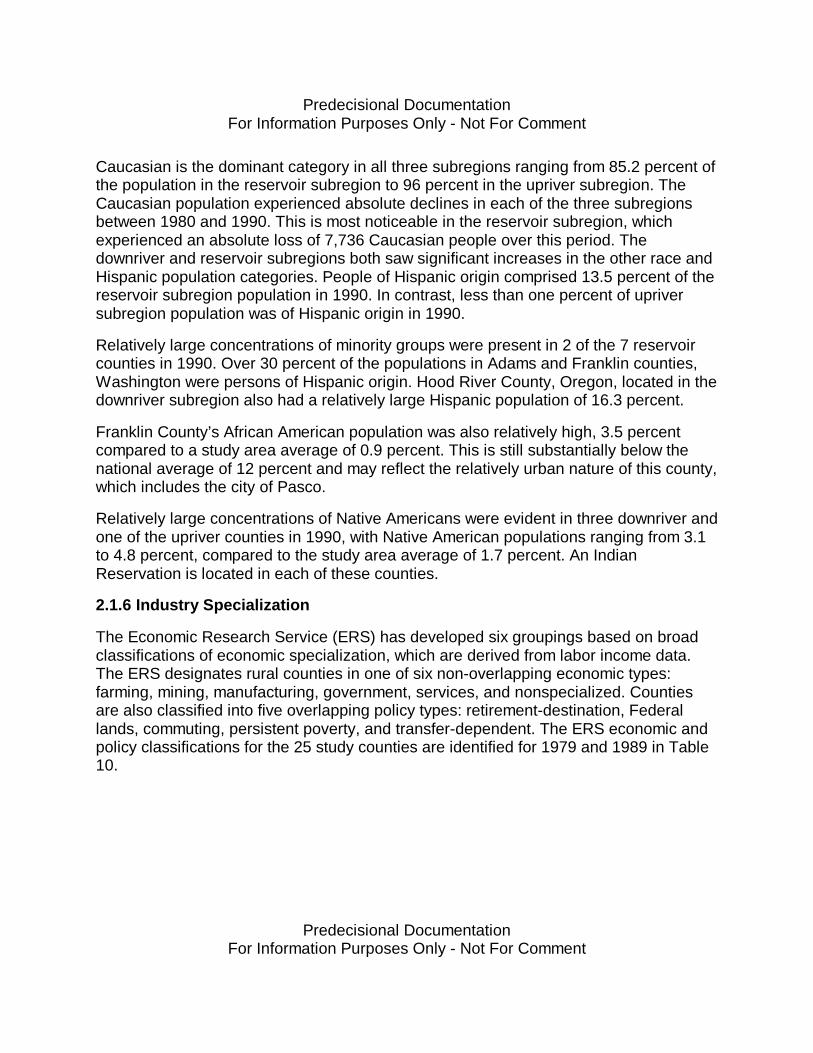
2.1.5 Race
The 25 county study area in 1990 contained a larger proportion of Caucasians (90.3percent) and Native Americans (1.7 percent) than the United States (80 percent and 0.8percent, respectively), a smaller proportion of African Americans (0.9 percent comparedto 12 percent nationally), and a similar proportion of people of Hispanic origin (8.3percent compared to 9 percent nationally). Hispanics are the largest non-Anglo group inthe study area, increasing by 20,554 or 90.2 percent between 1980 and 1990 (Table 9).Although the fastest growing ethnic group in Washington state, Hispanics accounted forjust 6.1 percent of the state’s population in 1996. The Caucasian populationexperienced an absolute decline of 12,251 or 2.5 percent between 1980 and 1990.
Table 9Race and Ethnicity in the 25 Study Counties
1980 to 1990
1980 1990 1980-1990
Total Percent Total Percent Total Percent
Total PopulationCaucasianAfrican AmericanNative AmericanAsianOther RaceHispanic OriginTotal
515,507484,779
4,0746,9324,767
14,95322,783
100.094.00.81.30.92.94.4
100.0
522,999472,528
4,4938,6988,434
28,88943,337
100.090.30.91.71.65.58.3
100.0
7,492-12,251
4191,7663,667
13,93620,554
1.5-2.510.325.576.993.290.2
Note: Census data are subject to self-reporting and processing errors. This is particularly the case with NativeAmericans and Hispanic seasonal workers. The Census Bureau considers "Hispanic origin" to be an ethniccategory rather than a racial category. People of Hispanic origin may be of any race, and are counted in therace figures as well. People categorized in the "Other Race" category include those who write in other racialcategories, such as multiracial or multiethnic, on the census form.
Source: US Department of Commerce, Bureau of the Census
Predecisional DocumentationFor Information Purposes Only - Not For Comment
Predecisional DocumentationFor Information Purposes Only - Not For Comment
Caucasian is the dominant category in all three subregions ranging from 85.2 percent ofthe population in the reservoir subregion to 96 percent in the upriver subregion. TheCaucasian population experienced absolute declines in each of the three subregionsbetween 1980 and 1990. This is most noticeable in the reservoir subregion, whichexperienced an absolute loss of 7,736 Caucasian people over this period. Thedownriver and reservoir subregions both saw significant increases in the other race andHispanic population categories. People of Hispanic origin comprised 13.5 percent of thereservoir subregion population in 1990. In contrast, less than one percent of upriversubregion population was of Hispanic origin in 1990.
Relatively large concentrations of minority groups were present in 2 of the 7 reservoircounties in 1990. Over 30 percent of the populations in Adams and Franklin counties,Washington were persons of Hispanic origin. Hood River County, Oregon, located in thedownriver subregion also had a relatively large Hispanic population of 16.3 percent.
Franklin County’s African American population was also relatively high, 3.5 percentcompared to a study area average of 0.9 percent. This is still substantially below thenational average of 12 percent and may reflect the relatively urban nature of this county,which includes the city of Pasco.
Relatively large concentrations of Native Americans were evident in three downriver andone of the upriver counties in 1990, with Native American populations ranging from 3.1to 4.8 percent, compared to the study area average of 1.7 percent. An IndianReservation is located in each of these counties.
2.1.6 Industry Specialization
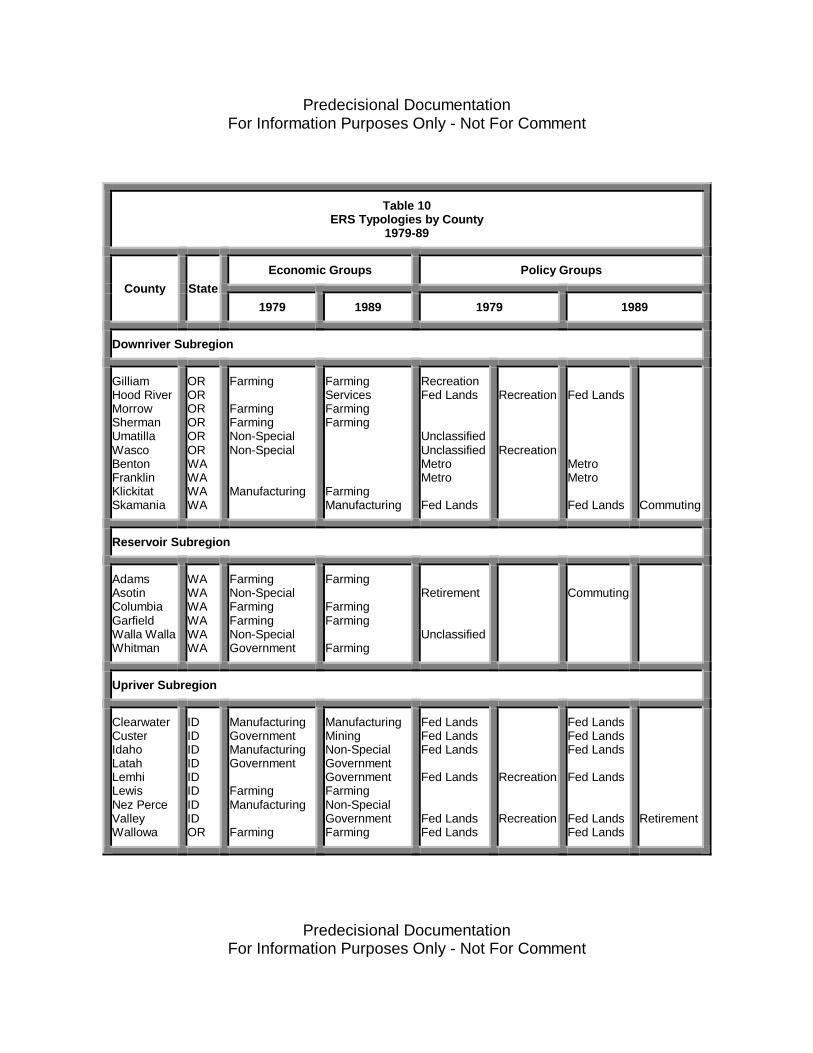
The Economic Research Service (ERS) has developed six groupings based on broadclassifications of economic specialization, which are derived from labor income data.The ERS designates rural counties in one of six non-overlapping economic types:farming, mining, manufacturing, government, services, and nonspecialized. Countiesare also classified into five overlapping policy types: retirement-destination, Federallands, commuting, persistent poverty, and transfer-dependent. The ERS economic andpolicy classifications for the 25 study counties are identified for 1979 and 1989 in Table10.
Predecisional DocumentationFor Information Purposes Only - Not For Comment
Predecisional DocumentationFor Information Purposes Only - Not For Comment
Table 10ERS Typologies by County
1979-89
Economic Groups Policy GroupsCounty State
1979 1989 1979 1989
Downriver Subregion
GilliamHood RiverMorrowShermanUmatillaWascoBentonFranklinKlickitatSkamania
ORORORORORORWAWAWAWA
Farming
FarmingFarmingNon-SpecialNon-Special
Manufacturing
FarmingServicesFarmingFarming
FarmingManufacturing
RecreationFed Lands
UnclassifiedUnclassifiedMetroMetro
Fed Lands
Recreation
Recreation
Fed Lands
MetroMetro
Fed Lands Commuting
Reservoir Subregion
AdamsAsotinColumbiaGarfieldWalla WallaWhitman
WAWAWAWAWAWA
FarmingNon-SpecialFarmingFarmingNon-SpecialGovernment
Farming
FarmingFarming
Farming
Retirement
Unclassified
Commuting
Upriver Subregion
ClearwaterCusterIdahoLatahLemhiLewisNez PerceValleyWallowa
IDIDIDIDIDIDIDIDOR
ManufacturingGovernmentManufacturingGovernment
FarmingManufacturing
Farming
ManufacturingMiningNon-SpecialGovernmentGovernmentFarmingNon-SpecialGovernmentFarming
Fed LandsFed LandsFed Lands
Fed Lands
Fed LandsFed Lands
Recreation
Recreation
Fed LandsFed LandsFed Lands
Fed Lands
Fed LandsFed Lands
Retirement
Predecisional DocumentationFor Information Purposes Only - Not For Comment
Predecisional DocumentationFor Information Purposes Only - Not For Comment
The ERS classifications remain fairly constant in most counties from 1979 to 1989.Some change in classification was evident in the economic group classifications,particularly in the upriver subregion. Idaho and Nez Perce counties, Idaho were bothreclassified from manufacturing to non-specialized, while Custer County, Idahoshifted from government to mining. Klickitat County, Washington in the downriversubregion also changed economic classification, switching from manufacturing tofarming.
2.1.7 Land Tenure Characteristics
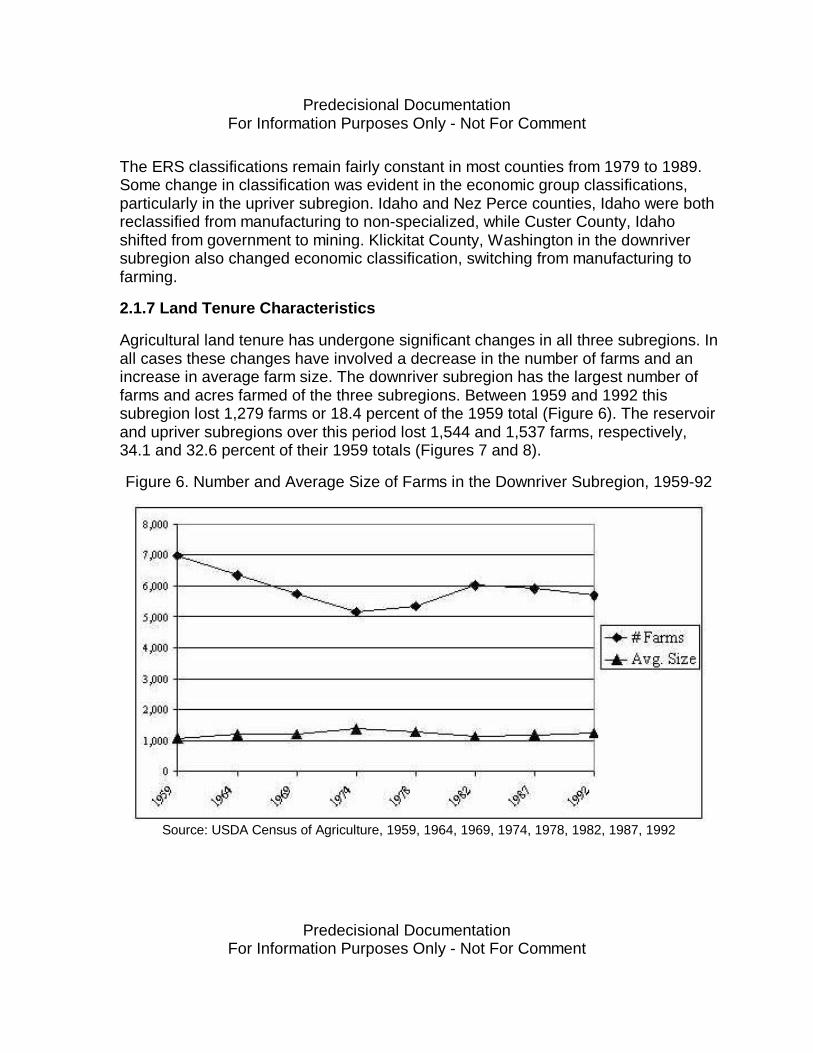
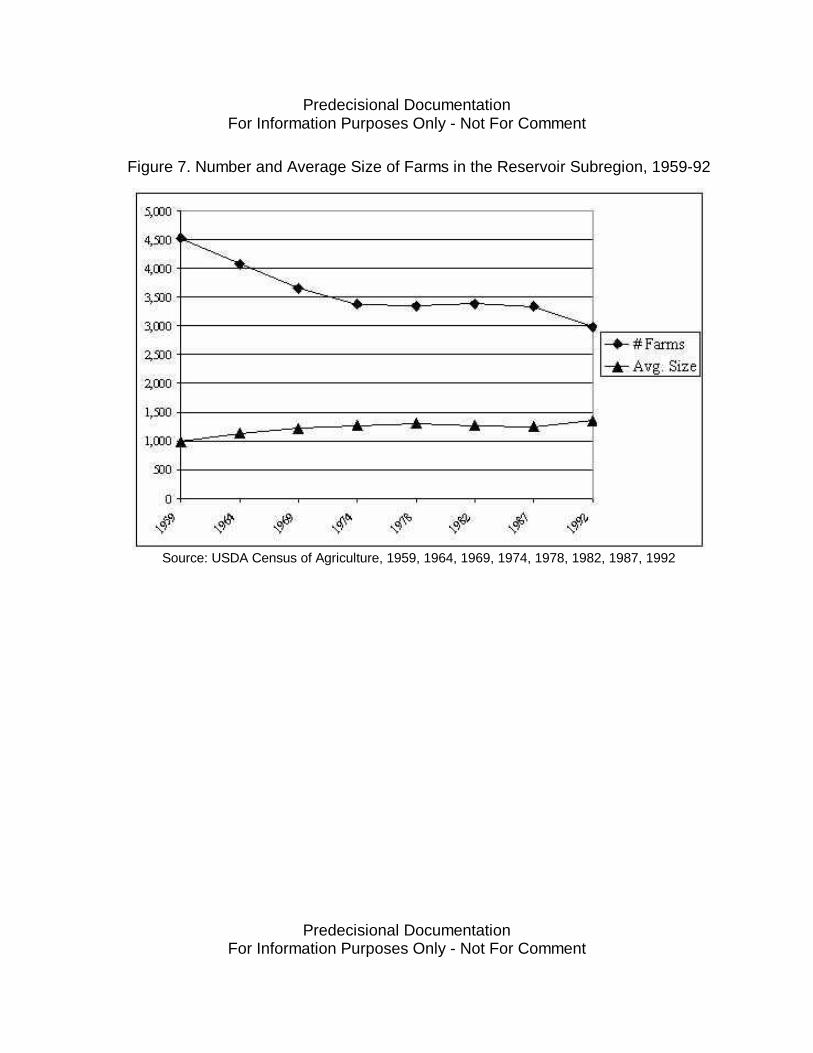
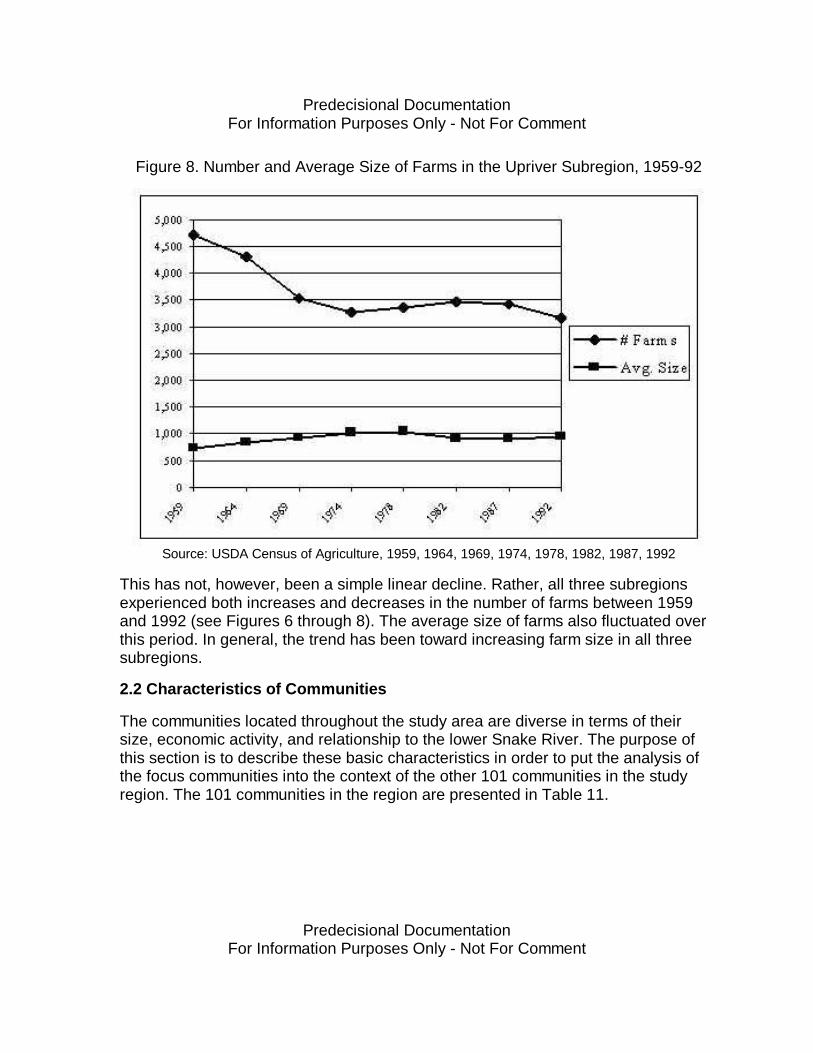
Agricultural land tenure has undergone significant changes in all three subregions. Inall cases these changes have involved a decrease in the number of farms and anincrease in average farm size. The downriver subregion has the largest number offarms and acres farmed of the three subregions. Between 1959 and 1992 thissubregion lost 1,279 farms or 18.4 percent of the 1959 total (Figure 6). The reservoirand upriver subregions over this period lost 1,544 and 1,537 farms, respectively,34.1 and 32.6 percent of their 1959 totals (Figures 7 and 8).
Figure 6. Number and Average Size of Farms in the Downriver Subregion, 1959-92
Source: USDA Census of Agriculture, 1959, 1964, 1969, 1974, 1978, 1982, 1987, 1992
Predecisional DocumentationFor Information Purposes Only - Not For Comment
Predecisional DocumentationFor Information Purposes Only - Not For Comment
Figure 7. Number and Average Size of Farms in the Reservoir Subregion, 1959-92
Source: USDA Census of Agriculture, 1959, 1964, 1969, 1974, 1978, 1982, 1987, 1992
Predecisional DocumentationFor Information Purposes Only - Not For Comment
Predecisional DocumentationFor Information Purposes Only - Not For Comment
Figure 8. Number and Average Size of Farms in the Upriver Subregion, 1959-92
Source: USDA Census of Agriculture, 1959, 1964, 1969, 1974, 1978, 1982, 1987, 1992
This has not, however, been a simple linear decline. Rather, all three subregionsexperienced both increases and decreases in the number of farms between 1959and 1992 (see Figures 6 through 8). The average size of farms also fluctuated overthis period. In general, the trend has been toward increasing farm size in all threesubregions.
2.2 Characteristics of Communities
The communities located throughout the study area are diverse in terms of theirsize, economic activity, and relationship to the lower Snake River. The purpose ofthis section is to describe these basic characteristics in order to put the analysis ofthe focus communities into the context of the other 101 communities in the studyregion. The 101 communities in the region are presented in Table 11.

Predecisional DocumentationFor Information Purposes Only - Not For Comment
Predecisional DocumentationFor Information Purposes Only - Not For Comment
Table 11Communities Located In the Lower Snake River Subregions
Reservoir Subregion Downriver Subregion Upriver Subregion
Community State County Community State County Community State County
OthelloLindRitzvilleWashtucnaAsotinClarkstonStarbuckDaytonPomeroyCollege PlaceBurbankPrescottWaitsburgWalla WallaColfaxSt. JohnTekoaGarfieldEndicottPalouseColtonUniontownOakesdaleFarmingtonLa CrosseAlbionMaldenPullmanRosalia
WAWAWAWAWAWAWAWAWAWAWAWAWAWAWAWAWAWAWAWAWAWAWAWAWAWAWAWAWA
AdamsAdamsAdamsAdamsAsotinAsotinColumbiaColumbiaGarfieldWalla WallaWalla WallaWalla WallaWalla WallaWalla WallaWhitmanWhitmanWhitmanWhitmanWhitmanWhitmanWhitmanWhitmanWhitmanWhitmanWhitmanWhitmanWhitmanWhitmanWhitman
Benton CityRichlandProsserKennewickFinleyHighlandWest RichlandKahlotusMesaPascoConnellWest PascoArlingtonCondonHood RiverBingenWhite SalmonGoldendaleKlickitatIrrigonBoardmanIoneLexingtonHeppnerMoroGrass ValleyRufusWascoAdamsWestonStanfieldUkiahPilot RockAthenaHelixEchoHermistonMton-FreewaterUmatillaPendletonMission
WAWAWAWAWAWAWAWAWAWAWAWAORORORWAWAWAWAOROROROROROROROROROROROROROROROROROROROROROR
BentonBentonBentonBentonBentonBentonBentonFranklinFranklinFranklinFranklinFranklinGilliamGilliamHood RiverKlickitatKlickitatKlickitatKlickitatMorrowMorrowMorrowMorrowMorrowShermanShermanShermanShermanUmatillaUmatillaUmatillaUmatillaUmatillaUmatillaUmatillaUmatillaUmatillaUmatillaUmatillaUmatillaUmatilla
WeippeElk RiverPierceOrofinoMackayChallisElk CityKooskiaCottonwoodRigginsGrangevilleBolvilGeneseeTroyJuliaettaDearyPotlatchOnawayKendrickMoscowSalmonNez PerceCraigmontKamiahLapwaiLewistonCuldesacJosephLostineWallowaEnterprise
IDIDIDIDIDIDIDIDIDIDIDIDIDIDIDIDIDIDIDIDIDIDIDIDIDIDIDOROROROR
ClearwaterClearwaterClearwaterClearwaterCusterCusterIdahoIdahoIdahoIdahoIdahoLatahLatahLatahLatahLatahLatahLatahLatahLatahLemhiLewisLewisLewisNez PerceNez PerceNez PerceWallowaWallowaWallowaWallowa
Note: Focus Communities are noted in italics.
Predecisional DocumentationFor Information Purposes Only - Not For Comment
Predecisional DocumentationFor Information Purposes Only - Not For Comment
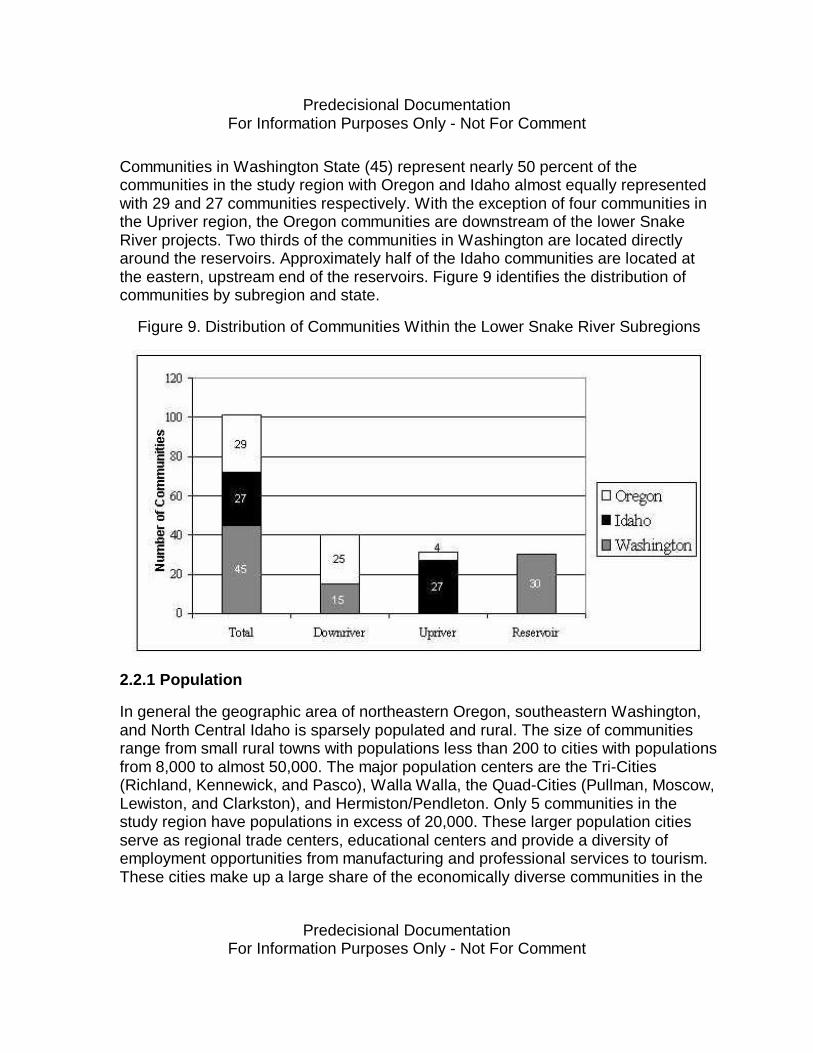
Communities in Washington State (45) represent nearly 50 percent of thecommunities in the study region with Oregon and Idaho almost equally representedwith 29 and 27 communities respectively. With the exception of four communities inthe Upriver region, the Oregon communities are downstream of the lower SnakeRiver projects. Two thirds of the communities in Washington are located directlyaround the reservoirs. Approximately half of the Idaho communities are located atthe eastern, upstream end of the reservoirs. Figure 9 identifies the distribution ofcommunities by subregion and state.
Figure 9. Distribution of Communities Within the Lower Snake River Subregions
2.2.1 Population
In general the geographic area of northeastern Oregon, southeastern Washington,and North Central Idaho is sparsely populated and rural. The size of communitiesrange from small rural towns with populations less than 200 to cities with populationsfrom 8,000 to almost 50,000. The major population centers are the Tri-Cities(Richland, Kennewick, and Pasco), Walla Walla, the Quad-Cities (Pullman, Moscow,Lewiston, and Clarkston), and Hermiston/Pendleton. Only 5 communities in thestudy region have populations in excess of 20,000. These larger population citiesserve as regional trade centers, educational centers and provide a diversity ofemployment opportunities from manufacturing and professional services to tourism.These cities make up a large share of the economically diverse communities in the
Predecisional DocumentationFor Information Purposes Only - Not For Comment
Predecisional DocumentationFor Information Purposes Only - Not For Comment
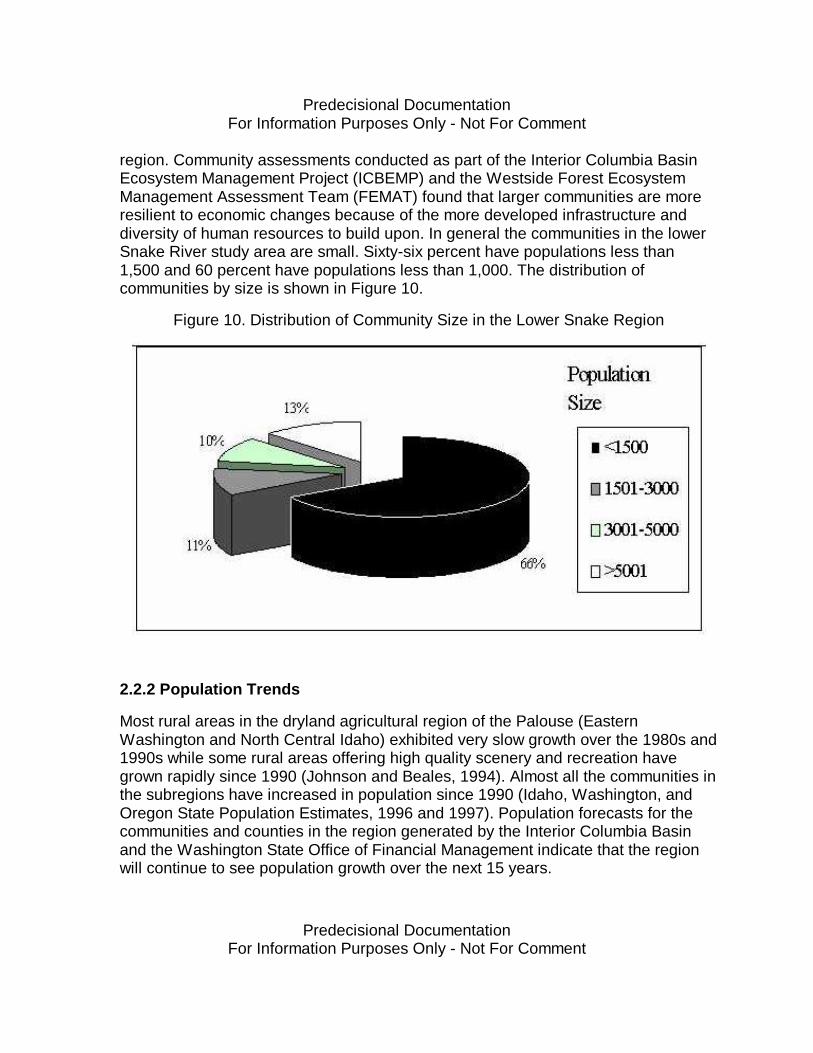
region. Community assessments conducted as part of the Interior Columbia BasinEcosystem Management Project (ICBEMP) and the Westside Forest EcosystemManagement Assessment Team (FEMAT) found that larger communities are moreresilient to economic changes because of the more developed infrastructure anddiversity of human resources to build upon. In general the communities in the lowerSnake River study area are small. Sixty-six percent have populations less than1,500 and 60 percent have populations less than 1,000. The distribution ofcommunities by size is shown in Figure 10.
Figure 10. Distribution of Community Size in the Lower Snake Region
2.2.2 Population Trends
Most rural areas in the dryland agricultural region of the Palouse (EasternWashington and North Central Idaho) exhibited very slow growth over the 1980s and1990s while some rural areas offering high quality scenery and recreation havegrown rapidly since 1990 (Johnson and Beales, 1994). Almost all the communities inthe subregions have increased in population since 1990 (Idaho, Washington, andOregon State Population Estimates, 1996 and 1997). Population forecasts for thecommunities and counties in the region generated by the Interior Columbia Basinand the Washington State Office of Financial Management indicate that the regionwill continue to see population growth over the next 15 years.
Predecisional DocumentationFor Information Purposes Only - Not For Comment
Predecisional DocumentationFor Information Purposes Only - Not For Comment
2.2.3 Economic Characteristics
The majority of towns in the region are small and, therefore, have narrow economicbases with fewer industries and fewer firms per industry than larger communities.The economic diversity index is a good indicator of the level that a given communityrelies upon just a few industries in the private sector or on public sector jobs for localemployment. The ICBEMP developed an index based on the proportion of a town’stotal direct employment attributable to each industrial sector (23 sectors) thatcontributed to that town’s economy in 1995. The index measures the extent to whichcommunities are dependent on these sectors based on the number of sectorspresent and the concentration of total direct employment in any one sector (Harris etal., Forthcoming). Low, Medium Low, Medium High, and High categories representthe quartile distributions across the Interior Columbia Basin.
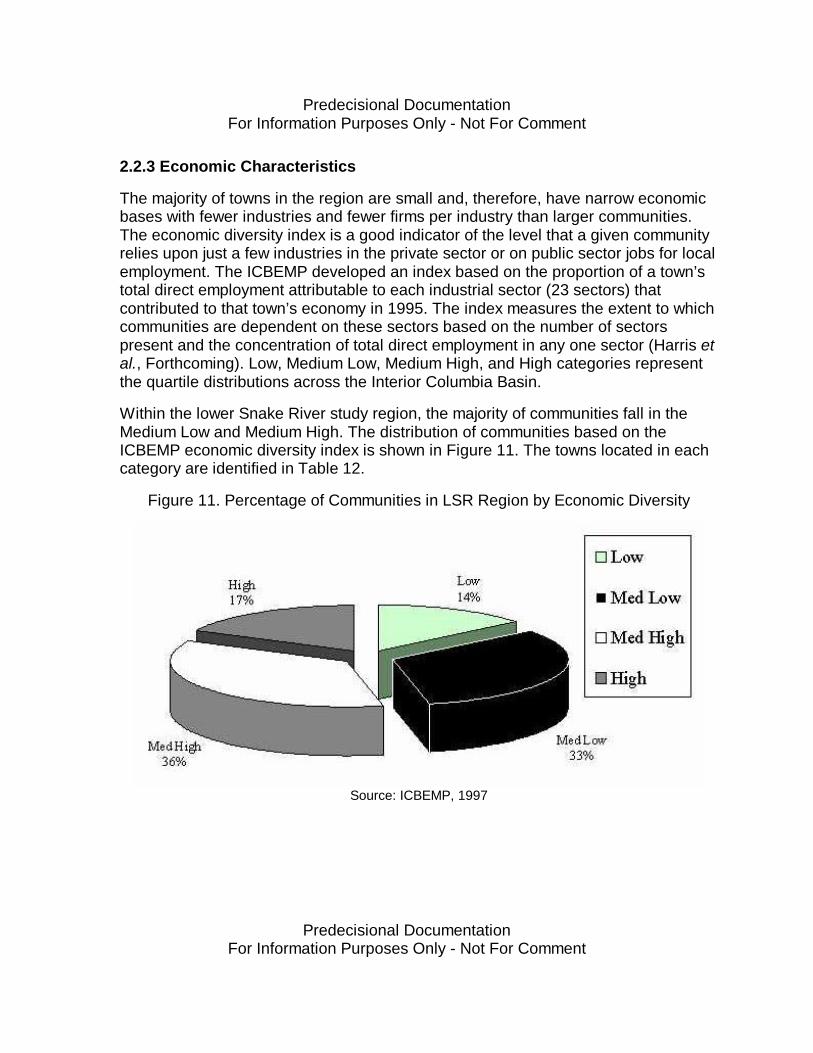
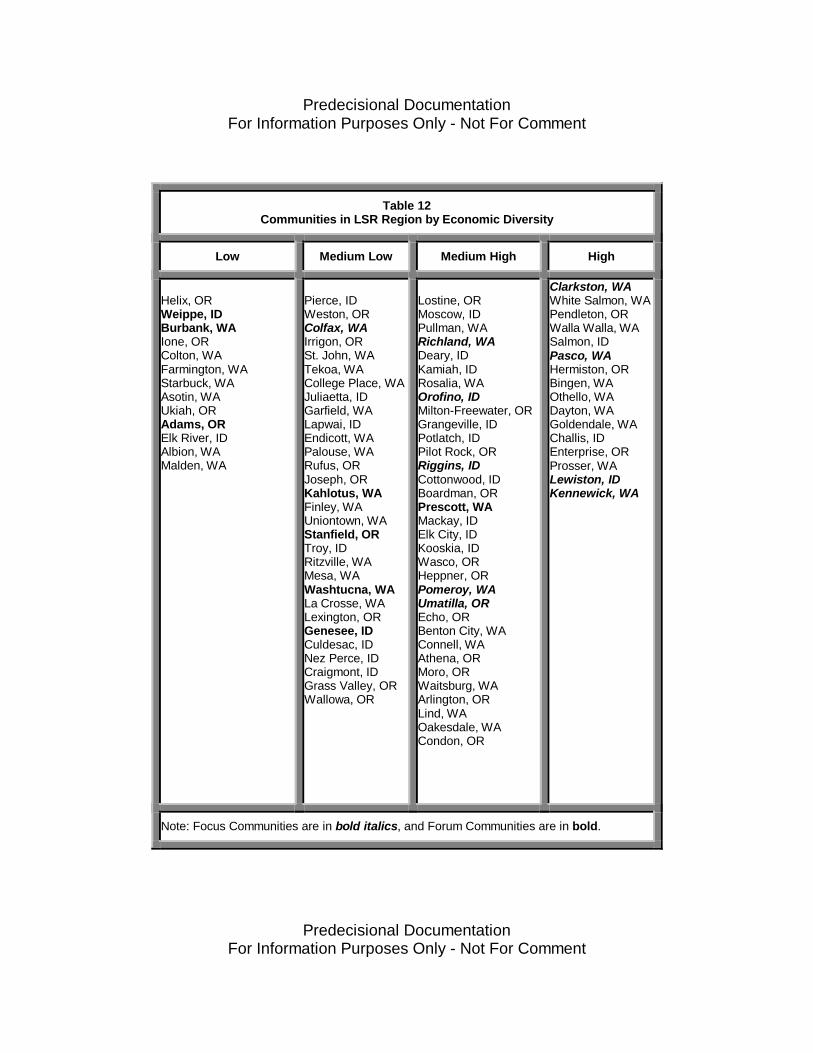
Within the lower Snake River study region, the majority of communities fall in theMedium Low and Medium High. The distribution of communities based on theICBEMP economic diversity index is shown in Figure 11. The towns located in eachcategory are identified in Table 12.
Figure 11. Percentage of Communities in LSR Region by Economic Diversity
Source: ICBEMP, 1997
Predecisional DocumentationFor Information Purposes Only - Not For Comment
Predecisional DocumentationFor Information Purposes Only - Not For Comment
Table 12Communities in LSR Region by Economic Diversity
Low Medium Low Medium High High
Helix, ORWeippe, IDBurbank, WAIone, ORColton, WAFarmington, WAStarbuck, WAAsotin, WAUkiah, ORAdams, ORElk River, IDAlbion, WAMalden, WA
Pierce, IDWeston, ORColfax, WAIrrigon, ORSt. John, WATekoa, WACollege Place, WAJuliaetta, IDGarfield, WALapwai, IDEndicott, WAPalouse, WARufus, ORJoseph, ORKahlotus, WAFinley, WAUniontown, WAStanfield, ORTroy, IDRitzville, WAMesa, WAWashtucna, WALa Crosse, WALexington, ORGenesee, IDCuldesac, IDNez Perce, IDCraigmont, IDGrass Valley, ORWallowa, OR
Lostine, ORMoscow, IDPullman, WARichland, WADeary, IDKamiah, IDRosalia, WAOrofino, IDMilton-Freewater, ORGrangeville, IDPotlatch, IDPilot Rock, ORRiggins, IDCottonwood, IDBoardman, ORPrescott, WAMackay, IDElk City, IDKooskia, IDWasco, ORHeppner, ORPomeroy, WAUmatilla, OREcho, ORBenton City, WAConnell, WAAthena, ORMoro, ORWaitsburg, WAArlington, ORLind, WAOakesdale, WACondon, OR
Clarkston, WAWhite Salmon, WAPendleton, ORWalla Walla, WASalmon, IDPasco, WAHermiston, ORBingen, WAOthello, WADayton, WAGoldendale, WAChallis, IDEnterprise, ORProsser, WALewiston, IDKennewick, WA
Note: Focus Communities are in bold italics, and Forum Communities are in bold.
Predecisional DocumentationFor Information Purposes Only - Not For Comment
Predecisional DocumentationFor Information Purposes Only - Not For Comment
Economic diversity is also considered to be an important component of communityresiliency. Community resiliency has been defined as a town’s ability to successfullydeal with multiple social and economic changes in society and is a primary indicatorof a community’s health and vitality (ICBEMP, 1997). One important component ofthe economic diversity index is the relative indication it provides of the economicopportunities present in a community. In the lower Snake River study region,communities in the lower categories of the economic diversity index are primarilysmall agricultural towns.
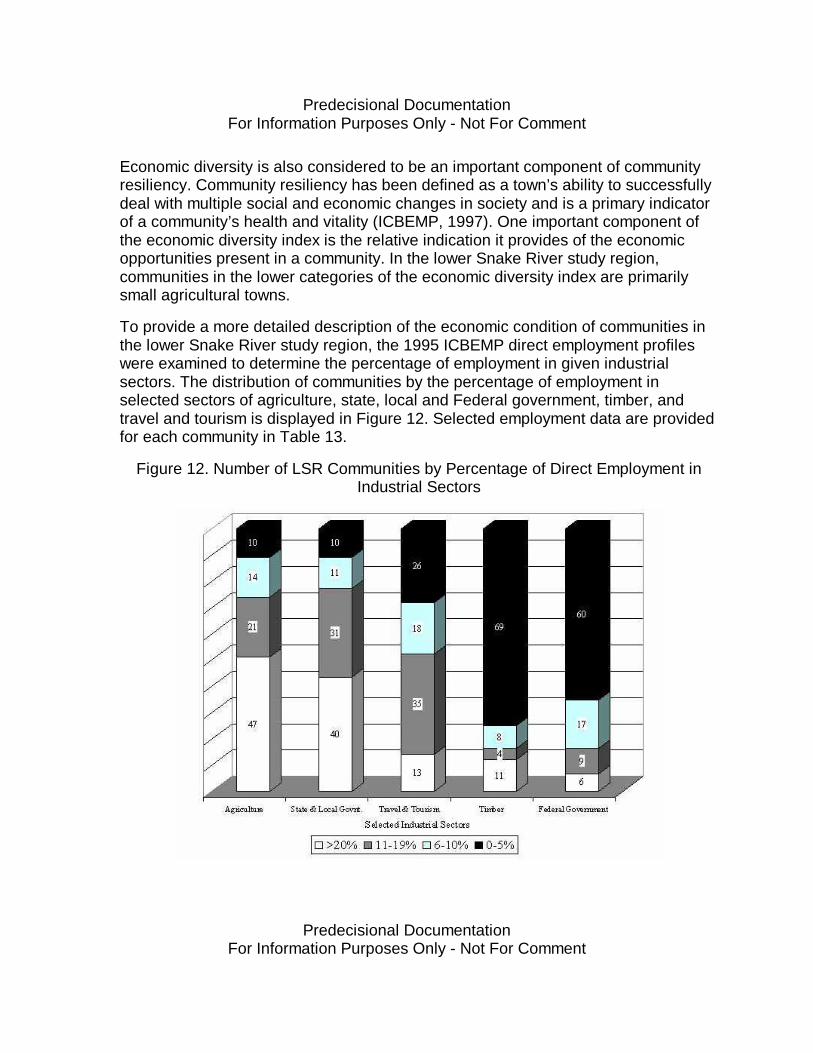
To provide a more detailed description of the economic condition of communities inthe lower Snake River study region, the 1995 ICBEMP direct employment profileswere examined to determine the percentage of employment in given industrialsectors. The distribution of communities by the percentage of employment inselected sectors of agriculture, state, local and Federal government, timber, andtravel and tourism is displayed in Figure 12. Selected employment data are providedfor each community in Table 13.
Figure 12. Number of LSR Communities by Percentage of Direct Employment inIndustrial Sectors

Predecisional DocumentationFor Information Purposes Only - Not For Comment
Predecisional DocumentationFor Information Purposes Only - Not For Comment
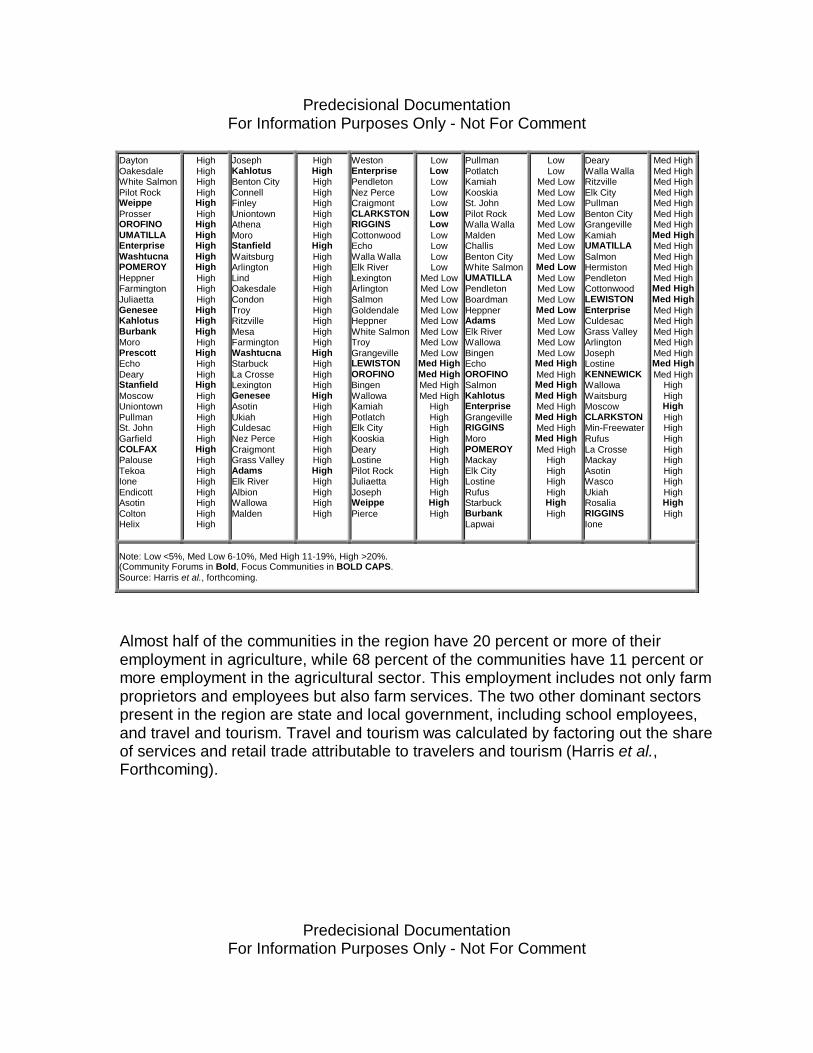
Table 131995 Direct Employment By Sector
Stateand
LocalPercent Agriculture Percent Timber Percent Federal
Employment PercentTravel
andTourism
Percent
FinleyLa CrosseAdamsMaldenLostineAlbionElk RiverLexingtonMackayElk CityWascoUkiahRufusKENNEWICKWaitsburgHermistonPierceNez PerceCraigmontGrass ValleyConnellLEWISTONGrangevilleJosephRIGGINSBoardmanWestonMi-FreewaterSalmonCLARKSTONOthelloKooskiaStarbuckRitzvilleWalla WallaChallisMesaCondonBingenRichlandPASCORosaliaKamiahGoldendaleWallowaPotlatchLapwaiBenton CityAthenaPendletonLindCollege PlaceCottonwoodIrrigonCuldesacTroyArlington
LowLowLowLowLowLowLowLowLowLow
Med LowMed LowMed LowMed LowMed LowMed LowMed LowMed LowMed LowMed LowMed LowMed HighMed HighMed HighMed HighMed HighMed HighMed HighMed HighMed HighMed HighMed HighMed HighMed HighMed HighMed HighMed HighMed HighMed HighMed HighMed HighMed HighMed HighMed HighMed HighMed HighMed HighMed HighMed HighMed HighMed HighMed High
HighHighHighHighHigh
LostineCLARKSTONPierceMoscowLEWISTONPullmanRichlandWestonKENNEWICKWhite SalmonPendletonHelixDearyWalla WallaKamiahIrrigonRosaliaOROFINOM-FreewaterSt. JohnGrangevilleSalmonCOLFAXPotlatchPASCOHermistonWeippeBingenTekoaOthelloPilot RockRIGGINSCollege PlaceDaytonJuliaettaCottonwoodBoardmanGoldendaleChallisBurbankGarfieldEnterpriseLapwaiIoneEndicottPalouseProsserPrescottMackayRufusElk CityKooskiaWascoHeppnerPOMEROYUMATILLAEchoColton
LowLowLowLowLowLowLowLowLowLow
Med LowMed LowMed LowMed LowMed LowMed LowMed LowMed LowMed LowMed LowMed LowMed LowMed LowMed LowMed HighMed HighMed HighMed HighMed HighMed HighMed HighMed HighMed HighMed HighMed HighMed HighMed HighMed HighMed HighMed HighMed HighMed HighMed HighMed HighMed High
HighHighHighHighHighHighHighHighHighHighHighHighHigh
RichlandCOLFAXHelixIrrigonSt. JohnTekoaOthelloCollege PlaceBoardmanBurbankGarfieldLapwaiIoneEndicottPalouseProsserPrescottMackayRufusWascoColtonKahlotusConnellFinleyUniontownAthenaMoroWaitsburgLindOakesdaleCondonRitzvilleMesaFarmingtonWashtucnaStarbuckLa CrosseGeneseeAsotinUkiahCuldesacGrass ValleyAdamsAlbionMaldenPullmanKENNEWICKPascoBenton CityHermistonPOMEROYMoscowRosaliaDaytonChallisUMATILLAStanfieldM-Freewater
LowLowLowLowLowLowLowLowLowLowLowLowLowLowLowLowLowLowLowLowLowLowLowLowLowLowLowLowLowLowLowLowLowLowLowLowLowLowLowLowLowLowLowLowLowLowLowLowLowLowLowLowLowLowLowLowLowLow
HelixWascoColtonFinleyUkiahGrass ValleyLexingtonWashtucnaLindTekoaArlingtonPalouseTroyCollege PlaceJuliaettaIrrigonAlbionHermistonWaitsburgGarfieldAsotinFarmingtonDearyRosaliaKENNEWICKMil-FreewaterEndicottGeneseePrescottNez PerceCraigmontLEWISTONCuldesacOakesdaleUniontownGoldendaleMesaLa CrosseOthelloDaytonProsserCOLFAXCondonIoneConnellPierceWestonClarkstonWeippePASCORitzvilleCottonwoodJosephRichlandMoscowAthenaStanfield
LowLowLowLowLowLowLowLowLowLowLowLowLowLowLowLowLowLowLowLowLowLowLowLowLowLowLowLowLowLowLowLowLowLowLowLowLowLowLowLowLowLowLowLowLowLowLowLowLowLowLowLowLowLowLowLowLowLow
ColtonFinleyLexingtonTroyJuliaettaAlbionGeneseeMaldenKahlotusBurbankUniontownFarmingtonStarbuckLindAdamsWashtucnaPalouseGoldendaleCollege PlaceCondonGarfieldHeppnerPiercePomeroyWestonOthelloPilot RockOakesdaleLapwaiProsserWeippePotlatchPrescottCOLFAXTekoaAthenaChallisIrrigonNez PerceCraigmontEndicottWhite SalmonDaytonSt. JohnConnellBingenOROFINOHelixKooskiaElk RiverStanfieldRichlandBoardmanMoroEchoMesaPASCO
LowLowLowLowLowLowLowLowLowLowLowLowLowLowLowLowLowLowLowLowLowLowLowLowLowLow
Med LowMed LowMed LowMed LowMed LowMed LowMed LowMed LowMed LowMed LowMed LowMed LowMed LowMed LowMed LowMed LowMed LowMed LowMed HighMed HighMed HighMed HighMed HighMed HighMed HighMed HighMed HighMed HighMed HighMed HighMed HighMed High
Predecisional DocumentationFor Information Purposes Only - Not For Comment
Predecisional DocumentationFor Information Purposes Only - Not For Comment
DaytonOakesdaleWhite SalmonPilot RockWeippeProsserOROFINOUMATILLAEnterpriseWashtucnaPOMEROYHeppnerFarmingtonJuliaettaGeneseeKahlotusBurbankMoroPrescottEchoDearyStanfieldMoscowUniontownPullmanSt. JohnGarfieldCOLFAXPalouseTekoaIoneEndicottAsotinColtonHelix
HighHighHighHighHighHighHighHighHighHighHighHighHighHighHighHighHighHighHighHighHighHighHighHighHighHighHighHighHighHighHighHighHighHighHigh
JosephKahlotusBenton CityConnellFinleyUniontownAthenaMoroStanfieldWaitsburgArlingtonLindOakesdaleCondonTroyRitzvilleMesaFarmingtonWashtucnaStarbuckLa CrosseLexingtonGeneseeAsotinUkiahCuldesacNez PerceCraigmontGrass ValleyAdamsElk RiverAlbionWallowaMalden
HighHighHighHighHighHighHighHighHighHighHighHighHighHighHighHighHighHighHighHighHighHighHighHighHighHighHighHighHighHighHighHighHighHigh
WestonEnterprisePendletonNez PerceCraigmontCLARKSTONRIGGINSCottonwoodEchoWalla WallaElk RiverLexingtonArlingtonSalmonGoldendaleHeppnerWhite SalmonTroyGrangevilleLEWISTONOROFINOBingenWallowaKamiahPotlatchElk CityKooskiaDearyLostinePilot RockJuliaettaJosephWeippePierce
LowLowLowLowLowLowLowLowLowLowLow
Med LowMed LowMed LowMed LowMed LowMed LowMed LowMed LowMed HighMed HighMed HighMed High
HighHighHighHighHighHighHighHighHighHighHigh
PullmanPotlatchKamiahKooskiaSt. JohnPilot RockWalla WallaMaldenChallisBenton CityWhite SalmonUMATILLAPendletonBoardmanHeppnerAdamsElk RiverWallowaBingenEchoOROFINOSalmonKahlotusEnterpriseGrangevilleRIGGINSMoroPOMEROYMackayElk CityLostineRufusStarbuckBurbankLapwai
LowLow
Med LowMed LowMed LowMed LowMed LowMed LowMed LowMed LowMed LowMed LowMed LowMed LowMed LowMed LowMed LowMed LowMed LowMed HighMed HighMed HighMed HighMed HighMed HighMed HighMed HighMed High
HighHighHighHighHighHigh
DearyWalla WallaRitzvilleElk CityPullmanBenton CityGrangevilleKamiahUMATILLASalmonHermistonPendletonCottonwoodLEWISTONEnterpriseCuldesacGrass ValleyArlingtonJosephLostineKENNEWICKWallowaWaitsburgMoscowCLARKSTONMin-FreewaterRufusLa CrosseMackayAsotinWascoUkiahRosaliaRIGGINSIone
Med HighMed HighMed HighMed HighMed HighMed HighMed HighMed HighMed HighMed HighMed HighMed HighMed HighMed HighMed HighMed HighMed HighMed HighMed HighMed HighMed High
HighHighHighHighHighHighHighHighHighHighHighHighHigh
Note: Low <5%, Med Low 6-10%, Med High 11-19%, High >20%.(Community Forums in Bold, Focus Communities in BOLD CAPS.Source: Harris et al., forthcoming.
Almost half of the communities in the region have 20 percent or more of theiremployment in agriculture, while 68 percent of the communities have 11 percent ormore employment in the agricultural sector. This employment includes not only farmproprietors and employees but also farm services. The two other dominant sectorspresent in the region are state and local government, including school employees,and travel and tourism. Travel and tourism was calculated by factoring out the shareof services and retail trade attributable to travelers and tourism (Harris et al.,Forthcoming).
Predecisional DocumentationFor Information Purposes Only - Not For Comment
Predecisional DocumentationFor Information Purposes Only - Not For Comment
2.3 Focus Community Baseline Profiles
The following community profiles describe why each community was selected andprovide an overview of historical community trends. They also outline eachcommunity’s social, cultural, and economic relationship to the lower Snake River.Information related to four dimensions of community life--the People, the Economy,the Place, and Vision and Vitality--from 1970 to the present is also presented. ThePeople (Demographics) dimension relates to the characteristics of individuals orhouseholds in the community and changes. The Economic (Jobs and Wealth)dimension relates to the major businesses and sources of jobs in the community.The Place (Character) dimension refers to the built and natural environment of thecommunity. The Vision and Vitality (Organization and Leadership capacity)dimension refers to the characteristics of the community’s social organizations andability to get things done. These dimensions combined with historical informationcompiled for each community provide a snapshot of the focus communities andprovide the basis for evaluating potential impacts. Summary information for eachselected community is presented in Table 2.
2.3.1 Clarkston, Washington
Clarkston is located in Asotin County, across the Snake River from Lewiston at theconfluence of the Snake and Clearwater rivers. It was selected as a focuscommunity because of anadromous fish runs, navigation, construction andrecreation opportunities along the Snake River.
History
In 1899 a bridge across the Snake River connected Lewiston and Jawbone Flats,the area officially incorporated as Clarkston in 1902. Agriculture, particularly berryproduction, dominated the town’s economy in the early 1900s. By the 1950s,agricultural production grew to include grains and hay, peas, and other fruits.Livestock were also raised. Transportation consisted of railroad and boat whichbrought supplies up from Portland and grain down on the return trip. As watertransportation on the Snake improved into Hells Canyon, Clarkston became agateway for tourists exploring Hells Canyon. Lower Granite Dam was completed in1975, flooding much of the fruit orchards and beef processing plants along the river.A second bridge linking Clarkston and Lewiston was constructed in 1982. Today,Clarkston remains active as a regional trading center via its port, while agriculturalproduction, outdoor recreational opportunities, and a growing retiree population addto its diversity.
Predecisional DocumentationFor Information Purposes Only - Not For Comment
Predecisional DocumentationFor Information Purposes Only - Not For Comment
People (Demographics)
The estimated population of Clarkston in 1996 was 6,860. This represents a 1.6percent increase since 1990 after slowly increasing 7 percent between 1970 and1990. From 1980 to 1990 the median age increased from 33 years to 35 years. Over21 percent of the total population was 65 years old and over in 1990. Thedependency ratio, a measure of the age structure of the community (those between18 and 65 divided by those less than 18 and greater than 65 years old), was 90.School district enrollment in 1999 was 3,031, an increase of 207 students since1990. In 1990 Native Americans and Hispanics each made up 2 percent of the totalpopulation.
Economics
Total employment in Clarkston in 1990 was 2,347 down from 2,506 in 1980.Unemployment in 1990 was 6.4 percent. This represents a decrease from the 1980unemployment rate of 8.4 percent. Employment in 1990 was highest in retail tradewith 602 employees. Manufacturing of durable goods contributed 250 employees.The Corps employs 23 individuals in Clarkston in relation to the operation of LowerGranite Dam. Overall economic diversity in Clarkston was calculated as high for1995. Major employers include the Clarkston school district, Tri-State MemorialHospital, Poe Asphalt, and Price-Costco. Much of the employment for Clarkstonresidents is in the service sector in Lewiston and with the Potlatch Corporation.Retiree income is of growing importance in the community as Clarkston becomes aretirement destination.
Clarkston also serves as a regional trade center and is served by barging andtrucking services. There is no rail service in Clarkston. The Ports of Clarkston andWilma move local agricultural products and manufactured goods downriver andbring agricultural inputs and petroleum products upriver. Recreation on thereservoirs and further upriver on the Clearwater and Snake rivers is also animportant economic component including both services (upstream jet boating,fishing, and sternwheeler boat tours) and boat manufacturing.
Median household income in 1990 was $16,641 with per capita income at $8,896.23.6 percent of families for whom poverty status was determined were below thepoverty line in 1990. This represents an increase from 17.3 percent in 1980.Unemployment rates have improved since 1990 and the county is not listed as adistressed county for the state of Washington. Electrical rates for households in1998 were approximately 4.46 cents per Kilowatt-hour.

Predecisional DocumentationFor Information Purposes Only - Not For Comment
Predecisional DocumentationFor Information Purposes Only - Not For Comment
Character (Place)
Clarkston’s location at the confluence of the Snake and Clearwater rivers affordscommunity residents and visitors both slack water and white water recreationopportunities. Clarkston has access to 15 sites on the lower Snake River reservoirswithin 50 miles such as Clarkston Landing, Hells Gate, Chief Timothy, the Greenbelt,and Boyer Park. The community has many local access sites and green areas alongthe river. Fishing is an important social activity in the community with over 19percent of the total population holding steelhead tags during the 1998 fishingseason.
Land tenure can be characterized by the loss of 26 farms in the county and adecrease in the average sized farm by 67 acres between 1969 and 1992. Localservices include fire, police, and a regional hospital.
Vision and Vitality
Clarkston leaders have successfully obtained Federal grant funding for communitydevelopment projects. Clarkston’s 1983 Comprehensive Plan emphasizes growthmanagement strategies to maintain its small city atmosphere while providing for highquality services to its residents. Key elements mentioned in the plan include:
• Joint efforts with the Port of Clarkston and the Army Corps of Engineers toencourage economic development of the Port. These include expandingindustrial development while enhancing tourist facilities for water-relatedrecreation development.
• Improve transportation by improving the existing street system.
• Encourage the development of tourist and recreation opportunities tostimulate economic development opportunities. Examples includestrengthening the business district, attracting tour boats, improving air quality,and providing services as a gateway to Hells Canyon. Community members’perceptions and assessment are pending final University of Idaho report.
2.3.2 Colfax, Washington
Colfax is located in Whitman County in the heart of the Palouse, the dryland wheat,barley, pea, and lentil region of Eastern Washington and North Central Idaho. It isapproximately 19 miles north of the lower Snake River. It was selected as a focuscommunity primarily because of navigation and recreation opportunities and access.
Predecisional DocumentationFor Information Purposes Only - Not For Comment
Predecisional DocumentationFor Information Purposes Only - Not For Comment
History
Incorporated in 1873, Colfax is the oldest town in Eastern Washington. It wasoriginally a sawmill town with cattle ranches and farms but over the years,agriculture became the primary industry. Colfax became the county seat in 1871. Aseries of floods and fires threatened to destroy the community, but the residentsrebuilt. In 1963, the Corps constructed a concrete flood control project to eliminatethe flooding problem in the downtown area. With the arrival of slackwater, the Port ofWhitman County established new sites on the lower Snake River at Almota andWilma. Downtown Colfax has recently completed a downtown revitalization projectto widen Main Street, beautify the downtown, and enhance the business climate.The Port has also recently established a small industrial park on the outskirts oftown.
People (Demographics)
The estimated population of Colfax in 1996 was 2,865. This represents a 3.8-percentincrease since 1990 after slowly increasing 3.6 percent between 1970 and 1990.The school district and the postal area cover a much larger population. Around 5,000area residents trade, work, go to school, and participate actively in communityevents. From 1980 to 1990 the median age increased from 36 years to 40 years.Over 23 percent of the total population was 65 years old and over in 1990. Thedependency ratio was 87. School district enrollment in 1999 was 759, an increase of31 students since 1990. In 1990, Native Americans, Hispanics, and African-Americans made up less than 1 percent of the total population.
Economics
Total employment in 1990 was 1,180 down from 1,228 in 1980. Unemployment in1990 was a low 2.9 percent. This represents a decrease from the low 1980unemployment rate of 4.9 percent. Employment in 1990 was highest in retail trade,services, agriculture, and state and local government. Overall economic diversity inColfax was calculated as medium low for 1995. Major employers include WhitmanCounty, Whitman Hospital, Colfax school district, Whitman House, and theMcGregor Company. The Corps employs 7 individuals in Colfax in relation to theoperation of Lower Granite Dam.
Colfax serves as an isolated trade center for outlying rural communities in the countyand has access to rail, barging, and trucking services. The Port of Whitman moveslocal agricultural products and manufactured goods downriver to market and bringsagricultural inputs and petroleum products upriver.
Predecisional DocumentationFor Information Purposes Only - Not For Comment
Predecisional DocumentationFor Information Purposes Only - Not For Comment
Median household income in 1990 was $26,445 with per capita income at $13,093.Twelve percent of families for whom poverty status was determined were below thepoverty line in 1990. This represents an increase from 7.2 percent in 1980. Electricalrates for households in 1998 were approximately 4.50 cents per Kilowatt-hour.
Character (Place)
Colfax’s location in the heart of the Palouse region and near the lower Snake Riverprovides numerous recreational opportunities for this traditional agriculturalcommunity. Colfax has access to 15 recreational sites on the lower Snake Riverreservoirs within 50 miles. The Port of Whitman County manages Boyer Park andMarina, a primary destination for Colfax residents. Over 5 percent of the totalpopulation held steelhead fishing tags in 1998, while 24 percent of residentspurchased general fishing licenses.
Land tenure can be characterized by the loss of 355 farms in the county and anincrease in the average sized farm by 349 acres between 1969 and 1992. Localservices include fire, police, and a hospital.
Vision and Vitality
Colfax’s community leaders have recently obtained outside funding to complete theMain Street revision. Their latest Comprehensive Plan (1993) describes a strategy"...to nurture a harmonious environment that will enhance the quality of life for allcitizens. It will provide for efficient municipal services, promote the businesscommunity and establish balanced economic growth..." Several of the key elementsto achieve this vision include:
• enhance residential development opportunities and preserve opportunities fordiversified lifestyles, to accommodate a growing population of at least 15% bythe year 2002;
• enlarge the economic base by stimulating development of commercialfacilities, a diverse job market and shopping opportunities, and by promotingColfax as a retirement place;
• improve arterial and local road transportation;
• plan for rail abandonment to attain railroad rights-of-way;
Predecisional DocumentationFor Information Purposes Only - Not For Comment
Predecisional DocumentationFor Information Purposes Only - Not For Comment
• provide facilities and services for educational, cultural and recreational use;and
• maintain and improve the quality of the physical environment.
Colfax residents sponsor numerous activities including the Palouse Empire Fair, atraditional plowing bee and harvest bee and a summer festival. Over 11 churchesand 21 social organizations actively participate in the community. Some of theseorganizations include the American Legion, Red Cross, Rotary, VFW, HistoricalSociety, Whitman Conservation, Eagles, Elks, and 4-H.
Community members’ perceptions and assessment are pending final University ofIdaho report.
2.3.3 Pomeroy, Washington
Pomeroy is located in Garfield County approximately 15 miles south of the lowerSnake River in southeastern Washington. US Highway 12 passes through town andconnects Pomeroy to Clarkston and Lewiston to the east and Walla Walla and theTri-Cities to the west. Pomeroy was selected because of navigation and recreationconcerns.
History
Established in 1864, Pomeroy quickly experienced a rapid wave of populationmigration due to its location on the stagecoach line between the towns of WallaWalla and Lewiston. The economy was based primarily on cattle and vegetablefarming. By 1878 the town had grown into a service and trade center, containing aflour mill, retail stores, and a hotel. Arrival of the Starbuck-Pomeroy rail branch in1885 further expanded Pomeroy’s population, while serving as the major source oftransportation for agricultural products. A pea cannery was built in 1942 andremained operational until the 1960s. The construction of Little Goose Dam in 1970,followed by Lower Granite Dam in 1975 significantly increased the local populationand economic base in Pomeroy, as construction workers and their families movedin. The rail line went bankrupt and was abandoned in 1981. Pomeroy of the 1990shas experienced many infrastructure improvements to its Main Street.
Predecisional DocumentationFor Information Purposes Only - Not For Comment
Predecisional DocumentationFor Information Purposes Only - Not For Comment
People (Demographics)
The estimated population of Pomeroy in 1996 was 1475. This represents a 5.9-percent increase since 1990 after a large decline of 23.6 percent between 1970 and1990 in the wake of the post dam construction population and economic boom.Pomeroy is the only large community in the county and thus the population servedby, and employed and involved in, the community is much larger. From 1980 to 1990the median age increased from 41 years old to 46 years old. Over 28 percent of thetotal population was 65 years old and over in 1990. The dependency ratio was 105.School enrollment in 1990 was 234 students. In 1990 Native Americans andHispanics made up less than 2 percent of the total population. Recent demographicchanges have included an increasing population on public assistance.
Economics
Total employment in 1990 was 572. Unemployment in 1990 was a low 2.6 percent.Employment in 1990 was highest in agriculture, retail trade, services, and state andlocal government. Overall economic diversity in Pomeroy was calculated as mediumhigh for 1995. Major employers include the Forest Service, Army Corps ofEngineers, county government, the local school district, Garfield County MemorialHospital, and Dye Seed Ranch. The Corps employs 20 individuals who reside inPomeroy.
Pomeroy is an isolated community with strong economic and social links to theLewiston and Clarkston Valley. The community has access to barge and truckingservices. There is no rail service in the county.
Median household income in 1990 was $22,903 with per capita income at $11,283.Families for whom poverty status was determined were below the poverty line in1990 were 6.5 percent. Electrical rates for households in 1998 were approximately5.13 cents per kilowatt-hour.
Character (Place)
Pomeroy’s location in the midst of rich farmland between the lower Snake River andthe Umatilla National Forest and the Tucannon Wilderness provides numerousrecreational opportunities for this traditional agricultural community. Pomeroy hasaccess to 20 recreational sites on the lower Snake River reservoirs within 50 miles.Primary destinations for Pomeroy residents on the reservoirs are Chief TimothyState Park, Boyer Park, and Central Ferry. Over 8 percent of the total populationheld steelhead fishing tags in 1998, while 40 percent of residents purchased generalfishing licenses.
Predecisional DocumentationFor Information Purposes Only - Not For Comment
Predecisional DocumentationFor Information Purposes Only - Not For Comment
Land tenure can be characterized by the loss of 60 farms in the county and anincrease in the average sized farm by 338 acres between 1969 and 1992. Localservices include fire, police, and a hospital.
Vision and Vitality
Pomeroy has actively worked to develop and restore an old flour mill and hasobtained outside funding for other local projects like downtown beautification.Pomeroy’s 1995 Comprehensive Plan describes key elements for maintaining itssmall town atmosphere. These include:
• Attaining economic well-being through diversification and economic stability;
• Encourage the development of businesses that utilize locally-grown productsand value-added industries;
• Protecting the natural and built environments through preservation,conservation, and enhancement;
• Attracting out-of-town money by focusing on recreation and tourism;
• Encourage efficient multi-modal transportation systems based on regionalpriorities and coordinated with county and city comprehensive plans;
• Increase the opportunity for residents to purchase or rent affordable safe andsanitary housing; and
• Protect the viability of agricultural and forest practices from nuisanceslawsuits that encourage and may even force the premature removal of landsfrom agricultural uses and timber production.
Pomeroy residents sponsor numerous activities including the Garfield County fair, arodeo and fair, and a tumbleweed festival. Six churches and other socialorganizations actively participate in the community. Some of these organizationsinclude the civic theatre, spinners club, Men’s club, Kiwanis, Shriners, VFW, theHistorical Society, 4-H, service club, and the Eagles.
Community members’ perceptions and assessment are pending final University ofIdaho report.
Predecisional DocumentationFor Information Purposes Only - Not For Comment
Predecisional DocumentationFor Information Purposes Only - Not For Comment
2.3.4 Kennewick, Washington
Kennewick is located in Benton County across the Columbia River from Pasco. Itwas selected as a focus community because of navigation, recreation, irrigation, andpower concerns.
History
Incorporated in 1904, Kennewick is the largest community of the Tri-Cities. It beganas a predominantly agricultural-driven economy, linked to the Northern PacificRailroad route which moved its products to markets. World War II brought newprosperity to the region: In the 1940s, the plutonium production facilities at HanfordProject were created. Hanford employees greatly expanded Kennewick’s populationand the retail base grew to meet the needs of the increasing population. With thedevelopment of the Columbia Basin Project, irrigated agriculture expanded aroundthe community, contributing to its rapid growth.
People (Demographics)
The estimated population of Kennewick in 1996 was 48,010. This represents a 13.9-percent increase since 1990 after increasing 177 percent between 1970 and 1990through growth and annexation. From 1980 to 1990 the median age increased from27 to 30. The dependency ratio was 66. School district enrollment in 1999 was13,823 students, an increase of 1,694 students since 1990. The Hispanic populationincreased from 4.1 to 8.7 percent of the population between 1980 and 1990. AfricanAmerican and Native Americans made up 1.1 and 1 percent respectively of the totalpopulation.
Economics
Total employment in Kennewick in 1990 was 19,393 with an unemployment rate of7.0 percent. This represents a slight increase from the 1980 unemployment rate of6.7 percent. Employment in 1990 was highest in retail trade with 4,089 employeeswith services, non-durable manufacturing, and transportation, communication, andpublic utilities contributing 7,047, 2,271 and 2,152 jobs respectively. Services,agriculture, and recreation were the fastest growing sectors between 1980 and1990. Overall economic diversity in Pasco was calculated as high in 1995. Majoremployers include the school district, Kennewick General Hospital, Sandvik SpecialMetals, and Costco. Kennewick is considered a regional retail center and is servedby rail and trucking modes of transportation. Barge transportation is located acrossthe river in Pasco.
Predecisional DocumentationFor Information Purposes Only - Not For Comment
Predecisional DocumentationFor Information Purposes Only - Not For Comment
Median household income in 1990 was $28,261 with per capita income at $12,767.Twelve percent of families for whom poverty status was determined were below thepoverty line in 1990. This represents an increase from 7.2 percent in 1980. BentonCounty has been designated as an economically distressed area due to highunemployment over the last 3 years. Electrical rates for households in 1998 wereapproximately 4.28 cents per Kilowatt-hour.
Character (Place)
Kennewick’s location on the Columbia River affords community residents andvisitors with abundant opportunities for slack water recreation. Kennewick residentshave access to 32 developed water recreation sites, including six on the lowerSnake River reservoirs within 50 miles such as Fish Hook Park and Landing,Charbonneau, and Central Ferry. Waterfront development and parks are an integralpart of the character of Kennewick.
Land tenure can be characterized by the loss of 21 farms in the county and adecrease in the average size farm by 108 acres between 1969 and 1992. Localservices include fire, police, and hospital.
Vision and Vitality
The 1998 Kennewick Comprehensive Plan describes a strategy to "...fashiondevelopment and growth with conscientious planning and foresight..." Elements ofthis plan include:
• Encouraging growth within the current city limits while protecting criticalareas.
• Promoting work at the regional level to enhance the Columbia River Shorelineand Kennewick’s riverfront.
• Diversifying the economy, which is currently dominated by nuclear fuelmanufacturing, the construction of nuclear power plants, and agriculture.Initiatives include targeting the underdeveloped industrial sector, providingaffordable housing, and capitalizing on tourism benefits of the currently under-utilized Columbia River.
Predecisional DocumentationFor Information Purposes Only - Not For Comment
Predecisional DocumentationFor Information Purposes Only - Not For Comment
• Maintaining the navigability of the Columbia River for commercial bargetraffic.
• Improving all modes of transportation, including the rail system, expansion ofColumbia River port capabilities, and expansion of public access to localwaterways for recreation.
Community members’ perceptions and assessment are pending final University ofIdaho report.
2.3.5 Pasco, Washington
Pasco is located in Franklin County to the north of the confluence of the Snake andColumbia Rivers. Pasco and the other Tri-Cities create a hub of human andcommodity movements through the lower Columbia Basin. Pasco was selected as afocus community because of water supply issues, navigation/transportation, power,recreation opportunities and sites, and anadromous fish runs.
History
Officially incorporated in 1891, Pasco attributes its establishment and early growth torailroad construction near the Snake and Columbia Rivers in the 1870s. Steam-powered boats provided transportation into the region prior to the arrival of therailroad. Pasco soon moved from a single economy of rail to livestock andagricultural production made possible by pumping water from the rivers for irrigationin the 1890s. A more intensive irrigation project was developed in 1910. Airmailservice to Pasco began in 1926, and a new airport by the rail was dedicated in 1929.In 1943 the Hanford nuclear project began. Although Pasco is located on theopposite side of the Columbia River from the Hanford facilities, it did receive somepopulation and economic spillover, particularly with the 1985 creation of the I-182highway bridge which connects Pasco to Richland. Work on environmentalrestoration in Hanford continues to provide economic benefits to Pasco. Dry landand irrigated agriculture in the surrounding countryside continue to play an importantrole in Pasco’s development.
Predecisional DocumentationFor Information Purposes Only - Not For Comment
Predecisional DocumentationFor Information Purposes Only - Not For Comment
People (Demographics)
The estimated population of Pasco in 1996 was 22,370. This represents a 10percent increase since 1990 after increasing 46.1 percent between 1970 and 1990.From 1980 to 1990 the median age remained stable at 27 years. The dependencyratio was 83. School enrollment of local residents in 1990 was 4,906, an increase of1,272 students since 1980. Hispanics made up 40.8 percent of the population in1990, up from 20.9 percent in 1980. African Americans and Native Americans madeup 5.6 percent and 1 percent, respectively, of the total population.
Economics
Total employment in Pasco in 1990 was 7,726 with an unemployment rate of 11.5percent. This represents an increase from the 1980 unemployment rate of 10.1percent. Employment in 1990 was highest in retail trade with 1,387 employees inboth manufacturing of durable and non-durable goods and agriculture contributing1,352 and 1,286 jobs, respectively. From 1980 to 1989, employment in agriculturehas increased 170 percent. Overall economic diversity in Pasco was calculated ashigh in 1995. Major employers include Iowa Beef, the school district, UniversalFrozen Foods, Boise Cascade, and Burlington Northern.
Pasco is considered a regional trade center and is served by rail, barging, andtrucking services. The Port of Pasco operates both rail and barge loading facilities.The Port is the furthest port upstream on the Columbia River. Its position on USHighway 395 and Interstate Highway 82, combined with its large rail yard, makesPasco the primary transportation node in the lower Columbia Region.
Median household income in 1990 was $17,897 with per capita income at $8,016.Twenty-eight percent of families for whom poverty status was determined werebelow the poverty line in 1990. This represents an increase from 12 percent in 1980.Franklin County has been designated as an economically distressed area. Electricalrates for households in 1998 were approximately 4.28 cents per Kilowatt-hour.
Character (Place)
Pasco’s location at the confluence of the Snake and Columbia Rivers affordscommunity residents and visitors abundant opportunities for slack water recreation.Pasco residents have access to 32 developed water recreation sites, including sixon the lower Snake River reservoirs within 50 miles, such as Charbonneau, FishHook Park and Landing, and Windust Park.

Predecisional DocumentationFor Information Purposes Only - Not For Comment
Predecisional DocumentationFor Information Purposes Only - Not For Comment
Land tenure between 1969 and 1992 can be characterized by the gain of 66 farms inthe county and no change in the average size farm. Local services include fire,police, and a regional hospital.
Vision and Vitality
The 1995 Comprehensive Plan lists critical elements to move the community forwardto 2015. These include:
• Focusing on the land use of the city by improving its physical appearance,encouraging cluster development, promoting community services, andencouraging small-scale neighborhood commercial hubs.
• Providing adequate park and recreation opportunities, such as improvingsegments of the Columbia and Snake River shoreline.
• Supporting efforts to build a train-transit interstate bus terminal for residents.
• Maintaining economic development by promoting new businesses, tourismand recreational opportunities on the Columbia and Snake Rivers.
• Maintaining a strong relationship with the Port.
Community members’ perceptions and assessment are pending final University ofIdaho report.
2.3.6 Umatilla, Oregon
Umatilla is located in Umatilla County, downstream from the confluence of the Snakeand Columbia Rivers on the Columbia River. Umatilla was selected as a focuscommunity because of navigation/transportation, recreational opportunities andsites, and irrigation.
History
Initially called Columbia, the town of Umatilla was founded in 1863 as a site fortransferring gold on the Columbia River to the Walla Walla route. When miningdeclined, the town stagnated but then grew into a local service center for increasingirrigated agricultural activity. The building of the Umatilla Army Depot in the 1940sand the McNary Dam in the 1950s contributed to a population boom. In 1963 amajor portion of Umatilla was destroyed because of flooding caused by the JohnDay Dam, built 40 miles downriver.
Predecisional DocumentationFor Information Purposes Only - Not For Comment
Predecisional DocumentationFor Information Purposes Only - Not For Comment
People (Demographics)
The estimated population of Umatilla in 1996 was 3,310. This represents an 8.7-percent increase since 1990 after increasing 348 percent between 1970 and 1990through rapid expansion of irrigated agriculture. From 1980 to 1990 the median ageincreased from 24 to 28. The dependency ratio was 74. School enrollment of localresidents in 1990 was 744. Hispanics made up 17.1 percent of the total population in1990, up from 11.9 percent in 1980. African Americans and Native Americans madeup 0.2 percent and 1.6 percent respectively of the total population.
Economics
Total employment in Umatilla in 1990 was 1,225, with an unemployment rate of 12.4percent. This represents an increase from the 1980 unemployment rate of 6.4percent. Employment in 1990 was highest in retail trade with 266 employees withboth durable and non-durable manufacturing and all services contributing 208 and279 jobs respectively. Overall economic diversity in Umatilla was calculated asmedium high in 1995. Major employers include the school district, Boise Cascade,Sectric, and JM Manufacturing.
Umatilla is tightly linked to the economies of the Tri-Cities, Hermiston, Boardman,and Irrigon. The Port of Umatilla plays an important role in the handling of locallyproduced agricultural products and goods via the Columbia Waterway and rail.
Median household income in 1990 was $20,799 with per capita income at $8,481.Nineteen percent of families for whom poverty status was determined were belowthe poverty line in 1990. This represents an increase of 7.1 percent since 1980.Electrical rates for households in 1998 were approximately 5.40 cents per Kilowatt-hour.
Character (Place)
Umatilla’s location on the Columbia River on the John Day pool provides abundantwater for irrigation and recreation. Umatilla’s residents have access to 29 developedwater recreation sites including four on the lower Snake River reservoirs within 50miles. Fishing is an important activity as indicated by the annual Walleye fishingtournament and the marketing slogan "Walleye Capital of the World." Over 9 percentof the total population had steelhead fishing tags for the 1998-fishing season.
Land tenure can be characterized by the gain of 157 farms in the county and a slightdecrease in the average size farm of 16 acres between 1969 and 1992. Localservices include fire, police, and a hospital in nearby Hermiston.

Predecisional DocumentationFor Information Purposes Only - Not For Comment
Predecisional DocumentationFor Information Purposes Only - Not For Comment
Vision and Vitality
The leadership of Umatilla has actively pursued the development and diversificationof the local economy. According to the 1977 Umatilla Comprehensive Plan,"throughout its history, the growth of Umatilla has been influenced by fluctuations inthe agricultural economy and development along the Columbia River, and theimmediate future will likely follow a similar pattern."
The key elements of concern emphasized in the document include:
• Recreation: Continued access to and enjoyment of local outdoor recreationalopportunities on the Columbia and Umatilla Rivers.
• Economic growth: Future expansions in irrigated agriculture, agri-businessand industrial facilities to strengthen the economy.
• Transportation: Improvement of land transportation via the development of I-82 to link I-90 to I-80.
Community organizations, including six churches and various service organizationssuch as Kiwanis, Masonic temple, boy scouts, explorer scouts, and the senior centerand the local chamber of commerce, contribute to the vision and vitality of Umatilla.The community sponsors diverse events such as landing days, the walleyetournament, and a community Christmas tree lighting ceremony, a stage rider’srodeo, and circus conducted by the chamber of commerce.
Community members’ perceptions and assessment are pending final University ofIdaho report.
2.3.7 Lewiston, Idaho
Lewiston is located in Nez Perce County at the confluence of the Clearwater andSnake rivers. Three major US highways in the region intersect in Lewiston andprovide access to Eastern Washington, Northern Idaho, Montana, and SouthernIdaho. It was selected as a focus community for the following reasons: navigation atthe Port of Lewiston (the only seaport in Idaho), recreational opportunities andaccess along the lower Snake River, construction impacts associated withimplementation, and anadromous fish runs on the Snake and Clearwater Rivers.
Predecisional DocumentationFor Information Purposes Only - Not For Comment
Predecisional DocumentationFor Information Purposes Only - Not For Comment
History
Founded in May 1861, Lewiston was the second permanent settlement in Idaho andthe first incorporated town. Because of its location on the junction of the Snake andClearwater rivers and seasonal navigation on the lower Snake River, Lewistonserved as a supply center for regional mining operations. Following the gold boom,Lewiston continued to grow as a regional shopping, market, and distribution centerfor agricultural and timber operations. The Port of Lewiston was established in 1958.The Lewiston Orchards were annexed in 1969, doubling the town’s area andpopulation. The construction of the Lower Granite dam in 1975 brought slackwater toLewiston, making it the most inland port on the 460 mile Columbia-Snake Rivertransportation system.
People (Demographics)
The estimated population of Lewiston in 1996 was 30,271. This represents a 7.8-percent increase since 1990 after slowly increasing 7.7 percent between 1970 and1990. From 1980 to 1990 the median age increased from 31 years to 35 years. Thedependency ratio, a measure of the age structure of the community, was 69. Schooldistrict enrollment in 1999 was 5,121, an increase of 561 students since 1990.Native Americans and Hispanics made up 1.4 percent and 1.2 percent respectivelyof the total population.
Economics
Total employment in Lewiston in 1990 was 13,120 with an unemployment rate of 6.4percent. This represents a decrease from the 1980 unemployment rate of 8.4percent. Employment in 1990 was highest in retail trade with 2,607 employees.Manufacturing of durable and non-durable goods accounted for 2,771 jobs. Overalleconomic diversity in Lewiston was calculated as high for 1995. Major employersinclude the Potlatch Corporation (Potlatch), Lewis and Clark State College, St.Joseph Regional Medical Center, and Blount, Inc. Potlatch is by far the largestemployer in the valley.
Lewiston is considered a regional trade center and is served by rail, barging andtrucking services. The Port of Lewiston has both rail and barge loading facilities.Primary downriver shipments include grains and wood products, logs and woodchips from Potlatch, which are transported both in bulk and in containers. Recreationon the reservoirs and further upriver on the Clearwater and Snake rivers is also animportant component of the local economy and includes both services and boatmanufacturing.
Predecisional DocumentationFor Information Purposes Only - Not For Comment
Predecisional DocumentationFor Information Purposes Only - Not For Comment
Median household income in 1990 was $25,711, with per capita income at $12,828.Eight percent of families for whom poverty status was determined were below thepoverty line in 1990. Electrical rates for households in 1998 were approximately 4.25cents per Kilowatt-hour.
Character (Place)
Lewiston’s location at the confluence of the Snake and Clearwater rivers affordscommunity residents and visitors both slack water and white water recreationopportunities. Lewiston has access to 15 developed sites on the lower Snake Riverreservoirs within 50 miles. Important recreational areas include Chief Timothy,Clarkston Landing, and Hells Gate. The levee system provides open green spacealong the river with trails and recreational facilities. Fishing is an important elementin the community with over 11 percent of the total population holding steelhead tagsduring the 1998 fishing season.
Land tenure can be characterized by the loss of 147 farms in the county and anincrease in the average sized farm by 334 acres between 1969 and 1992. Localservices include fire, police, and a regional hospital.
Vision and Vitality
Lewiston’s leadership has actively pursued and obtained Federal grants. The 1991Comprehensive Plan lists its key planning objectives. These include:
• Encourage orderly and diverse growth by promoting economic, social andeducational opportunities.
• Prevent urban sprawl while encouraging use of undeveloped lots.
• Encourage industrial development that utilizes local labor and products, andis harmonious with the local environment.
• Protect open spaces and promote environmentally sound activities.
• Pursue transportation projects that lead to economic development.
• Encourage recreational opportunities, such as use of the waterfront. This mayinclude development of a greenbelt from the Lewiston Grain Growers to HellsGate State Park, and development of a boat launch facility in North Lewiston.
• Protect the existing biological ecosystem of the city and promote itsimprovement.
Predecisional DocumentationFor Information Purposes Only - Not For Comment
Predecisional DocumentationFor Information Purposes Only - Not For Comment
Community members’ perceptions and assessment are pending final University ofIdaho report.
2.3.8 Orofino, Idaho
Orofino is located in Clearwater County, 45 miles upstream from the lower SnakeRiver at the confluence of the North Fork and the Clearwater River. US Highway 12,the major highway connecting Lewiston to Montana, passes through the middle oftown. National Forests, Wild and Scenic Rivers, the Dworshak Reservoir, and theSelway-Bitterroot Wilderness Area are located in close proximity.
Orofino was selected because of the anadromous fish runs on the Clearwater River,the sport fishing industry related to those runs, and the current conflicts with flowaugmentation from the Dworshak Reservoir required under the 1995 BiologicalOpinion that affect recreation. Orofino markets itself as the "Steelhead Capital of theWorld" and boasts the world’s largest steelhead fish hatchery.
History
Orofino’s history is centered on its natural resources: gold prospectors first settledOrofino in 1861 and then demolished it when ore deposits were found beneath thetown. Orofino was later rebuilt in a different location at the confluence of OrofinoCreek and the Clearwater River. In 1889 the Northern Pacific Railroad began serviceto the town, and in 1897 the first post office was established. Starting in the 1900s,wood production dominated the economy and continues today. Orofino wasincorporated in 1925, and by 1940 it was an established center for white pinelogging. Agriculture also grew. In 1962 the Lewis and Clark Highway was completedand was seen as a source of economic stimulation for tourism and commerce. In1968 construction on Dworshak dam began and contributed to population increasesin Orofino. Much of the population remained post construction. Although timberproduction has been on the decline over the past decade from diminishing suppliesof timber from National Forest lands, new opportunities in recreational tourism werecreated from the Clearwater River and the Dworshak Reservoir. The nation’s largeststeelhead hatchery contributes to this tourism. The listing of Snake River salmon hasnegatively impacted these recreational developments.
Predecisional DocumentationFor Information Purposes Only - Not For Comment
Predecisional DocumentationFor Information Purposes Only - Not For Comment
People (Demographics)
The estimated population of Orofino in 1996 was 3,122. This represents an 8.6percent increase since 1990 after a 26.1 percent decrease between 1970 and 1990.From 1980 to 1990 the median age increased from 31 years to 38 years. Thedependency ratio was 73. School enrollment in 1999 was 1,613, a decrease of 90students since 1990. Native Americans and Hispanics made up 2 and 1.5 percentrespectively of the total population.
Economics
Total employment in Orofino in 1990 was 1,162, with an unemployment rate of 11.8percent. This represents a decrease from the 1980 unemployment rate of 17.7percent. The county is listed by the BLS as a labor surplus area because of thisconsistently high unemployment rate. Employment in 1990 was highest in retailtrade and manufacturing, agriculture, forestry and fisheries. Overall economicdiversity was calculated as medium high for 1995. Major employers include theschool district, the Clearwater National Forest, the Department of Health andWelfare, Clearwater Valley Hospital, The Potlatch Corporation, and KonkolvilleLumber Company. The community is considered isolated economically although it isserved by both rail and trucking services. The mills utilize the lower Snake Rivertransportation indirectly through their sales of wood chips to Potlatch in Lewiston,which are processed or shipped downstream.
Median household income in 1990 was $24,309 with per capita income at $12,251.Eight percent of families for whom poverty status was determined were below thepoverty line in 1990. Electrical rates for households in 1998 were 4.63 cents perKilowatt-hour.
Character (Place)
Orofino has access to ports on the lower Snake River within 50 miles. Aside fromlocal access to reservoir recreation opportunities on Dworshak Reservoir, Orofinohas access to six sites on the lower Snake reservoirs within 50 miles. Fishing is animportant element in the community with over 19 percent of the total populationholding steelhead tags during the 1998 fishing season.
Land tenure can be characterized by the loss of 13 farms in the county and adecrease in the average sized farm by 259 acres between 1969 and 1992. Localservices include fire, police, and a regional hospital.
Predecisional DocumentationFor Information Purposes Only - Not For Comment
Predecisional DocumentationFor Information Purposes Only - Not For Comment
Vision and Vitality
Orofino’s civic leadership has been successful in obtaining Federal grants as well asmaintaining up-to-date comprehensive plans. Key elements in Orofino’s 1997Comprehensive Plan include:
• promote a healthy and safe environment for residents;
• encourage young people to stay by making housing and employmentaccessible;
• promote tourism as a means of economic diversity;
• develop alternate means of public transportation, improve roads, and pavestreets;
• encourage efforts to make Highway 12 a 4-lane road to Lewiston;
• establish an alternate water source for the city;
• promote the construction of a new bridge across the Clearwater River; and
• develop a new airport.
One justification for the need to further diversify the local economy was the negativeimpacts of the salmon listing on the two main recreational industries.
Community activities and celebrations include a Bass fishing tournament, lumberjackdays, and the President’s Cup golf tournament. Active groups include 13 churchesas well as economic development and civic organizations like the chamber ofcommerce, Rotary, American Legion, veterans of foreign wars auxiliary, 4-H, andKiwanis.
Community members’ perceptions and assessment are pending final University ofIdaho report.
Predecisional DocumentationFor Information Purposes Only - Not For Comment
Predecisional DocumentationFor Information Purposes Only - Not For Comment
2.3.9 Riggins, Idaho
Riggins is located in Idaho County, upstream from the lower Snake River along theSalmon River, a tributary to the Snake. A major north-south highway (US 95) passesthrough the middle of town. Riggins was selected as a focus community because ofthe anadromous fish runs on the Salmon River, the recreational and sport fishing onthe Salmon River, as well as the effects of listed salmon stocks on whitewaterrecreation.
History
The discovery of gold first attracted settlement in the Riggins area, which wasofficially named in 1908. Mining was replaced by livestock raising, which remainedprominent until the 1950's. National forests were established nearby. With theCivilian Conservation Corps (CCC) program of the 1930s, as well as other Federalprojects, many roads, trails, fences, and water developments were established.During World War II, a sawmill was built and logging became a dominant industry.The 1982 fire that destroyed the mill forced the community to rebuild their economy.The residents who stayed shifted to a recreation-based economy of fishing, riverfloating, and hunting, made possible by the resources of the Salmon River. In 1982there was only one river outfitting company. Now, Riggins boasts 15 of these, plussix motels, five restaurants, and three real estate agencies, among other services.The Salmon River Economic Development Association was formed in 1992 toassess the economic health of the area. Since its inception, many city improvementshave occurred. Additionally, a medical clinic recently opened, the Goff Bridge hasbeen replaced, and a new water system is being coordinated with the improvementof Highway 95.
People (Demographics)
The estimated population of Riggins in 1996 was 495. This represents an 11.7-percent increase since 1990 after a 17% percent decrease between 1970 and 1990.The median age in 1990 was 44.6. The dependency ratio, a measure of the agestructure of the community, was 110. School district enrollment in 1999 was 244students. Native Americans and Hispanics each made up less than 1 percent of thetotal population.

Predecisional DocumentationFor Information Purposes Only - Not For Comment
Predecisional DocumentationFor Information Purposes Only - Not For Comment
Economics
Total employment in Riggins in 1990 was 138, with an unemployment rate of 6.8percent. This represents a decrease from the 1980 unemployment rate of 13.5percent. Idaho County is listed by the Bureau of Labor and Statistics (BLS) as alabor surplus area because of this consistently high unemployment rate.Employment in 1990 was highest in retail trade, services, and government andgovernmental enterprises. Overall economic diversity was rated as medium high for1995. Major employers include the Forest Service, the local school district, andPaul’s Market. The community is considered isolated economically although it isserved by trucking services and lies on US highway 95.
Median household income in 1990 was $11,458 with per capita income at $6,103.Approximately 26 percent of families for whom poverty status was determined werebelow the poverty line in 1990. Electrical rates for households in 1998 wereapproximately 5.18 cents per Kilowatt-hour.
Character (Place)
Riggins has no access to ports on the lower Snake River within 50 miles.Additionally it does not have access within 50 miles to recreational opportunities onthe lower Snake River. It does have access to abundant whitewater on the SalmonRiver and other recreational opportunities on Forest Service lands. Fishing is anextremely important element in the community with over 46 percent of the totalpopulation holding steelhead tags for the 1998 fishing season.
Land tenure may be characterized by the loss of 73 farms in the county and anincrease in the average sized farm by 65 acres from 1969 to 1992. Services inRiggins include fire and police.
Vision and Vitality
Riggins civic leadership has been successful at obtaining Federal grants forcommunity development. Although Riggins does not have a comprehensive plan,the leadership joined in developing a Gem Community Plan in 1997. The plan placesan emphasis on the need to diversify its economic situation while having as littleimpact as possible on small town atmosphere and lifestyle. It calls for "improving theeconomic status of the existing population through increasing the length of thetourist season, encouraging cottage industries, helping market existing productsproduced by local residents, and guiding changes that are inevitable." Key elementsin the plan include:
Predecisional DocumentationFor Information Purposes Only - Not For Comment
Predecisional DocumentationFor Information Purposes Only - Not For Comment
• promote tourism via the internet, brochures, and the construction of a riverpath;
• support holistic management of agriculture through weed control, watershedmanagement, and fishing controls; and
• support shared use of Hells Canyon.
Community members’ perceptions and assessment are pending final University ofIdaho report.
3. Description of Social Impacts: Geographic and Temporal Scope
3.1 Power
The primary socioeconomic impacts associated with changing power productionunder the proposed alternatives result from a percentage change in existingelectricity rates and the siting of new energy facilities. These impacts are evaluatedfor each of the focus communities in terms of the relative increase in retail powerrates, the dependency on Bonneville Power Administration (BPA) power, thepercentage change in local employment, the effect on export industries, and theproximity to the siting of new power generation facilities.
Impacts would occur immediately if the dam breaching alternative wereimplemented. The following analysis of rate impacts on consumers is quite uncertainbecause of recent changes in regional power marketing and the potential future rateeffects of BPA privatization and energy deregulation on Pacific Northwestconsumers. For the purpose of this analysis, the existing power marketing structurewill be assumed in order to isolate the marginal effects of lost hydropower productioncapability on ratepayers and communities in the region.
Predecisional DocumentationFor Information Purposes Only - Not For Comment
Predecisional DocumentationFor Information Purposes Only - Not For Comment
3.1.1 Electrical Rate Impacts
Alternatives A1 and A2
Under Alternative A1 no new facilities are proposed as there is no lost energyproduction. Because existing anadromous fish mitigation and recovery programs arepaid through the BPA and 5.6 percent of current residential rates contribute to theseprograms, there is uncertainty about the potential increases in BPA rates to meetSalmon recovery goals. Under the Memorandum of Agreement in effect from 1996to 2001, BPA will invest approximately $252 million dollars per year for fish andwildlife throughout the Columbia-Snake River System (BPA Fast Facts, 1997).These expenditures may continue into the future under A1 and may continue toincrease.
Under Alternative A2, the hydrosystem would be reconfigured and would actuallyproduce more energy. Although the rate impact of this increased production was notquantified it is assumed that the change would be minimal and individual ratepayersthroughout the Northwest would not be affected.
Alternative A3, Dam Breaching
Under Alternative A3, lost hydropower would be replaced by a more expensive formof generation--combined cycle turbines fueled by natural gas--or through acombination of conservation and renewable energy. Regardless of the method forreplacing the power, individuals throughout the Northwest would be faced with morecostly sources of energy. Under one scenario modeled by the Drawdown RegionalEconomic Workgroup Hydropower Impact Team (DREW HIT), the impacts ofincreased rates would most likely be distributed equally throughout the PacificNorthwest, the subregions, and the focus communities. Under another scenario, onlyBPA customers would pay for the increase in power production costs (DREW HIT,1999). The mechanism for cost recovery has not been determined at this time, but itis assumed that those utilities purchasing directly from BPA would be more at risk forincreased rates. As seen in Figure 13 approximately 59 percent of BPA revenue in1997 was generated through sales to public utilities and investor owned utilities,while 12 percent came through firm power sales to the aluminum industry (BPA FastFacts, 1997). The effects of increased rates on these consumer groups arediscussed below.
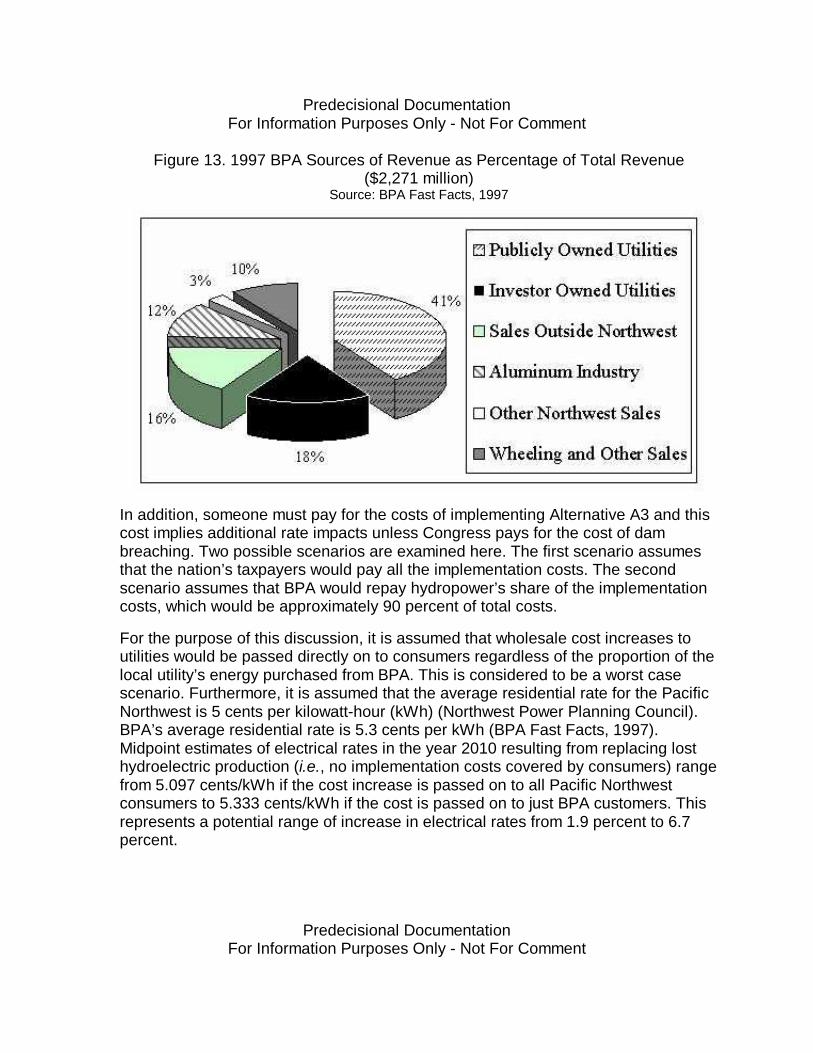
Predecisional DocumentationFor Information Purposes Only - Not For Comment
Predecisional DocumentationFor Information Purposes Only - Not For Comment
Figure 13. 1997 BPA Sources of Revenue as Percentage of Total Revenue($2,271 million)
Source: BPA Fast Facts, 1997
In addition, someone must pay for the costs of implementing Alternative A3 and thiscost implies additional rate impacts unless Congress pays for the cost of dambreaching. Two possible scenarios are examined here. The first scenario assumesthat the nation’s taxpayers would pay all the implementation costs. The secondscenario assumes that BPA would repay hydropower’s share of the implementationcosts, which would be approximately 90 percent of total costs.
For the purpose of this discussion, it is assumed that wholesale cost increases toutilities would be passed directly on to consumers regardless of the proportion of thelocal utility’s energy purchased from BPA. This is considered to be a worst casescenario. Furthermore, it is assumed that the average residential rate for the PacificNorthwest is 5 cents per kilowatt-hour (kWh) (Northwest Power Planning Council).BPA’s average residential rate is 5.3 cents per kWh (BPA Fast Facts, 1997).Midpoint estimates of electrical rates in the year 2010 resulting from replacing losthydroelectric production (i.e., no implementation costs covered by consumers) rangefrom 5.097 cents/kWh if the cost increase is passed on to all Pacific Northwestconsumers to 5.333 cents/kWh if the cost is passed on to just BPA customers. Thisrepresents a potential range of increase in electrical rates from 1.9 percent to 6.7percent.
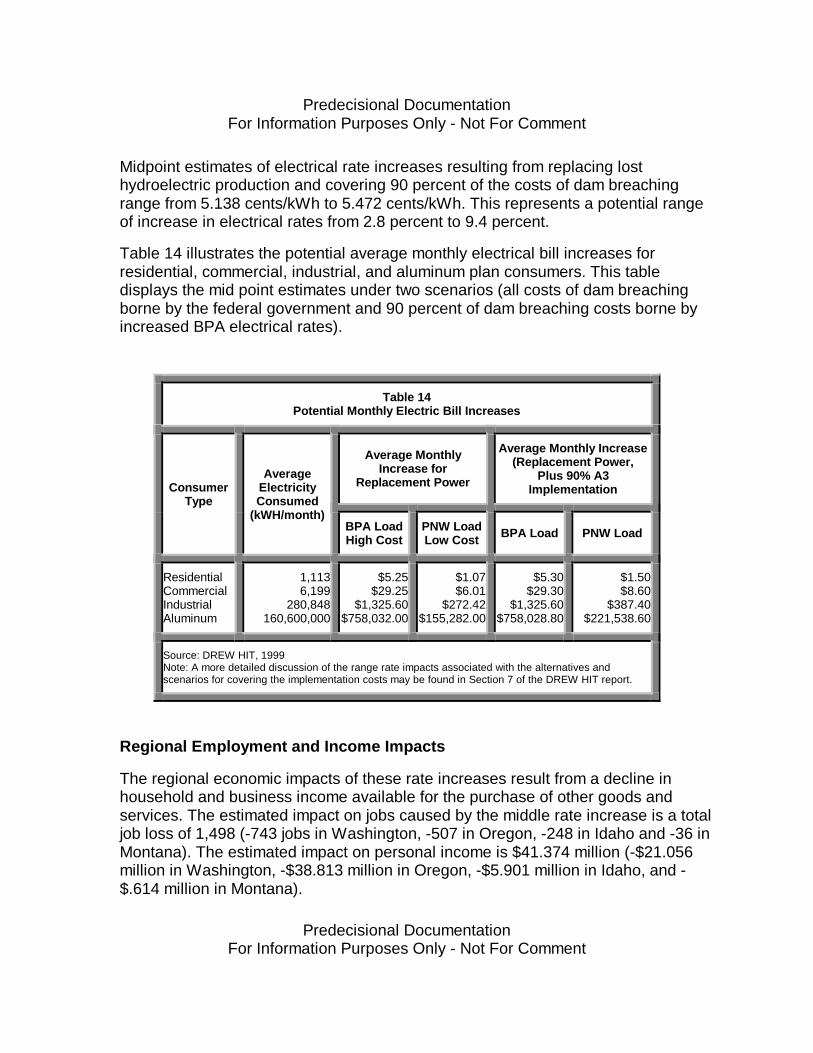
Predecisional DocumentationFor Information Purposes Only - Not For Comment
Predecisional DocumentationFor Information Purposes Only - Not For Comment
Midpoint estimates of electrical rate increases resulting from replacing losthydroelectric production and covering 90 percent of the costs of dam breachingrange from 5.138 cents/kWh to 5.472 cents/kWh. This represents a potential rangeof increase in electrical rates from 2.8 percent to 9.4 percent.
Table 14 illustrates the potential average monthly electrical bill increases forresidential, commercial, industrial, and aluminum plan consumers. This tabledisplays the mid point estimates under two scenarios (all costs of dam breachingborne by the federal government and 90 percent of dam breaching costs borne byincreased BPA electrical rates).
Table 14Potential Monthly Electric Bill Increases
Average MonthlyIncrease for
Replacement Power
Average Monthly Increase(Replacement Power,
Plus 90% A3ImplementationConsumer
Type
AverageElectricityConsumed
(kWH/month)BPA LoadHigh Cost
PNW LoadLow Cost BPA Load PNW Load
ResidentialCommercialIndustrialAluminum
1,1136,199
280,848160,600,000
$5.25$29.25
$1,325.60$758,032.00
$1.07$6.01
$272.42$155,282.00
$5.30$29.30
$1,325.60$758,028.80
$1.50$8.60
$387.40$221,538.60
Source: DREW HIT, 1999Note: A more detailed discussion of the range rate impacts associated with the alternatives andscenarios for covering the implementation costs may be found in Section 7 of the DREW HIT report.
Regional Employment and Income Impacts
The regional economic impacts of these rate increases result from a decline inhousehold and business income available for the purchase of other goods andservices. The estimated impact on jobs caused by the middle rate increase is a totaljob loss of 1,498 (-743 jobs in Washington, -507 in Oregon, -248 in Idaho and -36 inMontana). The estimated impact on personal income is $41.374 million (-$21.056million in Washington, -$38.813 million in Oregon, -$5.901 million in Idaho, and -$.614 million in Montana).
Predecisional DocumentationFor Information Purposes Only - Not For Comment
Predecisional DocumentationFor Information Purposes Only - Not For Comment
The overall effect of these rate increases would be an increase in the cost of livingand of doing business. Since all commercial businesses may be affected in a similarfashion no one sector would gain a competitive advantage if they serve a local orregional market. All businesses would see an equal increase in the cost of doingbusiness and could pass this cost on to consumers. On the other hand, thoseindustries that produce for export such as the aluminum industry and irrigatedagriculture may be placed at a competitive disadvantage. It is important to note,though, that average electrical rates for all sectors in the Northwest are well belownational averages and these anticipated rate increases will not move Northwestconsumers significantly towards the national averages. The relative effects of thesechanges are discussed in the following section.
Special Populations
Implications for Households
The social impacts of increased electrical rates would be relatively minor at thehousehold level. Although rates may increase from 2.0 to 9.5 percent and increasethe general cost of living, households in the region would still be well below thenational average residential rate of 8.4 cents/kWh (BPA Fast Facts). In addition tothe effects on residential consumers, households may also face an increase in thegeneral cost of living as producers pass on increased costs of doing business tohousehold consumers.
Implications for Fixed Income Households
Families on fixed income may have a more difficult time adapting to a higher cost ofliving. For example, increases in annual household electrical bills may range from$12.84 to $63.00. This increase may not create a significant social impact for fixedincome families but the added expense may reduce the resources available for otheressential expenditures.
Effects on Commercial Businesses
The response of small commercial businesses in the region would likely be to passthe increased costs of operations on to local and regional consumers. According tothe Edison Electrical Institute (1998), southwest and Californian commercialbusinesses pay approximately 25 to 100 percent more for electricity than Northwestcommercial enterprises. Under Alternative A3 the Pacific Northwest would still beable to attract new businesses with low, competitive electrical rates.
Predecisional DocumentationFor Information Purposes Only - Not For Comment
Predecisional DocumentationFor Information Purposes Only - Not For Comment
Implications for Irrigated Agriculture
Irrigated agriculture throughout the Pacific Northwest uses large quantities ofelectricity to pump water from ground wells and irrigation intakes, thus they would bedisproportionately affected by increased electrical rates. In addition, sinceagricultural producers are price takers, that is, they cannot pass the increased costsof production on to consumers, increased electrical rates would decrease net farmincome. The absolute amount would depend on the level of consumption.
Effects on Non-fixed Rate Export Oriented Industries
Industries in the region that produce for export may be placed at a competitive disadvantage fromincreased electrical rates. A comparison of monthly Northwest industry expendituresfor electricity with other regions on the west coast indicate that the effect would bemarginal. For example, data from the Edison Electrical Institute indicate that smallindustries outside of the Northwest pay on average between $1,000 to $24,000 moreper month for 400,000 kWh. Only one other region in the U.S., that serviced by theTennessee Valley Authority, has lower rates. It appears that an increase in electricityrates ranging from 2 to 9.5 percent would not create a barrier to attracting newbusinesses to the Pacific Northwest.
Implications for the Aluminum Industry
The potential effects on the aluminum industry in the Northwest are significantbecause their fixed rate contracts with BPA provide low electrical costs to thisenergy intensive industry. No industry studies were conducted as part of thisfeasibility study and therefore no clear conclusions may be drawn about the financialimpact or the employment impacts of a rate increase. It is clear that the low cost ofpower in the Pacific Northwest provides a competitive advantage for this industry.Without an industry specific study it is difficult to determine what the industryresponse to this rate impact would be. If world market prices for aluminum are high,the industry may continue to purchase from BPA at higher costs without affectingoverall profits. The industry may also respond by purchasing from other investorowned utilities at the same price it currently receives from BPA. In this case,residential consumers may see higher rate impacts than indicated in this study.Finally, if alternative low cost sources of electricity are unavailable and world marketconditions are not favorable, the industry may respond by relocating or closingfacilities.
Predecisional DocumentationFor Information Purposes Only - Not For Comment
Predecisional DocumentationFor Information Purposes Only - Not For Comment
3.1.2 Siting of New Power Production Facilities
The need to produce additional power to meet the existing demand may be met bysiting two combined cycle facilities near the Umatilla area or through a combinationof conservation and renewable energy sources (currently under study). The shortterm (1-2 years) regional employment and income impacts of this new constructionand operations activity are estimated at 3,625 jobs and an increase in personalincome of $116.8 million in the lower Snake River region for each facility. The long-term regional employment impacts for the operation of each new facility have beenestimated at 550 jobs. Total long-term employment would be approximately 1,100jobs in the lower Snake River region. The social impacts to those communitieslocated near the new facility may include a shift in the composition of the localpopulation, disruptions to daily living and commuting patterns, and decreased airquality. Because the locations of new facilities are not confirmed, these impacts willbe briefly discussed in the community impacts section of this report.
3.2 Recreation
The social analysis focuses on the impacts of changing recreational access for localcommunities and the regional impact of changes in employment and income relatedto visitation to the lower Snake River. Changes in recreational opportunities are notaddressed as adverse or beneficial because particular uses of the river reflectindividual preferences that may be quite distinct throughout the region and becausemost all of the current uses will still be available under the various alternatives.Changed opportunities may bring new and different types of recreationists into theregion and affect the social make-up of certain communities. Specific communitiesrely on certain types of recreational opportunities as a part of their economic baseand the effects of altered opportunities are discussed on a community-by-communitybasis. The analysis also focuses on how community members might respond to theimpacts from changing river access and recreation opportunities during andfollowing drawdown implementation.
The following presents an overview of the general regional recreational changesassociated with the proposed alternatives and the regional economic and socialimpacts.
3.2.1 Current Users and Uses
Recreation access and opportunities are key elements of the current quality of lifeand provide one element of the sense of place for communities in the region. A 1985survey by the Corps found that between 80 and 89 percent of use of the lowerSnake River came from within 100 miles. A more recent survey found that over half
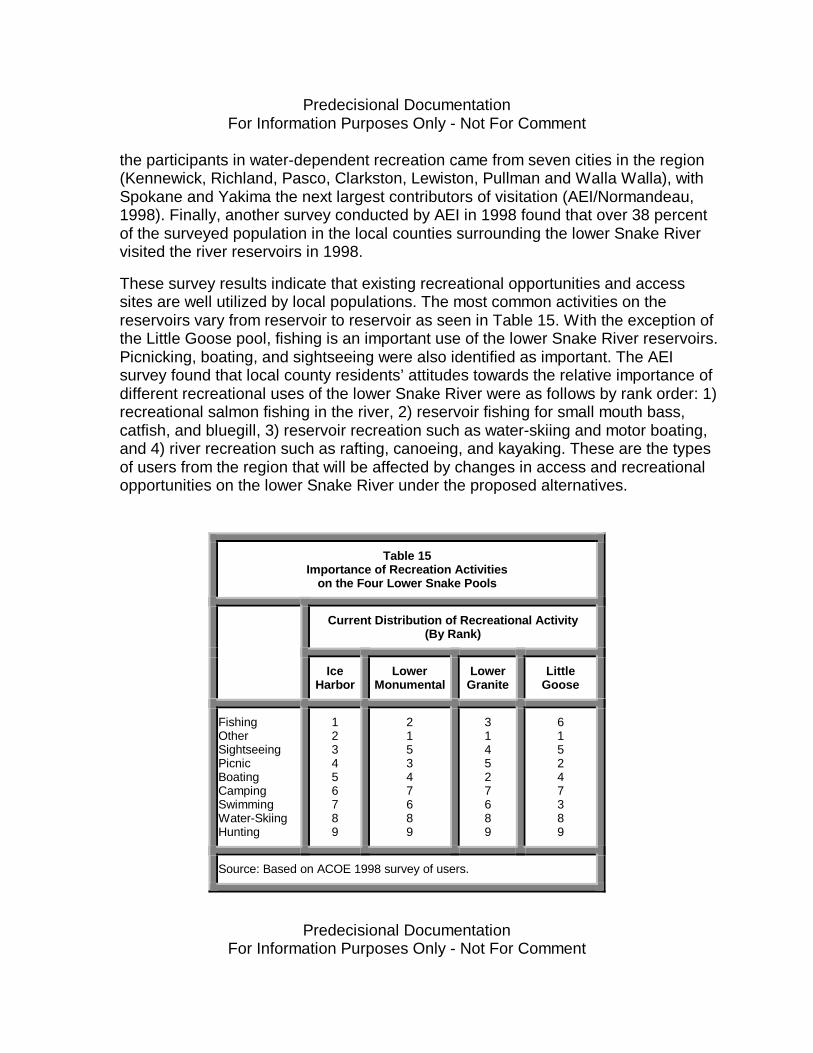
Predecisional DocumentationFor Information Purposes Only - Not For Comment
Predecisional DocumentationFor Information Purposes Only - Not For Comment
the participants in water-dependent recreation came from seven cities in the region(Kennewick, Richland, Pasco, Clarkston, Lewiston, Pullman and Walla Walla), withSpokane and Yakima the next largest contributors of visitation (AEI/Normandeau,1998). Finally, another survey conducted by AEI in 1998 found that over 38 percentof the surveyed population in the local counties surrounding the lower Snake Rivervisited the river reservoirs in 1998.
These survey results indicate that existing recreational opportunities and accesssites are well utilized by local populations. The most common activities on thereservoirs vary from reservoir to reservoir as seen in Table 15. With the exception ofthe Little Goose pool, fishing is an important use of the lower Snake River reservoirs.Picnicking, boating, and sightseeing were also identified as important. The AEIsurvey found that local county residents’ attitudes towards the relative importance ofdifferent recreational uses of the lower Snake River were as follows by rank order: 1)recreational salmon fishing in the river, 2) reservoir fishing for small mouth bass,catfish, and bluegill, 3) reservoir recreation such as water-skiing and motor boating,and 4) river recreation such as rafting, canoeing, and kayaking. These are the typesof users from the region that will be affected by changes in access and recreationalopportunities on the lower Snake River under the proposed alternatives.
Table 15Importance of Recreation Activities
on the Four Lower Snake Pools
Current Distribution of Recreational Activity(By Rank)
IceHarbor
LowerMonumental
LowerGranite
LittleGoose
FishingOtherSightseeingPicnicBoatingCampingSwimmingWater-SkiingHunting
123456789
215347689
314527689
615247389
Source: Based on ACOE 1998 survey of users.
Predecisional DocumentationFor Information Purposes Only - Not For Comment
Predecisional DocumentationFor Information Purposes Only - Not For Comment
3.2.2 Recreational Access Changes: Alternatives A1 and A2
Under Alternatives A1 and A2, the existing access, developed and undevelopedrecreation areas, and current lake-type recreational opportunities would not change.Access areas, marinas, and non-anadromous fishing opportunities would remainavailable for local community members. The probabilities for continued or improvingwild anadromous fishing opportunities would be lower over all uncertainties thanthose associated with Alternative A3. This is based on projections by NMFS and theDREW Anadromous Fish Economic team. These projections indicate that harvest ofanadromous fish does not have a high probability of occurring under A1 or A2 overthe full range of uncertainties associated with the salmon life-cycle.
3.2.3 Recreational Access Changes: Alternative A3
Under Alternative A3, access to recreation on the lower Snake River would beadversely affected with the loss of 11 of 32 developed recreation areas. These areaswould be closed because they would no longer provide access to the water.Additionally, 18 sites would require modifications to provide access to the river.None of the 10 recreation areas that provide marina boat moorage or docksideservice facilities would be able to operate under Alternative A3 although some ofthese facilities may provide some services such as temporary moorage. The effectsof closure would be distributed across the region as follows:
• Ice Harbor: 1 out of 6 recreational areas closed
• Lower Granite: 3 out of 14 recreational areas closed
• Lower Monumental: 3 out of 6 recreational areas closed
• Little Goose: 4 out of 6 recreational areas closed
The effects on these lost recreation areas would take place immediately uponimplementation and access would be further limited after the initial drawdown assites are being modified and riparian vegetation is restored (10-20 years). Althoughthese developed recreational sites would be affected, new access may becomeavailable at undeveloped or primitive sites.
Predecisional DocumentationFor Information Purposes Only - Not For Comment
Predecisional DocumentationFor Information Purposes Only - Not For Comment
The social effects of changing and lost recreational access are evaluated for eachcommunity based on the proportion and degree of affected sites within 50 miles ofthe community. The social effects are discussed in the time frame of implementationand post-implementation. This measure will also help to identify the potentialdisplacement and travel requirements for local residents during and followingimplementation if Alternative A3 is selected.
3.2.4 Recreational Opportunities
Recreational opportunities would change dramatically under Alternative A3 as the140-mile long reservoir system would be converted to a 140-mile-long free-flowingriver. Although most of the existing recreational opportunities would still exist, themix of opportunities would change. It is assumed that local communities wouldcontinue to make use of the river resource for recreation. This is based on the 1971findings from a Washington State University survey conducted prior to theimpoundment of Lower Granite Dam that found over 88 percent of the visitors livedwithin 2 hours of the river.
In addition, upriver communities that depend on recreational guided fishing would beexpected to see benefits from the increased probability of salmon recovery andgrowth in the wild salmon and steelhead fishery.
New, non-fishing, recreational opportunities and increased visitation to a free flowingriver after 10 years are estimated to create between 542 and 1,489 jobs and$11.476 and $31.514 million in personal income in the reservoir subregion. After 20years these estimates increase to between 594 and 1,520 jobs and $12.575 millionto $32.166 million in personal income. Increased anadromous fishing opportunitiesin the reservoir region would create 91 jobs and $2.205 million in personal incomeafter 10 years and increase to 107 jobs and $2.582 million in personal income after20 years. Increased anadromous fishing opportunities in the upriver subregion areestimated to create 733 jobs and $13.748 million in personal income after 10 yearsand 1,499 jobs and $28.111 million in personal income after 20 years.
3.2.5 Displacement and Crowding
One response to the short-term disruption of recreational activities on the lowerSnake River by communities in the local area may be to shift lake-type recreationalactivities to the Columbia River, the Dworshak Reservoir, or Lake Coeur d’Alene.This increased usage for reservoir type recreation by displaced recreationists maycreate economic opportunities in other areas as well as crowding at existing sites.Additionally, the short term disruption of access and opportunities may also displacerecreationists to sites up-river on the Clearwater, Middle Snake, and Salmon rivers.
Predecisional DocumentationFor Information Purposes Only - Not For Comment
Predecisional DocumentationFor Information Purposes Only - Not For Comment
3.2.6 Populations of Special Concern
Recreational opportunities on the lower Snake River would change under AlternativeA3 and one population, the elderly, may be less able to adapt and respond to thischange. A free-flowing river would present greater challenges and greater risks tothose elderly who now participate in reservoir recreation. For example, althoughfishing will still be available on the river, the elderly who enjoy this activity may benot have the physical abilities to fish on a free-flowing river.
The following discussion of Navigation/Transportation related social impacts isprimarily based on the DREW Transportation Report dated April 15th, 1999, andspreadsheet models provided by the Corps, Portland District.
3.3.1 Social Impacts of Alternatives A1 and A2
Under Alternatives A1 and A2 no changes are forecast in the regional navigationsystem and thus no direct social impacts are identified. Although not directly relatedto actions under A1 and A2, the continued presence and operation of the lowerSnake River waterway and low-cost barge transportation may continue to exertpressure on the viability of railroads and therefore historic trends in railroadabandonment throughout the lower Snake region may continue. The social effects ofrail line abandonment on rural areas have been well documented and include therealignment of trade centers and trade hierarchies, negative impacts on smallergrain handling operations, increased trucking congestion, impacts to local roads, anddecreases in local tax revenue (Russell et al., 1995; USDA/ERS, 1974; Zimmerman,1930; Landis, 1932; Lively, 1932; Casavant and Lenzi, 1989; Bangsund et al., 1997).These impacts may well continue under A1 and A2 if additional branch rails are lostthroughout the upriver and reservoir subregions.
In addition to these recent trends in the availability and abundance of modes oftransportation, the overall farm sector has experienced and would continue toexperience significant trends in the foreseeable future under Alternatives A1 and A2.These trends include a decline in rural farm community population size, adecreasing number of farms, increasing average farm size, and a growing incomegap among community residents (see Dillman et al., 1986; Wimberley, 1986;Heffernan and Heffernan, 1986; Allen and Dillman, 1994). Several key factorscontribute to these trends. These include the role of increasing agriculturaltechnology, specialization and productivity of farms, the outmigration from ruralAmerica and the in-migration of a non-farm population, and finally the rise of theinformation age and the decline of the traditional family farm and community control(see Field and Burch, 1988; Loboa, et al., 1993; Allen and Dillman, 1994; andDillman, 1986). Data on farm size and number of farms as well as discussions with
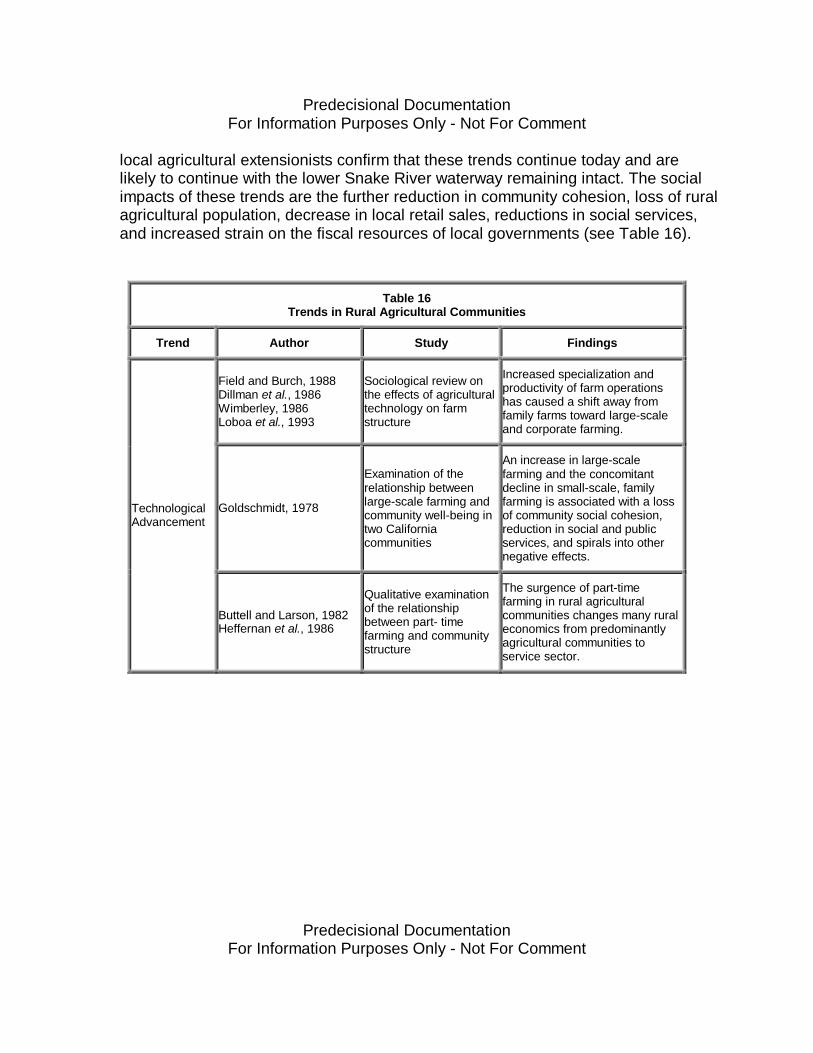
Predecisional DocumentationFor Information Purposes Only - Not For Comment
Predecisional DocumentationFor Information Purposes Only - Not For Comment
local agricultural extensionists confirm that these trends continue today and arelikely to continue with the lower Snake River waterway remaining intact. The socialimpacts of these trends are the further reduction in community cohesion, loss of ruralagricultural population, decrease in local retail sales, reductions in social services,and increased strain on the fiscal resources of local governments (see Table 16).
Table 16Trends in Rural Agricultural Communities
Trend Author Study Findings
Field and Burch, 1988Dillman et al., 1986Wimberley, 1986Loboa et al., 1993
Sociological review onthe effects of agriculturaltechnology on farmstructure
Increased specialization andproductivity of farm operationshas caused a shift away fromfamily farms toward large-scaleand corporate farming.
Goldschmidt, 1978
Examination of therelationship betweenlarge-scale farming andcommunity well-being intwo Californiacommunities
An increase in large-scalefarming and the concomitantdecline in small-scale, familyfarming is associated with a lossof community social cohesion,reduction in social and publicservices, and spirals into othernegative effects.
TechnologicalAdvancement
Buttell and Larson, 1982Heffernan et al., 1986
Qualitative examinationof the relationshipbetween part- timefarming and communitystructure
The surgence of part-timefarming in rural agriculturalcommunities changes many ruraleconomics from predominantlyagricultural communities toservice sector.

Predecisional DocumentationFor Information Purposes Only - Not For Comment
Predecisional DocumentationFor Information Purposes Only - Not For Comment
Allen and Dillman, 1994
Case study of the socialdynamics of a smallfarming community inEastern Washington.
Out-migration due totechnological advances hasinfluenced the social system ofthe entire community. Forexample, population reductionshave forced schools to close andconsolidate. High schoolgraduates often leave thecommunity in search ofemployment opportunities.
Outmigrationand aging farmpopulation
Rodefeld et al., 1978
Study of communitydemographic changesresulting from populationmigration out of ruralagricultural communities.
Out-migration is selective andaffects the socioeconomiccharacteristics of the entirecommunity. It leaves an agestructure in the community with ahigh proportion of older peopleand children. The resultingconsequences include a strain inmedical, educational,recreational, and other services;and a decreased tax base.
Rise of theInformationAge
Dillman, 1985Dillman, 1986Allan and Dillman, 1994
General effects ofincreased levels ofinformation andcommunication anddecreased communitycontrol and mass societyinteraction.
Farmers are experiencing moreexternal control over farmdecision-making and otheraspects of community life.Increased information networksand communication changes thetraditional rural farmingcommunity.
A social caste system isevolving as outsideemployment opportunitiesand larger but fewer farmschallenge communitycohesion. Also, a new influxof in-migration by non-farmers seeking a small-townquality of life and new type ofpopulation growth.
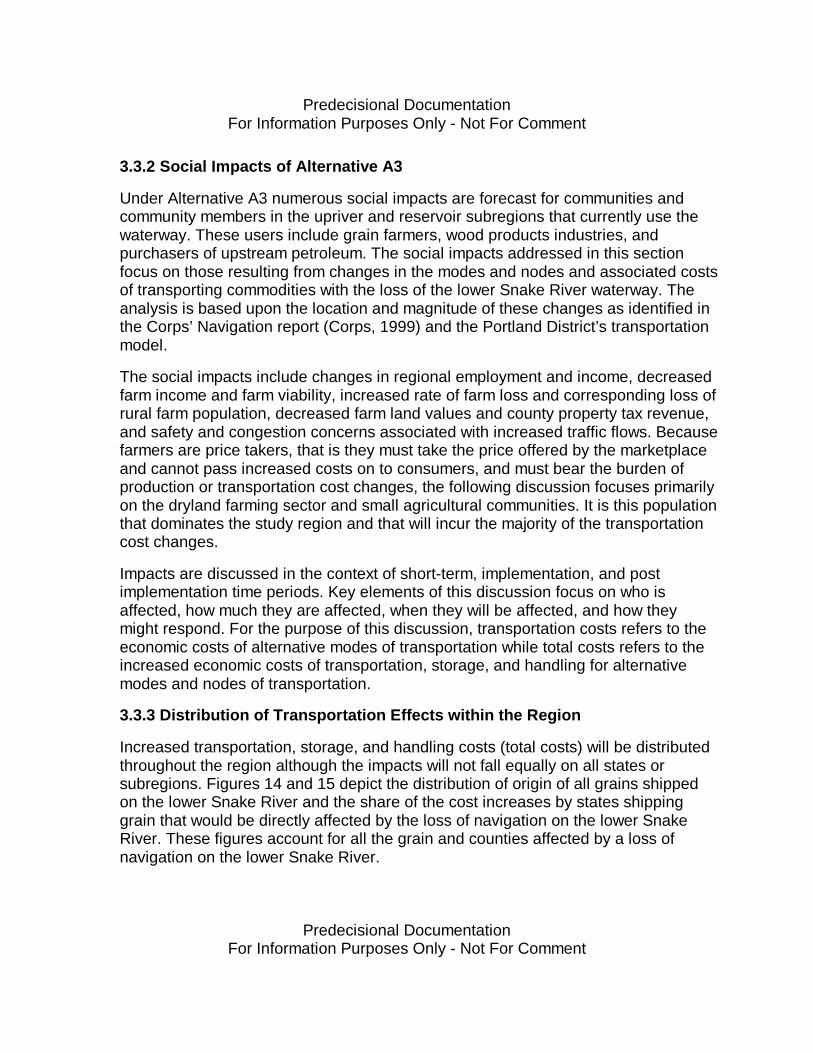
Predecisional DocumentationFor Information Purposes Only - Not For Comment
Predecisional DocumentationFor Information Purposes Only - Not For Comment
3.3.2 Social Impacts of Alternative A3
Under Alternative A3 numerous social impacts are forecast for communities andcommunity members in the upriver and reservoir subregions that currently use thewaterway. These users include grain farmers, wood products industries, andpurchasers of upstream petroleum. The social impacts addressed in this sectionfocus on those resulting from changes in the modes and nodes and associated costsof transporting commodities with the loss of the lower Snake River waterway. Theanalysis is based upon the location and magnitude of these changes as identified inthe Corps’ Navigation report (Corps, 1999) and the Portland District’s transportationmodel.
The social impacts include changes in regional employment and income, decreasedfarm income and farm viability, increased rate of farm loss and corresponding loss ofrural farm population, decreased farm land values and county property tax revenue,and safety and congestion concerns associated with increased traffic flows. Becausefarmers are price takers, that is they must take the price offered by the marketplaceand cannot pass increased costs on to consumers, and must bear the burden ofproduction or transportation cost changes, the following discussion focuses primarilyon the dryland farming sector and small agricultural communities. It is this populationthat dominates the study region and that will incur the majority of the transportationcost changes.
Impacts are discussed in the context of short-term, implementation, and postimplementation time periods. Key elements of this discussion focus on who isaffected, how much they are affected, when they will be affected, and how theymight respond. For the purpose of this discussion, transportation costs refers to theeconomic costs of alternative modes of transportation while total costs refers to theincreased economic costs of transportation, storage, and handling for alternativemodes and nodes of transportation.
3.3.3 Distribution of Transportation Effects within the Region
Increased transportation, storage, and handling costs (total costs) will be distributedthroughout the region although the impacts will not fall equally on all states orsubregions. Figures 14 and 15 depict the distribution of origin of all grains shippedon the lower Snake River and the share of the cost increases by states shippinggrain that would be directly affected by the loss of navigation on the lower SnakeRiver. These figures account for all the grain and counties affected by a loss ofnavigation on the lower Snake River.
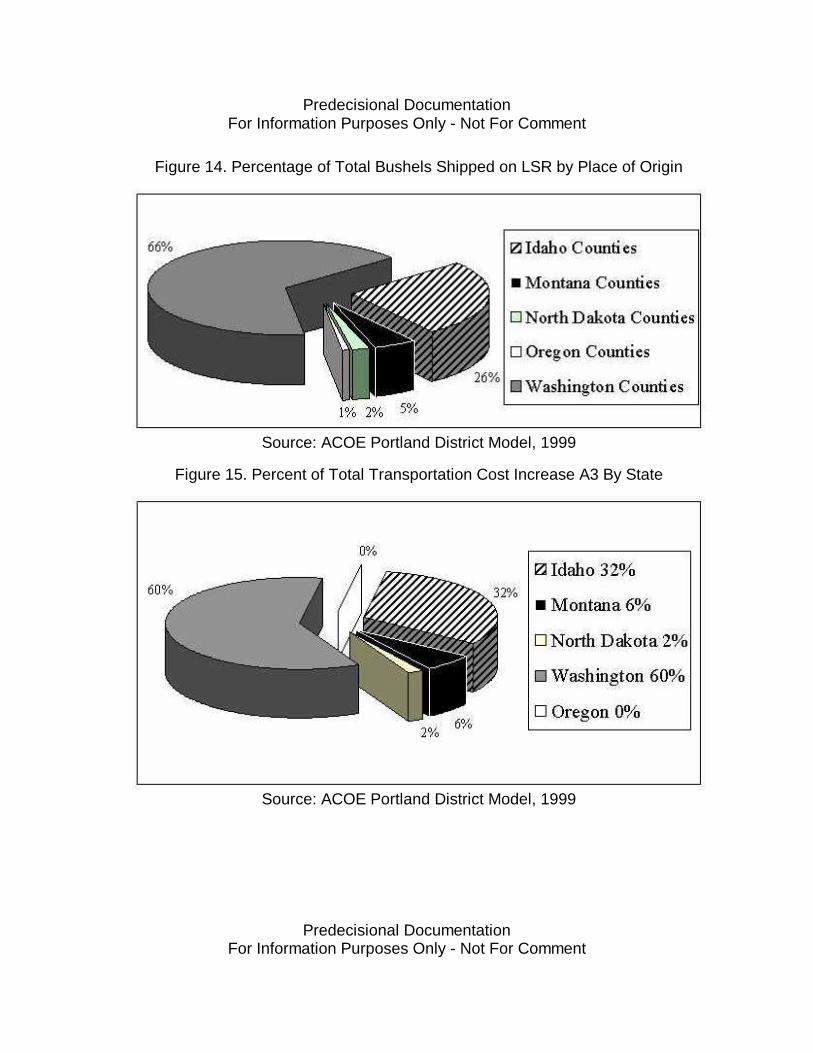
Predecisional DocumentationFor Information Purposes Only - Not For Comment
Predecisional DocumentationFor Information Purposes Only - Not For Comment
Figure 14. Percentage of Total Bushels Shipped on LSR by Place of Origin
Source: ACOE Portland District Model, 1999
Figure 15. Percent of Total Transportation Cost Increase A3 By State
Source: ACOE Portland District Model, 1999
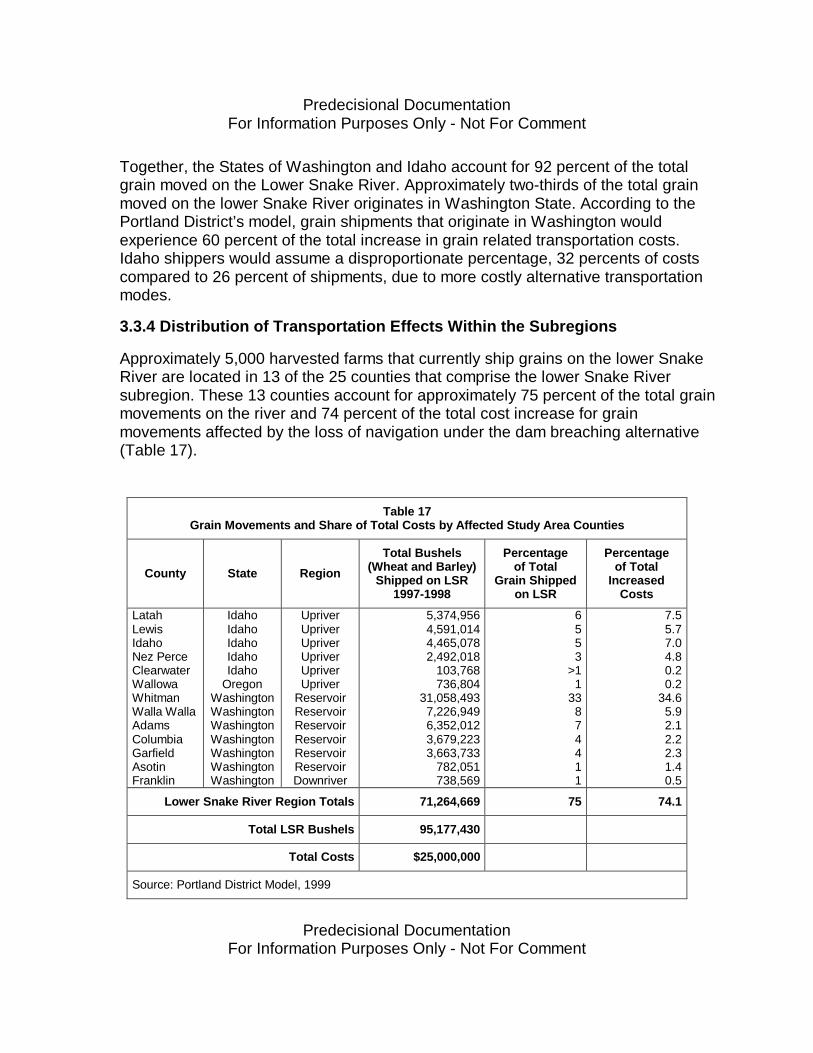
Predecisional DocumentationFor Information Purposes Only - Not For Comment
Predecisional DocumentationFor Information Purposes Only - Not For Comment
Together, the States of Washington and Idaho account for 92 percent of the totalgrain moved on the Lower Snake River. Approximately two-thirds of the total grainmoved on the lower Snake River originates in Washington State. According to thePortland District’s model, grain shipments that originate in Washington wouldexperience 60 percent of the total increase in grain related transportation costs.Idaho shippers would assume a disproportionate percentage, 32 percents of costscompared to 26 percent of shipments, due to more costly alternative transportationmodes.
3.3.4 Distribution of Transportation Effects Within the Subregions
Approximately 5,000 harvested farms that currently ship grains on the lower SnakeRiver are located in 13 of the 25 counties that comprise the lower Snake Riversubregion. These 13 counties account for approximately 75 percent of the total grainmovements on the river and 74 percent of the total cost increase for grainmovements affected by the loss of navigation under the dam breaching alternative(Table 17).
Table 17Grain Movements and Share of Total Costs by Affected Study Area Counties
County State Region
Total Bushels(Wheat and Barley)
Shipped on LSR1997-1998
Percentageof Total
Grain Shippedon LSR
Percentageof Total
IncreasedCosts
LatahLewisIdahoNez PerceClearwaterWallowaWhitmanWalla WallaAdamsColumbiaGarfieldAsotinFranklin
IdahoIdahoIdahoIdahoIdaho
OregonWashingtonWashingtonWashingtonWashingtonWashingtonWashingtonWashington
UpriverUpriverUpriverUpriverUpriverUpriver
ReservoirReservoirReservoirReservoirReservoirReservoirDownriver
5,374,9564,591,0144,465,0782,492,018
103,768736,804
31,058,4937,226,9496,352,0123,679,2233,663,733
782,051738,569
6553
>11
33874411
7.55.77.04.80.20.2
34.65.92.12.22.31.40.5
Lower Snake River Region Totals 71,264,669 75 74.1
Total LSR Bushels 95,177,430
Total Costs $25,000,000
Source: Portland District Model, 1999
Predecisional DocumentationFor Information Purposes Only - Not For Comment
Predecisional DocumentationFor Information Purposes Only - Not For Comment
The five counties from the study area that ship the largest quantities of grain on thelower Snake River are also those that would be most affected by the increasedcosts. Latah, Idaho, and Lewis counties in Idaho and Whitman and Walla Wallacounties in Washington would see over 60 percent of the total cost increase.Whitman County alone would incur approximately 34.6 percent of the total cost.
Additionally, the reservoir subregion would incur a disproportional amount of totalincreased costs, approximately 48.5 percent, while the upriver subregion wouldaccount for approximately 25 percent of the total increase. Counties located outsidethe lower Snake River subregion in Washington, Idaho, North Dakota, and Montanawould share the remaining 24 percent of the increase in total grain transportationcosts.
3.3.5 County and Farm Level Impacts
Key Assumptions for Farm-Related Socioeconomic Impacts
Knowing geographically who will be affected is the first step to determining howlarge those effects will be for individual farmers. Five key uncertainties makeforecasting the actual future impact on individual farms, farm regions, counties, andrural farm communities difficult to determine. First, the future of the farm programdeficiency payments which, under the Freedom to Farm Act, are scheduled to bephased out by 2001 but may be extended. Second, international market conditionsand future prices received for export agricultural products vary greatly from year toyear. Third, the fixed and variable costs of farming have increased over time andmay continue to do so while at the same time new crops and rotations are beingintroduced into the region. Fourth, technological advances in crop production andseasonal variations in rainfall make forecasting average yields over time difficult formore than one year in advance. Finally, the actual magnitude of total transportationcost increases, including pricing adjustments by alternative modes of transportationin the absence of barge transportation, are unknown at this time. For the purpose ofthis assessment it is assumed that yields remain constant at 1996 averages, whitewinter wheat remains the dominant profitable crop in the region, prices received overthe past ten years will remain on average stable, costs of production remain stable,the farm program will be phased out by 2001, and that costs differences betweenexisting transportation and future transportation will not be subject to marketadjustments.
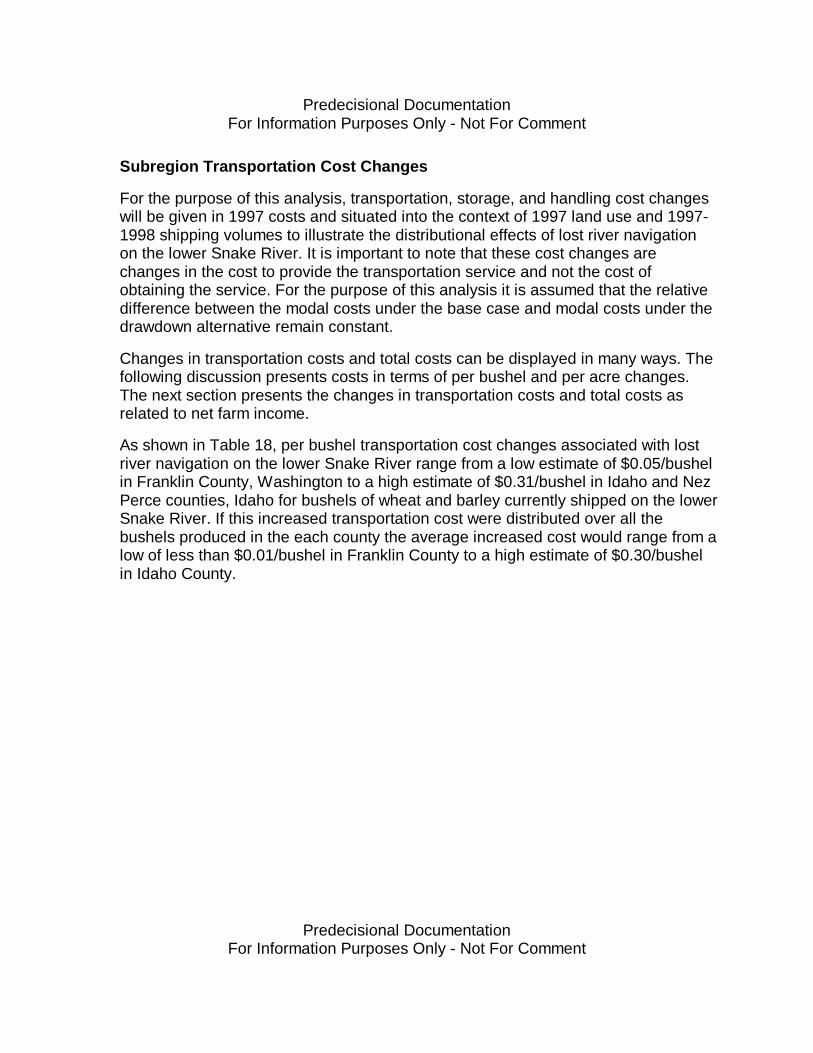
Predecisional DocumentationFor Information Purposes Only - Not For Comment
Predecisional DocumentationFor Information Purposes Only - Not For Comment
Subregion Transportation Cost Changes
For the purpose of this analysis, transportation, storage, and handling cost changeswill be given in 1997 costs and situated into the context of 1997 land use and 1997-1998 shipping volumes to illustrate the distributional effects of lost river navigationon the lower Snake River. It is important to note that these cost changes arechanges in the cost to provide the transportation service and not the cost ofobtaining the service. For the purpose of this analysis it is assumed that the relativedifference between the modal costs under the base case and modal costs under thedrawdown alternative remain constant.
Changes in transportation costs and total costs can be displayed in many ways. Thefollowing discussion presents costs in terms of per bushel and per acre changes.The next section presents the changes in transportation costs and total costs asrelated to net farm income.
As shown in Table 18, per bushel transportation cost changes associated with lostriver navigation on the lower Snake River range from a low estimate of $0.05/bushelin Franklin County, Washington to a high estimate of $0.31/bushel in Idaho and NezPerce counties, Idaho for bushels of wheat and barley currently shipped on the lowerSnake River. If this increased transportation cost were distributed over all thebushels produced in the each county the average increased cost would range from alow of less than $0.01/bushel in Franklin County to a high estimate of $0.30/bushelin Idaho County.
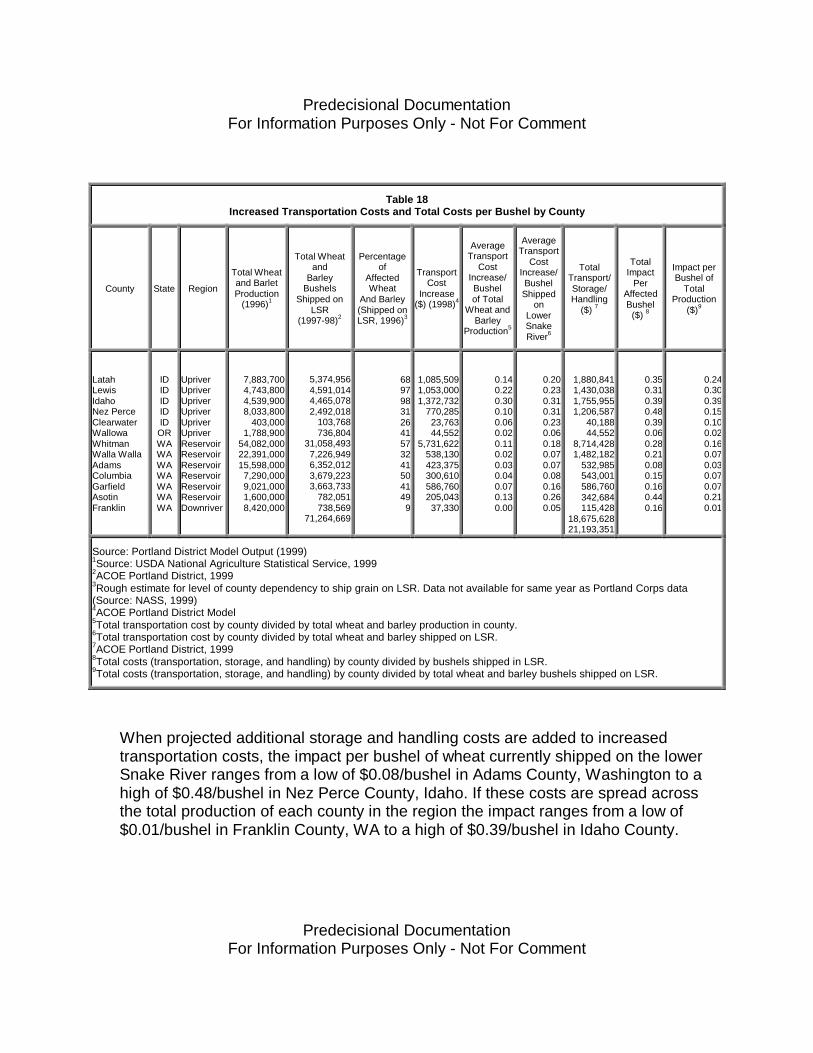
Predecisional DocumentationFor Information Purposes Only - Not For Comment
Predecisional DocumentationFor Information Purposes Only - Not For Comment
Table 18Increased Transportation Costs and Total Costs per Bushel by County
County State Region
Total Wheatand BarletProduction
(1996)1
Total Wheatand
BarleyBushels
Shipped onLSR
(1997-98)2
Percentageof
AffectedWheat
And Barley(Shipped onLSR, 1996)3
TransportCost
Increase($) (1998)4
AverageTransport
CostIncrease/Bushelof Total
Wheat andBarley
Production5
AverageTransport
CostIncrease/BushelShipped
onLowerSnakeRiver6
TotalTransport/Storage/Handling
($) 7
TotalImpact
PerAffectedBushel
($) 8
Impact perBushel of
TotalProduction
($)9
LatahLewisIdahoNez PerceClearwaterWallowaWhitmanWalla WallaAdamsColumbiaGarfieldAsotinFranklin
IDIDIDIDIDORWAWAWAWAWAWAWA
UpriverUpriverUpriverUpriverUpriverUpriverReservoirReservoirReservoirReservoirReservoirReservoirDownriver
7,883,7004,743,8004,539,9008,033,800
403,0001,788,900
54,082,00022,391,00015,598,0007,290,0009,021,0001,600,0008,420,000
5,374,9564,591,0144,465,0782,492,018
103,768736,804
31,058,4937,226,9496,352,0123,679,2233,663,733
782,051738,569
71,264,669
6897983126415732415041499
1,085,5091,053,0001,372,732
770,28523,76344,552
5,731,622538,130423,375300,610586,760205,04337,330
0.140.220.300.100.060.020.110.020.030.040.070.130.00
0.200.230.310.310.230.060.180.070.070.080.160.260.05
1,880,8411,430,0381,755,9551,206,587
40,18844,552
8,714,4281,482,182
532,985543,001586,760342,684115,428
18,675,62821,193,351
0.350.310.390.480.390.060.280.210.080.150.160.440.16
0.240.300.390.150.100.020.160.070.030.070.070.210.01
Source: Portland District Model Output (1999)1Source: USDA National Agriculture Statistical Service, 19992ACOE Portland District, 19993Rough estimate for level of county dependency to ship grain on LSR. Data not available for same year as Portland Corps data(Source: NASS, 1999)4ACOE Portland District Model5Total transportation cost by county divided by total wheat and barley production in county.6Total transportation cost by county divided by total wheat and barley shipped on LSR.7ACOE Portland District, 19998Total costs (transportation, storage, and handling) by county divided by bushels shipped in LSR.9Total costs (transportation, storage, and handling) by county divided by total wheat and barley bushels shipped on LSR.
When projected additional storage and handling costs are added to increasedtransportation costs, the impact per bushel of wheat currently shipped on the lowerSnake River ranges from a low of $0.08/bushel in Adams County, Washington to ahigh of $0.48/bushel in Nez Perce County, Idaho. If these costs are spread acrossthe total production of each county in the region the impact ranges from a low of$0.01/bushel in Franklin County, WA to a high of $0.39/bushel in Idaho County.
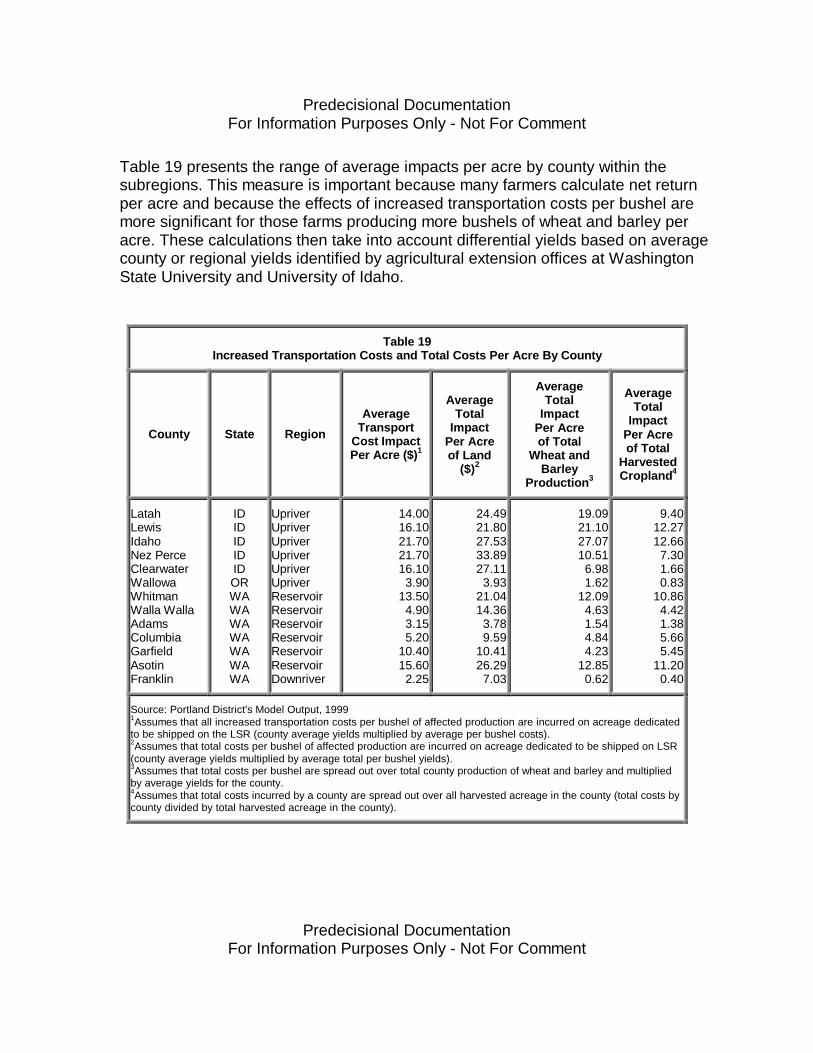
Predecisional DocumentationFor Information Purposes Only - Not For Comment
Predecisional DocumentationFor Information Purposes Only - Not For Comment
Table 19 presents the range of average impacts per acre by county within thesubregions. This measure is important because many farmers calculate net returnper acre and because the effects of increased transportation costs per bushel aremore significant for those farms producing more bushels of wheat and barley peracre. These calculations then take into account differential yields based on averagecounty or regional yields identified by agricultural extension offices at WashingtonState University and University of Idaho.
Table 19Increased Transportation Costs and Total Costs Per Acre By County
County State Region
AverageTransport
Cost ImpactPer Acre ($)1
AverageTotal
ImpactPer Acreof Land
($)2
AverageTotal
ImpactPer Acreof Total
Wheat andBarley
Production3
AverageTotal
ImpactPer Acreof Total
HarvestedCropland4
LatahLewisIdahoNez PerceClearwaterWallowaWhitmanWalla WallaAdamsColumbiaGarfieldAsotinFranklin
IDIDIDIDIDORWAWAWAWAWAWAWA
UpriverUpriverUpriverUpriverUpriverUpriverReservoirReservoirReservoirReservoirReservoirReservoirDownriver
14.0016.1021.7021.7016.103.90
13.504.903.155.20
10.4015.602.25
24.4921.8027.5333.8927.113.93
21.0414.363.789.59
10.4126.297.03
19.0921.1027.0710.516.981.62
12.094.631.544.844.23
12.850.62
9.4012.2712.667.301.660.83
10.864.421.385.665.45
11.200.40
Source: Portland District's Model Output, 19991Assumes that all increased transportation costs per bushel of affected production are incurred on acreage dedicatedto be shipped on the LSR (county average yields multiplied by average per bushel costs).2Assumes that total costs per bushel of affected production are incurred on acreage dedicated to be shipped on LSR(county average yields multiplied by average total per bushel yields).3Assumes that total costs per bushel are spread out over total county production of wheat and barley and multipliedby average yields for the county.4Assumes that total costs incurred by a county are spread out over all harvested acreage in the county (total costs bycounty divided by total harvested acreage in the county).
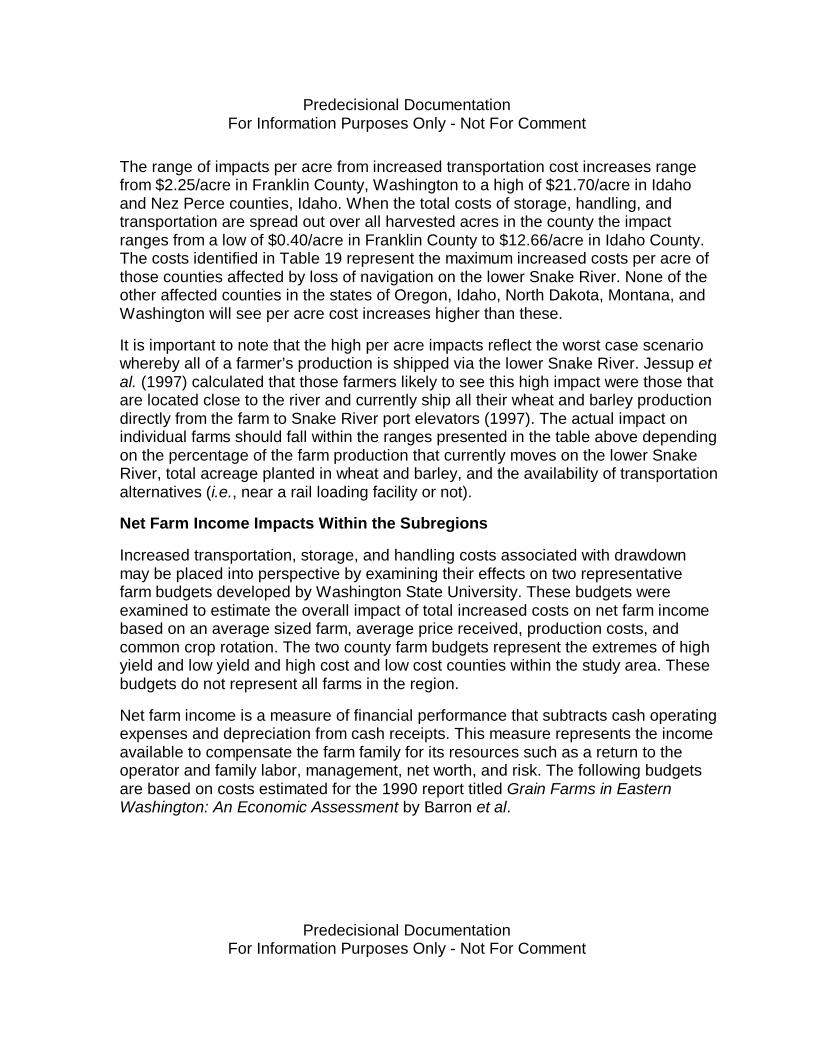
Predecisional DocumentationFor Information Purposes Only - Not For Comment
Predecisional DocumentationFor Information Purposes Only - Not For Comment
The range of impacts per acre from increased transportation cost increases rangefrom $2.25/acre in Franklin County, Washington to a high of $21.70/acre in Idahoand Nez Perce counties, Idaho. When the total costs of storage, handling, andtransportation are spread out over all harvested acres in the county the impactranges from a low of $0.40/acre in Franklin County to $12.66/acre in Idaho County.The costs identified in Table 19 represent the maximum increased costs per acre ofthose counties affected by loss of navigation on the lower Snake River. None of theother affected counties in the states of Oregon, Idaho, North Dakota, Montana, andWashington will see per acre cost increases higher than these.
It is important to note that the high per acre impacts reflect the worst case scenariowhereby all of a farmer’s production is shipped via the lower Snake River. Jessup etal. (1997) calculated that those farmers likely to see this high impact were those thatare located close to the river and currently ship all their wheat and barley productiondirectly from the farm to Snake River port elevators (1997). The actual impact onindividual farms should fall within the ranges presented in the table above dependingon the percentage of the farm production that currently moves on the lower SnakeRiver, total acreage planted in wheat and barley, and the availability of transportationalternatives (i.e., near a rail loading facility or not).
Net Farm Income Impacts Within the Subregions
Increased transportation, storage, and handling costs associated with drawdownmay be placed into perspective by examining their effects on two representativefarm budgets developed by Washington State University. These budgets wereexamined to estimate the overall impact of total increased costs on net farm incomebased on an average sized farm, average price received, production costs, andcommon crop rotation. The two county farm budgets represent the extremes of highyield and low yield and high cost and low cost counties within the study area. Thesebudgets do not represent all farms in the region.
Net farm income is a measure of financial performance that subtracts cash operatingexpenses and depreciation from cash receipts. This measure represents the incomeavailable to compensate the farm family for its resources such as a return to theoperator and family labor, management, net worth, and risk. The following budgetsare based on costs estimated for the 1990 report titled Grain Farms in EasternWashington: An Economic Assessment by Barron et al.
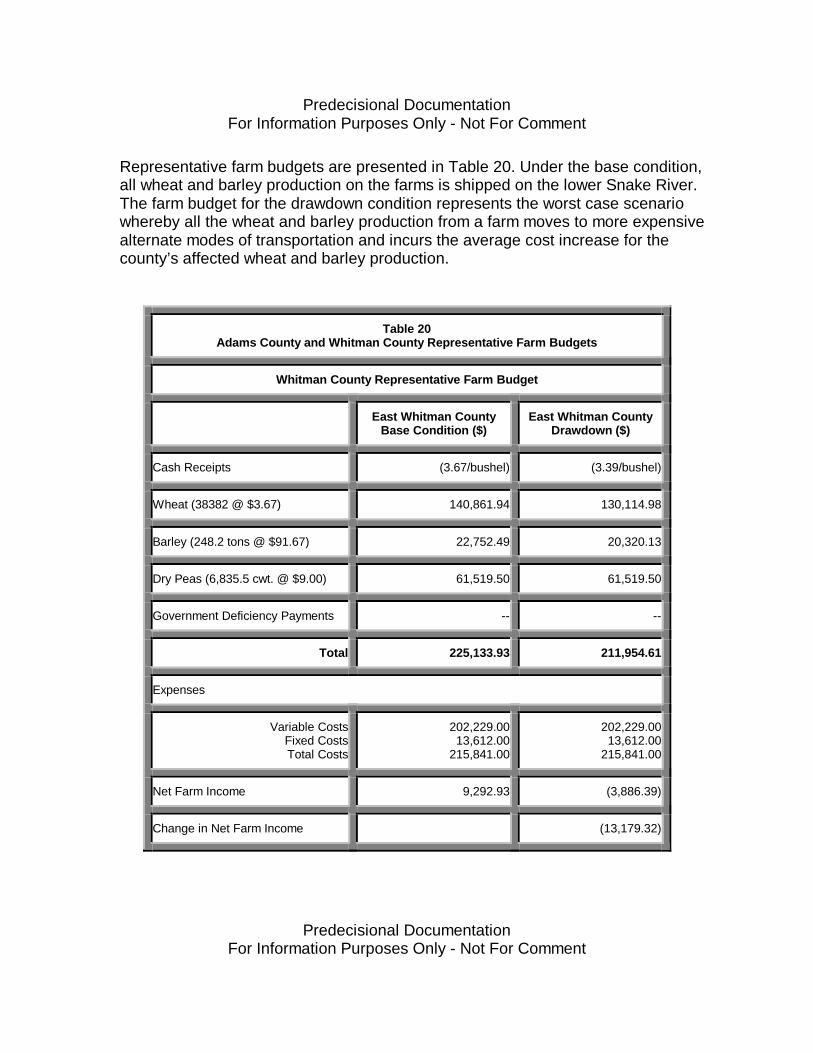
Predecisional DocumentationFor Information Purposes Only - Not For Comment
Predecisional DocumentationFor Information Purposes Only - Not For Comment
Representative farm budgets are presented in Table 20. Under the base condition,all wheat and barley production on the farms is shipped on the lower Snake River.The farm budget for the drawdown condition represents the worst case scenariowhereby all the wheat and barley production from a farm moves to more expensivealternate modes of transportation and incurs the average cost increase for thecounty’s affected wheat and barley production.
Table 20Adams County and Whitman County Representative Farm Budgets
Whitman County Representative Farm Budget
East Whitman CountyBase Condition ($)
East Whitman CountyDrawdown ($)
Cash Receipts (3.67/bushel) (3.39/bushel)
Wheat (38382 @ $3.67) 140,861.94 130,114.98
Barley (248.2 tons @ $91.67) 22,752.49 20,320.13
Dry Peas (6,835.5 cwt. @ $9.00) 61,519.50 61,519.50
Government Deficiency Payments -- --
Total 225,133.93 211,954.61
Expenses
Variable CostsFixed CostsTotal Costs
202,229.0013,612.00
215,841.00
202,229.0013,612.00
215,841.00
Net Farm Income 9,292.93 (3,886.39)
Change in Net Farm Income (13,179.32)
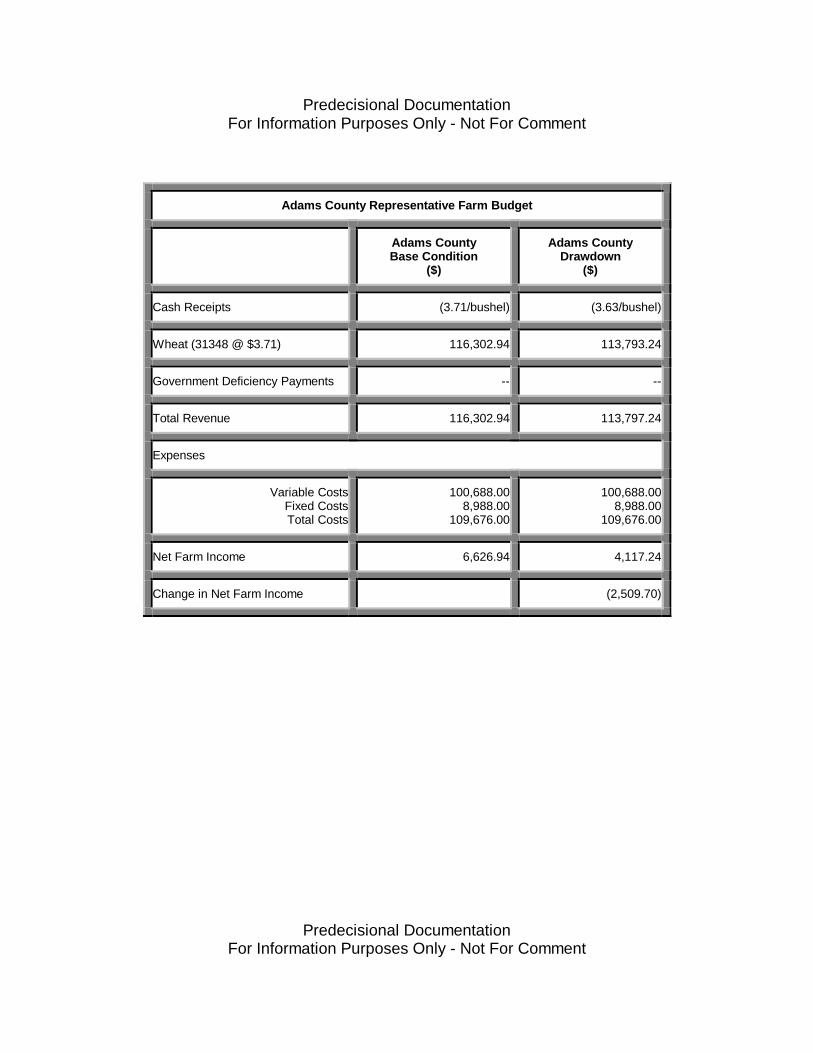
Predecisional DocumentationFor Information Purposes Only - Not For Comment
Predecisional DocumentationFor Information Purposes Only - Not For Comment
Adams County Representative Farm Budget
Adams CountyBase Condition
($)
Adams CountyDrawdown
($)
Cash Receipts (3.71/bushel) (3.63/bushel)
Wheat (31348 @ $3.71) 116,302.94 113,793.24
Government Deficiency Payments -- --
Total Revenue 116,302.94 113,797.24
Expenses
Variable CostsFixed CostsTotal Costs
100,688.008,988.00
109,676.00
100,688.008,988.00
109,676.00
Net Farm Income 6,626.94 4,117.24
Change in Net Farm Income (2,509.70)
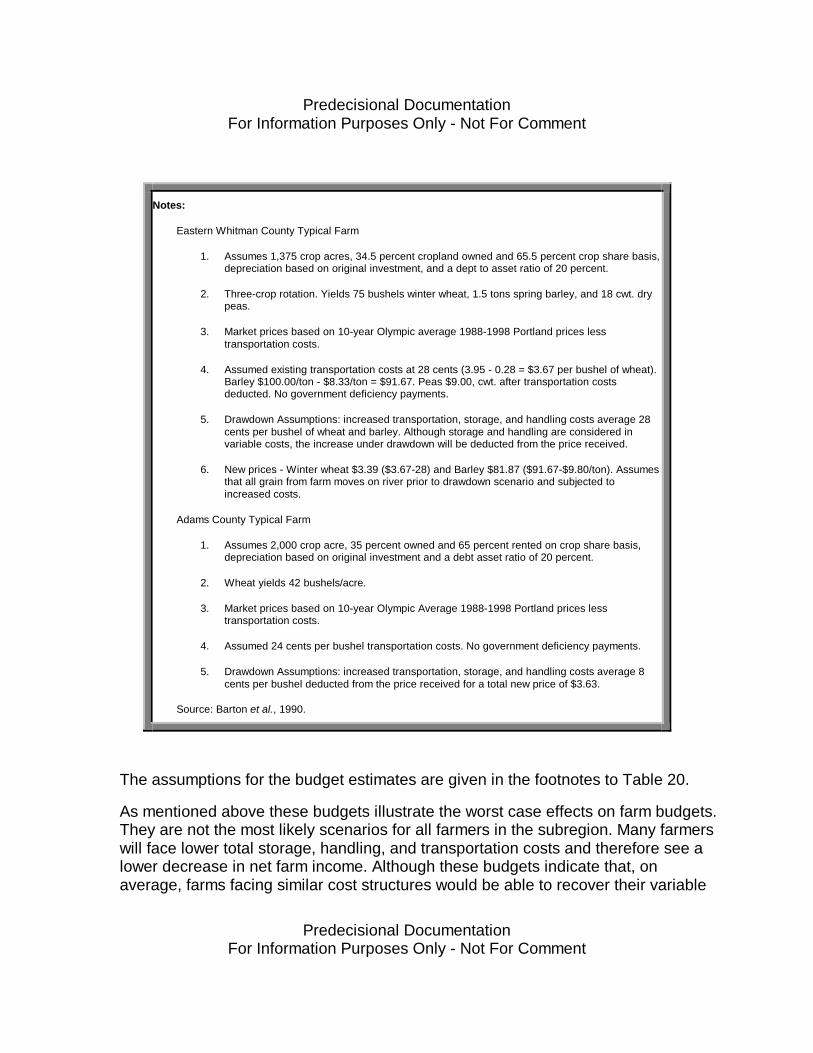
Predecisional DocumentationFor Information Purposes Only - Not For Comment
Predecisional DocumentationFor Information Purposes Only - Not For Comment
Notes:
Eastern Whitman County Typical Farm
1. Assumes 1,375 crop acres, 34.5 percent cropland owned and 65.5 percent crop share basis,depreciation based on original investment, and a dept to asset ratio of 20 percent.
2. Three-crop rotation. Yields 75 bushels winter wheat, 1.5 tons spring barley, and 18 cwt. drypeas.
3. Market prices based on 10-year Olympic average 1988-1998 Portland prices lesstransportation costs.
4. Assumed existing transportation costs at 28 cents (3.95 - 0.28 = $3.67 per bushel of wheat).Barley $100.00/ton - $8.33/ton = $91.67. Peas $9.00, cwt. after transportation costsdeducted. No government deficiency payments.
5. Drawdown Assumptions: increased transportation, storage, and handling costs average 28cents per bushel of wheat and barley. Although storage and handling are considered invariable costs, the increase under drawdown will be deducted from the price received.
6. New prices - Winter wheat $3.39 ($3.67-28) and Barley $81.87 ($91.67-$9.80/ton). Assumesthat all grain from farm moves on river prior to drawdown scenario and subjected toincreased costs.
Adams County Typical Farm
1. Assumes 2,000 crop acre, 35 percent owned and 65 percent rented on crop share basis,depreciation based on original investment and a debt asset ratio of 20 percent.
2. Wheat yields 42 bushels/acre.
3. Market prices based on 10-year Olympic Average 1988-1998 Portland prices lesstransportation costs.
4. Assumed 24 cents per bushel transportation costs. No government deficiency payments.
5. Drawdown Assumptions: increased transportation, storage, and handling costs average 8cents per bushel deducted from the price received for a total new price of $3.63.
Source: Barton et al., 1990.
The assumptions for the budget estimates are given in the footnotes to Table 20.
As mentioned above these budgets illustrate the worst case effects on farm budgets.They are not the most likely scenarios for all farmers in the subregion. Many farmerswill face lower total storage, handling, and transportation costs and therefore see alower decrease in net farm income. Although these budgets indicate that, onaverage, farms facing similar cost structures would be able to recover their variable
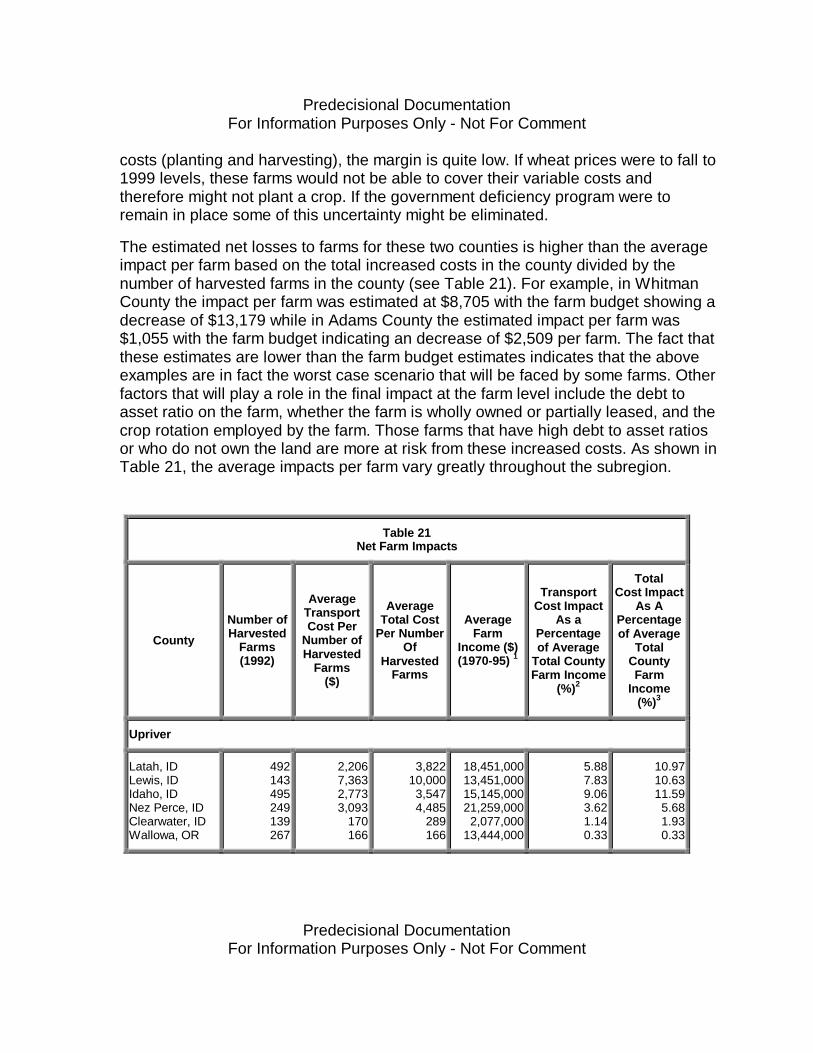
Predecisional DocumentationFor Information Purposes Only - Not For Comment
Predecisional DocumentationFor Information Purposes Only - Not For Comment
costs (planting and harvesting), the margin is quite low. If wheat prices were to fall to1999 levels, these farms would not be able to cover their variable costs andtherefore might not plant a crop. If the government deficiency program were toremain in place some of this uncertainty might be eliminated.
The estimated net losses to farms for these two counties is higher than the averageimpact per farm based on the total increased costs in the county divided by thenumber of harvested farms in the county (see Table 21). For example, in WhitmanCounty the impact per farm was estimated at $8,705 with the farm budget showing adecrease of $13,179 while in Adams County the estimated impact per farm was$1,055 with the farm budget indicating an decrease of $2,509 per farm. The fact thatthese estimates are lower than the farm budget estimates indicates that the aboveexamples are in fact the worst case scenario that will be faced by some farms. Otherfactors that will play a role in the final impact at the farm level include the debt toasset ratio on the farm, whether the farm is wholly owned or partially leased, and thecrop rotation employed by the farm. Those farms that have high debt to asset ratiosor who do not own the land are more at risk from these increased costs. As shown inTable 21, the average impacts per farm vary greatly throughout the subregion.
Table 21Net Farm Impacts
County
Number ofHarvested
Farms(1992)
AverageTransportCost Per
Number ofHarvested
Farms($)
AverageTotal Cost
Per NumberOf
HarvestedFarms
AverageFarm
Income ($)(1970-95) 1
TransportCost Impact
As aPercentageof Average
Total CountyFarm Income
(%)2
TotalCost Impact
As APercentageof Average
TotalCountyFarm
Income(%)3
Upriver
Latah, IDLewis, IDIdaho, IDNez Perce, IDClearwater, IDWallowa, OR
492143495249139267
2,2067,3632,7733,093
170166
3,82210,0003,5474,485
289166
18,451,00013,451,00015,145,00021,259,0002,077,000
13,444,000
5.887.839.063.621.140.33
10.9710.6311.595.681.930.33
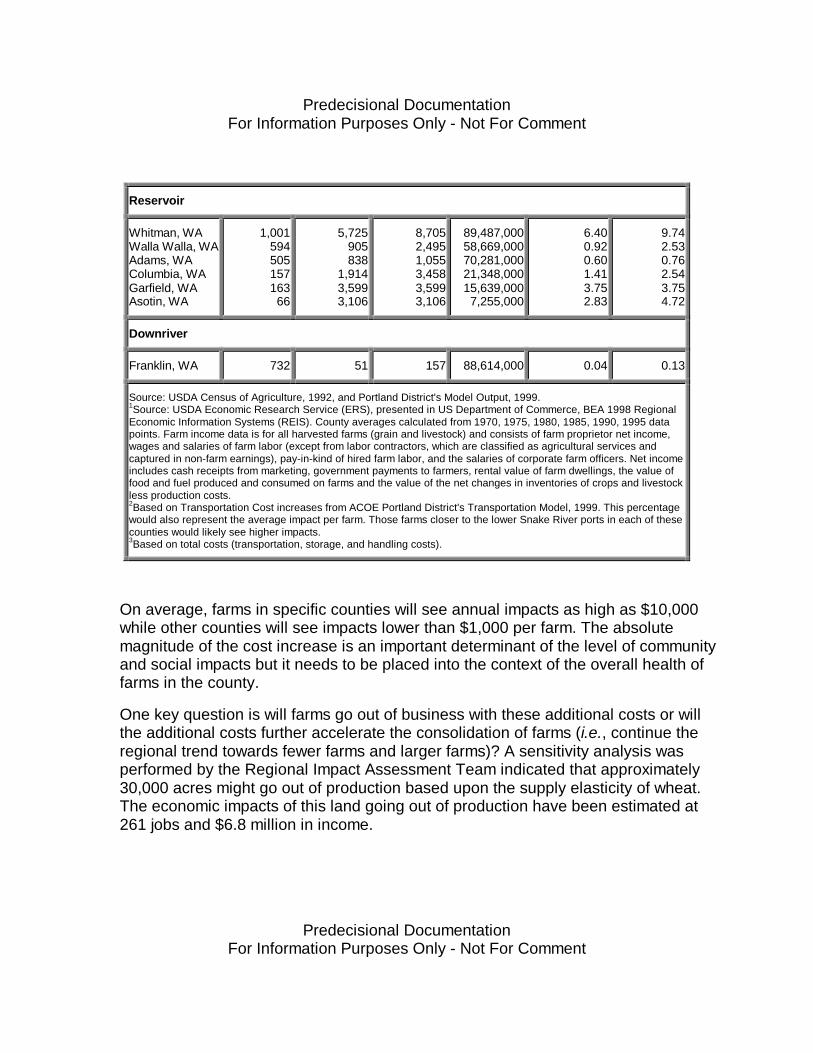
Predecisional DocumentationFor Information Purposes Only - Not For Comment
Predecisional DocumentationFor Information Purposes Only - Not For Comment
Reservoir
Whitman, WAWalla Walla, WAAdams, WAColumbia, WAGarfield, WAAsotin, WA
1,00159450515716366
5,725905838
1,9143,5993,106
8,7052,4951,0553,4583,5993,106
89,487,00058,669,00070,281,00021,348,00015,639,0007,255,000
6.400.920.601.413.752.83
9.742.530.762.543.754.72
Downriver
Franklin, WA 732 51 157 88,614,000 0.04 0.13
Source: USDA Census of Agriculture, 1992, and Portland District's Model Output, 1999.1Source: USDA Economic Research Service (ERS), presented in US Department of Commerce, BEA 1998 RegionalEconomic Information Systems (REIS). County averages calculated from 1970, 1975, 1980, 1985, 1990, 1995 datapoints. Farm income data is for all harvested farms (grain and livestock) and consists of farm proprietor net income,wages and salaries of farm labor (except from labor contractors, which are classified as agricultural services andcaptured in non-farm earnings), pay-in-kind of hired farm labor, and the salaries of corporate farm officers. Net incomeincludes cash receipts from marketing, government payments to farmers, rental value of farm dwellings, the value offood and fuel produced and consumed on farms and the value of the net changes in inventories of crops and livestockless production costs.2Based on Transportation Cost increases from ACOE Portland District's Transportation Model, 1999. This percentagewould also represent the average impact per farm. Those farms closer to the lower Snake River ports in each of thesecounties would likely see higher impacts.3Based on total costs (transportation, storage, and handling costs).
On average, farms in specific counties will see annual impacts as high as $10,000while other counties will see impacts lower than $1,000 per farm. The absolutemagnitude of the cost increase is an important determinant of the level of communityand social impacts but it needs to be placed into the context of the overall health offarms in the county.
One key question is will farms go out of business with these additional costs or willthe additional costs further accelerate the consolidation of farms (i.e., continue theregional trend towards fewer farms and larger farms)? A sensitivity analysis wasperformed by the Regional Impact Assessment Team indicated that approximately30,000 acres might go out of production based upon the supply elasticity of wheat.The economic impacts of this land going out of production have been estimated at261 jobs and $6.8 million in income.
Predecisional DocumentationFor Information Purposes Only - Not For Comment
Predecisional DocumentationFor Information Purposes Only - Not For Comment
To ground this estimate in truth, fine scale data to identify those farms mostvulnerable to total increased costs associated with drawdown are not available, thusa rough proxy of marginal (or vulnerable) farms was developed based on thepercentage of total harvested acreage of land enrolled in the Conservation ReserveProgram (CRP). The CRP is a Federal program administered through the U.S.Department of Agriculture (USDA) to temporarily remove highly erodible land fromproduction and increase the conservation of soil in return for a fixed payment peracre. The logic of this indicator is that farmers will not enroll their land in the programwhen the returns on the land are higher if the land stays in production than with thepayment for fallow cropland even if the land is highly erodible. Much of the Palouseregion that encompasses the reservoir and upriver subregions is considered to behighly erodible (Black et al., 1996). The limitation on the use of this proxy is that allthe counties are not equal in their erosion problem. It is interesting to note thatWhitman County, though having one of the highest erosion rates in the region, hasthe lowest percentage of land enrolled in the CRP program and high average yield(Black et al., 1996) (See Table 22). Conversely, Latah County has a higherenrollment rate, equal or higher average production yields, and a lower erosion ratethan Whitman County. Thus this proxy does seem to indicate that there are moremarginal farms in Latah County than in Whitman County.
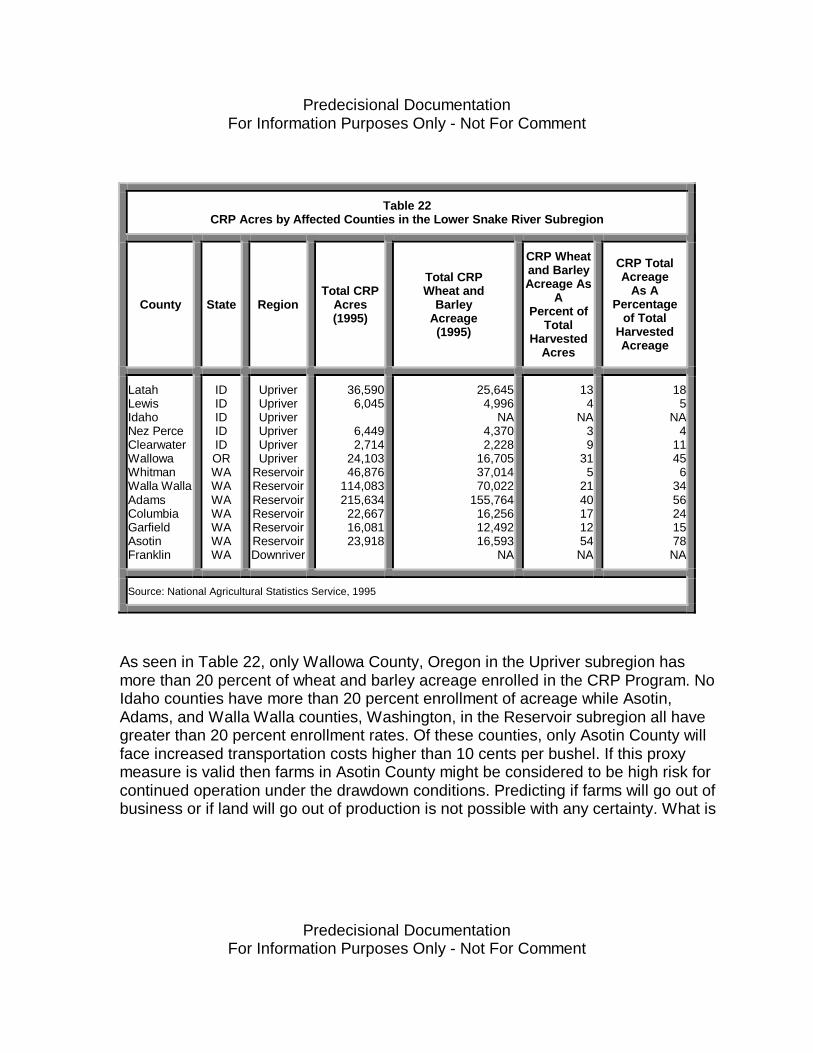
Predecisional DocumentationFor Information Purposes Only - Not For Comment
Predecisional DocumentationFor Information Purposes Only - Not For Comment
Table 22CRP Acres by Affected Counties in the Lower Snake River Subregion
County State RegionTotal CRP
Acres(1995)
Total CRPWheat and
BarleyAcreage(1995)
CRP Wheatand BarleyAcreage As
APercent of
TotalHarvested
Acres
CRP TotalAcreage
As APercentage
of TotalHarvestedAcreage
LatahLewisIdahoNez PerceClearwaterWallowaWhitmanWalla WallaAdamsColumbiaGarfieldAsotinFranklin
IDIDIDIDIDORWAWAWAWAWAWAWA
UpriverUpriverUpriverUpriverUpriverUpriver
ReservoirReservoirReservoirReservoirReservoirReservoirDownriver
36,5906,045
6,4492,714
24,10346,876
114,083215,63422,66716,08123,918
25,6454,996
NA4,3702,228
16,70537,01470,022
155,76416,25612,49216,593
NA
134
NA39
315
2140171254NA
185
NA4
11456
3456241578NA
Source: National Agricultural Statistics Service, 1995
As seen in Table 22, only Wallowa County, Oregon in the Upriver subregion hasmore than 20 percent of wheat and barley acreage enrolled in the CRP Program. NoIdaho counties have more than 20 percent enrollment of acreage while Asotin,Adams, and Walla Walla counties, Washington, in the Reservoir subregion all havegreater than 20 percent enrollment rates. Of these counties, only Asotin County willface increased transportation costs higher than 10 cents per bushel. If this proxymeasure is valid then farms in Asotin County might be considered to be high risk forcontinued operation under the drawdown conditions. Predicting if farms will go out ofbusiness or if land will go out of production is not possible with any certainty. What is
Predecisional DocumentationFor Information Purposes Only - Not For Comment
Predecisional DocumentationFor Information Purposes Only - Not For Comment
possible is to identify key risk elements that will be discussed in the community levelanalysis. This community level analysis will evaluate each community and countysituation individually by comparing the total transportation cost increase with totalfarm income in the county. Additionally, farm level impacts will be compared withlocal trends in farm consolidation and rates of farm losses to explore local levelresponses to this change.
Assuming no acreage goes out of production, the regional economic study estimatedthe direct, indirect, and induced employment and income impacts of a decrease infarm income as the loss of 100 jobs and $2.331 million, respectively, in the upriversubregion. The estimated effects of decreased farm income in the reservoir regionare a loss of 139 jobs and $3.436 million in personal income. These losses ofemployment and income will be distributed to communities throughout the reservoirand upriver regions.
Since farm income is diverted away from households to transportation expenditures,employment and income losses are offset by growth in direct, indirect, and inducedeffects of increased rail and trucking activity. The estimated effects in the reservoirregion are a gain of 294 jobs and $7.839 million in personal income. The estimatedeffects in the upriver region are a gain of 181 jobs and $5.149 million in personalincome. It is assumed that these gains will be distributed in the regional trade centercommunities and along the new trade routes. The net effects of a decrease in netfarm income and increased expenditures on rail and truck transportation are positivefor the upriver and reservoir subregions. The upriver subregion is expected to gain81 jobs and $2.818 million in personal income while the reservoir region will gain155 jobs and an increase in personal income of $4.403 million (AEI, 1999).
The net social effect will be a loss of service jobs in remote and isolatedcommunities while communities on the major trade routes US 12 and US 26 will gainemployment and income (AEI, 1999).
Uncertainty of Transportation System Capacity
Another factor affecting farmers and farm communities in the region is theuncertainty of the alternative transportation modes ability to handle the current grainproduction. The Portland District’s study indicates that export loading facilities shouldbe able to handle the volume of grain movements but there are shortages incapacity at the existing Columbia River elevators. An additional uncertainty is howmuch new volume can be absorbed by the existing rail system. The Corps estimatesthat an additional 27 million bushels of grain will need to be moved by rail. The short-term ability of the rails to respond to this increased demand for services is unknown
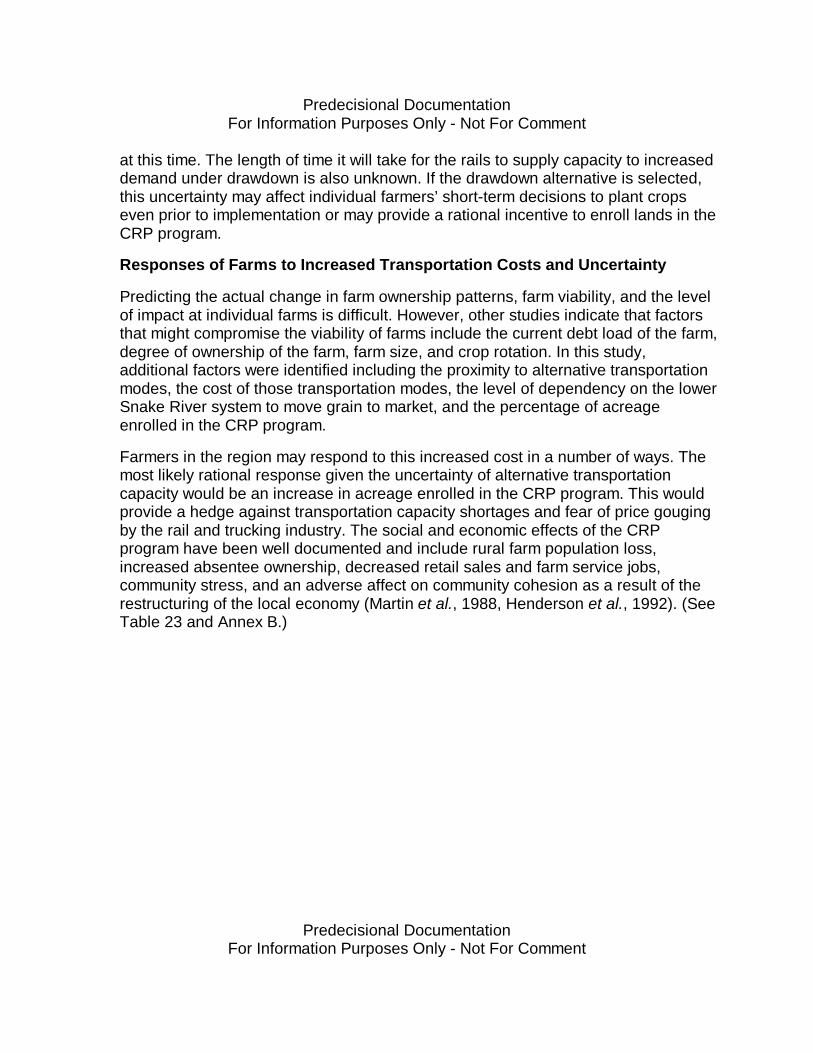
Predecisional DocumentationFor Information Purposes Only - Not For Comment
Predecisional DocumentationFor Information Purposes Only - Not For Comment
at this time. The length of time it will take for the rails to supply capacity to increaseddemand under drawdown is also unknown. If the drawdown alternative is selected,this uncertainty may affect individual farmers’ short-term decisions to plant cropseven prior to implementation or may provide a rational incentive to enroll lands in theCRP program.
Responses of Farms to Increased Transportation Costs and Uncertainty
Predicting the actual change in farm ownership patterns, farm viability, and the levelof impact at individual farms is difficult. However, other studies indicate that factorsthat might compromise the viability of farms include the current debt load of the farm,degree of ownership of the farm, farm size, and crop rotation. In this study,additional factors were identified including the proximity to alternative transportationmodes, the cost of those transportation modes, the level of dependency on the lowerSnake River system to move grain to market, and the percentage of acreageenrolled in the CRP program.
Farmers in the region may respond to this increased cost in a number of ways. Themost likely rational response given the uncertainty of alternative transportationcapacity would be an increase in acreage enrolled in the CRP program. This wouldprovide a hedge against transportation capacity shortages and fear of price gougingby the rail and trucking industry. The social and economic effects of the CRPprogram have been well documented and include rural farm population loss,increased absentee ownership, decreased retail sales and farm service jobs,community stress, and an adverse affect on community cohesion as a result of therestructuring of the local economy (Martin et al., 1988, Henderson et al., 1992). (SeeTable 23 and Annex B.)
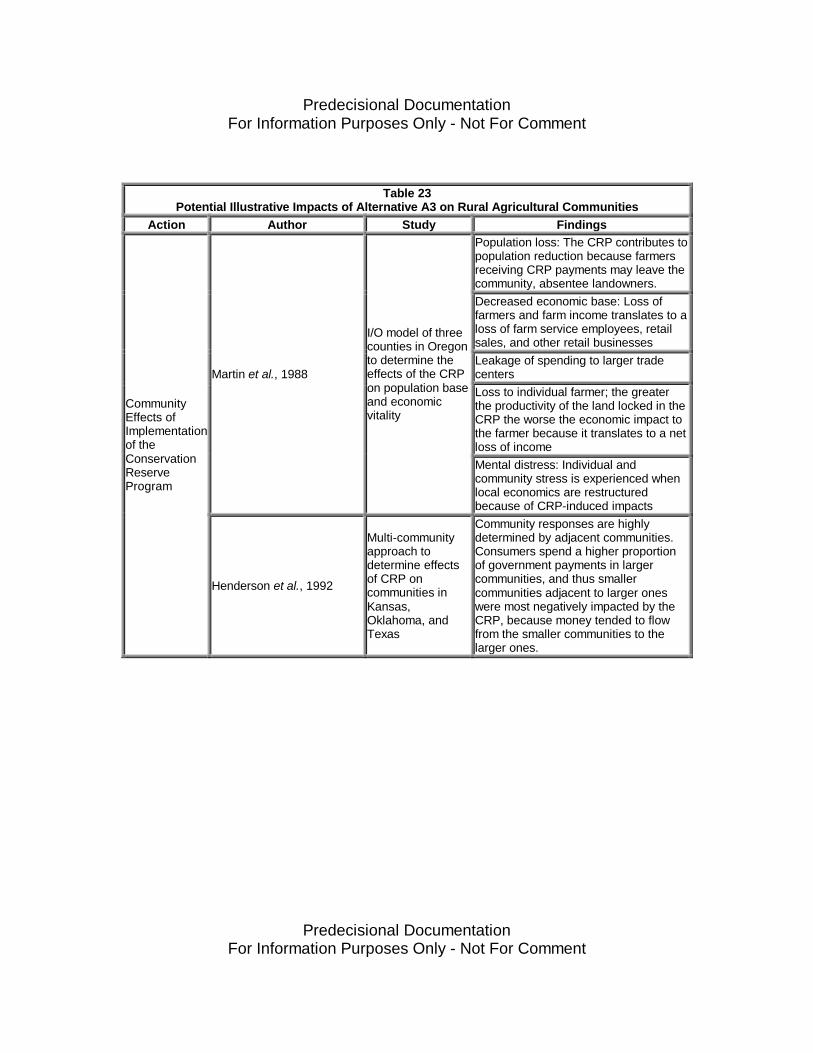
Predecisional DocumentationFor Information Purposes Only - Not For Comment
Predecisional DocumentationFor Information Purposes Only - Not For Comment
Table 23Potential Illustrative Impacts of Alternative A3 on Rural Agricultural Communities
Action Author Study FindingsPopulation loss: The CRP contributes topopulation reduction because farmersreceiving CRP payments may leave thecommunity, absentee landowners.Decreased economic base: Loss offarmers and farm income translates to aloss of farm service employees, retailsales, and other retail businessesLeakage of spending to larger tradecentersLoss to individual farmer; the greaterthe productivity of the land locked in theCRP the worse the economic impact tothe farmer because it translates to a netloss of income
Martin et al., 1988
I/O model of threecounties in Oregonto determine theeffects of the CRPon population baseand economicvitality
Mental distress: Individual andcommunity stress is experienced whenlocal economics are restructuredbecause of CRP-induced impacts
CommunityEffects ofImplementationof theConservationReserveProgram
Henderson et al., 1992
Multi-communityapproach todetermine effectsof CRP oncommunities inKansas,Oklahoma, andTexas
Community responses are highlydetermined by adjacent communities.Consumers spend a higher proportionof government payments in largercommunities, and thus smallercommunities adjacent to larger oneswere most negatively impacted by theCRP, because money tended to flowfrom the smaller communities to thelarger ones.
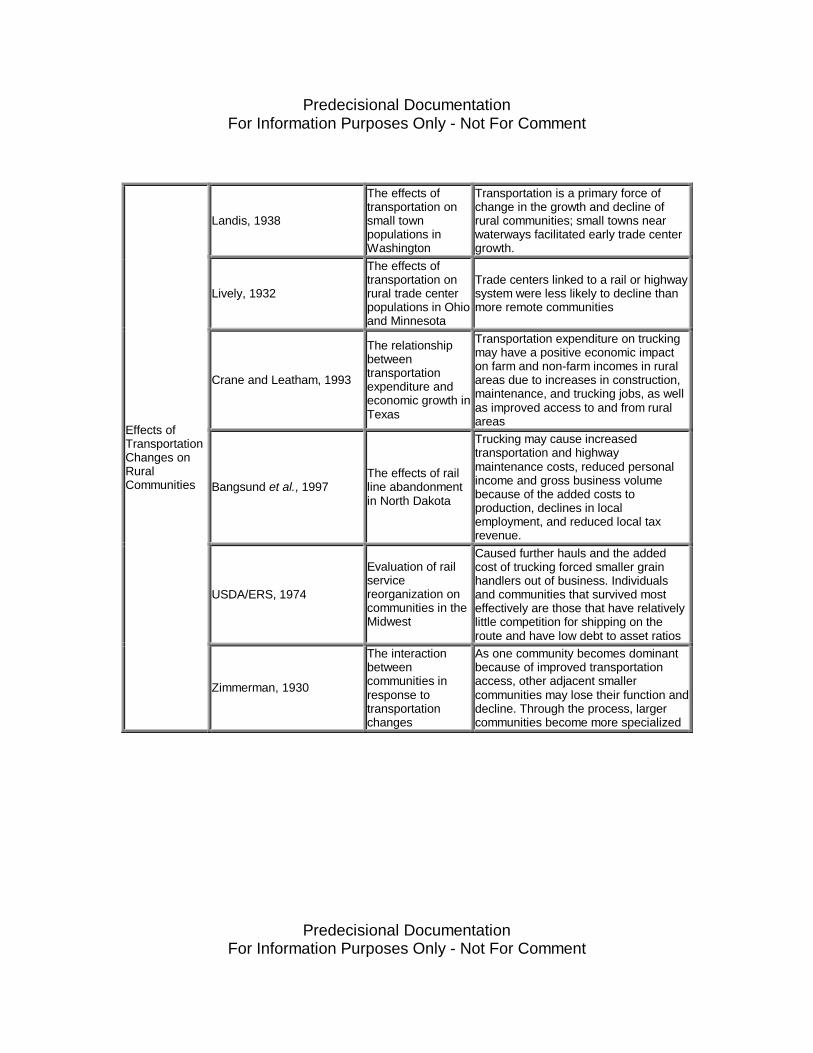
Predecisional DocumentationFor Information Purposes Only - Not For Comment
Predecisional DocumentationFor Information Purposes Only - Not For Comment
Landis, 1938
The effects oftransportation onsmall townpopulations inWashington
Transportation is a primary force ofchange in the growth and decline ofrural communities; small towns nearwaterways facilitated early trade centergrowth.
Lively, 1932
The effects oftransportation onrural trade centerpopulations in Ohioand Minnesota
Trade centers linked to a rail or highwaysystem were less likely to decline thanmore remote communities
Crane and Leatham, 1993
The relationshipbetweentransportationexpenditure andeconomic growth inTexas
Transportation expenditure on truckingmay have a positive economic impacton farm and non-farm incomes in ruralareas due to increases in construction,maintenance, and trucking jobs, as wellas improved access to and from ruralareas
Bangsund et al., 1997The effects of railline abandonmentin North Dakota
Trucking may cause increasedtransportation and highwaymaintenance costs, reduced personalincome and gross business volumebecause of the added costs toproduction, declines in localemployment, and reduced local taxrevenue.
USDA/ERS, 1974
Evaluation of railservicereorganization oncommunities in theMidwest
Caused further hauls and the addedcost of trucking forced smaller grainhandlers out of business. Individualsand communities that survived mosteffectively are those that have relativelylittle competition for shipping on theroute and have low debt to asset ratios
Effects ofTransportationChanges onRuralCommunities
Zimmerman, 1930
The interactionbetweencommunities inresponse totransportationchanges
As one community becomes dominantbecause of improved transportationaccess, other adjacent smallercommunities may lose their function anddecline. Through the process, largercommunities become more specialized
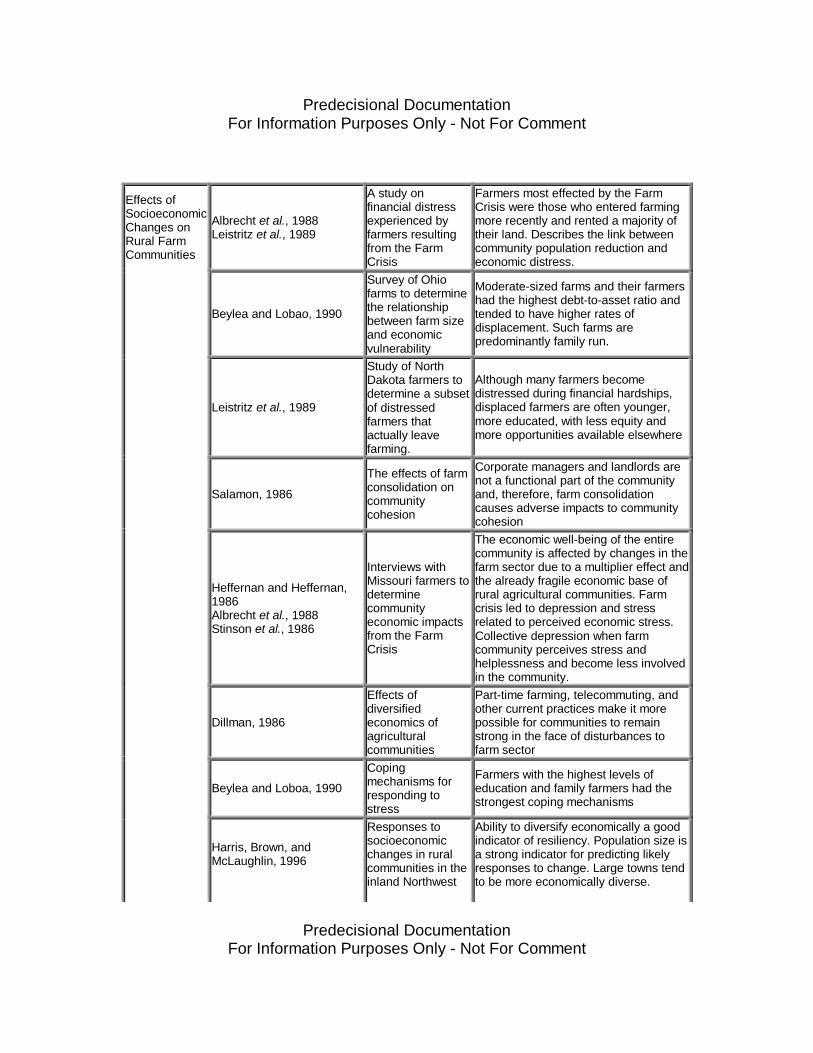
Predecisional DocumentationFor Information Purposes Only - Not For Comment
Predecisional DocumentationFor Information Purposes Only - Not For Comment
Albrecht et al., 1988Leistritz et al., 1989
A study onfinancial distressexperienced byfarmers resultingfrom the FarmCrisis
Farmers most effected by the FarmCrisis were those who entered farmingmore recently and rented a majority oftheir land. Describes the link betweencommunity population reduction andeconomic distress.
Beylea and Lobao, 1990
Survey of Ohiofarms to determinethe relationshipbetween farm sizeand economicvulnerability
Moderate-sized farms and their farmershad the highest debt-to-asset ratio andtended to have higher rates ofdisplacement. Such farms arepredominantly family run.
Leistritz et al., 1989
Study of NorthDakota farmers todetermine a subsetof distressedfarmers thatactually leavefarming.
Although many farmers becomedistressed during financial hardships,displaced farmers are often younger,more educated, with less equity andmore opportunities available elsewhere
Salamon, 1986
The effects of farmconsolidation oncommunitycohesion
Corporate managers and landlords arenot a functional part of the communityand, therefore, farm consolidationcauses adverse impacts to communitycohesion
Heffernan and Heffernan,1986Albrecht et al., 1988Stinson et al., 1986
Interviews withMissouri farmers todeterminecommunityeconomic impactsfrom the FarmCrisis
The economic well-being of the entirecommunity is affected by changes in thefarm sector due to a multiplier effect andthe already fragile economic base ofrural agricultural communities. Farmcrisis led to depression and stressrelated to perceived economic stress.Collective depression when farmcommunity perceives stress andhelplessness and become less involvedin the community.
Dillman, 1986
Effects ofdiversifiedeconomics ofagriculturalcommunities
Part-time farming, telecommuting, andother current practices make it morepossible for communities to remainstrong in the face of disturbances tofarm sector
Beylea and Loboa, 1990
Copingmechanisms forresponding tostress
Farmers with the highest levels ofeducation and family farmers had thestrongest coping mechanisms
Effects ofSocioeconomicChanges onRural FarmCommunities
Harris, Brown, andMcLaughlin, 1996
Responses tosocioeconomicchanges in ruralcommunities in theinland Northwest
Ability to diversify economically a goodindicator of resiliency. Population size isa strong indicator for predicting likelyresponses to change. Large towns tendto be more economically diverse.
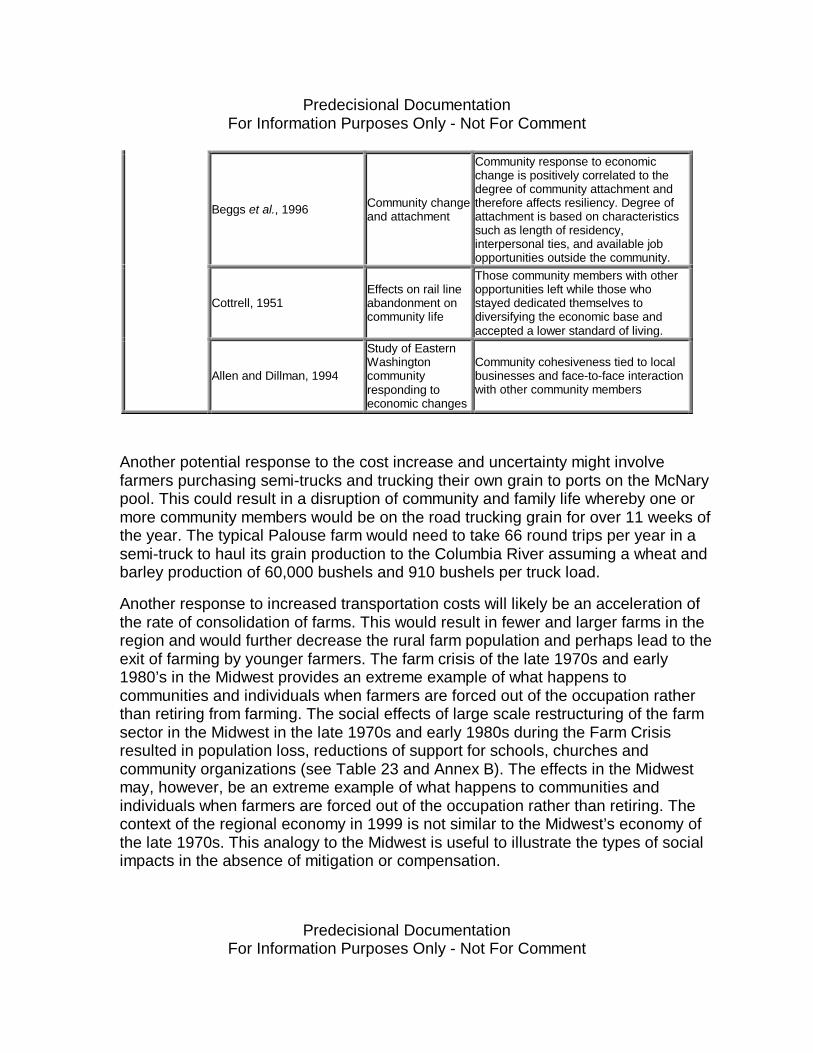
Predecisional DocumentationFor Information Purposes Only - Not For Comment
Predecisional DocumentationFor Information Purposes Only - Not For Comment
Beggs et al., 1996 Community changeand attachment
Community response to economicchange is positively correlated to thedegree of community attachment andtherefore affects resiliency. Degree ofattachment is based on characteristicssuch as length of residency,interpersonal ties, and available jobopportunities outside the community.
Cottrell, 1951Effects on rail lineabandonment oncommunity life
Those community members with otheropportunities left while those whostayed dedicated themselves todiversifying the economic base andaccepted a lower standard of living.
Allen and Dillman, 1994
Study of EasternWashingtoncommunityresponding toeconomic changes
Community cohesiveness tied to localbusinesses and face-to-face interactionwith other community members
Another potential response to the cost increase and uncertainty might involvefarmers purchasing semi-trucks and trucking their own grain to ports on the McNarypool. This could result in a disruption of community and family life whereby one ormore community members would be on the road trucking grain for over 11 weeks ofthe year. The typical Palouse farm would need to take 66 round trips per year in asemi-truck to haul its grain production to the Columbia River assuming a wheat andbarley production of 60,000 bushels and 910 bushels per truck load.
Another response to increased transportation costs will likely be an acceleration ofthe rate of consolidation of farms. This would result in fewer and larger farms in theregion and would further decrease the rural farm population and perhaps lead to theexit of farming by younger farmers. The farm crisis of the late 1970s and early1980’s in the Midwest provides an extreme example of what happens tocommunities and individuals when farmers are forced out of the occupation ratherthan retiring from farming. The social effects of large scale restructuring of the farmsector in the Midwest in the late 1970s and early 1980s during the Farm Crisisresulted in population loss, reductions of support for schools, churches andcommunity organizations (see Table 23 and Annex B). The effects in the Midwestmay, however, be an extreme example of what happens to communities andindividuals when farmers are forced out of the occupation rather than retiring. Thecontext of the regional economy in 1999 is not similar to the Midwest’s economy ofthe late 1970s. This analogy to the Midwest is useful to illustrate the types of socialimpacts in the absence of mitigation or compensation.
Predecisional DocumentationFor Information Purposes Only - Not For Comment
Predecisional DocumentationFor Information Purposes Only - Not For Comment
Finally, farmers who are attached to the way of life may continue to farm but berequired to take on additional off-farm employment. In the context of EasternWashington, Dillman (1986), for example, found that part-time farming has increasednon-farm incomes, thus communities as a result have become more economicallydiverse and stable (see Table 23 and Annex B).
3.3.6 Decreased Farm Value and County Property Tax Revenue
Another negative effect of decreased net farm incomes is the secondary effect onlocal county property tax revenues. For the purpose of county tax assessment,agricultural property value per acre is based on the land’s proven yield (bu/ac.) timesa 5-year average price received for the commodity amortized over a 5-year periodand taxed at 1.45 percent.
Whitman County serves as an illustration of the local tax impacts of implementingA3. Table 24 provides a point estimate for the county given current conditions andtax rates. Table 24 is pending review by Whitman County tax assessor.
Table 24Pending Review by Whitman County Tax Assessor.
There may be two potential responses to this tax revenue shortfall. Counties couldraise tax levies on open space. This is unlikely given the high levels of currenttaxation. Alternatively, given constraints on increasing tax rates, county expenditurescould be decreased in order to maintain a balanced budget.
A potential offset to this decreased tax revenue may be the decrease inexpenditures for county roads. According to Jessup and Casavant (1998) many ofthese county roads that currently serve as thoroughfares to ports on the lower SnakeRiver will require less maintenance and repairs as traffic is diverted away from theriver and onto state highways. The impact to county roads has not been quantifiedby the Corps’ Navigation team or by the Washington State Legislative TransportationCommittee. An additional offset of lost property tax revenue may be the increase insales tax revenue due to increased transportation activity (trucking and rail) andoverall related sales.
3.3.7 Effects on Other Shippers
Predecisional DocumentationFor Information Purposes Only - Not For Comment
Predecisional DocumentationFor Information Purposes Only - Not For Comment
3.3.8 Effects on Cruise Ships
Cruise ships currently move from Portland to Clarkston. Travelers disembark andengage in various local activities including tours to the Nez Perce Reservation andjet boat excursions to Hells canyon. The regional study estimated that the direct,indirect, and induced effects spending by these visitors in the Lewiston-Clarkstonregion are approximately 21 jobs and 2 million in retail sales. Assuming that thesecruise ships continue to travel on the Columbia River, these jobs and spending maybe gained in the Downriver Subregion.
3.3.9 Traffic Congestion and Safety
The loss of barging on the lower Snake River will displace grain and othercommodity movements to rail and trucking. This displacement will take placeimmediately during the drawdown implementation. Increased traffic and congestionwill affect local community mobility and will create adverse safety conditions on themajor alternative transportation corridors.
Traffic Congestion on Major Alternative Transportation Corridors
Two traffic flow estimates are presented to identify the range of potential congestionimpacts. The first estimate was produced by HDR Engineering, Inc. (HDR) for theWashington State Legislative Transportation Committee utilizing modified EasternWashington Intermodal Transportation Study (EWITS) models (HDR, 1999). Theirestimates of traffic flows are based on the worst case highway assumption that allthe displaced grain from the lower Snake River moves by truck and railroads do nothaul any of the additional volume. The HDR study also assumes that all grainshipments arriving in Lewiston from southern Idaho continue to move to Lewiston.Additionally, the HDR study assumes that all other commodity movements out of thePort of Lewiston move by way of US Highway 12 into Washington State and to theMcNary Pool ports.
The second estimate was derived from the Portland District’s Transportation Model.The Portland District’s model of grain movement, in contrast, eliminatesapproximately 5 million bushels of wheat and barley that currently move throughLewiston from southern Idaho and diverts it to alternate modes of transportation insouthern Idaho. Additionally, the Corps model assumes that approximately 10.3million bushels of wheat and barley production from Idaho and 12.1 million bushelsfrom Washington move by rail to Portland.
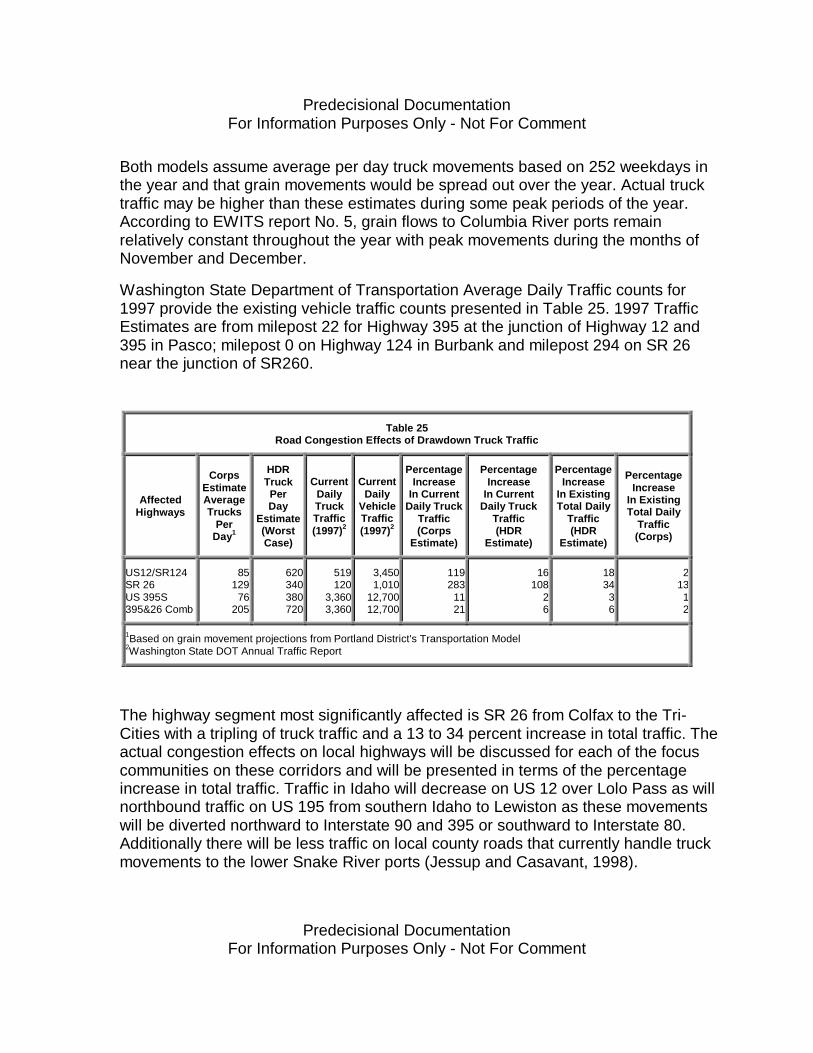
Predecisional DocumentationFor Information Purposes Only - Not For Comment
Predecisional DocumentationFor Information Purposes Only - Not For Comment
Both models assume average per day truck movements based on 252 weekdays inthe year and that grain movements would be spread out over the year. Actual trucktraffic may be higher than these estimates during some peak periods of the year.According to EWITS report No. 5, grain flows to Columbia River ports remainrelatively constant throughout the year with peak movements during the months ofNovember and December.
Washington State Department of Transportation Average Daily Traffic counts for1997 provide the existing vehicle traffic counts presented in Table 25. 1997 TrafficEstimates are from milepost 22 for Highway 395 at the junction of Highway 12 and395 in Pasco; milepost 0 on Highway 124 in Burbank and milepost 294 on SR 26near the junction of SR260.
Table 25Road Congestion Effects of Drawdown Truck Traffic
AffectedHighways
CorpsEstimateAverageTrucks
PerDay1
HDRTruckPerDay
Estimate(WorstCase)
CurrentDailyTruckTraffic(1997)2
CurrentDaily
VehicleTraffic(1997)2
PercentageIncrease
In CurrentDaily Truck
Traffic(Corps
Estimate)
PercentageIncrease
In CurrentDaily Truck
Traffic(HDR
Estimate)
PercentageIncrease
In ExistingTotal Daily
Traffic(HDR
Estimate)
PercentageIncrease
In ExistingTotal Daily
Traffic(Corps)
US12/SR124SR 26US 395S395&26 Comb
85129
76205
620340380720
519120
3,3603,360
3,4501,010
12,70012,700
119283
1121
16108
26
183436
21312
1Based on grain movement projections from Portland District's Transportation Model2Washington State DOT Annual Traffic Report
The highway segment most significantly affected is SR 26 from Colfax to the Tri-Cities with a tripling of truck traffic and a 13 to 34 percent increase in total traffic. Theactual congestion effects on local highways will be discussed for each of the focuscommunities on these corridors and will be presented in terms of the percentageincrease in total traffic. Traffic in Idaho will decrease on US 12 over Lolo Pass as willnorthbound traffic on US 195 from southern Idaho to Lewiston as these movementswill be diverted northward to Interstate 90 and 395 or southward to Interstate 80.Additionally there will be less traffic on local county roads that currently handle truckmovements to the lower Snake River ports (Jessup and Casavant, 1998).
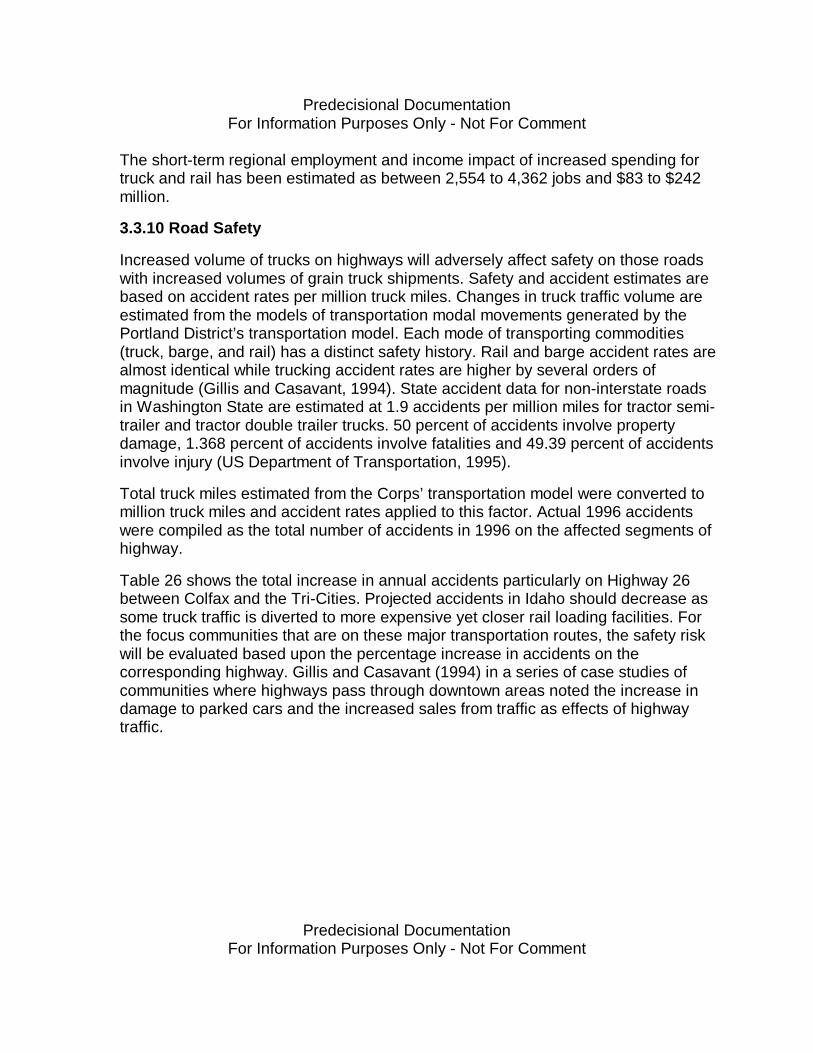
Predecisional DocumentationFor Information Purposes Only - Not For Comment
Predecisional DocumentationFor Information Purposes Only - Not For Comment
The short-term regional employment and income impact of increased spending fortruck and rail has been estimated as between 2,554 to 4,362 jobs and $83 to $242million.
3.3.10 Road Safety
Increased volume of trucks on highways will adversely affect safety on those roadswith increased volumes of grain truck shipments. Safety and accident estimates arebased on accident rates per million truck miles. Changes in truck traffic volume areestimated from the models of transportation modal movements generated by thePortland District’s transportation model. Each mode of transporting commodities(truck, barge, and rail) has a distinct safety history. Rail and barge accident rates arealmost identical while trucking accident rates are higher by several orders ofmagnitude (Gillis and Casavant, 1994). State accident data for non-interstate roadsin Washington State are estimated at 1.9 accidents per million miles for tractor semi-trailer and tractor double trailer trucks. 50 percent of accidents involve propertydamage, 1.368 percent of accidents involve fatalities and 49.39 percent of accidentsinvolve injury (US Department of Transportation, 1995).
Total truck miles estimated from the Corps’ transportation model were converted tomillion truck miles and accident rates applied to this factor. Actual 1996 accidentswere compiled as the total number of accidents in 1996 on the affected segments ofhighway.
Table 26 shows the total increase in annual accidents particularly on Highway 26between Colfax and the Tri-Cities. Projected accidents in Idaho should decrease assome truck traffic is diverted to more expensive yet closer rail loading facilities. Forthe focus communities that are on these major transportation routes, the safety riskwill be evaluated based upon the percentage increase in accidents on thecorresponding highway. Gillis and Casavant (1994) in a series of case studies ofcommunities where highways pass through downtown areas noted the increase indamage to parked cars and the increased sales from traffic as effects of highwaytraffic.
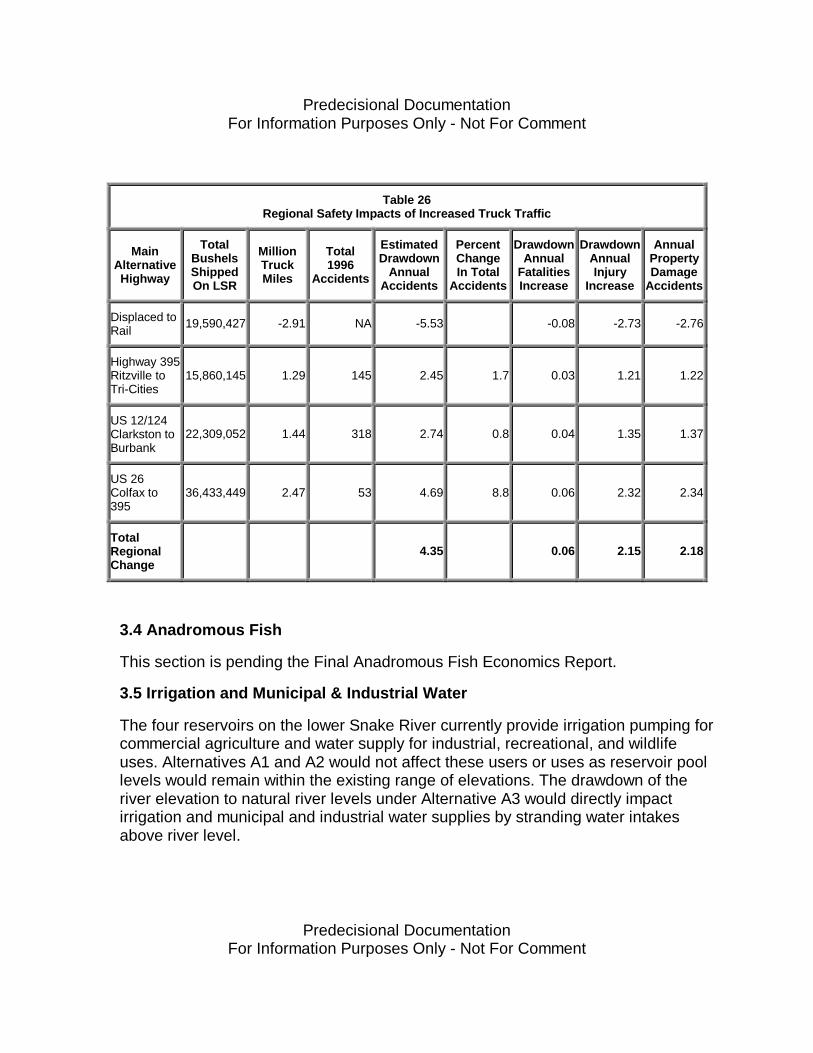
Predecisional DocumentationFor Information Purposes Only - Not For Comment
Predecisional DocumentationFor Information Purposes Only - Not For Comment
Table 26Regional Safety Impacts of Increased Truck Traffic
MainAlternativeHighway
TotalBushelsShippedOn LSR
MillionTruckMiles
Total1996
Accidents
EstimatedDrawdown
AnnualAccidents
PercentChangeIn Total
Accidents
DrawdownAnnual
FatalitiesIncrease
DrawdownAnnualInjury
Increase
AnnualPropertyDamage
Accidents
Displaced toRail 19,590,427 -2.91 NA -5.53 -0.08 -2.73 -2.76
Highway 395Ritzville toTri-Cities
15,860,145 1.29 145 2.45 1.7 0.03 1.21 1.22
US 12/124Clarkston toBurbank
22,309,052 1.44 318 2.74 0.8 0.04 1.35 1.37
US 26Colfax to395
36,433,449 2.47 53 4.69 8.8 0.06 2.32 2.34
TotalRegionalChange
4.35 0.06 2.15 2.18
3.4 Anadromous Fish
This section is pending the Final Anadromous Fish Economics Report.
3.5 Irrigation and Municipal & Industrial Water
The four reservoirs on the lower Snake River currently provide irrigation pumping forcommercial agriculture and water supply for industrial, recreational, and wildlifeuses. Alternatives A1 and A2 would not affect these users or uses as reservoir poollevels would remain within the existing range of elevations. The drawdown of theriver elevation to natural river levels under Alternative A3 would directly impactirrigation and municipal and industrial water supplies by stranding water intakesabove river level.
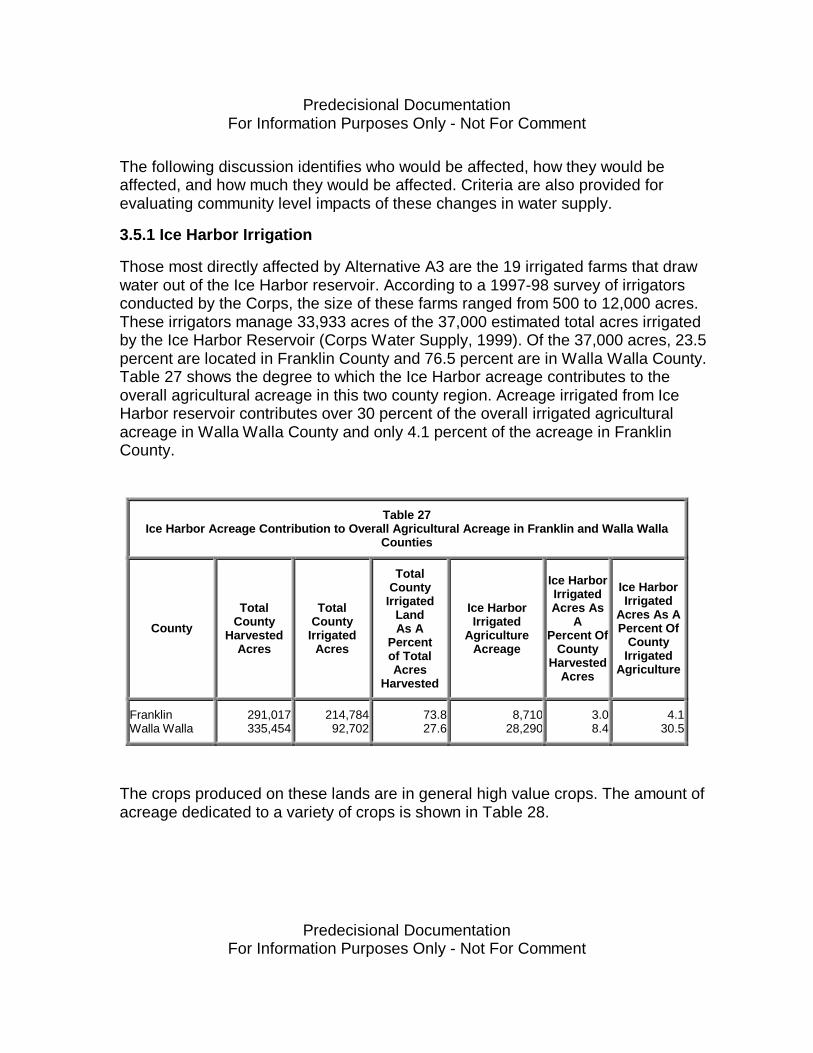
Predecisional DocumentationFor Information Purposes Only - Not For Comment
Predecisional DocumentationFor Information Purposes Only - Not For Comment
The following discussion identifies who would be affected, how they would beaffected, and how much they would be affected. Criteria are also provided forevaluating community level impacts of these changes in water supply.
3.5.1 Ice Harbor Irrigation
Those most directly affected by Alternative A3 are the 19 irrigated farms that drawwater out of the Ice Harbor reservoir. According to a 1997-98 survey of irrigatorsconducted by the Corps, the size of these farms ranged from 500 to 12,000 acres.These irrigators manage 33,933 acres of the 37,000 estimated total acres irrigatedby the Ice Harbor Reservoir (Corps Water Supply, 1999). Of the 37,000 acres, 23.5percent are located in Franklin County and 76.5 percent are in Walla Walla County.Table 27 shows the degree to which the Ice Harbor acreage contributes to theoverall agricultural acreage in this two county region. Acreage irrigated from IceHarbor reservoir contributes over 30 percent of the overall irrigated agriculturalacreage in Walla Walla County and only 4.1 percent of the acreage in FranklinCounty.
Table 27Ice Harbor Acreage Contribution to Overall Agricultural Acreage in Franklin and Walla Walla
Counties
County
TotalCounty
HarvestedAcres
TotalCounty
IrrigatedAcres
TotalCounty
IrrigatedLandAs A
Percentof TotalAcres
Harvested
Ice HarborIrrigated
AgricultureAcreage
Ice HarborIrrigatedAcres As
APercent Of
CountyHarvested
Acres
Ice HarborIrrigated
Acres As APercent Of
CountyIrrigated
Agriculture
FranklinWalla Walla
291,017335,454
214,78492,702
73.827.6
8,71028,290
3.08.4
4.130.5
The crops produced on these lands are in general high value crops. The amount ofacreage dedicated to a variety of crops is shown in Table 28.
Predecisional DocumentationFor Information Purposes Only - Not For Comment
Predecisional DocumentationFor Information Purposes Only - Not For Comment
Table 28Acreage Dedicated to Crops in Franklin and Walla Walla Counties
Crop TotalAcreage
Percent ofWalla Walla and
Franklin CountiesTotal CropProduction
Two-CountyIrrigatedAcres in
Production
CottonwoodPotatoesField CornFruit TreesWheatVineyardsSweet CornOnionsUnidentified
8,5105,5134,9954,1073,5152,2941,9981,1104,884
NA10.015.037.0
NA99.710.924.1
55,50033,40011,100
2,30018,4004,600
Employment information was obtained from 11 of the 12 farms surveyed by theCorps. A total of 2,973 employees, 812 full-time and 2,161 seasonal and part-time,worked at these farms during 1997. It is not clear if these seasonal workers areemployed annually or for projects such as planting trees, harvesting, and pruning.These farms represent 84.3 percent of the acreage under cultivation in the IceHarbor reservoir. If it is assumed that the other farms on the reservoir have similaremployment per acre then it is estimated that the total affected population may be atotal of 3,526 employees consisting of 963 full-time and 2,563 part-time andseasonal employees. No estimate of full time equivalencies exists. Based oninterviews with farm owners, Hispanic workers make up to 90 percent of thisemployment. The environmental justice issues associated with this affectedpopulation will be addressed in the Environmental Impact Statement.
Corps’ economists evaluated two approaches to determine the economic effects ofAlternative A3 on Ice Harbor irrigators. One approach estimated the costs toconstruct a new intake and distribution system that would be reliable at lower waterlevels and would cost approximately $291,481,00 or an average annual cost of$17,552,400 at a 4.75 percent discount rate. Under this approach irrigators wouldcontinue to produce crops.
Predecisional DocumentationFor Information Purposes Only - Not For Comment
Predecisional DocumentationFor Information Purposes Only - Not For Comment
The second approach calculated the economic effect of Alternative A3, measured asa change in farmland value if this land did not have access to water from the IceHarbor Reservoir. The economic effect would be a decrease in farmland value of$134,240,000 or an average annual cost of $6,438,100 at a 4.75 percent discountrate. Under this approach the land currently irrigated would revert back to drylandfarming. Both approaches indicate that the cost of modification would be extremelyhigh and, in the absence of Congressional appropriation to modify the pumps, thecosts to individual irrigators would be prohibitive based on net farm income and totalfarm values. In this case it is assumed that the land would go out of production andthe workers would be displaced.
The direct employment and income losses would be distributed in Franklin andWalla Walla counties. The total direct, indirect, and induced impacts would bedistributed in the three county area of Walla Walla, Franklin, and Benton counties.Total employment and income effects are estimated at 2,256 jobs and $79.2 million,respectively.
The social effects of these displaced workers include a strain on public services,county tax revenue, school district levies, and stress among individuals that currentlyown and work on these farms.
3.5.2 Effects on Farmers Using Wells Along the Lower Snake River
Wells and farms within 1 mile of the lower Snake River would also be affected byAlternative A3. State water reports indicate that approximately 225 wells are locatedwithin 1 mile of the lower Snake River. Approximately 53 percent of these wells areused for either domestic or irrigation purposes. The distribution of these wells andthe associated costs to modify the wells are summarized in Table 29. The wellmodification costs apply to the estimated 95 wells that would require modification.
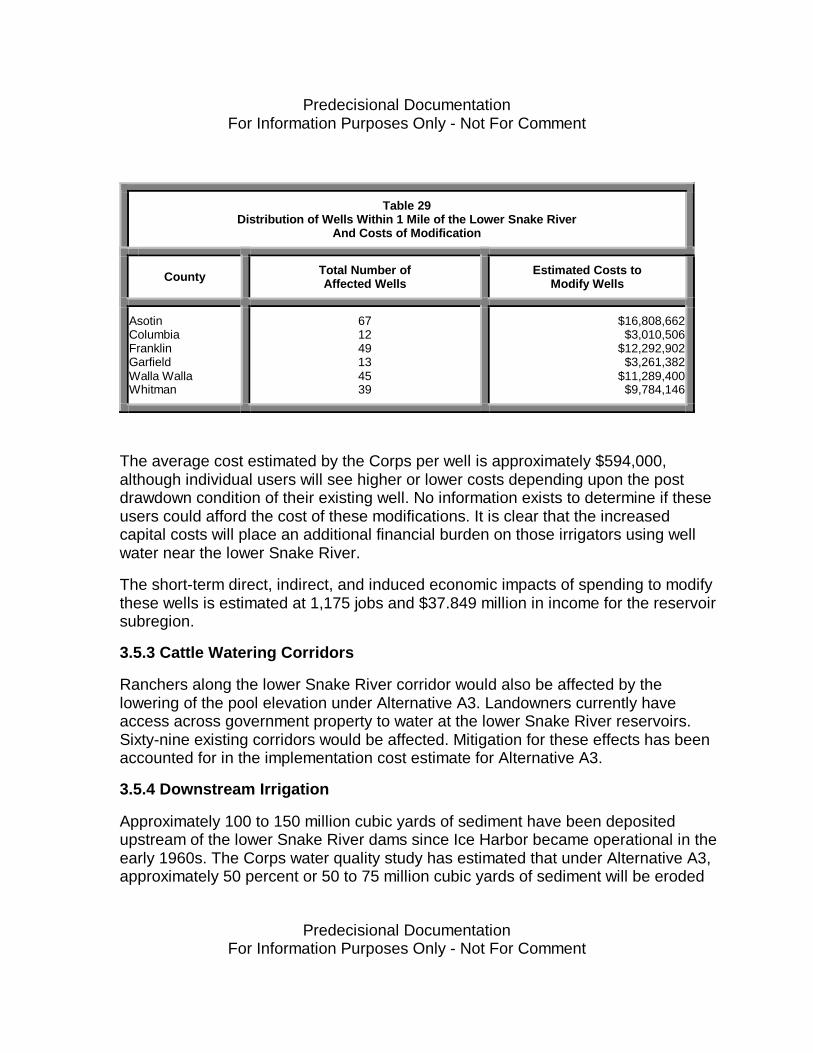
Predecisional DocumentationFor Information Purposes Only - Not For Comment
Predecisional DocumentationFor Information Purposes Only - Not For Comment
Table 29Distribution of Wells Within 1 Mile of the Lower Snake River
And Costs of Modification
County Total Number ofAffected Wells
Estimated Costs toModify Wells
AsotinColumbiaFranklinGarfieldWalla WallaWhitman
671249134539
$16,808,662$3,010,506
$12,292,902$3,261,382
$11,289,400$9,784,146
The average cost estimated by the Corps per well is approximately $594,000,although individual users will see higher or lower costs depending upon the postdrawdown condition of their existing well. No information exists to determine if theseusers could afford the cost of these modifications. It is clear that the increasedcapital costs will place an additional financial burden on those irrigators using wellwater near the lower Snake River.
The short-term direct, indirect, and induced economic impacts of spending to modifythese wells is estimated at 1,175 jobs and $37.849 million in income for the reservoirsubregion.
3.5.3 Cattle Watering Corridors
Ranchers along the lower Snake River corridor would also be affected by thelowering of the pool elevation under Alternative A3. Landowners currently haveaccess across government property to water at the lower Snake River reservoirs.Sixty-nine existing corridors would be affected. Mitigation for these effects has beenaccounted for in the implementation cost estimate for Alternative A3.
3.5.4 Downstream Irrigation
Approximately 100 to 150 million cubic yards of sediment have been depositedupstream of the lower Snake River dams since Ice Harbor became operational in theearly 1960s. The Corps water quality study has estimated that under Alternative A3,approximately 50 percent or 50 to 75 million cubic yards of sediment will be eroded
Predecisional DocumentationFor Information Purposes Only - Not For Comment
Predecisional DocumentationFor Information Purposes Only - Not For Comment
and transported within the first few years of dam breaching. The most coarsesediments will be deposited in Lake Wallula below the current site of the Ice Harborreservoir and downstream to the upper end of McNary pool. Finer sediments wouldbe transported to the Columbia River estuary. The effect of this sediment onirrigators who take water out of Lake Wallula is unknown at this time.
3.5.5 Municipal and Industrial Users
Other affected Municipal & Industrial (M&I) water user groups are isolated on theLower Granite pool in the communities of Lewiston and Clarkston. These pumpstations provide water to six users including the Asotin County Public Utility District(PUD), the Clarkston Golf Course, the Lewiston Golf Club, Atlas Sand and Rock,and the Potlatch Corporation (Potlatch). The costs to modify the intakes andpumping stations has been estimated from $11,514,000 to $55,214,000 dependingupon the need for Potlatch to modify its water cooling system. Approximately$10,683,000 of the low cost estimate are associated with the Potlatch water system.The effect of these costs on the operations of Potlatch and the other M&I users areunknown.
The estimated range of short-term direct, indirect, and induced impacts of modifyingthese pumps is 292 to 1,397 jobs and $7.737 to $37.101 million in personal income.
3.6 Implementation
The implementation of the proposed alternatives will require physical modificationsof the operations and physical structure of the four lower Snake River facilities inorder to achieve the objectives of each alternative. Implementation proposed foreach alternative includes physical modifications and required mitigation as well aschanges in operations at each project. These modifications would take place overdistinct implementation periods starting in 2001 and reaching completion in 2005 to2010 depending on the alternative. This estimate assumes that a decision isreached in 2001. The geographic scope of these implementation activities wouldtake place in the river corridor area between the Lewiston/Clarkston Valley and theTri-Cities. Potentially affected communities include Burbank, Prescott, Washtucna,Kahlotus, Starbuck, Pomeroy, Walla Walla, Colfax, and Dayton.
The social impacts on focus communities will be evaluated for each alternative interms of the long-term and short-term effects on jobs and income, the influx ofoutside workers, and human movement patterns.
Predecisional DocumentationFor Information Purposes Only - Not For Comment
Predecisional DocumentationFor Information Purposes Only - Not For Comment
3.6.1 Alternative A1: Existing Conditions, 1995 Biological Opinion (Base Case)
Alternative A1 is programmed to begin implementation in the year 2001 and becompleted by 2005. The majority of the activity associated with the alternative wouldoccur between 2002 and 2004. Major implementation activities include, but are notlimited to, turbine modifications, auxiliary water supply, fish ladders, separatorimprovements, end bay deflectors, juvenile fish facility improvements, additionalbarges, barge moorage cells, anadromous fish evaluation, and Bureau ofReclamation (BoR) water purchases.
Employment Associated with the Operations of A1
Currently the four lower Snake River facilities directly employ 210 individuals(USACE Walla Walla District, 1999). These Corps employees live in communitiessurrounding the lower Snake River including Burbank, Connell, Kennewick, Pasco,Touchet, Pomeroy, Ritzville, Starbuck, Albion, Clarkston, Colfax, Pullman, Dayton,Dixie, Kahlotus, Washtucna, and Prescott in Washington and Lewiston, Idaho.
Influx of Outside Workers
The low number of short-term jobs associated with this alternative should not lead tosignificant increases of outside workers in the focus communities in the lower SnakeRiver subregion.
Human Movement Patterns
The construction activities under Alternative A1 should not affect the movement oflocal human populations living around the projects. The four lower Snake Riverfacilities are currently utilized by local residents and visitors as bridges connectingroads on the north side of the river with those on the south. The projects operateallow passage year round during predominately daylight hours. Current levels oftraffic across the projects should continue at the same levels as 1997 usage. Table30 presents a rough estimate of daily traffic on the lower Snake facilities.
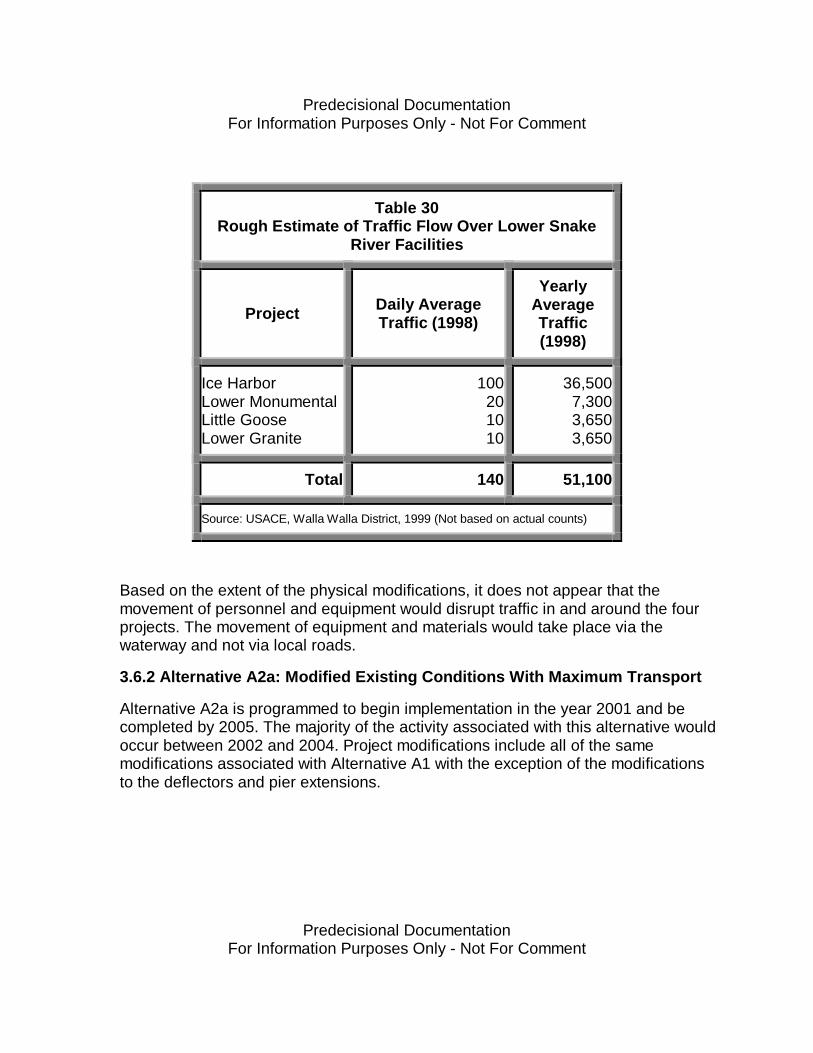
Predecisional DocumentationFor Information Purposes Only - Not For Comment
Predecisional DocumentationFor Information Purposes Only - Not For Comment
Table 30Rough Estimate of Traffic Flow Over Lower Snake
River Facilities
Project Daily AverageTraffic (1998)
YearlyAverageTraffic(1998)
Ice HarborLower MonumentalLittle GooseLower Granite
100201010
36,5007,3003,6503,650
Total 140 51,100
Source: USACE, Walla Walla District, 1999 (Not based on actual counts)
Based on the extent of the physical modifications, it does not appear that themovement of personnel and equipment would disrupt traffic in and around the fourprojects. The movement of equipment and materials would take place via thewaterway and not via local roads.
3.6.2 Alternative A2a: Modified Existing Conditions With Maximum Transport
Alternative A2a is programmed to begin implementation in the year 2001 and becompleted by 2005. The majority of the activity associated with this alternative wouldoccur between 2002 and 2004. Project modifications include all of the samemodifications associated with Alternative A1 with the exception of the modificationsto the deflectors and pier extensions.
Predecisional DocumentationFor Information Purposes Only - Not For Comment
Predecisional DocumentationFor Information Purposes Only - Not For Comment
Jobs and Income
The implementation of alternative A2a would result in less employment and personalincome than Alternative A1. During the four years of implementation, Alternative A2aproduces between 1 and 1.5 million dollars less in personal income and between 56and 39 fewer jobs than A1.
Employment Associated with Operations of Alternative A2a
The operation of Alternative A2a would require less spending and employment thanthe base case. This reduction results in a decrease of approximately 2.3 milliondollars in personal income annually and a decrease in direct, indirect, and inducedemployment of approximately 83 jobs until the year 2026 within the lower SnakeRiver subregion. From 2027 to 2100 no differences between the base case andAlternative A2a in employment or personal income are projected.
Influx of Outside Workers
Alternative A2a creates less employment and income than Alternative A1. Thus,there is no projected influx of outside workers.
Human Movement Patterns
Human movement patterns over and around the dams will continue as in the basecase.
3.6.3 Alternative A2c, Major Improvements Surface Bypass Collection withMaximum Transport
Alternative A2c is programmed to begin implementation in the year 2001 and becompleted by 2006. The majority of the activity associated with this alternative wouldoccur between 2002 and 2006. Major activities associated with the implementationof this alternative include Alternative A1 modifications with the exception of themodification of the deflectors. In addition, Alternative A2c would include the testingand installation of surface bypass collectors and new extended screens.
Jobs and Income
This alternative would create an additional 1.9 to 5.9 million dollars in personalincome and between 71 and 216 jobs than the base case during the period ofimplementation. These direct, indirect, and induced effects would take placethroughout the lower Snake River study area.
Predecisional DocumentationFor Information Purposes Only - Not For Comment
Predecisional DocumentationFor Information Purposes Only - Not For Comment
Employment Associated with Operations of Alternative A2a
The operation of Alternative A2c requires more spending and employment than thebase case in order to operate and maintain the surface bypass collectors. Thisincreased operational cost results in increased personal income of approximately1.26 million dollars annually and an increase in direct, indirect, and inducedemployment of 44 jobs until the year 2026 within the lower Snake River study area.From 2027 to 2100 the direct, indirect, and induced effects of the operation ofAlternative A2c would create approximately $727,000 dollars in personal income and25 jobs within the lower Snake River study area.
Influx of Outside Workers
The level of construction activity associated with the modifications under thisalternative should not introduce significant numbers of outside workers intocommunities surrounding the projects on a temporary or a permanent basis.
Human Movement Patterns
Human movement patterns over and around the dams will continue as in the basecase.
3.6.4 Alternative A3: Dam Breaching
Alternative A3 is programmed to begin implementation in the year 2001 and to becompleted by 2009. The majority of the construction would occur between 2004 and2007. Major activities associated with this alternative include power house turbinemodifications, dam embankment removal, river channelization, temporary fishhandling facilities, dam decommissioning, railroad relocations, bridge, reservoir,roadway and drainage structure protection and repair, recreation accessmodification, revegetation, cultural resource protection, and cattle watering facilities.
Jobs and Income
The direct, indirect, and induced effects of increased spending to implement thisalternative, beyond the base case spending, would create a range of personalincome increases from 2.3 million dollars in the first year, to 41.9 million in year 5, to5.1 million in year 8. Employment increases in the lower Snake River subregion areprojected to be from a low of 83 jobs in the first year to a high of 1,534 jobs in year 5,to 187 jobs in year 8.
Predecisional DocumentationFor Information Purposes Only - Not For Comment
Predecisional DocumentationFor Information Purposes Only - Not For Comment
Employment Associated with Operations of Alternative A3
After the initial implementation of Alternative A3, spending on annual operations andmaintenance would be significantly reduced. Operations that would continue includeLyons Ferry Hatchery, habitat management units, and recreation sites. Estimates ofthe direct, indirect, and induced effects of decreased operations spending within thelower Snake River study area from 2009 to 2100 range from a loss of 44 to 35million dollars of personal income and employment losses from 1,193 to 1,585 jobs.Direct job losses will include a portion of 210 current Corps employees living incommunities throughout the reservoir and downriver subregions. The loss ofgovernment employees in small communities may be significant and it assumed thatthose individuals and their families would leave. Social impacts for each of the focuscommunities will be evaluated in terms of employment and income effects andpopulation effects.
Influx of Outside Workers
These new short-term employment projections include both on- and off-siteemployment within the lower Snake River study area. Cost engineers at the WallaWalla district provided the labor hours for on site manual labor to implement thisalternative. It appears that approximately 237 person years of labor would berequired at each dam for on-site work. If this work were performed during a four-month period at each project the estimate of workers on site would be 711 duringthat four-month period. Based on interviews with cost engineers at the Walla Walladistrict, it is assumed that many of these workers would come from union halls in theregion. Those workers from outside the region would most likely stay in the Tri-Citiesor the Lewiston-Clarkston Valley and commute to the job site. It is not anticipatedthat trailer cities would be constructed at the job sites or that workers would stay inthe small communities, such as Kahlotus, Prescott, Pomeroy, and Starbuck, thatoriginally hosted the dam construction workers in the 1950s through the 1970s.
The influx of outside workers in large numbers and for a long duration can strainpublic services, create short-term housing shortages, and introduce a new set ofcultural values into the community. Each community will be evaluated based on thepotential percentage increase in total population in the community to determine thepotential effects of outside workers.
Predecisional DocumentationFor Information Purposes Only - Not For Comment
Predecisional DocumentationFor Information Purposes Only - Not For Comment
Human Movement Patterns
The construction activities under Alternative A3 would affect the movement of localhuman populations living around the lower Snake River facilities. Transportationacross the river would be eliminated at the four facility sites leaving only two bridgecrossings between Clarkston and Burbank. The loss of crossing points across theriver would affect communities such as Kahlotus, Washtucna, Starbuck, Prescott,Connell, Pomeroy, and Colfax.
Based on the extent of the physical modifications at the projects, damaged roadsand rails and the movement of large machinery would disrupt traffic flows along SR263, SR 261, SR 194, SR193, and other local county roads that run along the river.These state and county routes carry between 200 and 1700 vehicles daily (WSDOT,1997). The traffic currently moving on these roads is primarily truck traffic accessingthe port facilities. The movement of personnel and equipment would disrupt traffic inand around the four projects and there may be some congestion if work onimplementation takes place before the ports have stopped loading grain. Themovement of equipment and materials would take place via the waterway and notvia local roads.
3.7 Air Quality
Preliminary air quality analysis indicates increases in fugitive dust emissions fromexposed sediments under Alternative A3. The analysis does not present informationon local level changes in particulate matter and therefore this effect on theenvironment in the focus communities cannot be addressed unless more detailedinformation is provided.
3.8 Salmon Recovery
The scientific uncertainty associated with the probability of anadromous fishrecovery and the relative effects of the lower Snake River facilities on the futureviability of the salmon under the proposed alternatives has and will continue tocause significant social impacts to communities throughout the region. Residentsthroughout the region feel that salmon recovery is a worthwhile goal. Existencevalue survey results and the attitudes and statements made both at communityforums and public information meetings conducted throughout the course of thisstudy have demonstrated this.

Predecisional DocumentationFor Information Purposes Only - Not For Comment
Predecisional DocumentationFor Information Purposes Only - Not For Comment
Although there is a demonstrated concern about salmon recovery, the population ofthe region is divided on the means for achieving salmon recovery and the risk, eitherbiological or economic, associated with the proposed alternatives. The significanteffects of this social division include an increase in interest group activity and theallocation of scarce resources to engage in the salmon-dams debate, changes incommunity social cohesion, future uncertainty related to the river system and theregional business climate, and the future uncertainty of the existence of wild salmonin the lower Snake River.
These impacts are discussed qualitatively for each community based on regionalnewspaper accounts over the past two years, observations made at public meetingsand regional forums and roundtables, and the results of the community basedassessments.
3.8.1 Interest Group Activity
The most significant social impact of this disagreement over the acceptable riskassociated with the alternatives is the commitment of scarce resources for a broadarray of interest group activities. Private interest groups including the Farm Bureau,the Idaho, Washington, and Oregon State Wheat Growers Associations, the PacificNorthwest Grain and Feed Association, the Pulp and Paper Workers Union, variousChambers of Commerce, and the Columbia River Alliance have investedconsiderable resources to advocate for the alternatives associated with a perceivedlow economic risk and a high biological risk (i.e., non dam breaching alternatives).Joining in this position have been public sector groups such as countycommissioners and city councils. One indicator of the position of these groups maybe seen in the slogan, "Save Salmon--Save Our Dams."
On the other side, advocating a perceived lower biological risk and highersocioeconomic risk associated with dam breaching, private interest groups such asIdaho Rivers United, Save our Salmon Coalition, the Sierra Club, IdahoConservation League, and the Northwest Sportfishing Industry Association haveinvested considerable resources to advocate for the lower biological risk alternative,dam breaching. In addition to these private interest groups, the Columbia RiverTribes, as well as the state Fish and Game Commissions have been activelyinvolved as participants in the process and more recently as advocates for dambreaching. One indicator of the position of these groups is the slogan, "Extinction isForever, Dams are Not."
Predecisional DocumentationFor Information Purposes Only - Not For Comment
Predecisional DocumentationFor Information Purposes Only - Not For Comment
3.8.2 Social Cohesion
In some communities the debate between the perceived low biological riskalternative, dam breaching, and the low socioeconomic risk alternatives hasdecreased social cohesion and placed community members in adversarial positions.City councils have debated the issue and Chambers of Commerce have issuedposition papers. On the other hand, in communities where there is little division overthe preferred risk exposure, and the primary economic interests in the communitiesare perceived to be adversely or beneficially affected by the proposed alternatives,community cohesion may increase through a united position on a preferredalternative. In both cases, scarce social and economic resources are being investedin the issue and will continue to be invested during the decision-making process andduring the implementation of any of the alternatives.
3.8.3 Perceived Risk
Many communities and individuals in the region are faced with the tradeoffs betweenthe perceived biological and socioeconomic risks associated with the proposedalternatives. Alternative A1 is perceived by those communities that considerthemselves as dependent on the waterway as having a higher biological risk and alower socioeconomic risk since the existing river system remains in place.Alternative A2 is also perceived to have a higher biological risk and a lowersocioeconomic risk. Those communities that currently perceive themselves to bedependent on the lower Snake River Waterway perceive Alternative A3 as having alower biological risk and a much higher socioeconomic risk. In other words, thefuture of the socioeconomic system and the communities is much less certain withthe dams breached.
On the other hand communities that do not perceive themselves as dependent onthe waterway but on the biological resource perceive Alternatives A1 and A2 ashaving a higher biological risk and a higher socioeconomic risk. These communitiesperceive Alternative A3 as having a lower biological risk and a lower socioeconomicrisk. In those communities where there is a presence of groups dependent on thewaterway and other groups dependent on the biological resource, the perceived riskof both groups create an environment where rival claims are made about the risksassociated with the same proposed action.
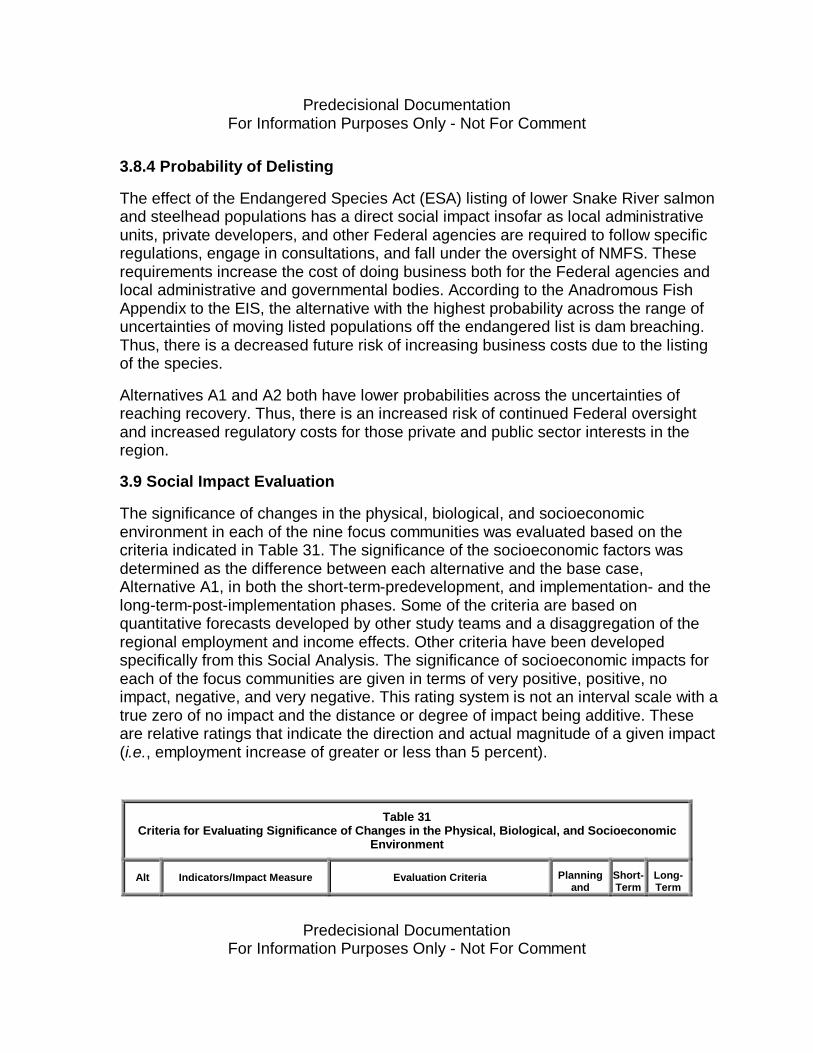
Predecisional DocumentationFor Information Purposes Only - Not For Comment
Predecisional DocumentationFor Information Purposes Only - Not For Comment
3.8.4 Probability of Delisting
The effect of the Endangered Species Act (ESA) listing of lower Snake River salmonand steelhead populations has a direct social impact insofar as local administrativeunits, private developers, and other Federal agencies are required to follow specificregulations, engage in consultations, and fall under the oversight of NMFS. Theserequirements increase the cost of doing business both for the Federal agencies andlocal administrative and governmental bodies. According to the Anadromous FishAppendix to the EIS, the alternative with the highest probability across the range ofuncertainties of moving listed populations off the endangered list is dam breaching.Thus, there is a decreased future risk of increasing business costs due to the listingof the species.
Alternatives A1 and A2 both have lower probabilities across the uncertainties ofreaching recovery. Thus, there is an increased risk of continued Federal oversightand increased regulatory costs for those private and public sector interests in theregion.
3.9 Social Impact Evaluation
The significance of changes in the physical, biological, and socioeconomicenvironment in each of the nine focus communities was evaluated based on thecriteria indicated in Table 31. The significance of the socioeconomic factors wasdetermined as the difference between each alternative and the base case,Alternative A1, in both the short-term-predevelopment, and implementation- and thelong-term-post-implementation phases. Some of the criteria are based onquantitative forecasts developed by other study teams and a disaggregation of theregional employment and income effects. Other criteria have been developedspecifically from this Social Analysis. The significance of socioeconomic impacts foreach of the focus communities are given in terms of very positive, positive, noimpact, negative, and very negative. This rating system is not an interval scale with atrue zero of no impact and the distance or degree of impact being additive. Theseare relative ratings that indicate the direction and actual magnitude of a given impact(i.e., employment increase of greater or less than 5 percent).
Table 31Criteria for Evaluating Significance of Changes in the Physical, Biological, and Socioeconomic
Environment
Alt Indicators/Impact Measure Evaluation Criteria Planningand
Short-Term
Long-Term
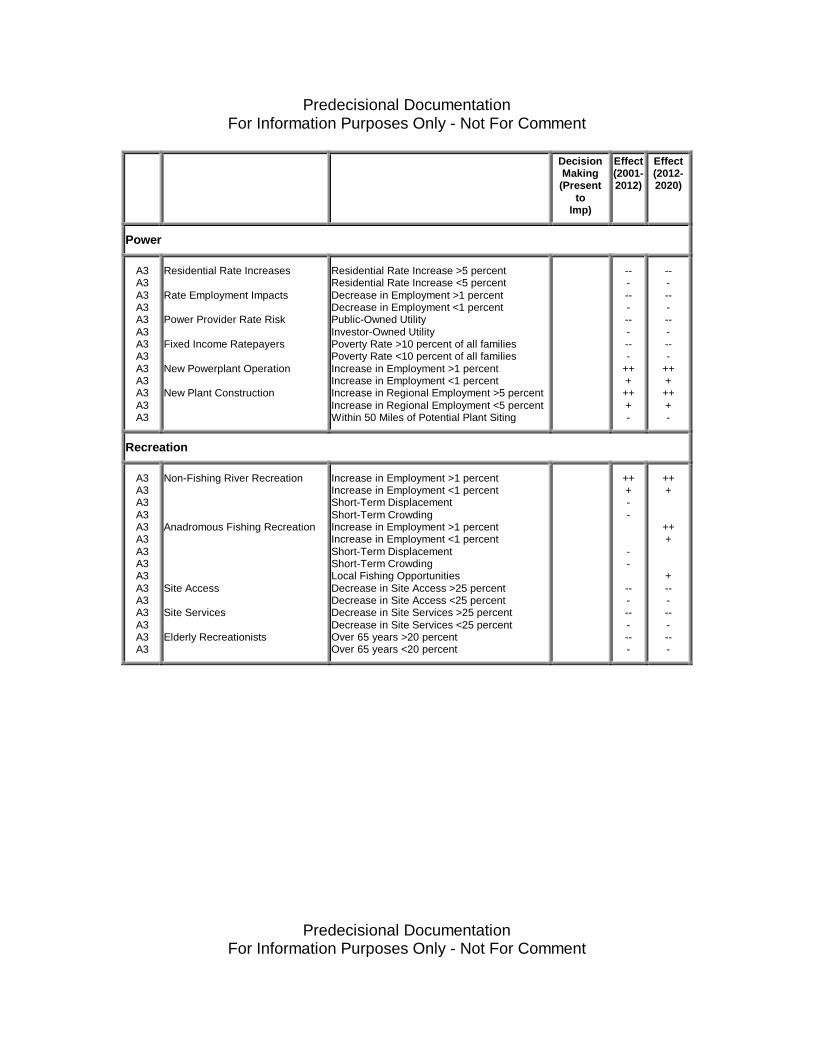
Predecisional DocumentationFor Information Purposes Only - Not For Comment
Predecisional DocumentationFor Information Purposes Only - Not For Comment
DecisionMaking(Present
toImp)
Effect(2001-2012)
Effect(2012-2020)
Power
A3A3A3A3A3A3A3A3A3A3A3A3A3
Residential Rate Increases
Rate Employment Impacts
Power Provider Rate Risk
Fixed Income Ratepayers
New Powerplant Operation
New Plant Construction
Residential Rate Increase >5 percentResidential Rate Increase <5 percentDecrease in Employment >1 percentDecrease in Employment <1 percentPublic-Owned UtilityInvestor-Owned UtilityPoverty Rate >10 percent of all familiesPoverty Rate <10 percent of all familiesIncrease in Employment >1 percentIncrease in Employment <1 percentIncrease in Regional Employment >5 percentIncrease in Regional Employment <5 percentWithin 50 Miles of Potential Plant Siting
------------
++++++-
------------
++++++-
Recreation
A3A3A3A3A3A3A3A3A3A3A3A3A3A3A3
Non-Fishing River Recreation
Anadromous Fishing Recreation
Site Access
Site Services
Elderly Recreationists
Increase in Employment >1 percentIncrease in Employment <1 percentShort-Term DisplacementShort-Term CrowdingIncrease in Employment >1 percentIncrease in Employment <1 percentShort-Term DisplacementShort-Term CrowdingLocal Fishing OpportunitiesDecrease in Site Access >25 percentDecrease in Site Access <25 percentDecrease in Site Services >25 percentDecrease in Site Services <25 percentOver 65 years >20 percentOver 65 years <20 percent
+++--
--
---------
+++
+++
+---------
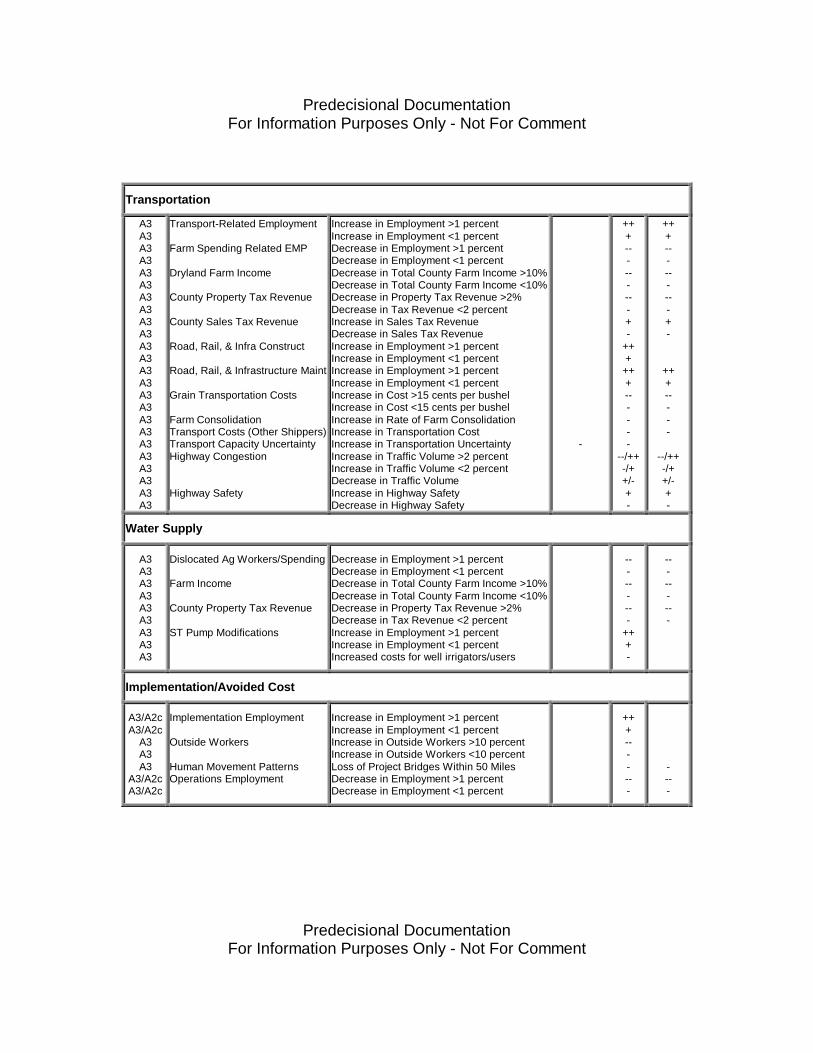
Predecisional DocumentationFor Information Purposes Only - Not For Comment
Predecisional DocumentationFor Information Purposes Only - Not For Comment
Transportation
A3A3A3A3A3A3A3A3A3A3A3A3A3A3A3A3A3A3A3A3A3A3A3A3
Transport-Related Employment
Farm Spending Related EMP
Dryland Farm Income
County Property Tax Revenue
County Sales Tax Revenue
Road, Rail, & Infra Construct
Road, Rail, & Infrastructure Maint
Grain Transportation Costs
Farm ConsolidationTransport Costs (Other Shippers)Transport Capacity UncertaintyHighway Congestion
Highway Safety
Increase in Employment >1 percentIncrease in Employment <1 percentDecrease in Employment >1 percentDecrease in Employment <1 percentDecrease in Total County Farm Income >10%Decrease in Total County Farm Income <10%Decrease in Property Tax Revenue >2%Decrease in Tax Revenue <2 percentIncrease in Sales Tax RevenueDecrease in Sales Tax RevenueIncrease in Employment >1 percentIncrease in Employment <1 percentIncrease in Employment >1 percentIncrease in Employment <1 percentIncrease in Cost >15 cents per bushelIncrease in Cost <15 cents per bushelIncrease in Rate of Farm ConsolidationIncrease in Transportation CostIncrease in Transportation UncertaintyIncrease in Traffic Volume >2 percentIncrease in Traffic Volume <2 percentDecrease in Traffic VolumeIncrease in Highway SafetyDecrease in Highway Safety
-
+++---------+-
++++++------
--/++-/++/-+-
+++---------+-
+++-----
--/++-/++/-+-
Water Supply
A3A3A3A3A3A3A3A3A3
Dislocated Ag Workers/Spending
Farm Income
County Property Tax Revenue
ST Pump Modifications
Decrease in Employment >1 percentDecrease in Employment <1 percentDecrease in Total County Farm Income >10%Decrease in Total County Farm Income <10%Decrease in Property Tax Revenue >2%Decrease in Tax Revenue <2 percentIncrease in Employment >1 percentIncrease in Employment <1 percentIncreased costs for well irrigators/users
---------
+++-
---------
Implementation/Avoided Cost
A3/A2cA3/A2c
A3A3A3
A3/A2cA3/A2c
Implementation Employment
Outside Workers
Human Movement PatternsOperations Employment
Increase in Employment >1 percentIncrease in Employment <1 percentIncrease in Outside Workers >10 percentIncrease in Outside Workers <10 percentLoss of Project Bridges Within 50 MilesDecrease in Employment >1 percentDecrease in Employment <1 percent
+++-------
----
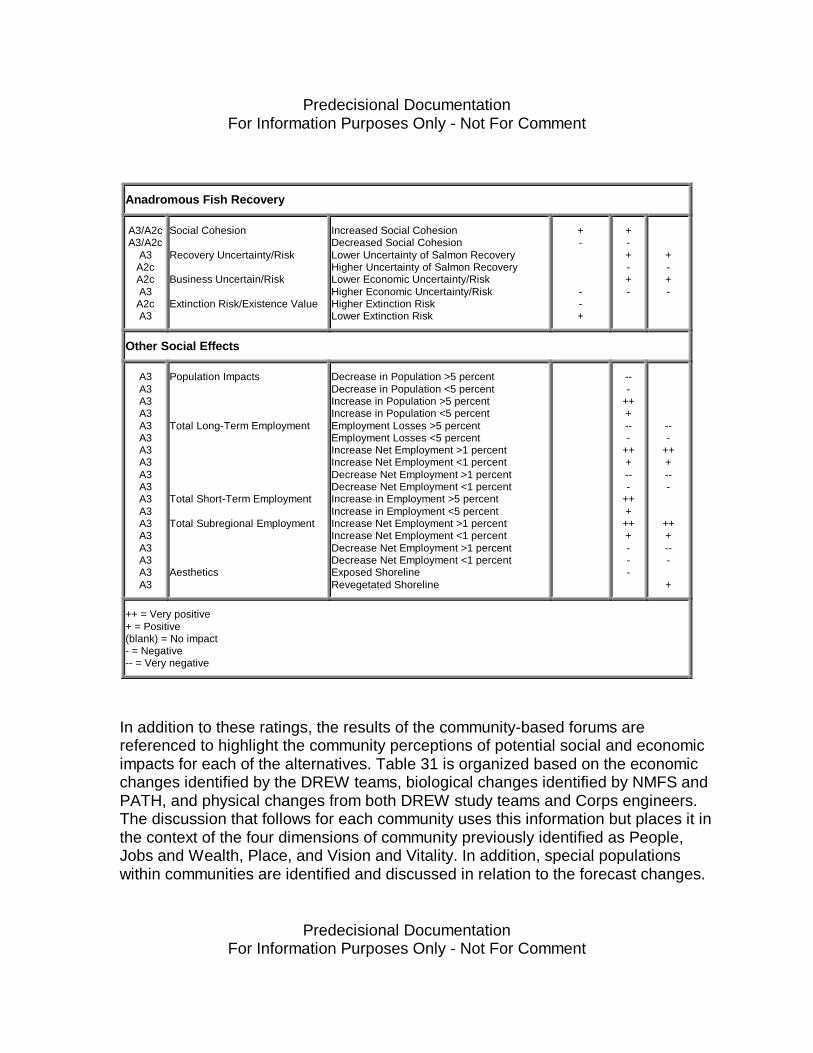
Predecisional DocumentationFor Information Purposes Only - Not For Comment
Predecisional DocumentationFor Information Purposes Only - Not For Comment
Anadromous Fish Recovery
A3/A2cA3/A2c
A3A2cA2cA3A2cA3
Social Cohesion
Recovery Uncertainty/Risk
Business Uncertain/Risk
Extinction Risk/Existence Value
Increased Social CohesionDecreased Social CohesionLower Uncertainty of Salmon RecoveryHigher Uncertainty of Salmon RecoveryLower Economic Uncertainty/RiskHigher Economic Uncertainty/RiskHigher Extinction RiskLower Extinction Risk
+-
--+
+-+-+-
+-+-
Other Social Effects
A3A3A3A3A3A3A3A3A3A3A3A3A3A3A3A3A3A3
Population Impacts
Total Long-Term Employment
Total Short-Term Employment
Total Subregional Employment
Aesthetics
Decrease in Population >5 percentDecrease in Population <5 percentIncrease in Population >5 percentIncrease in Population <5 percentEmployment Losses >5 percentEmployment Losses <5 percentIncrease Net Employment >1 percentIncrease Net Employment <1 percentDecrease Net Employment >1 percentDecrease Net Employment <1 percentIncrease in Employment >5 percentIncrease in Employment <5 percentIncrease Net Employment >1 percentIncrease Net Employment <1 percentDecrease Net Employment >1 percentDecrease Net Employment <1 percentExposed ShorelineRevegetated Shoreline
---
+++---
+++---
++++++---
---
+++---
+++---
+
++ = Very positive+ = Positive(blank) = No impact- = Negative-- = Very negative
In addition to these ratings, the results of the community-based forums arereferenced to highlight the community perceptions of potential social and economicimpacts for each of the alternatives. Table 31 is organized based on the economicchanges identified by the DREW teams, biological changes identified by NMFS andPATH, and physical changes from both DREW study teams and Corps engineers.The discussion that follows for each community uses this information but places it inthe context of the four dimensions of community previously identified as People,Jobs and Wealth, Place, and Vision and Vitality. In addition, special populationswithin communities are identified and discussed in relation to the forecast changes.
Predecisional DocumentationFor Information Purposes Only - Not For Comment
Predecisional DocumentationFor Information Purposes Only - Not For Comment
Increases in both short-term and long-term local employment are consideredbeneficial although these benefits are qualified if there is a fundamental shift in thecomposition of the types of jobs and the traditional employment profile of thecommunity. In other words, would the employment changes build on the past growthand direction of economic development in the community, expand the economicbase, or move in an entirely new direction?
The significance of these employment and other social impacts will be discussed inthe context of recent historical socioeconomic changes in each community. In otherwords, have these communities experienced significant changes, and how did theyrespond? Additionally, both the county resiliency rating and the community economicdiversity rating will serve as indicators of overall community health of communities inwhich these impacts are expected to occur.
4. Description and Comparison of Community Social Impacts
4.1 Allocation of Regional Employment Impacts to Study Regions and FocusCommunities
Regional employment effects developed by the Input-Output (I-O) analysis areallocated to the appropriate subregion and then disaggregated to the focuscommunities. Limitations associated with the I-O data are discussed in the RegionalAnalysis Report (AEI, 1999). The following analysis is also subject to theselimitations. The following allocation involves distributing the change in regional jobsbased on the distribution of existing jobs by community. If, for example, a communityaccounts for 10 percent of existing regional employment, 10 percent of the projectedregional change would be allocated to that community. The resulting allocations areassessed qualitatively based on the local geographic context and economicstructure to ensure that effects are distributed as accurately as possible.
The allocation of subregion jobs to community jobs is based on the 1995 ICBEMPcommunity level data (Robison and Harris, 1995), which is the most recentcommunity level employment information available. This data, developed fromcounty-level REIS data, provides information on the functional economy of eachcommunity. This differs from the residence sample estimates provided in the 1990census, which are limited to economic activities contained within city limits. Thefollowing sections discuss the allocation of employment change by major resourcearea and subregion.
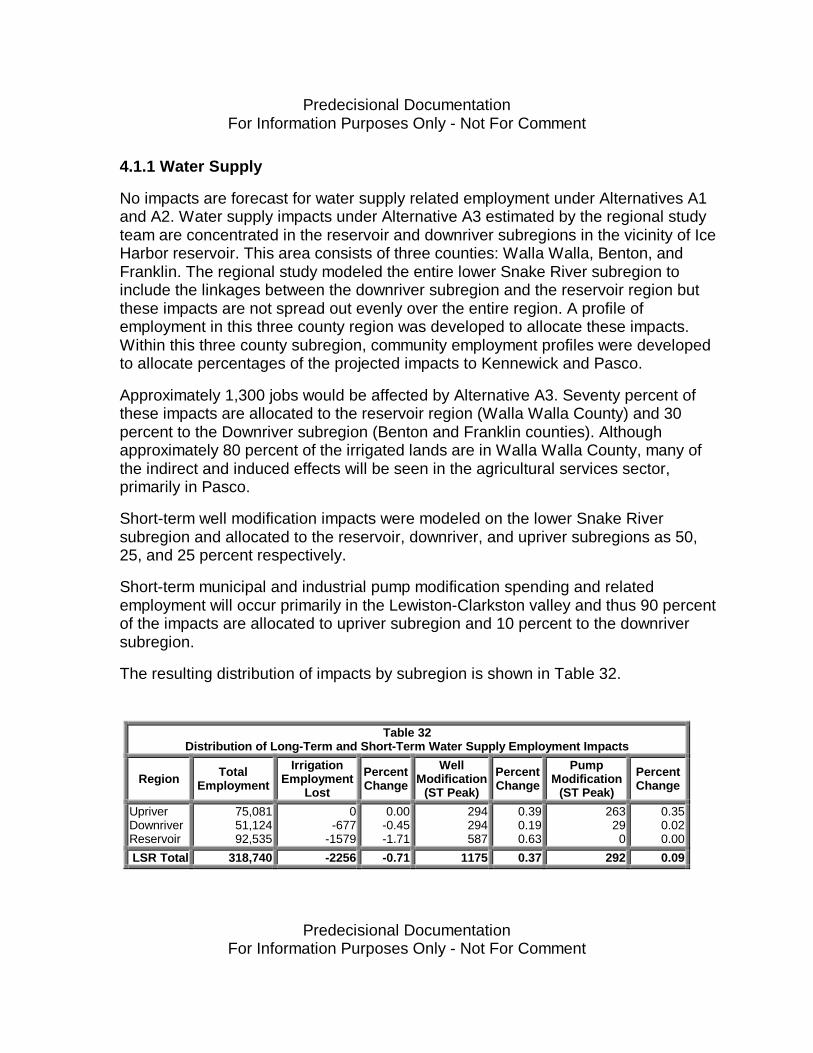
Predecisional DocumentationFor Information Purposes Only - Not For Comment
Predecisional DocumentationFor Information Purposes Only - Not For Comment
4.1.1 Water Supply
No impacts are forecast for water supply related employment under Alternatives A1and A2. Water supply impacts under Alternative A3 estimated by the regional studyteam are concentrated in the reservoir and downriver subregions in the vicinity of IceHarbor reservoir. This area consists of three counties: Walla Walla, Benton, andFranklin. The regional study modeled the entire lower Snake River subregion toinclude the linkages between the downriver subregion and the reservoir region butthese impacts are not spread out evenly over the entire region. A profile ofemployment in this three county region was developed to allocate these impacts.Within this three county subregion, community employment profiles were developedto allocate percentages of the projected impacts to Kennewick and Pasco.
Approximately 1,300 jobs would be affected by Alternative A3. Seventy percent ofthese impacts are allocated to the reservoir region (Walla Walla County) and 30percent to the Downriver subregion (Benton and Franklin counties). Althoughapproximately 80 percent of the irrigated lands are in Walla Walla County, many ofthe indirect and induced effects will be seen in the agricultural services sector,primarily in Pasco.
Short-term well modification impacts were modeled on the lower Snake Riversubregion and allocated to the reservoir, downriver, and upriver subregions as 50,25, and 25 percent respectively.
Short-term municipal and industrial pump modification spending and relatedemployment will occur primarily in the Lewiston-Clarkston valley and thus 90 percentof the impacts are allocated to upriver subregion and 10 percent to the downriversubregion.
The resulting distribution of impacts by subregion is shown in Table 32.
Table 32Distribution of Long-Term and Short-Term Water Supply Employment Impacts
Region TotalEmployment
IrrigationEmployment
Lost
PercentChange
WellModification
(ST Peak)
PercentChange
PumpModification
(ST Peak)
PercentChange
UpriverDownriverReservoir
75,08151,12492,535
0-677
-1579
0.00-0.45-1.71
294294587
0.390.190.63
263290
0.350.020.00
LSR Total 318,740 -2256 -0.71 1175 0.37 292 0.09
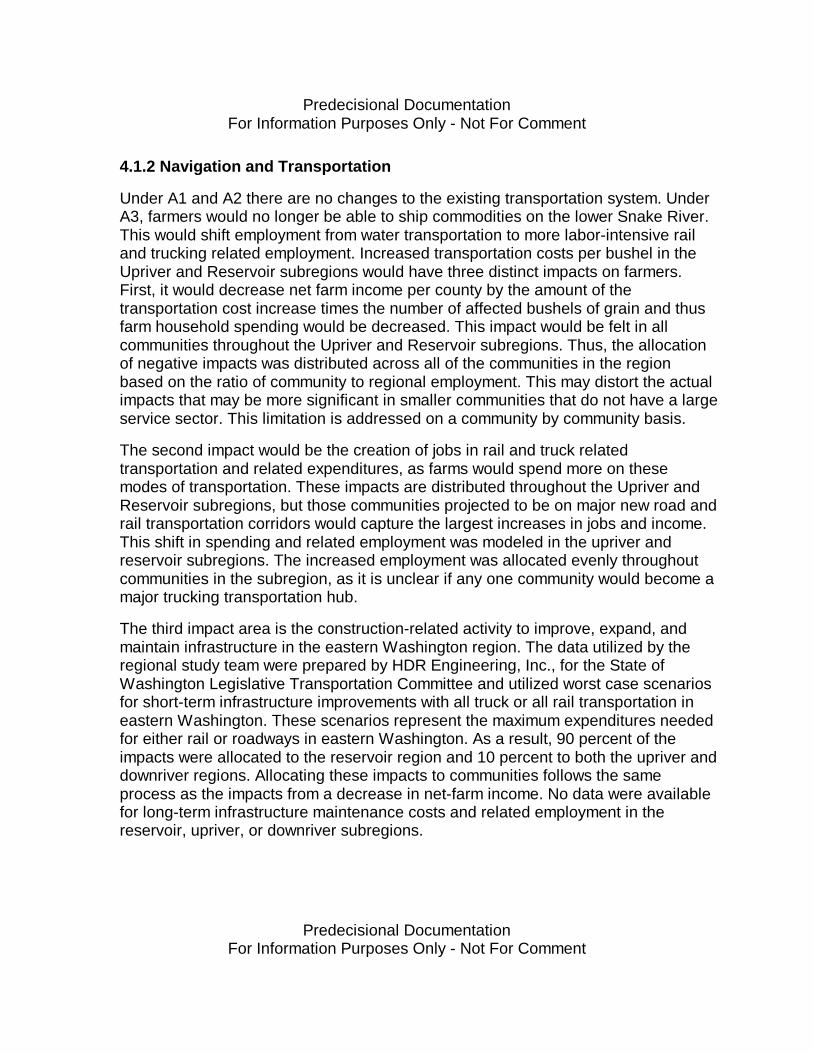
Predecisional DocumentationFor Information Purposes Only - Not For Comment
Predecisional DocumentationFor Information Purposes Only - Not For Comment
4.1.2 Navigation and Transportation
Under A1 and A2 there are no changes to the existing transportation system. UnderA3, farmers would no longer be able to ship commodities on the lower Snake River.This would shift employment from water transportation to more labor-intensive railand trucking related employment. Increased transportation costs per bushel in theUpriver and Reservoir subregions would have three distinct impacts on farmers.First, it would decrease net farm income per county by the amount of thetransportation cost increase times the number of affected bushels of grain and thusfarm household spending would be decreased. This impact would be felt in allcommunities throughout the Upriver and Reservoir subregions. Thus, the allocationof negative impacts was distributed across all of the communities in the regionbased on the ratio of community to regional employment. This may distort the actualimpacts that may be more significant in smaller communities that do not have a largeservice sector. This limitation is addressed on a community by community basis.
The second impact would be the creation of jobs in rail and truck relatedtransportation and related expenditures, as farms would spend more on thesemodes of transportation. These impacts are distributed throughout the Upriver andReservoir subregions, but those communities projected to be on major new road andrail transportation corridors would capture the largest increases in jobs and income.This shift in spending and related employment was modeled in the upriver andreservoir subregions. The increased employment was allocated evenly throughoutcommunities in the subregion, as it is unclear if any one community would become amajor trucking transportation hub.
The third impact area is the construction-related activity to improve, expand, andmaintain infrastructure in the eastern Washington region. The data utilized by theregional study team were prepared by HDR Engineering, Inc., for the State ofWashington Legislative Transportation Committee and utilized worst case scenariosfor short-term infrastructure improvements with all truck or all rail transportation ineastern Washington. These scenarios represent the maximum expenditures neededfor either rail or roadways in eastern Washington. As a result, 90 percent of theimpacts were allocated to the reservoir region and 10 percent to both the upriver anddownriver regions. Allocating these impacts to communities follows the sameprocess as the impacts from a decrease in net-farm income. No data were availablefor long-term infrastructure maintenance costs and related employment in thereservoir, upriver, or downriver subregions.
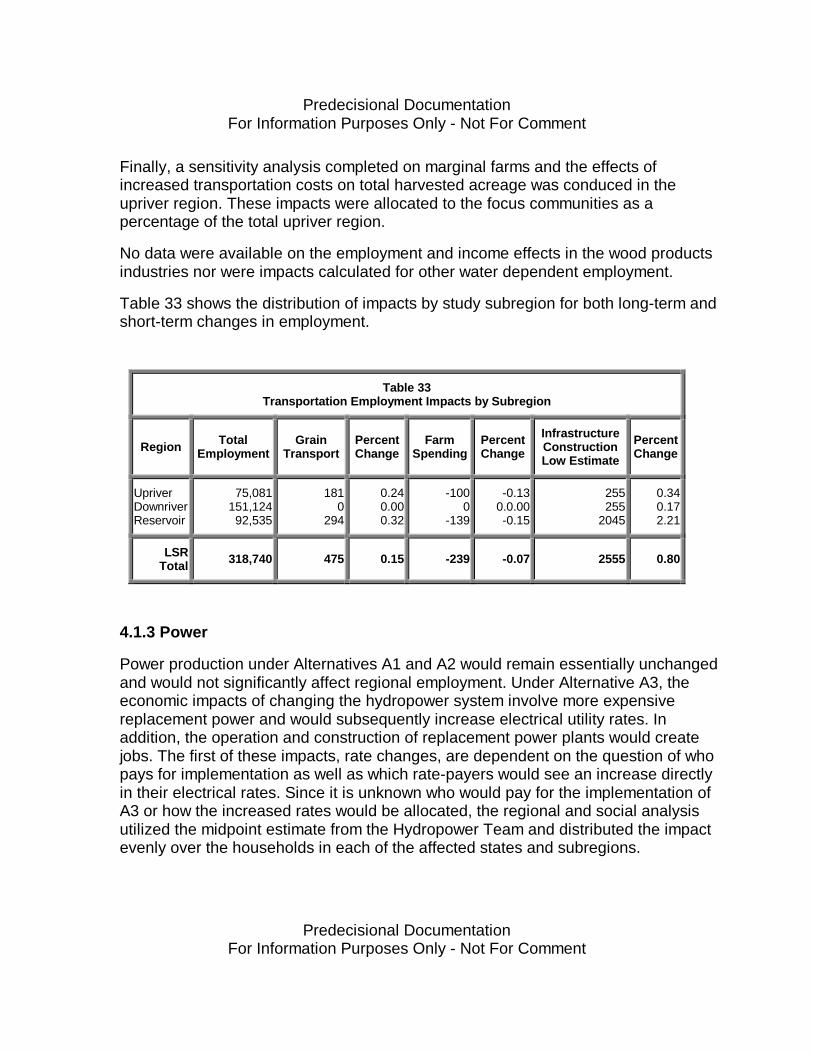
Predecisional DocumentationFor Information Purposes Only - Not For Comment
Predecisional DocumentationFor Information Purposes Only - Not For Comment
Finally, a sensitivity analysis completed on marginal farms and the effects ofincreased transportation costs on total harvested acreage was conduced in theupriver region. These impacts were allocated to the focus communities as apercentage of the total upriver region.
No data were available on the employment and income effects in the wood productsindustries nor were impacts calculated for other water dependent employment.
Table 33 shows the distribution of impacts by study subregion for both long-term andshort-term changes in employment.
Table 33Transportation Employment Impacts by Subregion
Region TotalEmployment
GrainTransport
PercentChange
FarmSpending
PercentChange
InfrastructureConstructionLow Estimate
PercentChange
UpriverDownriverReservoir
75,081151,12492,535
1810
294
0.240.000.32
-1000
-139
-0.130.0.00-0.15
255255
2045
0.340.172.21
LSRTotal 318,740 475 0.15 -239 -0.07 2555 0.80
4.1.3 Power
Power production under Alternatives A1 and A2 would remain essentially unchangedand would not significantly affect regional employment. Under Alternative A3, theeconomic impacts of changing the hydropower system involve more expensivereplacement power and would subsequently increase electrical utility rates. Inaddition, the operation and construction of replacement power plants would createjobs. The first of these impacts, rate changes, are dependent on the question of whopays for implementation as well as which rate-payers would see an increase directlyin their electrical rates. Since it is unknown who would pay for the implementation ofA3 or how the increased rates would be allocated, the regional and social analysisutilized the midpoint estimate from the Hydropower Team and distributed the impactevenly over the households in each of the affected states and subregions.
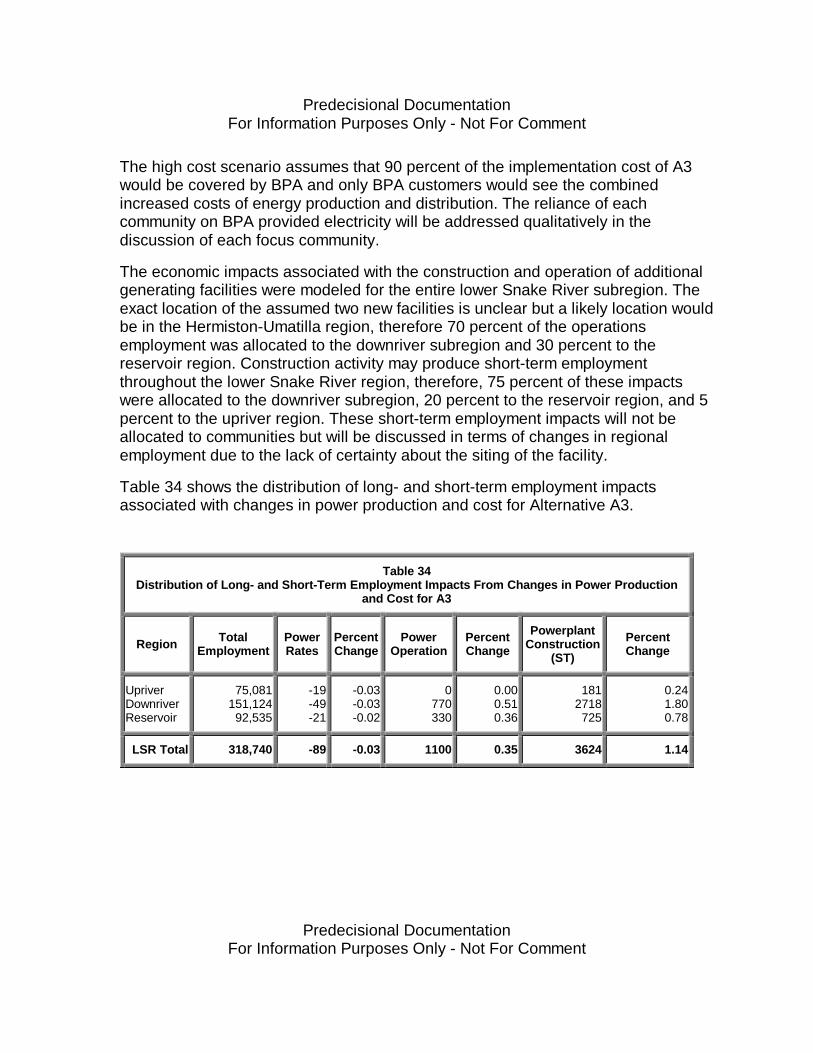
Predecisional DocumentationFor Information Purposes Only - Not For Comment
Predecisional DocumentationFor Information Purposes Only - Not For Comment
The high cost scenario assumes that 90 percent of the implementation cost of A3would be covered by BPA and only BPA customers would see the combinedincreased costs of energy production and distribution. The reliance of eachcommunity on BPA provided electricity will be addressed qualitatively in thediscussion of each focus community.
The economic impacts associated with the construction and operation of additionalgenerating facilities were modeled for the entire lower Snake River subregion. Theexact location of the assumed two new facilities is unclear but a likely location wouldbe in the Hermiston-Umatilla region, therefore 70 percent of the operationsemployment was allocated to the downriver subregion and 30 percent to thereservoir region. Construction activity may produce short-term employmentthroughout the lower Snake River region, therefore, 75 percent of these impactswere allocated to the downriver subregion, 20 percent to the reservoir region, and 5percent to the upriver region. These short-term employment impacts will not beallocated to communities but will be discussed in terms of changes in regionalemployment due to the lack of certainty about the siting of the facility.
Table 34 shows the distribution of long- and short-term employment impactsassociated with changes in power production and cost for Alternative A3.
Table 34Distribution of Long- and Short-Term Employment Impacts From Changes in Power Production
and Cost for A3
Region TotalEmployment
PowerRates
PercentChange
PowerOperation
PercentChange
PowerplantConstruction
(ST)
PercentChange
UpriverDownriverReservoir
75,081151,12492,535
-19-49-21
-0.03-0.03-0.02
0770330
0.000.510.36
1812718725
0.241.800.78
LSR Total 318,740 -89 -0.03 1100 0.35 3624 1.14
Predecisional DocumentationFor Information Purposes Only - Not For Comment
Predecisional DocumentationFor Information Purposes Only - Not For Comment
4.1.4 Recreation
Recreational opportunities, visitation, and economic benefits would remainessentially the same under alternatives A1 and A2 because employment changespredicted by the I-O model are based on the original PATH numbers. The economicimpacts of changed recreational opportunities under A3 were modeled for both theupriver and reservoir subregions. The size of these impacts is directly related to thenumber of users. User estimates generated by the recreation study team vary overtime. Associated economic impacts and employment projections vary accordingly.The following analysis uses the year 20 employment estimates based on the lowcontingent behavior results. This time frame coincides with the overall socialanalysis study period. Also, the majority of recreation activities are expected to haveresumed by this time (Corps, 1999, Benge table).
Recreation-related employment increases were allocated to communities in thereservoir subregion based on the overall ratio of community to reservoiremployment. The I-O analysis addressed potential effects to the lower Snake Riverregion and the reservoir and downriver subregions. Some communities downrivermay also receive recreation benefits. Potential employment increases in downrivercommunities were allocated based on the ratio of community to lower Snake Riverregion employment.
Recreation-related employment gain is unlikely to be distributed evenly across thecommunities in the upriver subregion. Some communities have existing recreationalsportfishing opportunities and would likely be the primary beneficiaries of increasedemployment. This issue is discussed further in the discussion of each community.
Table 35 shows the distribution of employment impacts to the study subregionscaused by forecast changes in recreational visitation (using a 20-year low estimate).
Table 35Employment Associated With Changes in Recreational Visitation by Subregion1
Region TotalEmployment
All Recreation Employment(20 Years Low Estimate)
PercentChange
UpriverDownriverReservoir
75,081151,12492,535
14990
701
2.000.000.76
LSR Total 318,740 2200 0.691These estimates are based on the 20-year low estimate (Loomis, 1999)

Predecisional DocumentationFor Information Purposes Only - Not For Comment
Predecisional DocumentationFor Information Purposes Only - Not For Comment
4.1.5 Implementation
Implementation of Alternative A2a represents approximately the same level of longterm operational spending throughout the lower Snake River subregion. AlternativeA2C, SBC with maximum transport, will result in minor additional expenditures andoperational employment. These impacts were distributed proportionally throughoutthe lower Snake River subregion.
The economic impacts of implementing Alternative A3 may be divided into twocategories. The first are long-term effects of decreased spending (avoided costs)and a decrease in regional employment. These impacts were modeled for the entirelower Snake River subregion. The allocation of the direct, indirect, and inducedemployment changes would follow the estimated distribution of direct employmentassociated with the current operation of the lower Snake River facilities (80 percentreservoir region, 10 percent upriver and 10 percent downriver). The allocation ofthese impacts to focus communities would be ground-truthed with estimates of thenumber of current Corps employees in each community.
The second area of impacts is those associated with the short-term constructionactivities of each of the alternatives. These impacts were modeled for the entirelower Snake River subregion. Alternative A2A would require additional short-termspending. The employment impacts were allocated to the subregions as follows: 40percent reservoir, 40 percent downriver, and 20 percent upriver. Allocation to focuscommunities in the subregions would follow a proportional distribution.
Table 36 shows the allocation of projected employment impacts from the lostoperations of the four lower Snake River facilities and the short-term constructionactivities associated with Alternative A3.
Table 36Distribution of Employment Impacts From Lost Operations and Short-Term Construction for A3
Region TotalEmployment
Lost ProjectOperations
PercentChange
Implementation(ST
Employment)A3
PercentChange
UpriverDownriverReservoir
75,081151,12492,535
-130-130
-1040
-0.17-0.09-1.12
60512101210
0.810.801.31
LSR Total 318,740 -1300 -0.41 3025 0.95
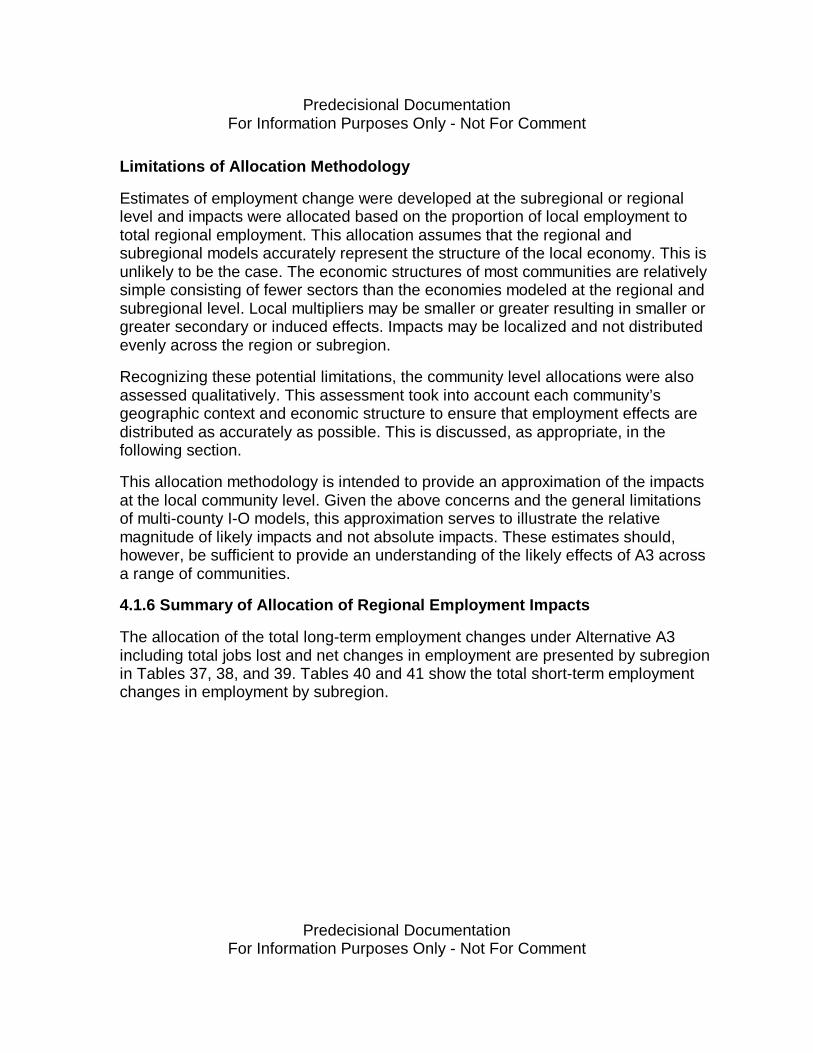
Predecisional DocumentationFor Information Purposes Only - Not For Comment
Predecisional DocumentationFor Information Purposes Only - Not For Comment
Limitations of Allocation Methodology
Estimates of employment change were developed at the subregional or regionallevel and impacts were allocated based on the proportion of local employment tototal regional employment. This allocation assumes that the regional andsubregional models accurately represent the structure of the local economy. This isunlikely to be the case. The economic structures of most communities are relativelysimple consisting of fewer sectors than the economies modeled at the regional andsubregional level. Local multipliers may be smaller or greater resulting in smaller orgreater secondary or induced effects. Impacts may be localized and not distributedevenly across the region or subregion.
Recognizing these potential limitations, the community level allocations were alsoassessed qualitatively. This assessment took into account each community’sgeographic context and economic structure to ensure that employment effects aredistributed as accurately as possible. This is discussed, as appropriate, in thefollowing section.
This allocation methodology is intended to provide an approximation of the impactsat the local community level. Given the above concerns and the general limitationsof multi-county I-O models, this approximation serves to illustrate the relativemagnitude of likely impacts and not absolute impacts. These estimates should,however, be sufficient to provide an understanding of the likely effects of A3 acrossa range of communities.
4.1.6 Summary of Allocation of Regional Employment Impacts
The allocation of the total long-term employment changes under Alternative A3including total jobs lost and net changes in employment are presented by subregionin Tables 37, 38, and 39. Tables 40 and 41 show the total short-term employmentchanges in employment by subregion.
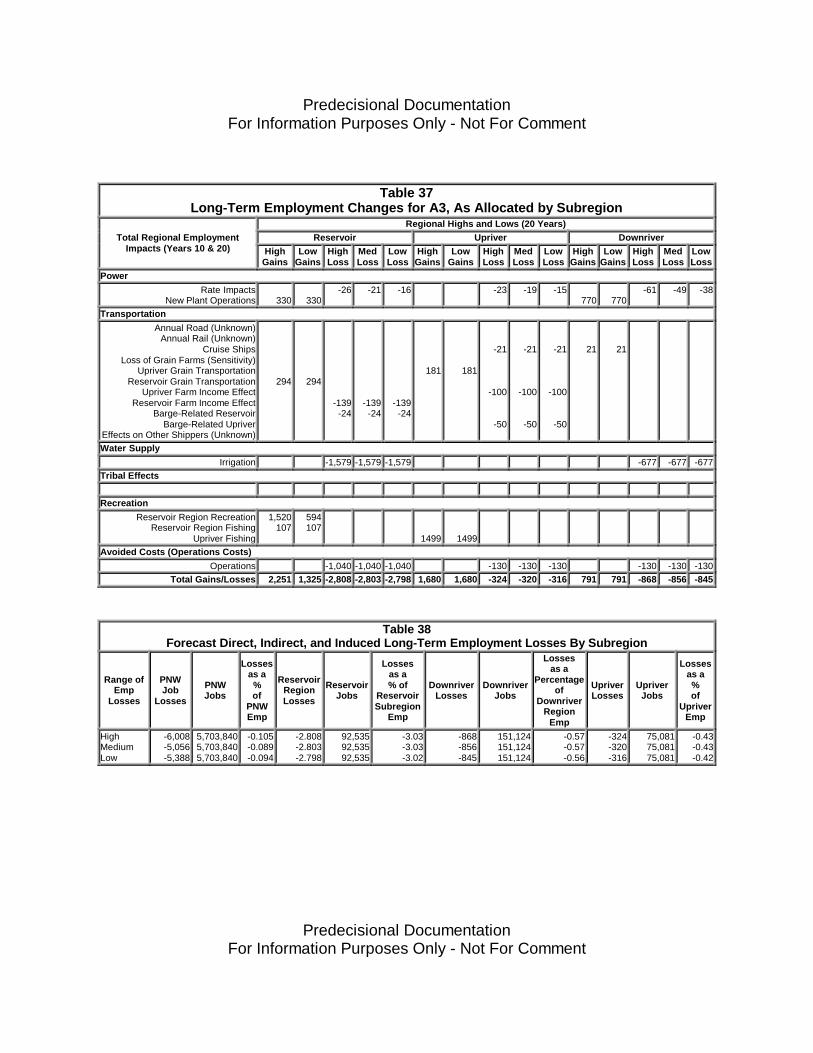
Predecisional DocumentationFor Information Purposes Only - Not For Comment
Predecisional DocumentationFor Information Purposes Only - Not For Comment
Table 37Long-Term Employment Changes for A3, As Allocated by Subregion
Regional Highs and Lows (20 Years)Reservoir Upriver DownriverTotal Regional Employment
Impacts (Years 10 & 20) HighGains
LowGains
HighLoss
MedLoss
LowLoss
HighGains
LowGains
HighLoss
MedLoss
LowLoss
HighGains
LowGains
HighLoss
MedLoss
LowLoss
PowerRate Impacts
New Plant Operations 330 330-26 -21 -16 -23 -19 -15
770 770-61 -49 -38
TransportationAnnual Road (Unknown)
Annual Rail (Unknown)Cruise Ships
Loss of Grain Farms (Sensitivity)Upriver Grain Transportation
Reservoir Grain TransportationUpriver Farm Income Effect
Reservoir Farm Income EffectBarge-Related Reservoir
Barge-Related UpriverEffects on Other Shippers (Unknown)
294 294
-139-24
-139-24
-139-24
181 181
-21
-100
-50
-21
-100
-50
-21
-100
-50
21 21
Water SupplyIrrigation -1,579 -1,579 -1,579 -677 -677 -677
Tribal Effects
RecreationReservoir Region Recreation
Reservoir Region FishingUpriver Fishing
1,520107
594107
1499 1499Avoided Costs (Operations Costs)
Operations -1,040 -1,040 -1,040 -130 -130 -130 -130 -130 -130Total Gains/Losses 2,251 1,325 -2,808 -2,803 -2,798 1,680 1,680 -324 -320 -316 791 791 -868 -856 -845
Table 38Forecast Direct, Indirect, and Induced Long-Term Employment Losses By Subregion
Range ofEmp
Losses
PNWJob
Losses
PNWJobs
Lossesas a
%of
PNWEmp
ReservoirRegionLosses
ReservoirJobs
Lossesas a% of
ReservoirSubregion
Emp
DownriverLosses
DownriverJobs
Lossesas a
Percentageof
DownriverRegion
Emp
UpriverLosses
UpriverJobs
Lossesas a%of
UpriverEmp
HighMediumLow
-6,008-5,056-5,388
5,703,8405,703,8405,703,840
-0.105-0.089-0.094
-2.808-2.803-2.798
92,53592,53592,535
-3.03-3.03-3.02
-868-856-845
151,124151,124151,124
-0.57-0.57-0.56
-324-320-316
75,08175,08175,081
-0.43-0.43-0.42
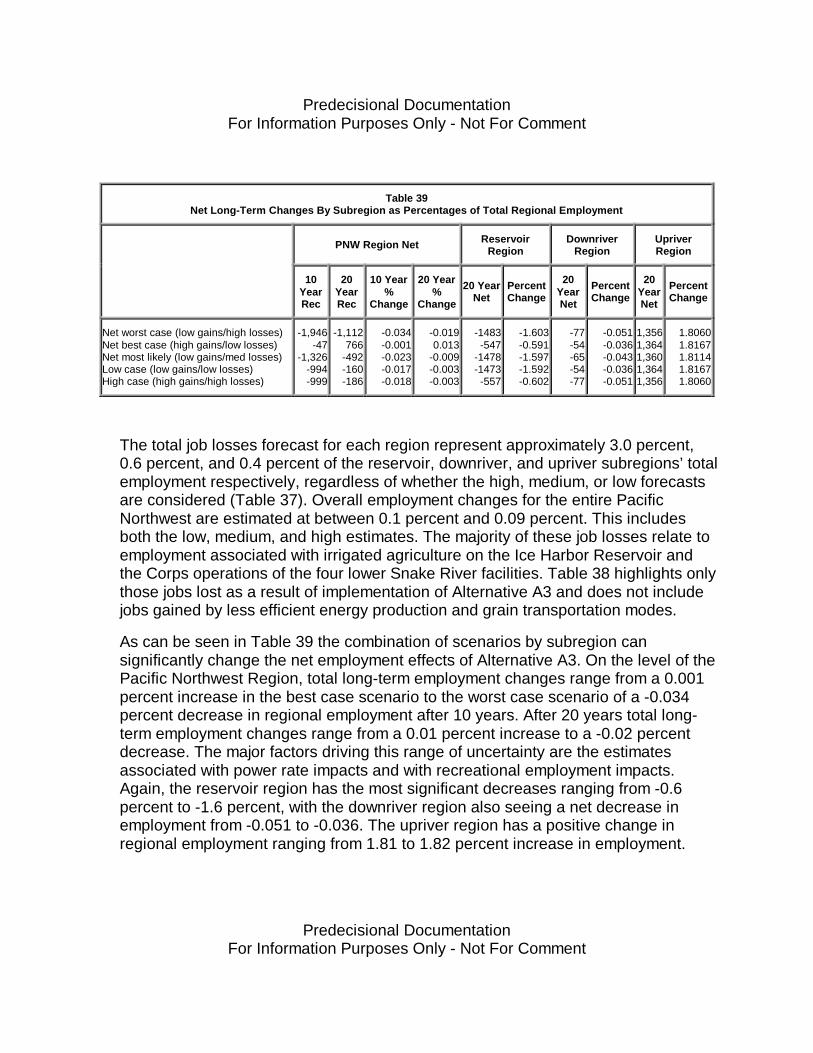
Predecisional DocumentationFor Information Purposes Only - Not For Comment
Predecisional DocumentationFor Information Purposes Only - Not For Comment
Table 39Net Long-Term Changes By Subregion as Percentages of Total Regional Employment
PNW Region Net ReservoirRegion
DownriverRegion
UpriverRegion
10YearRec
20YearRec
10 Year%
Change
20 Year%
Change
20 YearNet
PercentChange
20YearNet
PercentChange
20YearNet
PercentChange
Net worst case (low gains/high losses)Net best case (high gains/low losses)Net most likely (low gains/med losses)Low case (low gains/low losses)High case (high gains/high losses)
-1,946-47
-1,326-994-999
-1,112766
-492-160-186
-0.034-0.001-0.023-0.017-0.018
-0.0190.013
-0.009-0.003-0.003
-1483-547
-1478-1473-557
-1.603-0.591-1.597-1.592-0.602
-77-54-65-54-77
-0.051-0.036-0.043-0.036-0.051
1,3561,3641,3601,3641,356
1.80601.81671.81141.81671.8060
The total job losses forecast for each region represent approximately 3.0 percent,0.6 percent, and 0.4 percent of the reservoir, downriver, and upriver subregions’ totalemployment respectively, regardless of whether the high, medium, or low forecastsare considered (Table 37). Overall employment changes for the entire PacificNorthwest are estimated at between 0.1 percent and 0.09 percent. This includesboth the low, medium, and high estimates. The majority of these job losses relate toemployment associated with irrigated agriculture on the Ice Harbor Reservoir andthe Corps operations of the four lower Snake River facilities. Table 38 highlights onlythose jobs lost as a result of implementation of Alternative A3 and does not includejobs gained by less efficient energy production and grain transportation modes.
As can be seen in Table 39 the combination of scenarios by subregion cansignificantly change the net employment effects of Alternative A3. On the level of thePacific Northwest Region, total long-term employment changes range from a 0.001percent increase in the best case scenario to the worst case scenario of a -0.034percent decrease in regional employment after 10 years. After 20 years total long-term employment changes range from a 0.01 percent increase to a -0.02 percentdecrease. The major factors driving this range of uncertainty are the estimatesassociated with power rate impacts and with recreational employment impacts.Again, the reservoir region has the most significant decreases ranging from -0.6percent to -1.6 percent, with the downriver region also seeing a net decrease inemployment from -0.051 to -0.036. The upriver region has a positive change inregional employment ranging from 1.81 to 1.82 percent increase in employment.
Predecisional DocumentationFor Information Purposes Only - Not For Comment
Predecisional DocumentationFor Information Purposes Only - Not For Comment
Short-term construction employment is forecast assuming that these changes aremade to existing infrastructure. None of these changes are included in the Corpsimplementation plan except for those expenditures associated directly withimplementation of Alternative A3.
Tables 40 and 41 show that peak short-term employment would contributesignificantly to each of the study subregions. The reservoir region would experienceapproximately 5 to 6 percent in regional employment while the downriver and upriversubregions would experience increases from 2.9 to 3.0 and 2.1 to 3.7 percent,respectively.
Table 40Forecast Peak Short-Term Employment Impacts (A3), As Allocated By Subregion
Total EmploymentChange Water Reservoir Upriver Downriver
Peak Short-Term Employment(Occurs Over Years 1-7)
High Low High Low High Low High Low
Power
Short-Term Construction 3,625 3,625 725 725 181 181 2,719 2,719
Transportation
Short-Term Road ConstructionShort-Term Rail Construction
Short-Term Facilities Upgrades
2,1491,1181,095
1,195811548
1,719894876
956649438
215112110
1208155
215112110
1128155
Water Supply
Short-Term Well ModificationShort-Term Pump Modification
1,1751,397
1,175292
588140
58830
2941,257
294263
294 294
Tribal Effects
Unknown
Implementation
Construction Modification 3,025 3,025 1,210 1,210 605 605 1,210 1,210
Total Employment Gains 13,584 10,671 6,152 4,595 2,774 1,599 4,659 4,478
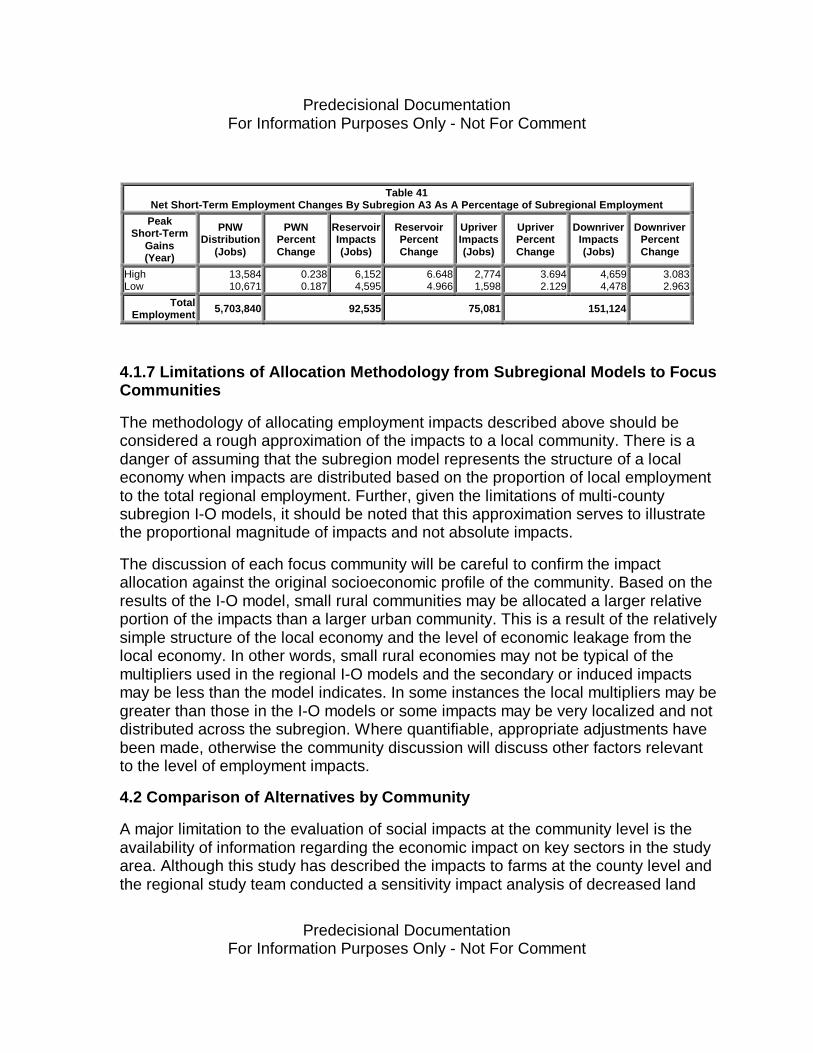
Predecisional DocumentationFor Information Purposes Only - Not For Comment
Predecisional DocumentationFor Information Purposes Only - Not For Comment
Table 41Net Short-Term Employment Changes By Subregion A3 As A Percentage of Subregional Employment
PeakShort-Term
Gains(Year)
PNWDistribution
(Jobs)
PWNPercentChange
ReservoirImpacts(Jobs)
ReservoirPercentChange
UpriverImpacts(Jobs)
UpriverPercentChange
DownriverImpacts(Jobs)
DownriverPercentChange
HighLow
13,58410,671
0.2380.187
6,1524,595
6.6484.966
2,7741,598
3.6942.129
4,6594,478
3.0832.963
TotalEmployment 5,703,840 92,535 75,081 151,124
4.1.7 Limitations of Allocation Methodology from Subregional Models to FocusCommunities
The methodology of allocating employment impacts described above should beconsidered a rough approximation of the impacts to a local community. There is adanger of assuming that the subregion model represents the structure of a localeconomy when impacts are distributed based on the proportion of local employmentto the total regional employment. Further, given the limitations of multi-countysubregion I-O models, it should be noted that this approximation serves to illustratethe proportional magnitude of impacts and not absolute impacts.
The discussion of each focus community will be careful to confirm the impactallocation against the original socioeconomic profile of the community. Based on theresults of the I-O model, small rural communities may be allocated a larger relativeportion of the impacts than a larger urban community. This is a result of the relativelysimple structure of the local economy and the level of economic leakage from thelocal economy. In other words, small rural economies may not be typical of themultipliers used in the regional I-O models and the secondary or induced impactsmay be less than the model indicates. In some instances the local multipliers may begreater than those in the I-O models or some impacts may be very localized and notdistributed across the subregion. Where quantifiable, appropriate adjustments havebeen made, otherwise the community discussion will discuss other factors relevantto the level of employment impacts.
4.2 Comparison of Alternatives by Community
A major limitation to the evaluation of social impacts at the community level is theavailability of information regarding the economic impact on key sectors in the studyarea. Although this study has described the impacts to farms at the county level andthe regional study team conducted a sensitivity impact analysis of decreased land
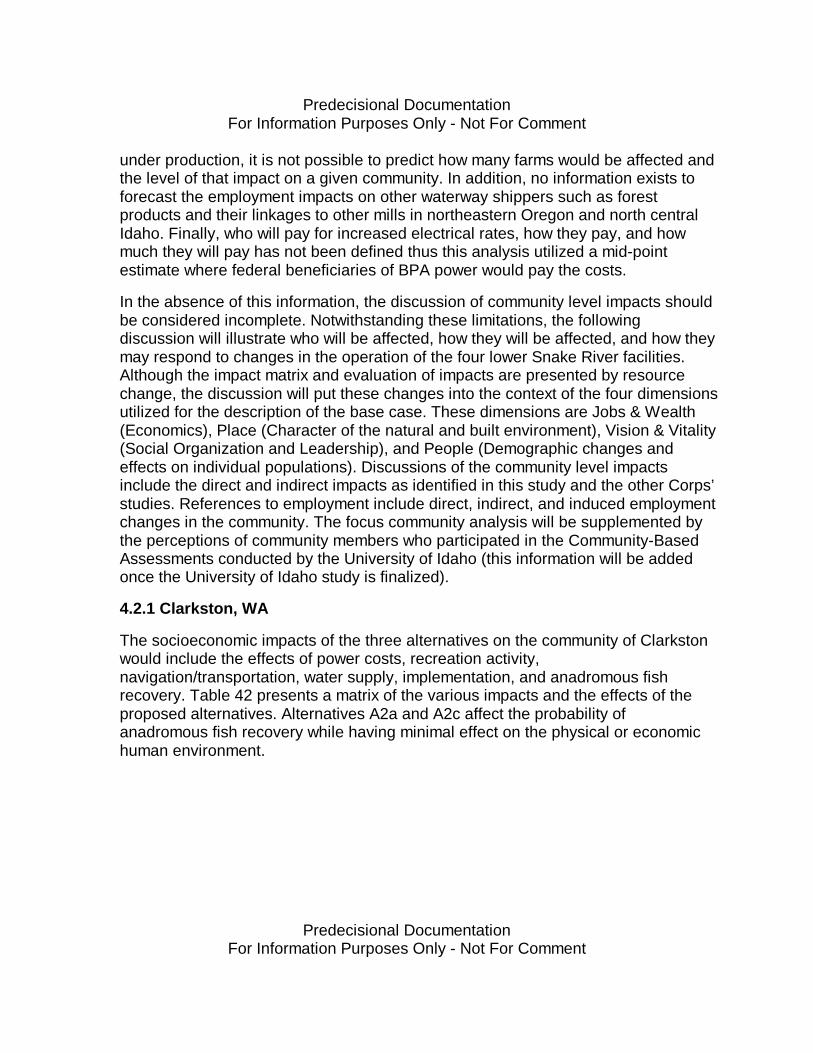
Predecisional DocumentationFor Information Purposes Only - Not For Comment
Predecisional DocumentationFor Information Purposes Only - Not For Comment
under production, it is not possible to predict how many farms would be affected andthe level of that impact on a given community. In addition, no information exists toforecast the employment impacts on other waterway shippers such as forestproducts and their linkages to other mills in northeastern Oregon and north centralIdaho. Finally, who will pay for increased electrical rates, how they pay, and howmuch they will pay has not been defined thus this analysis utilized a mid-pointestimate where federal beneficiaries of BPA power would pay the costs.
In the absence of this information, the discussion of community level impacts shouldbe considered incomplete. Notwithstanding these limitations, the followingdiscussion will illustrate who will be affected, how they will be affected, and how theymay respond to changes in the operation of the four lower Snake River facilities.Although the impact matrix and evaluation of impacts are presented by resourcechange, the discussion will put these changes into the context of the four dimensionsutilized for the description of the base case. These dimensions are Jobs & Wealth(Economics), Place (Character of the natural and built environment), Vision & Vitality(Social Organization and Leadership), and People (Demographic changes andeffects on individual populations). Discussions of the community level impactsinclude the direct and indirect impacts as identified in this study and the other Corps’studies. References to employment include direct, indirect, and induced employmentchanges in the community. The focus community analysis will be supplemented bythe perceptions of community members who participated in the Community-BasedAssessments conducted by the University of Idaho (this information will be addedonce the University of Idaho study is finalized).
4.2.1 Clarkston, WA
The socioeconomic impacts of the three alternatives on the community of Clarkstonwould include the effects of power costs, recreation activity,navigation/transportation, water supply, implementation, and anadromous fishrecovery. Table 42 presents a matrix of the various impacts and the effects of theproposed alternatives. Alternatives A2a and A2c affect the probability ofanadromous fish recovery while having minimal effect on the physical or economichuman environment.

Predecisional DocumentationFor Information Purposes Only - Not For Comment
Predecisional DocumentationFor Information Purposes Only - Not For Comment
Table 42Clarkston Evaluation Matrix of Impacts
Alt Indicators/Impact Measure Evaluation Criteria
Planningand
DecisionMaking
Short-Term
Effects
Long-Term
Effects
PowerA3A3A3A3
Residential Rate IncreasesRate Employment ImpactsPower Provider Risk RateFixed Income Ratepayers
Residential Rate Increase >5 percentDecrease in Employment <1 percentInvestor-Owned UtilityPoverty Rate >10 percent of all families
-----
-----
RecreationA3A3A3A3A3A3A3
Non-Fishing River Recreation
Anadromous Fishing Recreation
Site AccessSite ServicesElderly Recreationists
Increase in Employment >1 percentShort- Term DisplacementIncrease in Employment <1 percentShort-Term DisplacementDecrease in Site Access >25 percentDecrease in Site Services >25 percentOver 65 Years >20 percent
++-
-------
++
+
------
TransportationA3A3A3A3
A3
A3A3
A3A3A3A3
Transport-Related EmploymentFarm Spending Related EmpFarm IncomeCounty Property Tax Revenue
County Sales Tax Revenue
Road, Rail, & Infrast ConstRoad, Rail,& Infrastructure Maint
Grain Transportation CostsFarm ConsolidationTransport Costs (Other Shippers)Transport Capacity UncertaintyHighway CongestionHighway Safety
Increase in Employment <1 percentDecrease in Employment <1 percentDecrease in Total Cty Farm Income <10%Decrease in Property Tax Revenue >2%Decrease in Tax Revenue <2%Increase in Sales Tax RevenueDecrease in Sales Tax RevenueIncrease in Employment >1 percentIncrease in Employment >1 percentIncrease in Employment <1 percentIncrease in Cost >15 cents/bushelIncreased Rate of Farm ConsolidationIncrease in Transportation CostIncrease in Transportation UncertaintyIncrease in Traffic Congestion <2 percentDecrease in Highway Safety
-
+-----+-
+++++-------
+-----+-
+++----
--
Water SupplyA3A3
ST Pump Modifications Increase in Employment >1 percentIncreased costs for well irrigators/users
++-
Implementation/Avoided CostsA3A2cA3A3A2c
Implementation Employment
Outside WorkersOperations Employment
Increase in Employment >1 percentIncrease in Employment <1 percentIncrease in Outside Workers >10 percentDecrease in Employment >1 percentIncrease in Employment <1 percent
+++----+
--+
Anadromous Fish RecoveryA3A3A2A2A3A2A3
Social CohesionRecovery Uncertainty
Business Uncertainty
Extinction Risk
Decreased Social CohesionLower Uncertainty of Salmon RecoveryHigher Uncertainty of Salmon RecoveryLower Economic UncertaintyHigher Economic UncertaintyHigher Extinction RiskLower Extinction Risk
-
--+
-+-+-
+-+-
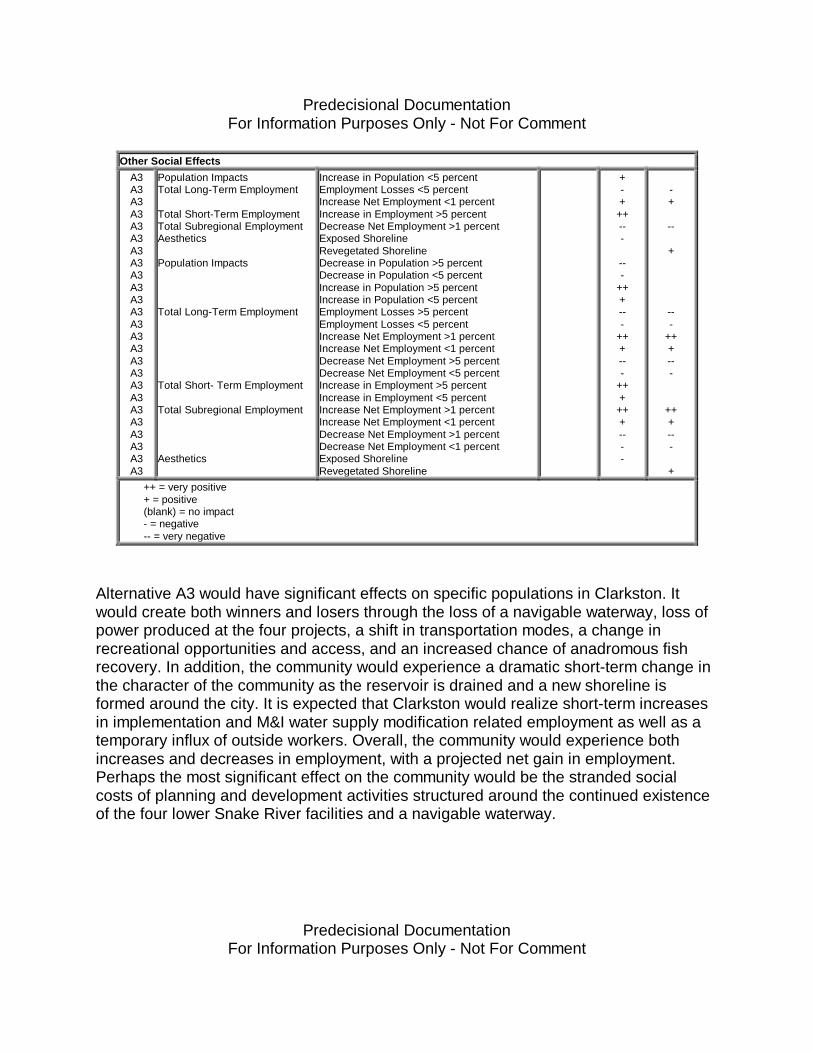
Predecisional DocumentationFor Information Purposes Only - Not For Comment
Predecisional DocumentationFor Information Purposes Only - Not For Comment
Other Social EffectsA3A3A3A3A3A3A3A3A3A3A3A3A3A3A3A3A3A3A3A3A3A3A3A3A3
Population ImpactsTotal Long-Term Employment
Total Short-Term EmploymentTotal Subregional EmploymentAesthetics
Population Impacts
Total Long-Term Employment
Total Short- Term Employment
Total Subregional Employment
Aesthetics
Increase in Population <5 percentEmployment Losses <5 percentIncrease Net Employment <1 percentIncrease in Employment >5 percentDecrease Net Employment >1 percentExposed ShorelineRevegetated ShorelineDecrease in Population >5 percentDecrease in Population <5 percentIncrease in Population >5 percentIncrease in Population <5 percentEmployment Losses >5 percentEmployment Losses <5 percentIncrease Net Employment >1 percentIncrease Net Employment <1 percentDecrease Net Employment >5 percentDecrease Net Employment <5 percentIncrease in Employment >5 percentIncrease in Employment <5 percentIncrease Net Employment >1 percentIncrease Net Employment <1 percentDecrease Net Employment >1 percentDecrease Net Employment <1 percentExposed ShorelineRevegetated Shoreline
+-+++---
---
+++---
+++---
++++++----
-+
--
+
---
+++---
+++---
+++ = very positive+ = positive(blank) = no impact- = negative-- = very negative
Alternative A3 would have significant effects on specific populations in Clarkston. Itwould create both winners and losers through the loss of a navigable waterway, loss ofpower produced at the four projects, a shift in transportation modes, a change inrecreational opportunities and access, and an increased chance of anadromous fishrecovery. In addition, the community would experience a dramatic short-term change inthe character of the community as the reservoir is drained and a new shoreline isformed around the city. It is expected that Clarkston would realize short-term increasesin implementation and M&I water supply modification related employment as well as atemporary influx of outside workers. Overall, the community would experience bothincreases and decreases in employment, with a projected net gain in employment.Perhaps the most significant effect on the community would be the stranded socialcosts of planning and development activities structured around the continued existenceof the four lower Snake River facilities and a navigable waterway.
Predecisional DocumentationFor Information Purposes Only - Not For Comment
Predecisional DocumentationFor Information Purposes Only - Not For Comment
Jobs & Wealth
Overall, Alternatives A2a and A2c provide a higher degree of certainty about theeconomic future of Clarkston and do not adversely affect jobs and wealth directly.Alternative A3 adversely affects future economic certainty and increases futureeconomic risks because not all of the indirect and induced effects of these changes areknown. For example, it is unclear how the increased capital costs of pump and wellmodifications would affect Potlatch operations, the Clarkston Golf Course, or irrigatorsalong the Lower Granite pool.
Negative impacts on community employment from Alternative A3 would result fromincreased residential electrical rates, reduction in county-wide farm income, loss ofCorps related jobs, loss of water related port operations, loss of tour boat-relatedemployment, and short-term decreased recreational opportunities. Farmers and othershippers currently utilizing the waterway to ship bulk products would experienceincreased costs to ship their goods and this may have a negative effect on employmentin those economic sectors. Only Corps-related employment is projected to exceed a 1percent decrease.
Positive impacts on community employment from Alternative A3 would result from trucktransportation, post-implementation increases in river recreation-related activities,increased anadromous fishing opportunities, road maintenance, and the short-termincreases in employment from implementation activities and modifications to wells andwater pumps.
The effects of these changes on the largest employers demonstrate the degree to whichthere would be winners and losers in Clarkston. Potlatch Corporation is the largestemployer in the Valley and would be negatively affected by higher shipping costs forsome of their products. On the other hand, Poe Asphalt would likely benefit from boththe short-term construction related implementation activities and the long-term roadmaintenance.
Place
Clarkston’s natural and built environment would change dramatically under AlternativeA3 much like it did 25 years ago when the pools were filled and orchards wereinundated. Adverse impacts from the loss of the Lower Granite pool include the short-term exposure of shoreline and mudflats. The community would lose recreationalaccess sites at Chief Lookinglass Park and Nisqually John Landing as well as losing
Predecisional DocumentationFor Information Purposes Only - Not For Comment
Predecisional DocumentationFor Information Purposes Only - Not For Comment
some recreational site services at Chief Timothy State Park, Hells Canyon Resort,Southway Park, and Hells Gate State Park. In addition, the community would havesome short-term displacement from steelhead and salmon fishing as well asdisplacement from other river related recreation. The identity of the community as aworking water port would also be adversely affected although it would still retain itsidentity as a Snake River community and the gateway to Hells Canyon.
Another adverse affect of Alternative A3 would be an increase in truck traffic through thecommunity and the county with a corresponding increased risk of traffic accidents.Additionally, the financial pressures exerted on local farmers from higher transportationcosts may lead to a greater consolidation of farms and a change in the rural-urbaninterface of Clarkston.
Long-term benefits of Alternative A3 would include the revegatation and restoration ofthe normative Snake River and the community shoreline. Additionally, the increasedchance of salmon recovery would benefit the identity of the community as a place wheresalmon continue to exist and local fishermen continue to pursue this element of theClarkston’s quality of life. Alternatives A2a and A2c have higher risks associated withsalmon recovery and may, therefore, adversely affect community quality of life.
Vision & Vitality
Alternatives A2a, A2c, and A3 all adversely affect Clarkston’s vision and vitality bydecreasing the social cohesion of the community over the issue of salmon recovery andthe best way to achieve that goal. Adverse effects of a change in the economic directionand identity of the community under Alternative A3 may include a pessimistic vision ofnot being able to control the community’s future. The community has worked to developrecreational opportunities associated with the lower Snake River reservoirs, to bring tourboats from Portland into the community, to utilize the port as a developmentmechanism, and to develop retirement opportunities. Many of these plans would besignificantly affected under this alternative. Additionally, the negative short- and long-term effects on both local and county property values and property tax revenue maycreate difficulties in obtaining sufficient funding to pursue new avenues of economicdevelopment and maintain the current level of community services.
Predecisional DocumentationFor Information Purposes Only - Not For Comment
Predecisional DocumentationFor Information Purposes Only - Not For Comment
People
Changes in the physical and economic human environment would affect distinctpopulations in the community. The high number of fixed income families would berequired to pay a larger proportion of their income to power bills. The growing elderlypopulation in Clarkston may be physically unable to engage in the new recreationalopportunities on a free-flowing lower Snake River. Finally, the influx of short-termoutside workers may disrupt traditional community patterns although the number offorecast workers is relatively small compared to the workforce that originally constructedthe lower Snake facilities.
The forecast increase in long-term employment under Alternative A3 suggests thatpopulation trends should continue to increase but given the uncertainties associatedwith the business climate, overall population may remain stable or decrease slightlygiven short-term job losses.
4.2.2 Colfax
The socioeconomic impacts of the three alternatives on the community of Colfax wouldinclude the effects of power costs, recreation activity, navigation/transportation, watersupply, implementation, and anadromous fish recovery. Table 43 presents a matrix ofthe various impacts and the effects of the proposed alternatives. Alternatives A2a andA2c affect the probability of anadromous fish recovery while having minimal effect onthe physical or economic human environment. Alternative A3 would have significanteffects on specific populations in Colfax. It would adversely affect the communityprimarily through the loss of a navigable waterway, the corresponding shift intransportation modes to more expensive rail and truck movements, and a decrease incountywide net farm income and a drop in property values for agricultural lands. It isexpected that Colfax would realize short-term increases in implementation and wellmodification related employment as well as a small temporary influx of outside workers.Overall, the community would experience both increases and decreases in employment,with a projected net loss in employment. The most significant effect on the communitywould be the additional financial pressures on grain farms from increasedtransportation, storage and handling costs, and the uncertainty of how the transportationsystem and individual farms would respond. The cumulative effects of Alternative A3and the proposed phase out of the loan deficiency payments under the Freedom toFarm Act create an even greater uncertainty to individual farmers and farm communitieslike Colfax.
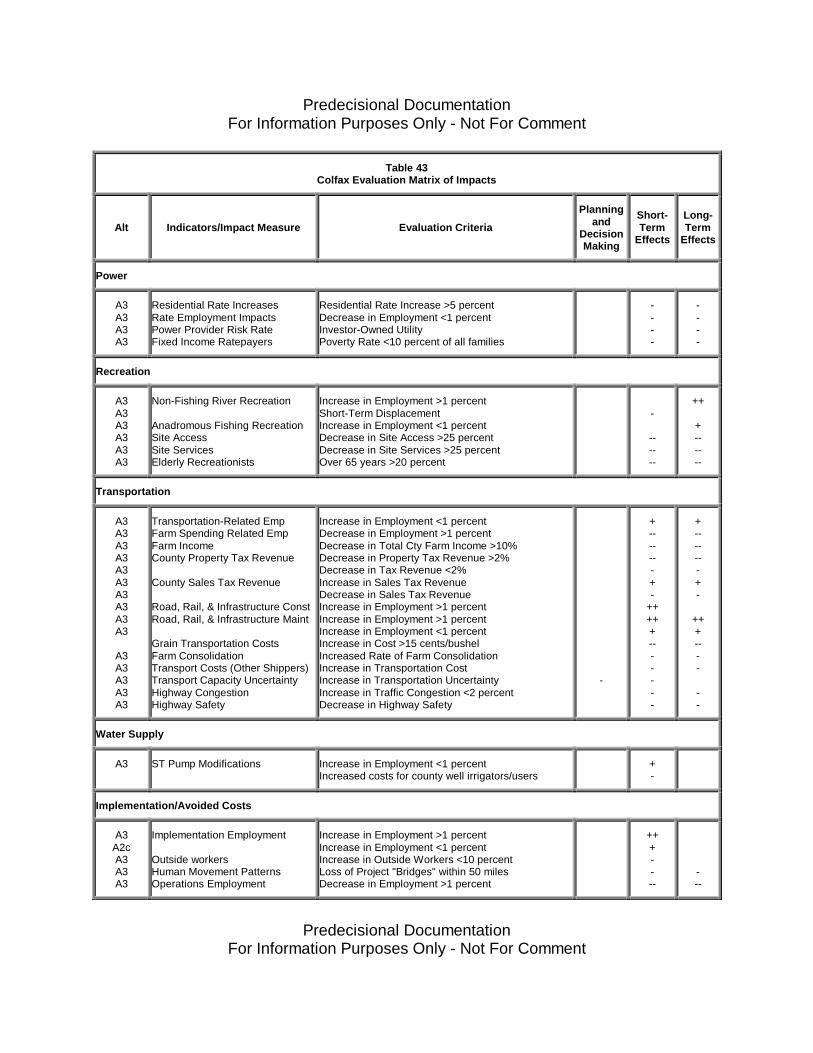
Predecisional DocumentationFor Information Purposes Only - Not For Comment
Predecisional DocumentationFor Information Purposes Only - Not For Comment
Table 43Colfax Evaluation Matrix of Impacts
Alt Indicators/Impact Measure Evaluation Criteria
Planningand
DecisionMaking
Short-Term
Effects
Long-Term
Effects
Power
A3A3A3A3
Residential Rate IncreasesRate Employment ImpactsPower Provider Risk RateFixed Income Ratepayers
Residential Rate Increase >5 percentDecrease in Employment <1 percentInvestor-Owned UtilityPoverty Rate <10 percent of all families
----
----
Recreation
A3A3A3A3A3A3
Non-Fishing River Recreation
Anadromous Fishing RecreationSite AccessSite ServicesElderly Recreationists
Increase in Employment >1 percentShort-Term DisplacementIncrease in Employment <1 percentDecrease in Site Access >25 percentDecrease in Site Services >25 percentOver 65 years >20 percent
-
------
++
+------
Transportation
A3A3A3A3A3A3A3A3A3A3
A3A3A3A3A3
Transportation-Related EmpFarm Spending Related EmpFarm IncomeCounty Property Tax Revenue
County Sales Tax Revenue
Road, Rail, & Infrastructure ConstRoad, Rail, & Infrastructure Maint
Grain Transportation CostsFarm ConsolidationTransport Costs (Other Shippers)Transport Capacity UncertaintyHighway CongestionHighway Safety
Increase in Employment <1 percentDecrease in Employment >1 percentDecrease in Total Cty Farm Income >10%Decrease in Property Tax Revenue >2%Decrease in Tax Revenue <2%Increase in Sales Tax RevenueDecrease in Sales Tax RevenueIncrease in Employment >1 percentIncrease in Employment >1 percentIncrease in Employment <1 percentIncrease in Cost >15 cents/bushelIncreased Rate of Farm ConsolidationIncrease in Transportation CostIncrease in Transportation UncertaintyIncrease in Traffic Congestion <2 percentDecrease in Highway Safety
-
+-------+-
+++++-------
+-------+-
+++----
--
Water Supply
A3 ST Pump Modifications Increase in Employment <1 percentIncreased costs for county well irrigators/users
+-
Implementation/Avoided Costs
A3A2cA3A3A3
Implementation Employment
Outside workersHuman Movement PatternsOperations Employment
Increase in Employment >1 percentIncrease in Employment <1 percentIncrease in Outside Workers <10 percentLoss of Project "Bridges" within 50 milesDecrease in Employment >1 percent
+++----
---
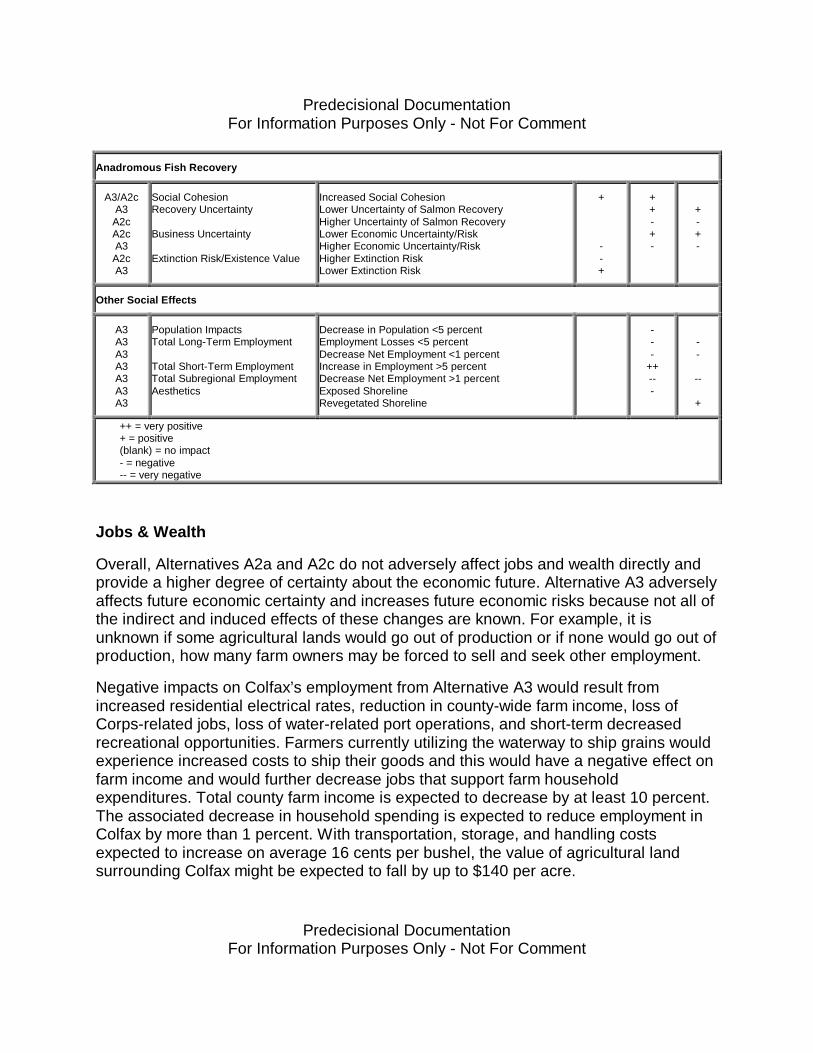
Predecisional DocumentationFor Information Purposes Only - Not For Comment
Predecisional DocumentationFor Information Purposes Only - Not For Comment
Anadromous Fish Recovery
A3/A2cA3A2cA2cA3A2cA3
Social CohesionRecovery Uncertainty
Business Uncertainty
Extinction Risk/Existence Value
Increased Social CohesionLower Uncertainty of Salmon RecoveryHigher Uncertainty of Salmon RecoveryLower Economic Uncertainty/RiskHigher Economic Uncertainty/RiskHigher Extinction RiskLower Extinction Risk
+
--+
++-+-
+-+-
Other Social Effects
A3A3A3A3A3A3A3
Population ImpactsTotal Long-Term Employment
Total Short-Term EmploymentTotal Subregional EmploymentAesthetics
Decrease in Population <5 percentEmployment Losses <5 percentDecrease Net Employment <1 percentIncrease in Employment >5 percentDecrease Net Employment >1 percentExposed ShorelineRevegetated Shoreline
---
++---
--
--
+
++ = very positive+ = positive(blank) = no impact- = negative-- = very negative
Jobs & Wealth
Overall, Alternatives A2a and A2c do not adversely affect jobs and wealth directly andprovide a higher degree of certainty about the economic future. Alternative A3 adverselyaffects future economic certainty and increases future economic risks because not all ofthe indirect and induced effects of these changes are known. For example, it isunknown if some agricultural lands would go out of production or if none would go out ofproduction, how many farm owners may be forced to sell and seek other employment.
Negative impacts on Colfax’s employment from Alternative A3 would result fromincreased residential electrical rates, reduction in county-wide farm income, loss ofCorps-related jobs, loss of water-related port operations, and short-term decreasedrecreational opportunities. Farmers currently utilizing the waterway to ship grains wouldexperience increased costs to ship their goods and this would have a negative effect onfarm income and would further decrease jobs that support farm householdexpenditures. Total county farm income is expected to decrease by at least 10 percent.The associated decrease in household spending is expected to reduce employment inColfax by more than 1 percent. With transportation, storage, and handling costsexpected to increase on average 16 cents per bushel, the value of agricultural landsurrounding Colfax might be expected to fall by up to $140 per acre.
Predecisional DocumentationFor Information Purposes Only - Not For Comment
Predecisional DocumentationFor Information Purposes Only - Not For Comment
Positive impacts on community employment from Alternative A3 would result from anincrease in truck and rail transportation employment, post-implementation increases inriver recreation- related activities, increased anadromous fishing opportunities, andongoing road maintenance. The increase in trucking- and rail transportation-relatedemployment may be higher than predicted by the allocation of employment impacts dueto the large volumes of grain produced in the lands surrounding Colfax and the positionof Colfax on the highway that would carry a large load of the traffic. Short-termincreases in employment would result from implementation activities, modifications towells along the river, and upgrades to road and rail infrastructure.
Place
Colfax’s natural and built environment would not change dramatically under AlternativeA3. Changes would occur in the surrounding patterns of land ownership and in theaccess and recreational opportunities available on the nearby lower Snake River.Adverse impacts from the loss of the Lower Granite pool include the loss of developedaccess at recreational sites such as Wawawai County Park, Illia Dunes Landing, WillowLanding, Little Goose Landing, and Lyons Ferry Marina. Additionally, recreationservices would be diminished at sites such as Boyer Park and Marina, Central FerryState Park, and Chief Timothy State Park. In addition, the community would have someshort-term displacement from steelhead and salmon fishing, as well as displacementfrom other river-related recreation as boat ramps are modified and the riverbank isrevegetated. The identity of the community as an agricultural community should not beadversely affected by Alternative A3. The community would still continue to be the heartof the Palouse and a leader in wheat and lentil production.
Another adverse affect of Alternative A3 would be the financial pressures exerted onlocal farmers from higher transportation costs. This may lead to a greater consolidationof farms and a decrease in the number of community members active in the farmingindustry either directly or indirectly. With or without a navigable waterway, Colfax wouldcontinue to be a transportation hub for the movement of grain commodities produced inWhitman and neighboring counties. Truck traffic patterns would shift from a north-southorientation to an east-west orientation with an estimated slight increase in overall trafficthrough town. This may be economically beneficial but adverse for congestion andsafety through downtown and on state highway 26 westbound. Finally, Colfax wouldlose a river crossing at the Lower Granite facility that provides an alternativetransportation corridor between Colfax and Pomeroy in Garfield County.
Predecisional DocumentationFor Information Purposes Only - Not For Comment
Predecisional DocumentationFor Information Purposes Only - Not For Comment
Long-term benefits of Alternative A3 would include the revegatation and restoration ofthe normative Snake River. Additionally, the increased chance of salmon recoverywould benefit the identity of the community as a place where salmon continue to existand local fishermen continue to pursue this element of the Colfax’s quality of life.Alternatives A2a and A2c have higher risks associated with salmon recovery and mayadversely affect this element of Colfax’s quality of life.
Vision & Vitality
Alternatives A2a, A2c, and A3 would adversely affect Colfax’s vision and vitality bydecreasing the social cohesion of the community over the issue of salmon recovery andthe best way to achieve that goal. The community has been united in its opposition toAlternative A3 and has been working through their political representatives to make thisissue clear. Adverse effects of a change in the economic direction and identity of thecommunity under Alternative A3 may challenge the leadership and vision of thecommunity to provide cost effective means of transporting the large volumes of grains tomarket. One key factor that would challenge this response is the lack of certainty aboutthe capacity of alternative modes of transportation to handle the volume of productioncurrently shipped on the lower Snake River.
The community has worked to successfully develop industrial and shipping facilities withthe Port of Whitman County. Some of these developments such as the industrial parkssited away from the river would be unaffected by the change in the waterway, whileother facilities on the river would become obsolete. Perhaps the most significant impacton the vision and vitality of the community would be the expected drop in property taxrevenue both from agricultural and non-agricultural lands. The community would befaced with either raising tax rates or cutting social services. Neither of these choices isharmonious with the community’s future plans and would limit investments in theeconomic diversification efforts. One ameliorating factor would be that property taxrevenue would not change overnight but rather would be phased in over a five-yearperiod of decreased farm income.
Predecisional DocumentationFor Information Purposes Only - Not For Comment
Predecisional DocumentationFor Information Purposes Only - Not For Comment
People
Changes in the physical and economic human environment would affect distinctpopulations in the community. The poverty rate in Colfax is relatively low, as is the over65 population, and thus large segments of the population would not be adverselyaffected by the increased electrical rates or the changes in slackwater recreationopportunities. Colfax may see a short-term influx of outside workers during theimplementation but it is not expected that this would be a significant impact. Theexpected increased rate of land consolidation in the farm sector may contribute to areduction in rural farm population. Overall, the expected decrease in net employmentunder alternative A3 suggests that community population would decrease slightly.
4.2.3 Pomeroy, WA
The socioeconomic impacts of the three alternatives on the community of Pomeroywould include the effects of power costs, recreation activity, navigation/transportation,water supply, implementation, and anadromous fish recovery. Table 44 presents amatrix of the various impacts and the effects of the proposed alternatives. AlternativesA2a and A2c affect the probability of anadromous fish recovery while having minimaleffect on the physical or economic human environment. Alternative A3 would havesignificant effects on specific populations in Pomeroy. It would adversely affect thecommunity primarily through the loss of a navigable waterway, a corresponding shift intransportation modes to more expensive rail and truck movements, a decrease incountywide net farm income, and a drop in property values for agricultural lands. It isexpected that Pomeroy would realize short-term increases in implementation- and wellmodification-related employment, as well as a significant temporary influx of outsideworkers. Overall, the community would experience both increases and decreases inemployment, with a projected net loss in employment. The most significant effect on thecommunity would be the additional financial pressures on grain farms from increasedtransportation, storage, and handling costs and the uncertainty of how the transportationsystem and individual farms would respond. The cumulative effects of Alternative A3and the proposed phase out of the loan deficiency payments under the Freedom toFarm Act create an even greater uncertainty to individual farmers and farm communitieslike Pomeroy.
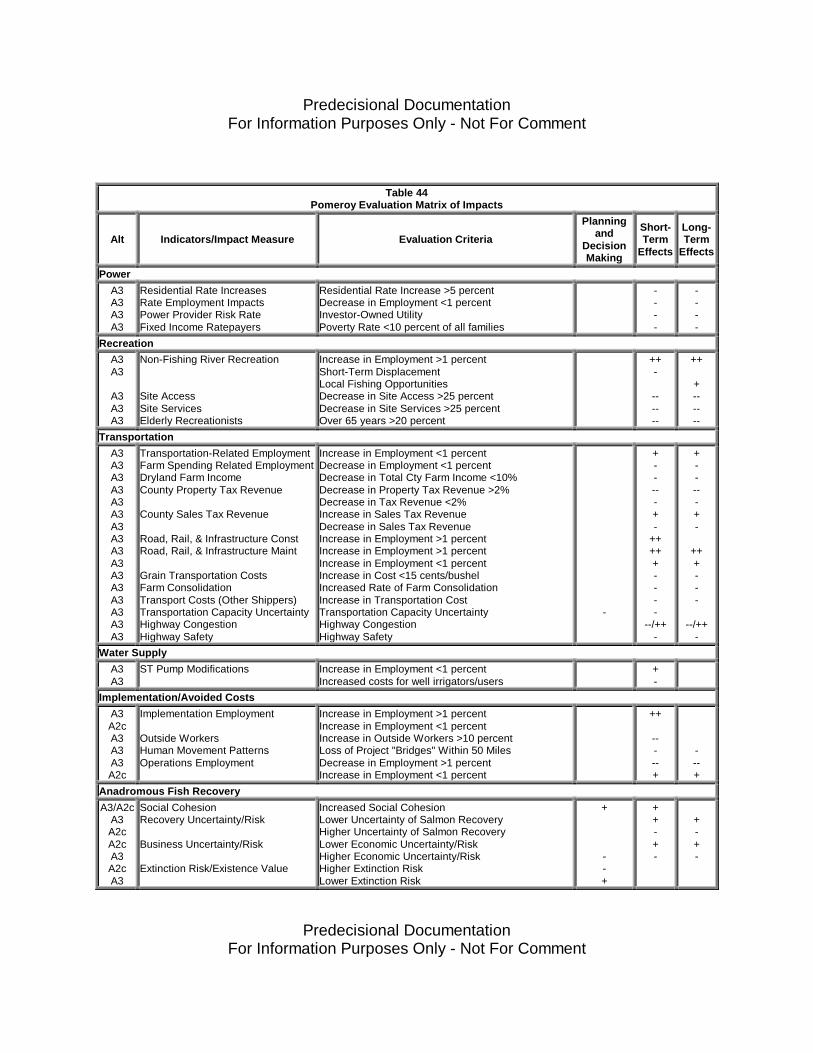
Predecisional DocumentationFor Information Purposes Only - Not For Comment
Predecisional DocumentationFor Information Purposes Only - Not For Comment
Table 44Pomeroy Evaluation Matrix of Impacts
Alt Indicators/Impact Measure Evaluation Criteria
Planningand
DecisionMaking
Short-Term
Effects
Long-Term
Effects
PowerA3A3A3A3
Residential Rate IncreasesRate Employment ImpactsPower Provider Risk RateFixed Income Ratepayers
Residential Rate Increase >5 percentDecrease in Employment <1 percentInvestor-Owned UtilityPoverty Rate <10 percent of all families
----
----
RecreationA3A3
A3A3A3
Non-Fishing River Recreation
Site AccessSite ServicesElderly Recreationists
Increase in Employment >1 percentShort-Term DisplacementLocal Fishing OpportunitiesDecrease in Site Access >25 percentDecrease in Site Services >25 percentOver 65 years >20 percent
++-
------
++
+------
TransportationA3A3A3A3A3A3A3A3A3A3A3A3A3A3A3A3
Transportation-Related EmploymentFarm Spending Related EmploymentDryland Farm IncomeCounty Property Tax Revenue
County Sales Tax Revenue
Road, Rail, & Infrastructure ConstRoad, Rail, & Infrastructure Maint
Grain Transportation CostsFarm ConsolidationTransport Costs (Other Shippers)Transportation Capacity UncertaintyHighway CongestionHighway Safety
Increase in Employment <1 percentDecrease in Employment <1 percentDecrease in Total Cty Farm Income <10%Decrease in Property Tax Revenue >2%Decrease in Tax Revenue <2%Increase in Sales Tax RevenueDecrease in Sales Tax RevenueIncrease in Employment >1 percentIncrease in Employment >1 percentIncrease in Employment <1 percentIncrease in Cost <15 cents/bushelIncreased Rate of Farm ConsolidationIncrease in Transportation CostTransportation Capacity UncertaintyHighway CongestionHighway Safety
-
+-----+-
+++++----
--/++-
+-----+-
+++---
--/++-
Water SupplyA3A3
ST Pump Modifications Increase in Employment <1 percentIncreased costs for well irrigators/users
+-
Implementation/Avoided CostsA3A2cA3A3A3A2c
Implementation Employment
Outside WorkersHuman Movement PatternsOperations Employment
Increase in Employment >1 percentIncrease in Employment <1 percentIncrease in Outside Workers >10 percentLoss of Project "Bridges" Within 50 MilesDecrease in Employment >1 percentIncrease in Employment <1 percent
++
-----+
---+
Anadromous Fish RecoveryA3/A2c
A3A2cA2cA3A2cA3
Social CohesionRecovery Uncertainty/Risk
Business Uncertainty/Risk
Extinction Risk/Existence Value
Increased Social CohesionLower Uncertainty of Salmon RecoveryHigher Uncertainty of Salmon RecoveryLower Economic Uncertainty/RiskHigher Economic Uncertainty/RiskHigher Extinction RiskLower Extinction Risk
+
--+
++-+-
+-+-
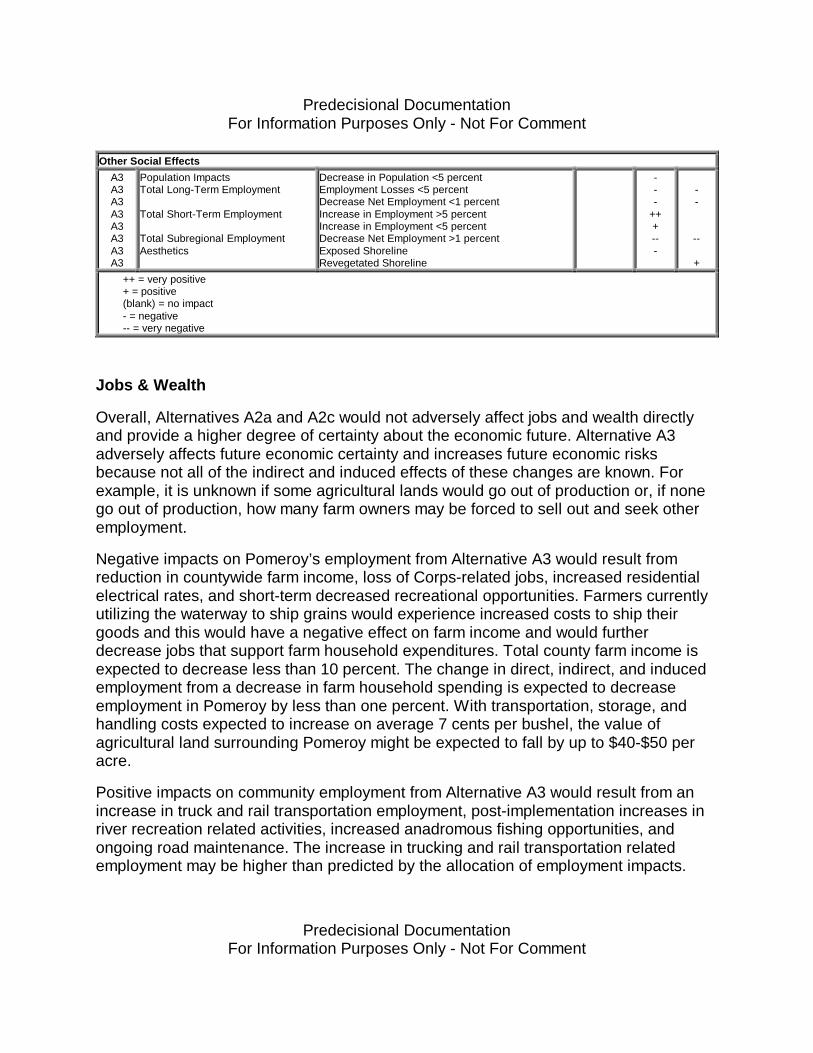
Predecisional DocumentationFor Information Purposes Only - Not For Comment
Predecisional DocumentationFor Information Purposes Only - Not For Comment
Other Social EffectsA3A3A3A3A3A3A3A3
Population ImpactsTotal Long-Term Employment
Total Short-Term Employment
Total Subregional EmploymentAesthetics
Decrease in Population <5 percentEmployment Losses <5 percentDecrease Net Employment <1 percentIncrease in Employment >5 percentIncrease in Employment <5 percentDecrease Net Employment >1 percentExposed ShorelineRevegetated Shoreline
---
+++---
--
--
+++ = very positive+ = positive(blank) = no impact- = negative-- = very negative
Jobs & Wealth
Overall, Alternatives A2a and A2c would not adversely affect jobs and wealth directlyand provide a higher degree of certainty about the economic future. Alternative A3adversely affects future economic certainty and increases future economic risksbecause not all of the indirect and induced effects of these changes are known. Forexample, it is unknown if some agricultural lands would go out of production or, if nonego out of production, how many farm owners may be forced to sell out and seek otheremployment.
Negative impacts on Pomeroy’s employment from Alternative A3 would result fromreduction in countywide farm income, loss of Corps-related jobs, increased residentialelectrical rates, and short-term decreased recreational opportunities. Farmers currentlyutilizing the waterway to ship grains would experience increased costs to ship theirgoods and this would have a negative effect on farm income and would furtherdecrease jobs that support farm household expenditures. Total county farm income isexpected to decrease less than 10 percent. The change in direct, indirect, and inducedemployment from a decrease in farm household spending is expected to decreaseemployment in Pomeroy by less than one percent. With transportation, storage, andhandling costs expected to increase on average 7 cents per bushel, the value ofagricultural land surrounding Pomeroy might be expected to fall by up to $40-$50 peracre.
Positive impacts on community employment from Alternative A3 would result from anincrease in truck and rail transportation employment, post-implementation increases inriver recreation related activities, increased anadromous fishing opportunities, andongoing road maintenance. The increase in trucking and rail transportation relatedemployment may be higher than predicted by the allocation of employment impacts.
Predecisional DocumentationFor Information Purposes Only - Not For Comment
Predecisional DocumentationFor Information Purposes Only - Not For Comment
Both the large volumes of grain produced in the lands surrounding Pomeroy and theposition of Pomeroy on the highway that would carry a large load of the traffic fromIdaho counties to ports on the Columbia River indicate that Pomeroy would see higherlevels of transportation-related employment. Short-term increases in employment wouldresult from implementation activities, modifications to wells along the river, andupgrades to road infrastructure.
Place
Pomeroy’s natural and built environment would not change dramatically underAlternative A3. Changes would occur in the surrounding patterns of land ownership andin the access and recreational opportunities available on the nearby lower Snake River.Adverse impacts from the loss of the Lower Granite pool include the loss of developedaccess at recreational sites such as Wawawai County Park, Illia Dunes Landing, WillowLanding, Little Goose Landing, Lyons Ferry Marina. Access to Boyer Park and Marinaby crossing the Lower Granite project would be lost. Additionally, recreation serviceswould be diminished at sites such as Boyer Park and Marina, Central Ferry State Park,and Chief Timothy State Park. The community would also have some short-termdisplacement from steelhead and salmon fishing, as well as displacement from otherriver related recreation as boat ramps are modified and the riverbank is revegetated.The identity of the community as an agricultural community should not be adverselyaffected by Alternative A3.
Another adverse affect of Alternative A3 would be the financial pressures exerted onlocal farmers from higher transportation costs. This may lead to a greater consolidationof farms and a decrease in the number of community members active in the farmingindustry either directly or indirectly. Without a navigable waterway and access to theports of Whitman and Garfield counties, Pomeroy would be on the major transportationroute for the movement of grain and other commodities from Idaho and Asotin County.Truck traffic patterns would increase total vehicle traffic on US 12 through Pomeroy bymore than 2 percent. This may be economically beneficial to roadside services butadverse for congestion and safety through downtown and on US Highway 12westbound. Finally, Pomeroy would lose a river crossing at the Lower Granite projectthat provides an alternative transportation corridor between Pomeroy and Colfax inWhitman County.
Predecisional DocumentationFor Information Purposes Only - Not For Comment
Predecisional DocumentationFor Information Purposes Only - Not For Comment
Long-term benefits of Alternative A3 would include the revegetation and restoration ofthe normative Snake River. Additionally, the increased chance of salmon recoverywould benefit the identity of the community as a place where salmon continue to existand local fishermen continue to pursue this element of the Pomeroy’s quality of life.Alternatives A2a and A2c have higher risks associated with salmon recovery and mayadversely affect this element of Pomeroy’s quality of life.
Vision & Vitality
Alternatives A2a, A2c, and A3 would adversely affect Pomeroy’s vision and vitality bydecreasing the social cohesion of the community over the issue of salmon recovery andthe best way to achieve that goal. Changes in the economic direction and base of thecommunity under Alternative A3 may challenge the leadership and vision of thecommunity to provide cost effective means of transporting the large volumes of grains tomarket since Pomeroy does not currently have rail access in the county. Additionally,leadership would be challenged to further enhance economic diversification efforts andto develop a recreational sector with a new type of tourism in mind.
Perhaps the most significant impact on the vision and vitality of the community would bethe expected drop in property tax revenue both from agricultural and non-agriculturallands. The community would be faced with either raising tax rates or cutting socialservices. Neither of these choices is harmonious with the community’s future plans andwould limit investments in the economic diversification efforts. One ameliorating factorwould be that property tax revenue would not change immediately but rather would bephased in over a five-year period of decreased farm income.
People
Changes in the physical and economic human environment would affect distinctpopulations in the community. The poverty rate in Pomeroy is relatively low, butPomeroy has the highest median age and largest percentage of population over 65 inthe study region. This retirement population would be adversely affected by loss of slackwater recreational opportunities on the lower Snake River.
Another significant impact for Pomeroy would be the short-term influx of outside workersduring implementation. Pomeroy and Garfield County housed large numbers of outsideworkers during the construction of the last two lower Snake River facilities andexperienced the social stresses and economic boom associated with that activity. Thelevel of workforce anticipated for the implementation of Alternative A3 is not expected tobe as large or for as long a period as the prior construction. These workers may,however, have different values and habits than the local residents and may cause short-term stress to the community.
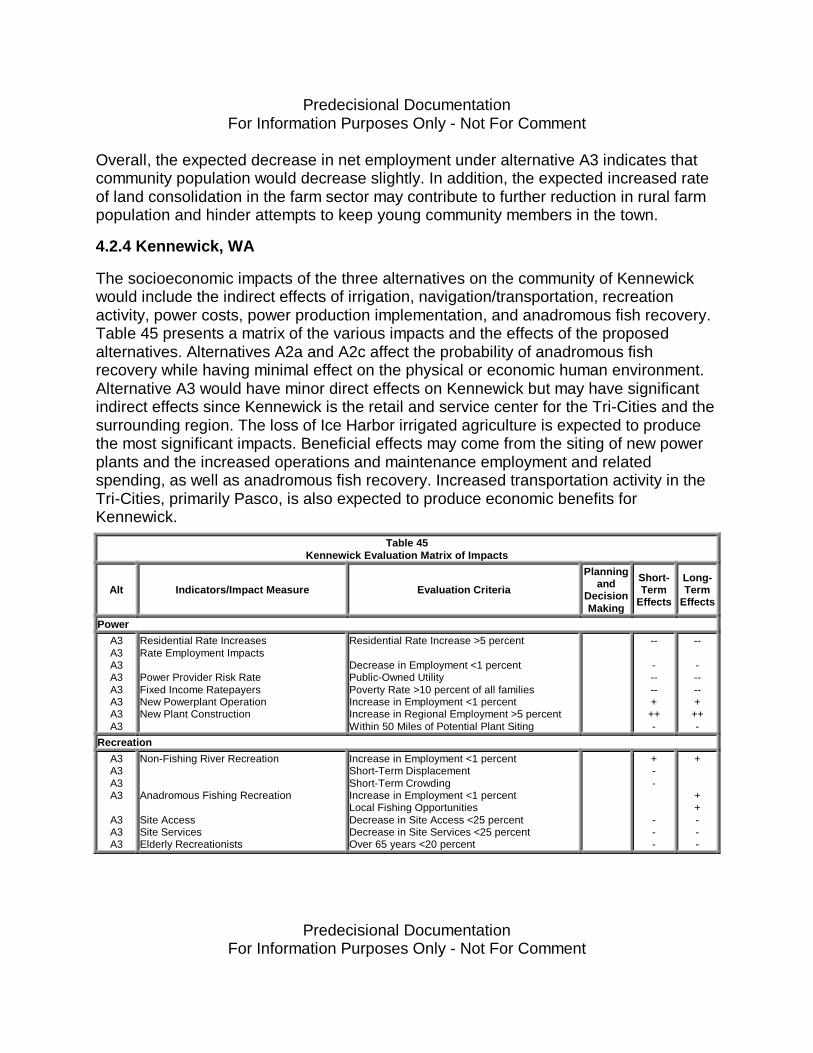
Predecisional DocumentationFor Information Purposes Only - Not For Comment
Predecisional DocumentationFor Information Purposes Only - Not For Comment
Overall, the expected decrease in net employment under alternative A3 indicates thatcommunity population would decrease slightly. In addition, the expected increased rateof land consolidation in the farm sector may contribute to further reduction in rural farmpopulation and hinder attempts to keep young community members in the town.
4.2.4 Kennewick, WA
The socioeconomic impacts of the three alternatives on the community of Kennewickwould include the indirect effects of irrigation, navigation/transportation, recreationactivity, power costs, power production implementation, and anadromous fish recovery.Table 45 presents a matrix of the various impacts and the effects of the proposedalternatives. Alternatives A2a and A2c affect the probability of anadromous fishrecovery while having minimal effect on the physical or economic human environment.Alternative A3 would have minor direct effects on Kennewick but may have significantindirect effects since Kennewick is the retail and service center for the Tri-Cities and thesurrounding region. The loss of Ice Harbor irrigated agriculture is expected to producethe most significant impacts. Beneficial effects may come from the siting of new powerplants and the increased operations and maintenance employment and relatedspending, as well as anadromous fish recovery. Increased transportation activity in theTri-Cities, primarily Pasco, is also expected to produce economic benefits forKennewick.
Table 45Kennewick Evaluation Matrix of Impacts
Alt Indicators/Impact Measure Evaluation Criteria
Planningand
DecisionMaking
Short-Term
Effects
Long-Term
Effects
PowerA3A3A3A3A3A3A3A3
Residential Rate IncreasesRate Employment Impacts
Power Provider Risk RateFixed Income RatepayersNew Powerplant OperationNew Plant Construction
Residential Rate Increase >5 percent
Decrease in Employment <1 percentPublic-Owned UtilityPoverty Rate >10 percent of all familiesIncrease in Employment <1 percentIncrease in Regional Employment >5 percentWithin 50 Miles of Potential Plant Siting
--
-----+++-
--
-----+++-
RecreationA3A3A3A3
A3A3A3
Non-Fishing River Recreation
Anadromous Fishing Recreation
Site AccessSite ServicesElderly Recreationists
Increase in Employment <1 percentShort-Term DisplacementShort-Term CrowdingIncrease in Employment <1 percentLocal Fishing OpportunitiesDecrease in Site Access <25 percentDecrease in Site Services <25 percentOver 65 years <20 percent
+--
---
+
++---
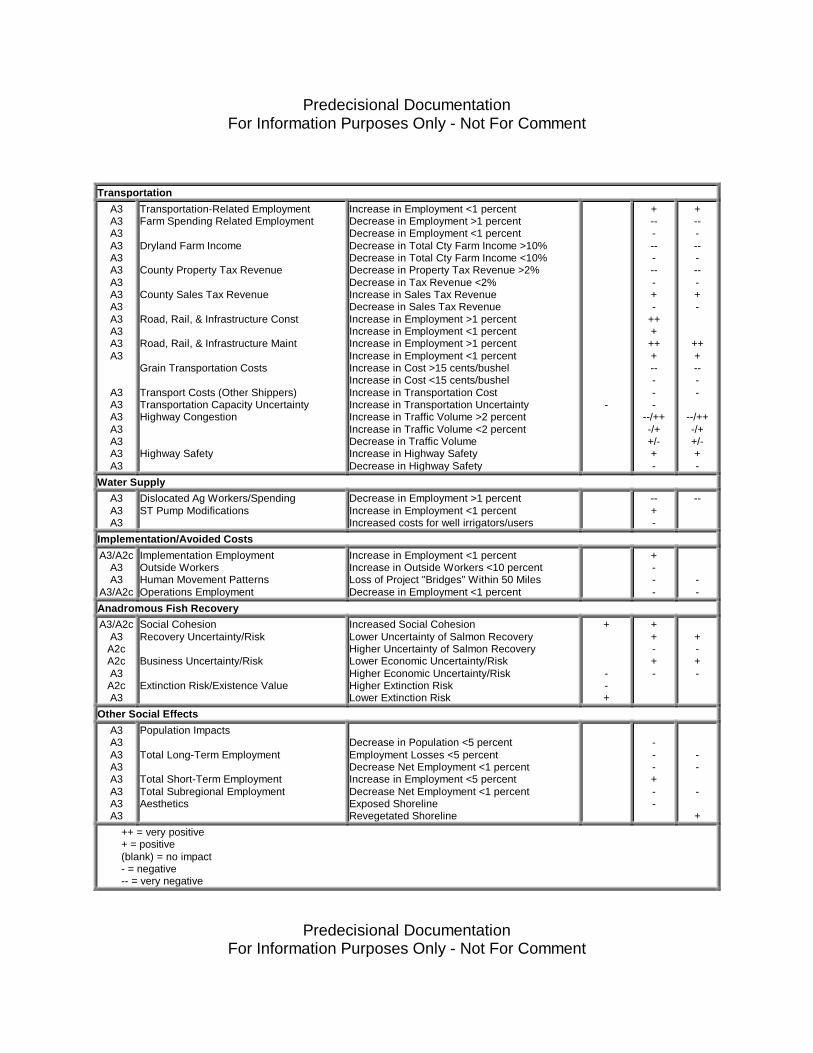
Predecisional DocumentationFor Information Purposes Only - Not For Comment
Predecisional DocumentationFor Information Purposes Only - Not For Comment
TransportationA3A3A3A3A3A3A3A3A3A3A3A3A3
A3A3A3A3A3A3A3
Transportation-Related EmploymentFarm Spending Related Employment
Dryland Farm Income
County Property Tax Revenue
County Sales Tax Revenue
Road, Rail, & Infrastructure Const
Road, Rail, & Infrastructure Maint
Grain Transportation Costs
Transport Costs (Other Shippers)Transportation Capacity UncertaintyHighway Congestion
Highway Safety
Increase in Employment <1 percentDecrease in Employment >1 percentDecrease in Employment <1 percentDecrease in Total Cty Farm Income >10%Decrease in Total Cty Farm Income <10%Decrease in Property Tax Revenue >2%Decrease in Tax Revenue <2%Increase in Sales Tax RevenueDecrease in Sales Tax RevenueIncrease in Employment >1 percentIncrease in Employment <1 percentIncrease in Employment >1 percentIncrease in Employment <1 percentIncrease in Cost >15 cents/bushelIncrease in Cost <15 cents/bushelIncrease in Transportation CostIncrease in Transportation UncertaintyIncrease in Traffic Volume >2 percentIncrease in Traffic Volume <2 percentDecrease in Traffic VolumeIncrease in Highway SafetyDecrease in Highway Safety
-
+---------+-
++++++-----
--/++-/++/-+-
+---------+-
+++----
--/++-/++/-+-
Water SupplyA3A3A3
Dislocated Ag Workers/SpendingST Pump Modifications
Decrease in Employment >1 percentIncrease in Employment <1 percentIncreased costs for well irrigators/users
--+-
--
Implementation/Avoided CostsA3/A2c
A3A3
A3/A2c
Implementation EmploymentOutside WorkersHuman Movement PatternsOperations Employment
Increase in Employment <1 percentIncrease in Outside Workers <10 percentLoss of Project "Bridges" Within 50 MilesDecrease in Employment <1 percent
+---
--
Anadromous Fish RecoveryA3/A2c
A3A2cA2cA3A2cA3
Social CohesionRecovery Uncertainty/Risk
Business Uncertainty/Risk
Extinction Risk/Existence Value
Increased Social CohesionLower Uncertainty of Salmon RecoveryHigher Uncertainty of Salmon RecoveryLower Economic Uncertainty/RiskHigher Economic Uncertainty/RiskHigher Extinction RiskLower Extinction Risk
+
--+
++-+-
+-+-
Other Social EffectsA3A3A3A3A3A3A3A3
Population Impacts
Total Long-Term Employment
Total Short-Term EmploymentTotal Subregional EmploymentAesthetics
Decrease in Population <5 percentEmployment Losses <5 percentDecrease Net Employment <1 percentIncrease in Employment <5 percentDecrease Net Employment <1 percentExposed ShorelineRevegetated Shoreline
---+--
--
-
+++ = very positive+ = positive(blank) = no impact- = negative-- = very negative
Predecisional DocumentationFor Information Purposes Only - Not For Comment
Predecisional DocumentationFor Information Purposes Only - Not For Comment
It is expected that Kennewick would realize short-term increases in implementation andpower plant construction employment. Overall, the community would experience bothincreases and decreases in employment, with a projected net loss in employment.Perhaps the most significant effect on the community would be the loss of agriculturalproduction on the Ice Harbor pool and the uncertainty of those losses on the communityeconomic structure. Aside from the specific physical and economic changes inKennewick, a significant impact may be the fear that the successful breaching of thelower Snake River projects jeopardizes the future viability of the Columbia Waterwayand the values it holds for Kennewick residents.
Jobs & Wealth
Overall, Alternatives A2a and A2c would not adversely affect jobs and wealth directlyand have a higher degree of certainty about the economic future. Alternative A3adversely affects future economic certainty and increases future economic risksbecause not all of the indirect and induced effects of these changes are known.
Negative indirect impacts on Kennewick’s employment from Alternative A3 primarilyresult from the loss of irrigated agriculture and increased residential electrical rates. Thewater supply analysis concluded that the cost to modify the Ice Harbor pumps wouldcost more that the total land value or the value of the crops produced. The effect wouldbe that Ice Harbor irrigated farm owners would not be able to make the necessarymodifications and operations would cease. The effects of this economic loss to theregion would indirectly impact the large service and retail sectors and, to a lesserdegree, the agricultural service sectors in Kennewick. Losses are estimated atapproximately 2 percent of total employment. The effects of increased residentialelectrical rates are estimated at below one percent. Total direct, indirect, and inducedemployment losses are estimated to be less than 2.5 percent of Kennewick’s totalemployment.
Positive impacts on community employment from Alternative A3 would result from theoperations and maintenance of new power plants in the region, increased trucking, rail,and barge transportation, post-implementation increases in river recreation-relatedactivities, and road maintenance. Short-term increases in employment result from powerplant construction, transportation infrastructure upgrades, and implementation activities.The long-term gains are estimated to be less than a 1-percent increase in Kennewick’stotal employment.
Predecisional DocumentationFor Information Purposes Only - Not For Comment
Predecisional DocumentationFor Information Purposes Only - Not For Comment
The positive and negative effects of these employment changes would be felt primarilyin the service and retail and wholesale trade sectors. It does not appear that any onebusiness or service would be disproportionately affected. Overall, the most significanteffect of Alternative A3 would be the heightened uncertainty about the fate of theColumbia River.
Place
Kennewick’s natural and built environment would not change significantly underAlternative A3. Adverse impacts from the breaching of the four lower Snake Riverfacilities would eliminate nearby developed recreational access sites such as the NorthShore Ramp, Ayer Boat Basin, and Lyons Ferry Marina. Kennewick would also losesome developed recreational site services at Charbonneau Park, Levy Landing,Fishhook Park, and Windust Park. Although this represents a small fraction of therecreational slack water recreational sites in the region, a more significant impact maybe the short-term crowding at Columbia River sites from lower Snake River displacedrecreationists. The identity of the community as a riverside retail and service urbancenter would not be adversely affected by this alternative.
Another indirect effect on Kennewick’s place is the increased traffic into the Tri-Cities.Traffic increases are not expected to occur in the city of Kennewick but across theColumbia River in Pasco. Overall traffic volumes on highways from Eastern Washingtonfeeding into the Tri-Cities are expected to increase between 2 and 6 percent. Some ofthis traffic may alter movement patterns by Kennewick commuters and may provideadditional employment and income to Kennewick.
Long-term benefits of Alternative A3 would include the revegetation and restoration ofthe normative Snake River and the shoreline. Additionally, the increased chance ofsalmon recovery would benefit the identity of the community as a place where salmoncontinue to exist and local fishermen continue to pursue this element of the Kennewick’squality of life. Alternatives A2a and A2c have higher risks associated with salmonrecovery and may adversely affect future community quality of life.
Vision & Vitality
Alternatives A2a, A2c, and A3 would all adversely affect Kennewick’s vision and vitalityby decreasing the social cohesion of the community over the issue of salmon recoveryand the best way to achieve that goal. The Chamber of Commerce has issued aposition paper on the breaching of the lower Snake River facilities and has joined inrallies to save the dams. One significant impact on the vision and vitality of Kennewickof each of the alternatives, but primarily Alternative A3, is the fear that successfullybreaching the dams or the continued listing of the salmon and steelhead as endangered
Predecisional DocumentationFor Information Purposes Only - Not For Comment
Predecisional DocumentationFor Information Purposes Only - Not For Comment
will lead to the eventual breaching of the Columbia River projects. The proposedalternatives of this study are seen as a first step to the removal of dams that provide thenavigable waterway and recreational benefits to the community. Kennewick has beenactively developing its waterfront, green areas, and Clover Island and the fear of futureloss of their waterfront represents a significant effect of each of the study’s alternatives.
People
Changes in the physical and economic human environment would affect distinctpopulations in the community. Benton County has been designated as an economicallydistressed area and has a high level of poverty. More than 10 percent of families areclassified as below the poverty line. These families on low or fixed incomes would berequired to spend a larger portion of their income on electrical bills. The forecastdecrease in net long-term employment under Alternative A3 signifies that populationtrends may not continue to increase at current or historical rates although it is likely thatthe community’s thriving economy would continue to grow and attract new communitymembers.
4.2.5 Pasco, WA
The socioeconomic impacts of the three alternatives on the community of Pasco wouldinclude the effects of irrigation, navigation/transportation, recreation activity, powercosts, implementation, and anadromous fish recovery. Table 46 presents a matrix of thevarious impacts and the effects of the proposed alternatives. Alternatives A2a and A2caffect the probability of anadromous fish recovery while having minimal effect on thephysical or economic human environment. Alternative A3 would have significant effectson specific populations in and around Pasco. It would create both winners and losersthrough the shift in transportation modes and nodes, a change in recreationalopportunities and access, lost irrigation acreage and employment, construction andoperation of new power plants, loss of power produced at the four projects, and anincreased chance of anadromous fish recovery.
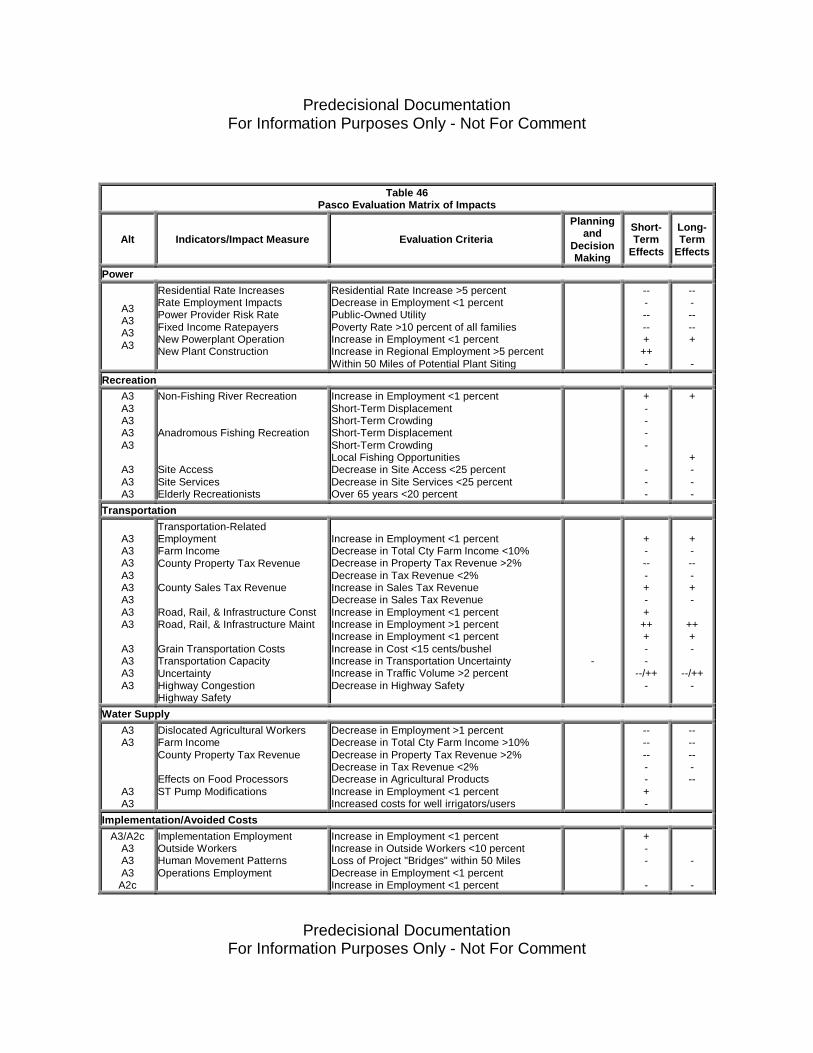
Predecisional DocumentationFor Information Purposes Only - Not For Comment
Predecisional DocumentationFor Information Purposes Only - Not For Comment
Table 46Pasco Evaluation Matrix of Impacts
Alt Indicators/Impact Measure Evaluation Criteria
Planningand
DecisionMaking
Short-Term
Effects
Long-Term
Effects
Power
A3A3A3A3
Residential Rate IncreasesRate Employment ImpactsPower Provider Risk RateFixed Income RatepayersNew Powerplant OperationNew Plant Construction
Residential Rate Increase >5 percentDecrease in Employment <1 percentPublic-Owned UtilityPoverty Rate >10 percent of all familiesIncrease in Employment <1 percentIncrease in Regional Employment >5 percentWithin 50 Miles of Potential Plant Siting
-------+++-
-------+
-Recreation
A3A3A3A3A3
A3A3A3
Non-Fishing River Recreation
Anadromous Fishing Recreation
Site AccessSite ServicesElderly Recreationists
Increase in Employment <1 percentShort-Term DisplacementShort-Term CrowdingShort-Term DisplacementShort-Term CrowdingLocal Fishing OpportunitiesDecrease in Site Access <25 percentDecrease in Site Services <25 percentOver 65 years <20 percent
+----
---
+
+---
Transportation
A3A3A3A3A3A3A3A3
A3A3A3A3
Transportation-RelatedEmploymentFarm IncomeCounty Property Tax Revenue
County Sales Tax Revenue
Road, Rail, & Infrastructure ConstRoad, Rail, & Infrastructure Maint
Grain Transportation CostsTransportation CapacityUncertaintyHighway CongestionHighway Safety
Increase in Employment <1 percentDecrease in Total Cty Farm Income <10%Decrease in Property Tax Revenue >2%Decrease in Tax Revenue <2%Increase in Sales Tax RevenueDecrease in Sales Tax RevenueIncrease in Employment <1 percentIncrease in Employment >1 percentIncrease in Employment <1 percentIncrease in Cost <15 cents/bushelIncrease in Transportation UncertaintyIncrease in Traffic Volume >2 percentDecrease in Highway Safety
-
+----+-++++--
--/++-
+----+-
+++-
--/++-
Water SupplyA3A3
A3A3
Dislocated Agricultural WorkersFarm IncomeCounty Property Tax Revenue
Effects on Food ProcessorsST Pump Modifications
Decrease in Employment >1 percentDecrease in Total Cty Farm Income >10%Decrease in Property Tax Revenue >2%Decrease in Tax Revenue <2%Decrease in Agricultural ProductsIncrease in Employment <1 percentIncreased costs for well irrigators/users
--------+-
---------
Implementation/Avoided CostsA3/A2c
A3A3A3A2c
Implementation EmploymentOutside WorkersHuman Movement PatternsOperations Employment
Increase in Employment <1 percentIncrease in Outside Workers <10 percentLoss of Project "Bridges" within 50 MilesDecrease in Employment <1 percentIncrease in Employment <1 percent
+--
-
-
-
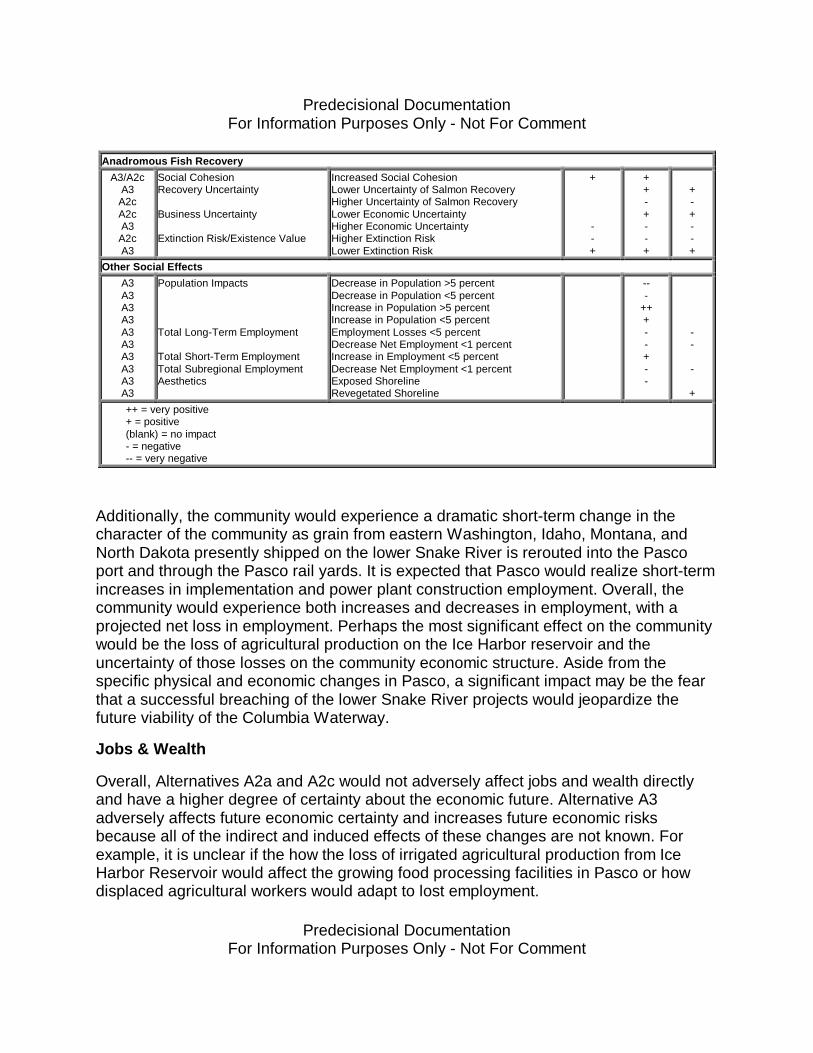
Predecisional DocumentationFor Information Purposes Only - Not For Comment
Predecisional DocumentationFor Information Purposes Only - Not For Comment
Anadromous Fish RecoveryA3/A2c
A3A2cA2cA3A2cA3
Social CohesionRecovery Uncertainty
Business Uncertainty
Extinction Risk/Existence Value
Increased Social CohesionLower Uncertainty of Salmon RecoveryHigher Uncertainty of Salmon RecoveryLower Economic UncertaintyHigher Economic UncertaintyHigher Extinction RiskLower Extinction Risk
+
--+
++-+--+
+-+--+
Other Social EffectsA3A3A3A3A3A3A3A3A3A3
Population Impacts
Total Long-Term Employment
Total Short-Term EmploymentTotal Subregional EmploymentAesthetics
Decrease in Population >5 percentDecrease in Population <5 percentIncrease in Population >5 percentIncrease in Population <5 percentEmployment Losses <5 percentDecrease Net Employment <1 percentIncrease in Employment <5 percentDecrease Net Employment <1 percentExposed ShorelineRevegetated Shoreline
---
+++--+--
--
-
+++ = very positive+ = positive(blank) = no impact- = negative-- = very negative
Additionally, the community would experience a dramatic short-term change in thecharacter of the community as grain from eastern Washington, Idaho, Montana, andNorth Dakota presently shipped on the lower Snake River is rerouted into the Pascoport and through the Pasco rail yards. It is expected that Pasco would realize short-termincreases in implementation and power plant construction employment. Overall, thecommunity would experience both increases and decreases in employment, with aprojected net loss in employment. Perhaps the most significant effect on the communitywould be the loss of agricultural production on the Ice Harbor reservoir and theuncertainty of those losses on the community economic structure. Aside from thespecific physical and economic changes in Pasco, a significant impact may be the fearthat a successful breaching of the lower Snake River projects would jeopardize thefuture viability of the Columbia Waterway.
Jobs & Wealth
Overall, Alternatives A2a and A2c would not adversely affect jobs and wealth directlyand have a higher degree of certainty about the economic future. Alternative A3adversely affects future economic certainty and increases future economic risksbecause all of the indirect and induced effects of these changes are not known. Forexample, it is unclear if the how the loss of irrigated agricultural production from IceHarbor Reservoir would affect the growing food processing facilities in Pasco or howdisplaced agricultural workers would adapt to lost employment.

Predecisional DocumentationFor Information Purposes Only - Not For Comment
Predecisional DocumentationFor Information Purposes Only - Not For Comment
Negative impacts on Pasco employment from Alternative A3 result from the loss ofirrigated agriculture, residential electrical rates, reduction in countywide farm income,and a loss of Corps- related jobs. The water supply analysis concluded that the cost tomodify the Ice Harbor pumps would cost more than the total land value or the value ofthe crops produced. The effect would be that Ice Harbor irrigated farm owners would notbe able to make the necessary modifications and operations would cease.Approximately 20 percent of the land is located in Franklin County and much of theagricultural service sector that supplies these farms would be affected. The direct,indirect, and induced employment losses in Pasco in just the agriculture/agriculturalservices sector are estimated to be approximately 9 percent of the agricultural sector,although the total loss of employment from this change is estimated to be less than 2.5percent of Pasco’s total employment. None of the other negative employment effectsdecrease employment by more than one percent. Total direct, indirect, and inducedemployment losses are estimated to be less than 2.5 percent of Pasco’s totalemployment.
Positive impacts on community employment from Alternative A3 would result fromincrease trucking, rail and barge transportation, post-implementation increases in riverrecreation related activities, road maintenance, short-term increases in employmentfrom power plant construction, transportation infrastructure upgrades, implementationactivities, and modifications to lower Snake River wells. With Pasco becoming theclosest port to eastern Washington and Idaho grain production, significant quantities ofgrain are forecast to move through the port rail and barge facilities. In effect, Pascowould receive a high percentage of the jobs lost by Lewiston, Clarkston, and the otherlower Snake River water port operations. These gains are estimated to be less than aone percent increase in Pasco’s total employment.
The effects of these employment changes on the largest employers in the communitydemonstrate the degree to which there will be winners, losers, and uncertain futuresassociated with Alternative A3. Boise Cascade operations depend to an unknowndegree upon fiber plantations along the Ice Harbor reservoir. The loss of theseplantations would place financial pressure on their operations and a long-terminvestment would be stranded. Burlington Northern Railroad, on the other hand, standsto gain or capture traffic volume as farmers and other shippers search for cost effectivemeans to ship their products to Portland. Finally, Universal Frozen Foods would have adiminished source of primary product for food processing activities. The degree to whicha decreased supply of agricultural products would affect employment is unknown.
Predecisional DocumentationFor Information Purposes Only - Not For Comment
Predecisional DocumentationFor Information Purposes Only - Not For Comment
Place
Pasco’s natural and built environment would not change significantly under AlternativeA3. Adverse impacts from the breaching of the four lower Snake River projects wouldeliminate developed recreational access sites such as the North Shore Ramp, AyerBoat Basin, and Lyons Ferry Marina. Pasco would also lose some developedrecreational site services at Charbonneau Park, Levy Landing, Fishhook Park, andWindust Park. Although this represents a small fraction of the recreational slack waterrecreational sites in the region, a more significant impact may be the short-termcrowding from lower Snake River displaced recreationists. The identity of thecommunity as a riverside transportation and agricultural urban center would not beadversely affected by this alternative.
The most significant change to the place of Pasco would be the increased truck trafficinto the ports. Increased truck traffic would converge from Interstate 395, US 12 and SR124 into the port facilities. Truck traffic into the city from the north is expected toincrease between 6 and 21 percent from current truck traffic volumes. Overall vehicletraffic is expected to increase between 2 and 6 percent. Although this traffic representsan economic benefit to the community, it may congest the feeder streets to the portfacilities and increase the safety risk within and outside of the city. This added trafficwould also have a negative impact on the condition of city streets.
Long-term benefits of Alternative A3 would include the revegetation and restoration ofthe normative Snake River and the shoreline. Additionally, the increased chance ofsalmon recovery would benefit the identity of the community as a place where salmoncontinue to exist and local fishermen continue to pursue this element of the Pasco’squality of life. Alternatives A2a and A2c have higher risks associated with salmonrecovery and may adversely affect future community quality of life.
Vision & Vitality
Alternatives A2a, A2c, and A3 all effect Pasco’s vision and vitality by decreasing thesocial cohesion of the community over the issue of salmon recovery and the best way toachieve that goal. The Chamber of Commerce has issued a position paper on thebreaching of the lower Snake River facilities and has joined in rallies to save the dams.One significant impact on the vision and vitality of Pasco of each of the alternatives, butprimarily Alternative A3, is the fear that successfully breaching the dams or thecontinued listing of the salmon and steelhead as endangered will lead to the eventualbreaching of the Columbia River projects. The proposed alternatives of this study areseen as a first step to the removal of the Columbia River dams that provide thenavigable waterway and recreational benefits to the community. Alternative A3 may
Predecisional DocumentationFor Information Purposes Only - Not For Comment
Predecisional DocumentationFor Information Purposes Only - Not For Comment
seriously challenge the leadership and vision of the community as they work to addressthe large numbers of displaced full-time and seasonal workers from the irrigated landson Ice Harbor. The community has worked to successfully develop the facilities at thePort of Pasco and to diversify the local economy by developing value added foodprocessing centers to the economic structure of Pasco. These plans and achievementsmay be adversely affected under this alternative.
Finally, the negative short- and long-term effects of lost agricultural production on bothlocal and county property values and property tax revenue may create difficultiesobtaining sufficient funding to pursue new avenues of economic development andmaintain the current level and anticipated increased levels of community services.
People
Changes in the physical and economic human environment would affect distinctpopulations in the community. Franklin County has been designated as an economicallydistressed area and has a high level of poverty. More than 10 percent of families areclassified as below the poverty line and these numbers may increase with the loss ofemployment on the Ice Harbor irrigated lands. These families on low or fixed incomeswould be required to spend a larger portion of their income on electrical bills. In addition,farm workers displaced from the Ice Harbor lands are primarily Hispanic and Pasco’spopulation is more than 40 percent Hispanic. The concerns related to thedisproportional negative impacts of this alternative are addressed in the EIS’senvironmental justice discussion.
The forecast decrease in net long-term employment under Alternative A3 signifies thatpopulation trends may not continue to increase at current or historical rates.
4.2.6 Umatilla, OR
The socioeconomic impacts of the three alternatives on the community of Umatillawould include the effects of irrigation, navigation/transportation, recreation activity,power costs, power production, implementation, and anadromous fish recovery. Table47 presents a matrix of the various impacts and the effects of the proposed alternatives.Alternatives A2a and A2c affect the probability of anadromous fish recovery whilehaving minimal effect on the physical or economic human environment. Alternative A3would affect Umatilla through the siting of power plants to replace the lost hydroelectricpower generated by the four lower Snake River facilities. The loss of Ice Harborirrigated agriculture may adversely affect food processors in Umatilla who obtain aportion of their product from the Ice Harbor farms. Beneficial economic impacts mayresult from the siting of new power plants in the region and increased operations andmaintenance employment and related spending. Although not predicted in the Corps
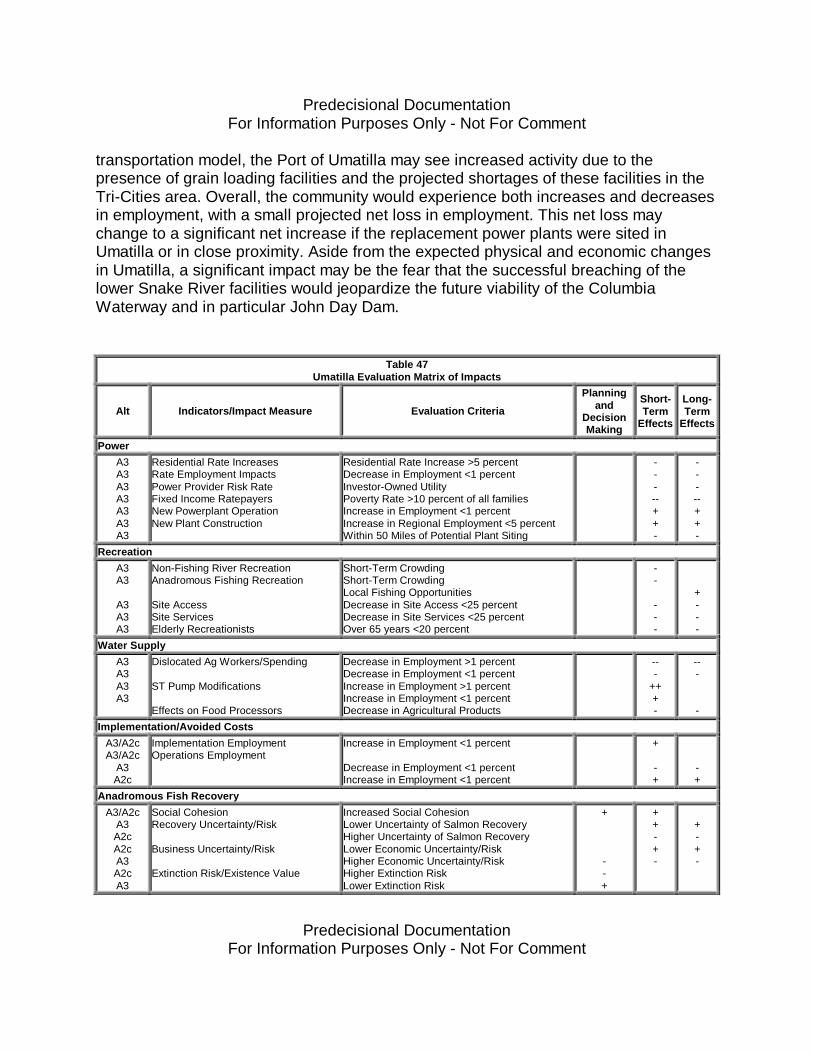
Predecisional DocumentationFor Information Purposes Only - Not For Comment
Predecisional DocumentationFor Information Purposes Only - Not For Comment
transportation model, the Port of Umatilla may see increased activity due to thepresence of grain loading facilities and the projected shortages of these facilities in theTri-Cities area. Overall, the community would experience both increases and decreasesin employment, with a small projected net loss in employment. This net loss maychange to a significant net increase if the replacement power plants were sited inUmatilla or in close proximity. Aside from the expected physical and economic changesin Umatilla, a significant impact may be the fear that the successful breaching of thelower Snake River facilities would jeopardize the future viability of the ColumbiaWaterway and in particular John Day Dam.
Table 47Umatilla Evaluation Matrix of Impacts
Alt Indicators/Impact Measure Evaluation Criteria
Planningand
DecisionMaking
Short-Term
Effects
Long-Term
Effects
PowerA3A3A3A3A3A3A3
Residential Rate IncreasesRate Employment ImpactsPower Provider Risk RateFixed Income RatepayersNew Powerplant OperationNew Plant Construction
Residential Rate Increase >5 percentDecrease in Employment <1 percentInvestor-Owned UtilityPoverty Rate >10 percent of all familiesIncrease in Employment <1 percentIncrease in Regional Employment <5 percentWithin 50 Miles of Potential Plant Siting
-----++-
-----++-
RecreationA3A3
A3A3A3
Non-Fishing River RecreationAnadromous Fishing Recreation
Site AccessSite ServicesElderly Recreationists
Short-Term CrowdingShort-Term CrowdingLocal Fishing OpportunitiesDecrease in Site Access <25 percentDecrease in Site Services <25 percentOver 65 years <20 percent
--
---
+---
Water SupplyA3A3A3A3
Dislocated Ag Workers/Spending
ST Pump Modifications
Effects on Food Processors
Decrease in Employment >1 percentDecrease in Employment <1 percentIncrease in Employment >1 percentIncrease in Employment <1 percentDecrease in Agricultural Products
---
+++-
---
-Implementation/Avoided Costs
A3/A2cA3/A2c
A3A2c
Implementation EmploymentOperations Employment
Increase in Employment <1 percent
Decrease in Employment <1 percentIncrease in Employment <1 percent
+
-+
-+
Anadromous Fish RecoveryA3/A2c
A3A2cA2cA3A2cA3
Social CohesionRecovery Uncertainty/Risk
Business Uncertainty/Risk
Extinction Risk/Existence Value
Increased Social CohesionLower Uncertainty of Salmon RecoveryHigher Uncertainty of Salmon RecoveryLower Economic Uncertainty/RiskHigher Economic Uncertainty/RiskHigher Extinction RiskLower Extinction Risk
+
--+
++-+-
+-+-
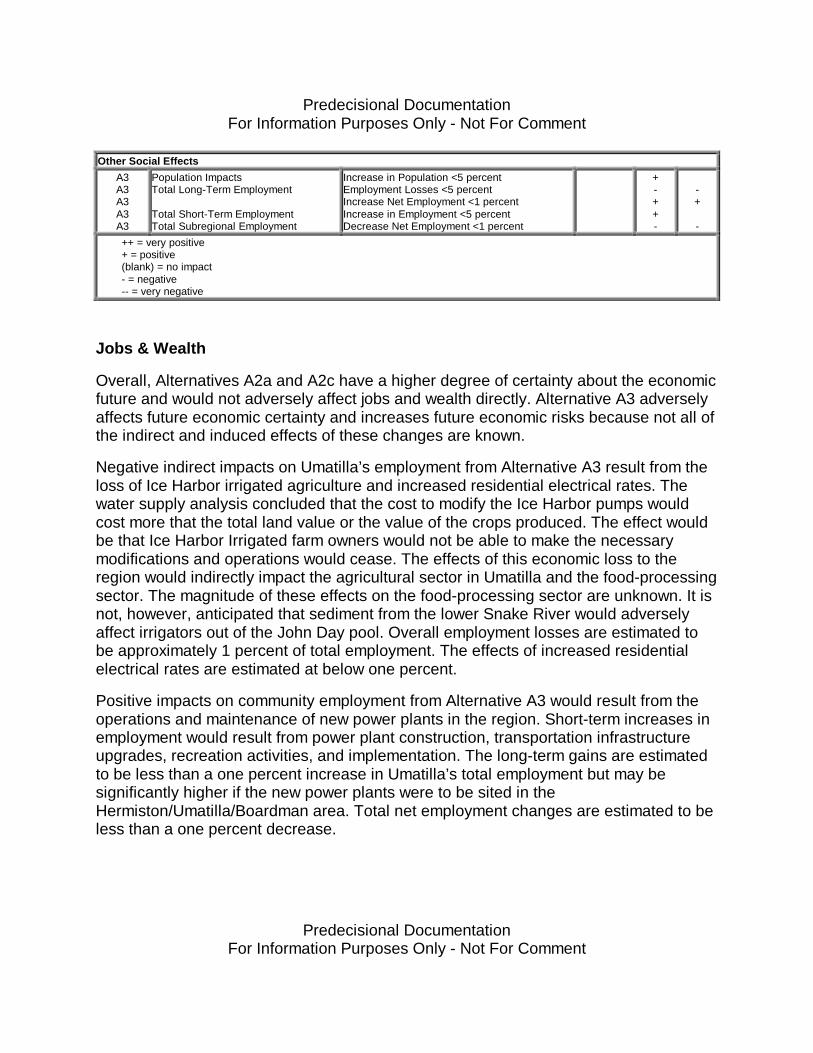
Predecisional DocumentationFor Information Purposes Only - Not For Comment
Predecisional DocumentationFor Information Purposes Only - Not For Comment
Other Social EffectsA3A3A3A3A3
Population ImpactsTotal Long-Term Employment
Total Short-Term EmploymentTotal Subregional Employment
Increase in Population <5 percentEmployment Losses <5 percentIncrease Net Employment <1 percentIncrease in Employment <5 percentDecrease Net Employment <1 percent
+-++-
-+
-++ = very positive+ = positive(blank) = no impact- = negative-- = very negative
Jobs & Wealth
Overall, Alternatives A2a and A2c have a higher degree of certainty about the economicfuture and would not adversely affect jobs and wealth directly. Alternative A3 adverselyaffects future economic certainty and increases future economic risks because not all ofthe indirect and induced effects of these changes are known.
Negative indirect impacts on Umatilla’s employment from Alternative A3 result from theloss of Ice Harbor irrigated agriculture and increased residential electrical rates. Thewater supply analysis concluded that the cost to modify the Ice Harbor pumps wouldcost more that the total land value or the value of the crops produced. The effect wouldbe that Ice Harbor Irrigated farm owners would not be able to make the necessarymodifications and operations would cease. The effects of this economic loss to theregion would indirectly impact the agricultural sector in Umatilla and the food-processingsector. The magnitude of these effects on the food-processing sector are unknown. It isnot, however, anticipated that sediment from the lower Snake River would adverselyaffect irrigators out of the John Day pool. Overall employment losses are estimated tobe approximately 1 percent of total employment. The effects of increased residentialelectrical rates are estimated at below one percent.
Positive impacts on community employment from Alternative A3 would result from theoperations and maintenance of new power plants in the region. Short-term increases inemployment would result from power plant construction, transportation infrastructureupgrades, recreation activities, and implementation. The long-term gains are estimatedto be less than a one percent increase in Umatilla’s total employment but may besignificantly higher if the new power plants were to be sited in theHermiston/Umatilla/Boardman area. Total net employment changes are estimated to beless than a one percent decrease.

Predecisional DocumentationFor Information Purposes Only - Not For Comment
Predecisional DocumentationFor Information Purposes Only - Not For Comment
Overall, the most significant economic effect of Alternative A3 would be the heighteneduncertainty about the fate of the Columbia River and the local irrigated agriculture thatdepends on river water.
Place
Umatilla’s natural and built environment would not change significantly under AlternativeA3 unless the new power plants were sited in close proximity to the community. It isbeyond the scope of this report to analyze the effects of a proposed power plant butadequate environmental and socioeconomic assessments would be required. Adverseimpacts on recreation sites within 50 miles of Umatilla would include the elimination ofthe North Shore Ramp. Umatilla would also lose some developed recreational siteservices at Charbonneau Park, Levy Landing, and Fishhook Park. Although thisrepresents a small fraction of the slack water recreational sites in the region, a moresignificant impact may be the short-term crowding at Columbia River sites from lowerSnake River displaced recreationists. The identity of the community as the Walleyecapital of the world would not be adversely affected by this alternative.
Long-term benefits of Alternative A3 would include the revegetation and restoration ofthe normative Snake River and the shoreline. Additionally, the increased chance ofsalmon recovery would benefit the identity of the community as a place where salmoncontinue to exist and local fishermen would continue to pursue this element of Umatilla’squality of life. Alternatives A2a and A2c have higher risks associated with salmonrecovery and may adversely affect future community quality of life.
Vision & Vitality
Alternatives A2a, A2c, and A3 all adversely affect Umatilla’s vision and vitality byincreasing the social cohesion of the community over the issue of salmon recovery andthe best way to achieve that goal. One significant impact on the vision and vitality ofUmatilla of each of the alternatives, but primarily Alternative A3, is the fear thatsuccessfully breaching the dams or the continued listing of the salmon and steelhead asendangered will lead to the eventual breaching of the Columbia River projects. Theproposed alternatives of this study are seen by community members as a first step tothe removal of dams that provide the navigable waterway and recreational benefits tothe community.
If the replacement power plants are sited in the vicinity of Umatilla or within UmatillaCounty, the community may achieve increased tax revenues to support essential countyand community services.
Predecisional DocumentationFor Information Purposes Only - Not For Comment
Predecisional DocumentationFor Information Purposes Only - Not For Comment
People
Changes in the physical and economic human environment would affect distinctpopulations in Umatilla. A relatively high level of poverty for families exists in Umatillaand these families would be expected to expend a larger of their income on increasedelectrical bills. The small forecast decrease in net long-term employment underAlternative A3 signifies that population trends may not continue to increase at current orhistorical rates. It is likely that in both the short-term and long-term, population wouldincrease if the replacement power plants are sited in close proximity to the community.
4.2.7 Lewiston, ID
The socioeconomic impacts of the three alternatives on the community of Lewistonwould include the effects of power costs, recreation activity, navigation andtransportation, M&I water supply, implementation, and anadromous fish recovery. Table48 presents a matrix of the various impacts and the effects of the proposed alternatives.Alternatives A2a and A2c affect the probability of anadromous fish recovery whilehaving minimal effect on the physical or economic human environment. Alternative A3would have significant effects on the specific populations of Lewiston. It would createboth winners and losers through the loss of a navigable waterway, loss of powerproduced at the four projects, a shift in transportation modes, a change in recreationalopportunities and access, and an increased chance of anadromous fish recovery. Inaddition, the community would experience a dramatic short-term change in thecharacter of the community as the reservoir is drained and a new shoreline is formedaround the city with the existing levees left high above the new water line. It is expectedthat Lewiston would realize short-term increases in implementation and M&I watersupply modification related employment as well as a temporary influx of outsideworkers. Overall, the community would experience both increases and decreases inemployment, with a projected net gain in employment. Perhaps the most significanteffect on the community would be the stranded social energy and costs of developingactivities and plans centered around the continued existence of the four lower SnakeRiver facilities, a navigable waterway, and an inland port.
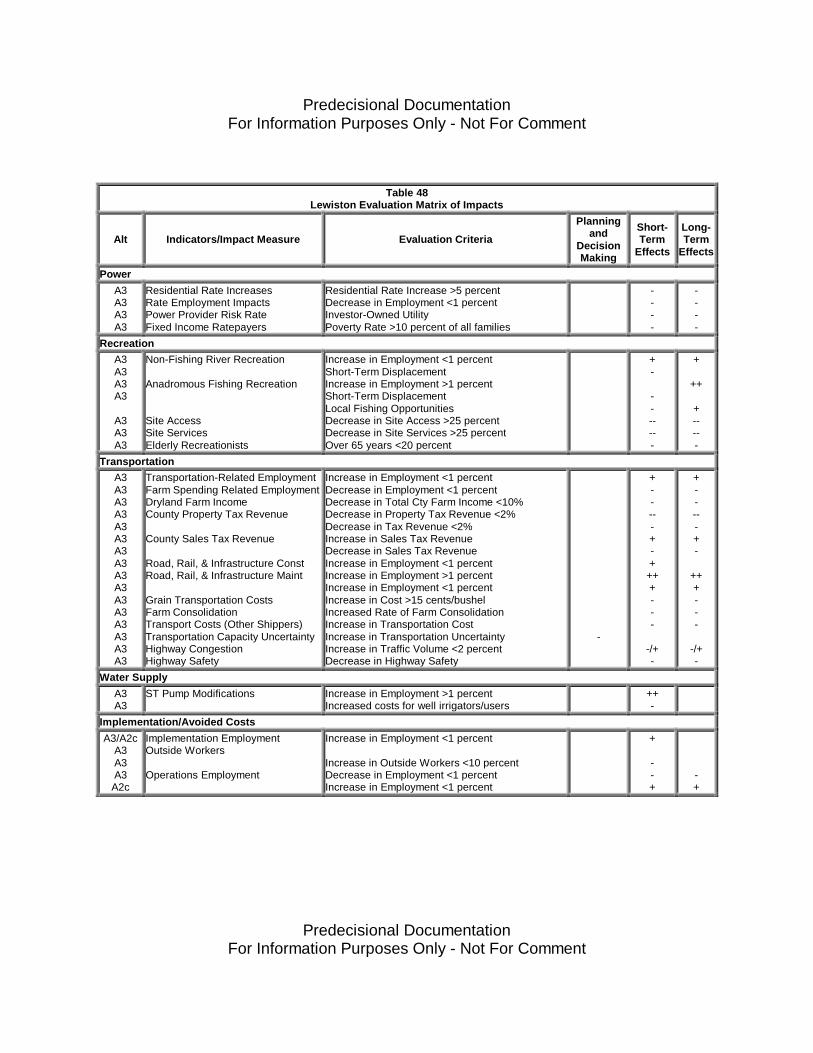
Predecisional DocumentationFor Information Purposes Only - Not For Comment
Predecisional DocumentationFor Information Purposes Only - Not For Comment
Table 48Lewiston Evaluation Matrix of Impacts
Alt Indicators/Impact Measure Evaluation Criteria
Planningand
DecisionMaking
Short-Term
Effects
Long-Term
Effects
PowerA3A3A3A3
Residential Rate IncreasesRate Employment ImpactsPower Provider Risk RateFixed Income Ratepayers
Residential Rate Increase >5 percentDecrease in Employment <1 percentInvestor-Owned UtilityPoverty Rate >10 percent of all families
----
----
RecreationA3A3A3A3
A3A3A3
Non-Fishing River Recreation
Anadromous Fishing Recreation
Site AccessSite ServicesElderly Recreationists
Increase in Employment <1 percentShort-Term DisplacementIncrease in Employment >1 percentShort-Term DisplacementLocal Fishing OpportunitiesDecrease in Site Access >25 percentDecrease in Site Services >25 percentOver 65 years <20 percent
+-
-------
+
++
+-----
TransportationA3A3A3A3A3A3A3A3A3A3A3A3A3A3A3A3
Transportation-Related EmploymentFarm Spending Related EmploymentDryland Farm IncomeCounty Property Tax Revenue
County Sales Tax Revenue
Road, Rail, & Infrastructure ConstRoad, Rail, & Infrastructure Maint
Grain Transportation CostsFarm ConsolidationTransport Costs (Other Shippers)Transportation Capacity UncertaintyHighway CongestionHighway Safety
Increase in Employment <1 percentDecrease in Employment <1 percentDecrease in Total Cty Farm Income <10%Decrease in Property Tax Revenue <2%Decrease in Tax Revenue <2%Increase in Sales Tax RevenueDecrease in Sales Tax RevenueIncrease in Employment <1 percentIncrease in Employment >1 percentIncrease in Employment <1 percentIncrease in Cost >15 cents/bushelIncreased Rate of Farm ConsolidationIncrease in Transportation CostIncrease in Transportation UncertaintyIncrease in Traffic Volume <2 percentDecrease in Highway Safety
-
+-----+-++++---
-/+-
+-----+-
+++---
-/+-
Water SupplyA3A3
ST Pump Modifications Increase in Employment >1 percentIncreased costs for well irrigators/users
++-
Implementation/Avoided CostsA3/A2c
A3A3A3A2c
Implementation EmploymentOutside Workers
Operations Employment
Increase in Employment <1 percent
Increase in Outside Workers <10 percentDecrease in Employment <1 percentIncrease in Employment <1 percent
+
--+
-+
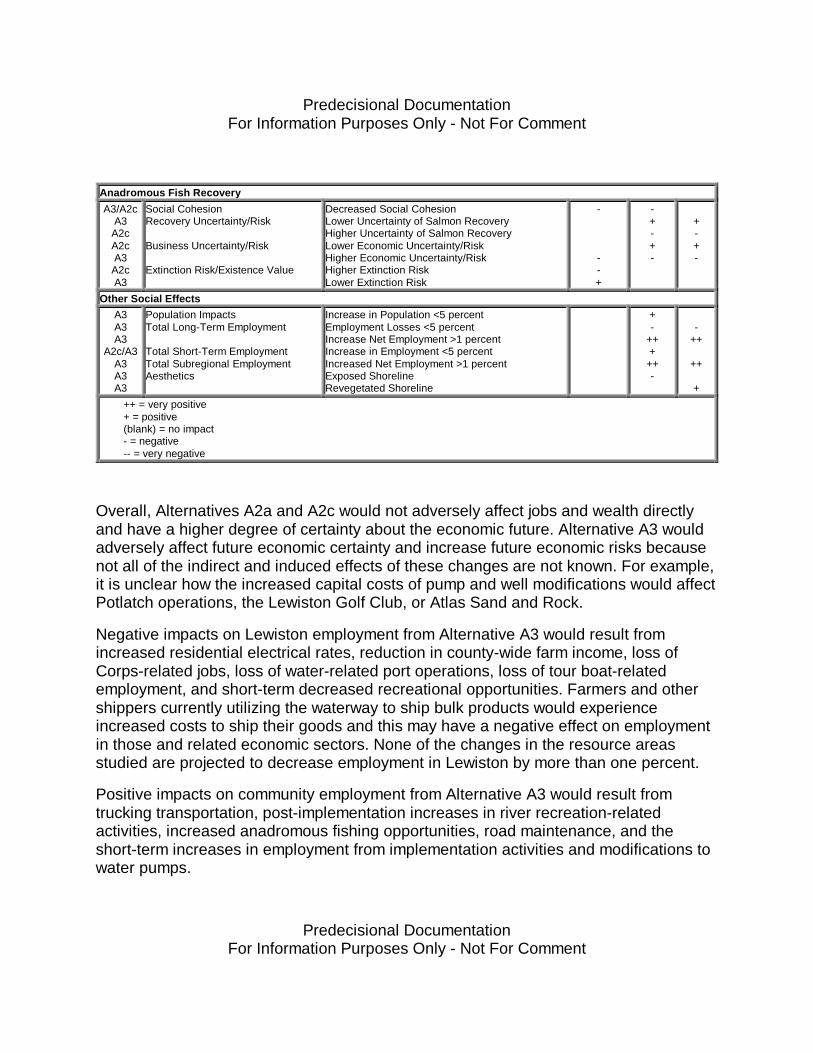
Predecisional DocumentationFor Information Purposes Only - Not For Comment
Predecisional DocumentationFor Information Purposes Only - Not For Comment
Anadromous Fish RecoveryA3/A2c
A3A2cA2cA3A2cA3
Social CohesionRecovery Uncertainty/Risk
Business Uncertainty/Risk
Extinction Risk/Existence Value
Decreased Social CohesionLower Uncertainty of Salmon RecoveryHigher Uncertainty of Salmon RecoveryLower Economic Uncertainty/RiskHigher Economic Uncertainty/RiskHigher Extinction RiskLower Extinction Risk
-
--+
-+-+-
+-+-
Other Social EffectsA3A3A3
A2c/A3A3A3A3
Population ImpactsTotal Long-Term Employment
Total Short-Term EmploymentTotal Subregional EmploymentAesthetics
Increase in Population <5 percentEmployment Losses <5 percentIncrease Net Employment >1 percentIncrease in Employment <5 percentIncreased Net Employment >1 percentExposed ShorelineRevegetated Shoreline
+-
+++++-
-++
++
+++ = very positive+ = positive(blank) = no impact- = negative-- = very negative
Overall, Alternatives A2a and A2c would not adversely affect jobs and wealth directlyand have a higher degree of certainty about the economic future. Alternative A3 wouldadversely affect future economic certainty and increase future economic risks becausenot all of the indirect and induced effects of these changes are not known. For example,it is unclear how the increased capital costs of pump and well modifications would affectPotlatch operations, the Lewiston Golf Club, or Atlas Sand and Rock.
Negative impacts on Lewiston employment from Alternative A3 would result fromincreased residential electrical rates, reduction in county-wide farm income, loss ofCorps-related jobs, loss of water-related port operations, loss of tour boat-relatedemployment, and short-term decreased recreational opportunities. Farmers and othershippers currently utilizing the waterway to ship bulk products would experienceincreased costs to ship their goods and this may have a negative effect on employmentin those and related economic sectors. None of the changes in the resource areasstudied are projected to decrease employment in Lewiston by more than one percent.
Positive impacts on community employment from Alternative A3 would result fromtrucking transportation, post-implementation increases in river recreation-relatedactivities, increased anadromous fishing opportunities, road maintenance, and theshort-term increases in employment from implementation activities and modifications towater pumps.
Predecisional DocumentationFor Information Purposes Only - Not For Comment
Predecisional DocumentationFor Information Purposes Only - Not For Comment
The effects of these changes on the largest employer demonstrate the degree ofeconomic uncertainty associated with Alternative A3. Potlatch is the largest employer inthe valley and would be negatively affected by higher shipping costs for some of theirproducts and by requirements to modify effluent and water intake systems. It isunknown how they would respond to these increased operational and capital costs.
Place
Lewiston’s natural and built environment would change dramatically under AlternativeA3 much like it did 25 years ago when the levees were built, the Lower Granite poolfilled, and slackwater reached Lewiston. Adverse impacts from the loss of the LowerGranite pool include the short-term exposure of shoreline and mudflats and the isolationof the levee parks from the water. The community would lose recreational access sitesat Chief Lookinglass Park and Nisqually John Landing as well as the loss of somerecreational site services at Chief Timothy State Park, Hells Canyon Resort, SwallowsPark, Clearwater Ramp, Southway Park, and Hells Gate State Park. In addition, thecommunity would have some short-term displacement from steelhead and salmonfishing as well as displacement from other river-related recreation. The identity of thecommunity as a working water port and the only inland water port in Idaho would alsobe adversely affected although it would still retain its identity as a Snake Rivercommunity surrounded by extensive natural features.
Another adverse affect of Alternative A3 would be the financial pressures exerted onlocal farmers from higher transportation costs. This may lead to a greater consolidationof farms and a change in the agricultural-urban identity of Lewiston.
Long-term benefits of Alternative A3 would include the revegetation and restoration ofthe normative Snake River and the community shoreline. Additionally, the increasedchance of salmon recovery would benefit the identity of the community as a place wheresalmon continue to exist and local fishermen would continue to pursue this element ofLewiston’s quality of life. Alternatives A2a and A2c have higher risks associated withsalmon recovery and may adversely affect future community quality of life.
Vision & Vitality
Alternatives A2a, A2c, and A3 all would adversely affect Lewiston’s vision and vitality bydecreasing the social cohesion of the community over the issue of salmon recovery andthe best way to achieve that goal. The city council has debated the issue and been splitin their position. Adverse effects of a change in the economic direction and identity ofthe community under Alternative A3 may seriously challenge the leadership and visionof the community. The community has worked to successfully develop the facilities atthe Port of Lewiston and to diversify the local economy by developing recreational
Predecisional DocumentationFor Information Purposes Only - Not For Comment
Predecisional DocumentationFor Information Purposes Only - Not For Comment
opportunities associated with the lower Snake River pools, Hells Canyon, andsurrounding natural areas. They have also successfully developed green areas alongthe waterway, providing local recreational opportunities. The port serves as a vehicle formanufacturing and industrial growth through its industrial properties and loadingfacilities. Many of these plans and achievements would be significantly affected underthis alternative. The Port of Lewiston is in a good position to continue to act as adevelopment mechanism, utilizing both rail and highway access, but this is not thecurrent direction of the port’s activities. Additionally, the negative short- and long-termeffects on both local and county property values and property tax revenue may createdifficulties in obtaining sufficient funding to pursue new avenues of economicdevelopment and maintain the current level of community services.
People
Changes in the physical and economic human environment would affect distinctpopulations in the community, although not to the degree of Clarkston. Families,including those on fixed incomes, would be required to pay a larger proportion of theirincome to power bills. In addition, the influx of short-term outside workers may disrupttraditional community patterns although the number of forecast workers is relativelysmall compared to the workforce required to construct the lower Snake River facilities.
The forecast increase in long-term employment under Alternative A3 signifies thatpopulation trends should continue to increase but given the uncertainties associatedwith the business climate, overall population may remain stable or decrease slightlygiven short-term job losses and uncertain responses from businesses.
4.2.8 Orofino, ID
The socioeconomic impacts of the three alternatives on the community of Orofino wouldinclude the effects of power costs, recreation activity, navigation and transportation, M&Iwater supply, implementation, and anadromous fish recovery. Table 49 presents amatrix of the various impacts and the effects of the proposed alternatives. AlternativesA2a and A2c affect the probability of anadromous fish recovery while having minimaleffect on the physical or economic human environment. Alternative A3 would havesignificant effects on specific populations in Orofino. It would create both winners andlosers through an increased chance of anadromous fish recovery, a change inrecreational opportunities and access, loss of a navigable waterway, loss of powerproduced at the four projects, and a shift in transportation modes. It is expected thatOrofino would realize short-term increases in implementation, infrastructure
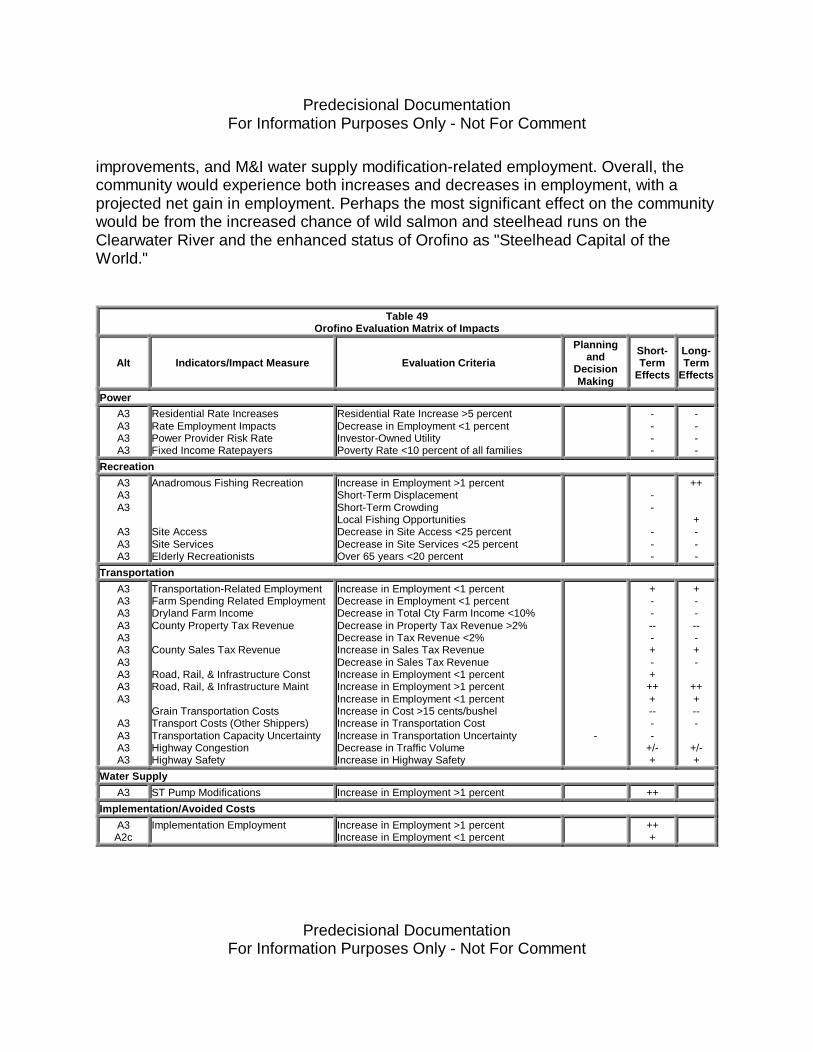
Predecisional DocumentationFor Information Purposes Only - Not For Comment
Predecisional DocumentationFor Information Purposes Only - Not For Comment
improvements, and M&I water supply modification-related employment. Overall, thecommunity would experience both increases and decreases in employment, with aprojected net gain in employment. Perhaps the most significant effect on the communitywould be from the increased chance of wild salmon and steelhead runs on theClearwater River and the enhanced status of Orofino as "Steelhead Capital of theWorld."
Table 49Orofino Evaluation Matrix of Impacts
Alt Indicators/Impact Measure Evaluation Criteria
Planningand
DecisionMaking
Short-Term
Effects
Long-Term
Effects
PowerA3A3A3A3
Residential Rate IncreasesRate Employment ImpactsPower Provider Risk RateFixed Income Ratepayers
Residential Rate Increase >5 percentDecrease in Employment <1 percentInvestor-Owned UtilityPoverty Rate <10 percent of all families
----
----
RecreationA3A3A3
A3A3A3
Anadromous Fishing Recreation
Site AccessSite ServicesElderly Recreationists
Increase in Employment >1 percentShort-Term DisplacementShort-Term CrowdingLocal Fishing OpportunitiesDecrease in Site Access <25 percentDecrease in Site Services <25 percentOver 65 years <20 percent
--
---
++
+---
TransportationA3A3A3A3A3A3A3A3A3A3
A3A3A3A3
Transportation-Related EmploymentFarm Spending Related EmploymentDryland Farm IncomeCounty Property Tax Revenue
County Sales Tax Revenue
Road, Rail, & Infrastructure ConstRoad, Rail, & Infrastructure Maint
Grain Transportation CostsTransport Costs (Other Shippers)Transportation Capacity UncertaintyHighway CongestionHighway Safety
Increase in Employment <1 percentDecrease in Employment <1 percentDecrease in Total Cty Farm Income <10%Decrease in Property Tax Revenue >2%Decrease in Tax Revenue <2%Increase in Sales Tax RevenueDecrease in Sales Tax RevenueIncrease in Employment <1 percentIncrease in Employment >1 percentIncrease in Employment <1 percentIncrease in Cost >15 cents/bushelIncrease in Transportation CostIncrease in Transportation UncertaintyDecrease in Traffic VolumeIncrease in Highway Safety
-
+-----+-++++----
+/-+
+-----+-
+++---
+/-+
Water SupplyA3 ST Pump Modifications Increase in Employment >1 percent ++
Implementation/Avoided CostsA3A2c
Implementation Employment Increase in Employment >1 percentIncrease in Employment <1 percent
+++
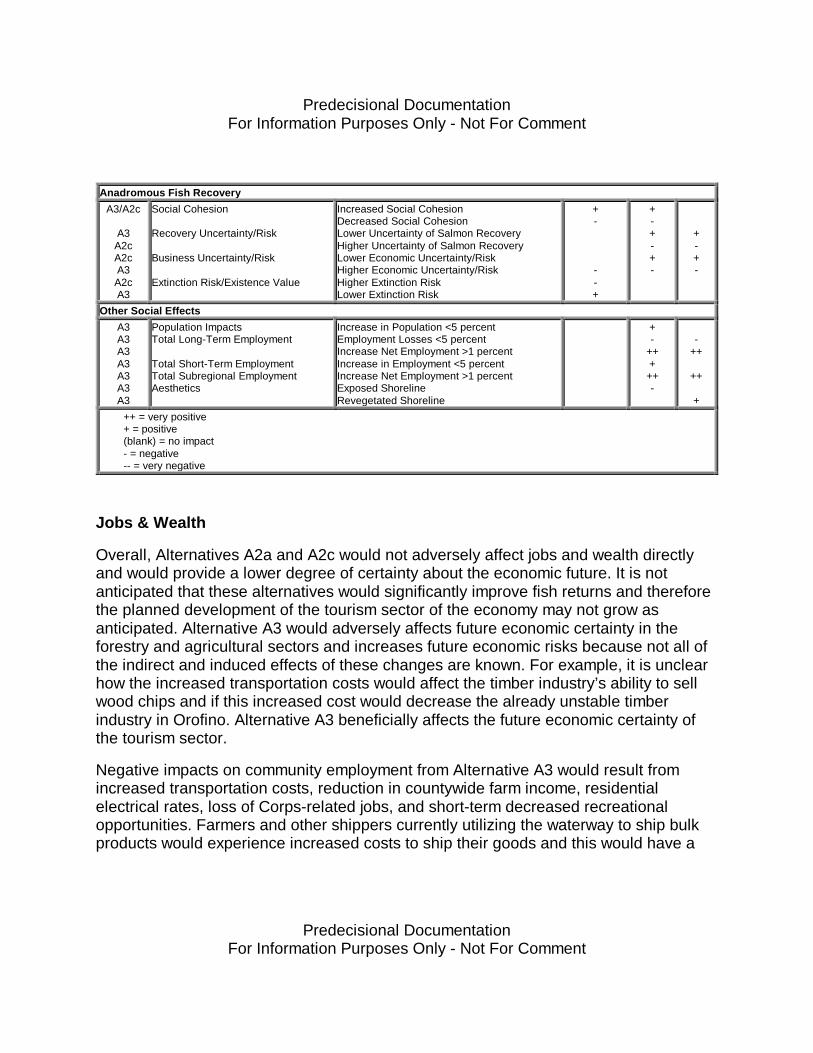
Predecisional DocumentationFor Information Purposes Only - Not For Comment
Predecisional DocumentationFor Information Purposes Only - Not For Comment
Anadromous Fish RecoveryA3/A2c
A3A2cA2cA3A2cA3
Social Cohesion
Recovery Uncertainty/Risk
Business Uncertainty/Risk
Extinction Risk/Existence Value
Increased Social CohesionDecreased Social CohesionLower Uncertainty of Salmon RecoveryHigher Uncertainty of Salmon RecoveryLower Economic Uncertainty/RiskHigher Economic Uncertainty/RiskHigher Extinction RiskLower Extinction Risk
+-
--+
+-+-+-
+-+-
Other Social EffectsA3A3A3A3A3A3A3
Population ImpactsTotal Long-Term Employment
Total Short-Term EmploymentTotal Subregional EmploymentAesthetics
Increase in Population <5 percentEmployment Losses <5 percentIncrease Net Employment >1 percentIncrease in Employment <5 percentIncrease Net Employment >1 percentExposed ShorelineRevegetated Shoreline
+-
+++++-
-++
++
+++ = very positive+ = positive(blank) = no impact- = negative-- = very negative
Jobs & Wealth
Overall, Alternatives A2a and A2c would not adversely affect jobs and wealth directlyand would provide a lower degree of certainty about the economic future. It is notanticipated that these alternatives would significantly improve fish returns and thereforethe planned development of the tourism sector of the economy may not grow asanticipated. Alternative A3 would adversely affects future economic certainty in theforestry and agricultural sectors and increases future economic risks because not all ofthe indirect and induced effects of these changes are known. For example, it is unclearhow the increased transportation costs would affect the timber industry’s ability to sellwood chips and if this increased cost would decrease the already unstable timberindustry in Orofino. Alternative A3 beneficially affects the future economic certainty ofthe tourism sector.
Negative impacts on community employment from Alternative A3 would result fromincreased transportation costs, reduction in countywide farm income, residentialelectrical rates, loss of Corps-related jobs, and short-term decreased recreationalopportunities. Farmers and other shippers currently utilizing the waterway to ship bulkproducts would experience increased costs to ship their goods and this would have a
Predecisional DocumentationFor Information Purposes Only - Not For Comment
Predecisional DocumentationFor Information Purposes Only - Not For Comment
negative effect on employment in those economic sectors. A small volume of graincurrently moves from Clearwater County on the lower Snake River while a largervolume of wood products move to Lewiston for eventual shipment down the waterway.These decreases are not expected to be larger than one percent although themagnitude of the effect on forest product manufacturers is unknown.
Positive impacts on community employment from Alternative A3 would result fromincreased truck transportation, increased anadromous fishing opportunities, and theshort-term increases in employment from implementation activities and modifications towater pumps. The projected increases in wild fish returns after 20 years are expected toincrease employment by approximately 2 percent. Given the established sport fishingindustry and strong retail trade sector in Orofino, the magnitude of this increase may bemuch greater given the potential future fish harvests.
Potlatch and Konkolville Lumber Company are two of the largest employers in Orofino.The effects of increased transportation costs are unknown but the increased financialobligations may adversely affect these employers.
Place
Orofino’s natural and built environment would not be significantly changed underAlternatives A2a, A2c, and A3. Flow augmentation water currently withdrawn from theDworshak Reservoir would continue under each of the proposed alternatives andcontinue to have negative effects on the local reservoir recreational opportunities andreservoir tourism. The loss of the Lower Granite pool would adversely affect thecommunity's access to recreation sites on the lower Snake River within 50 miles ofOrofino. The community would lose recreational access sites including ChiefLookinglass Park and Nisqually John Landing, as well as some recreational siteservices at Chief Timothy State Park, Hells Canyon Resort, Southway Park, and HellsGate State Park. The short-term displacement of Snake River recreationists may createcrowding on the Dworshak Reservoir and at sites on the Clearwater River. This mayalso provide a short-term economic benefit to the community. Finally, the financialpressures exerted on local farmers from higher transportation costs may lead to agreater consolidation of farms and a change in the rural land-use patterns aroundOrofino.
One long-term benefit of Alternative A3 would be the decrease in truck traffic along US12 as grains from Montana and North Dakota move to new transportation corridors. Thiswould have a positive effect of lessening traffic congestion and improving highwaysafety but it may also decrease the existing economic benefits of truck traffic.
Predecisional DocumentationFor Information Purposes Only - Not For Comment
Predecisional DocumentationFor Information Purposes Only - Not For Comment
Other long-term benefits of Alternative A3 would include the revegetation andrestoration of the normative Snake River. Additionally, the increased chance of salmonrecovery would benefit the identity of the community as a place where wild salmoncontinue to exist and local fishermen would continue to pursue this element of Orofino’squality of life. Alternatives A2a and A2c have higher risks associated with salmonrecovery and may then adversely community quality of life. The identity of thecommunity as the Steelhead Capital of the World would be enhanced by Alternative A3and would be adversely affected by alternatives A2a and A2c.
Vision & Vitality
Alternatives A2a, A2c and A3 all adversely affect Orofino’s vision and vitality bydecreasing the social cohesion of the community over the issue of salmon recovery andthe best way to achieve that goal. In addition, all of the alternatives continue with flowaugmentation over the protests of Orofino residents. The community has worked todevelop recreation and tourism alternatives in steelhead fishing and reservoir recreationto diversify their predominately timber-dependent economy. Those plans specific to theDworshak Reservoir would continue to be adversely affected by continued flowaugmentation. Alternatives A2a and A2c would adversely affect development for thesteelhead fishery and sportfishing industries. Alternative A3 would provide supportthese development efforts. Additionally, the negative effects of decreased farm incomeon both local and county property values and property tax revenue may createdifficulties in obtaining sufficient funding to pursue new avenues of economicdevelopment and maintain the current level of community services.
People
Changes in the physical and economic human environment would affect distinctpopulations in the community. The high number of fixed income families would berequired to pay a larger proportion of their income to power bills.
The forecast increase in long-term employment under Alternative A3 suggests thatrecent population trends should continue to increase but, given the 10 to 20 yearhorizon for increased salmon populations, population may increase slightly.
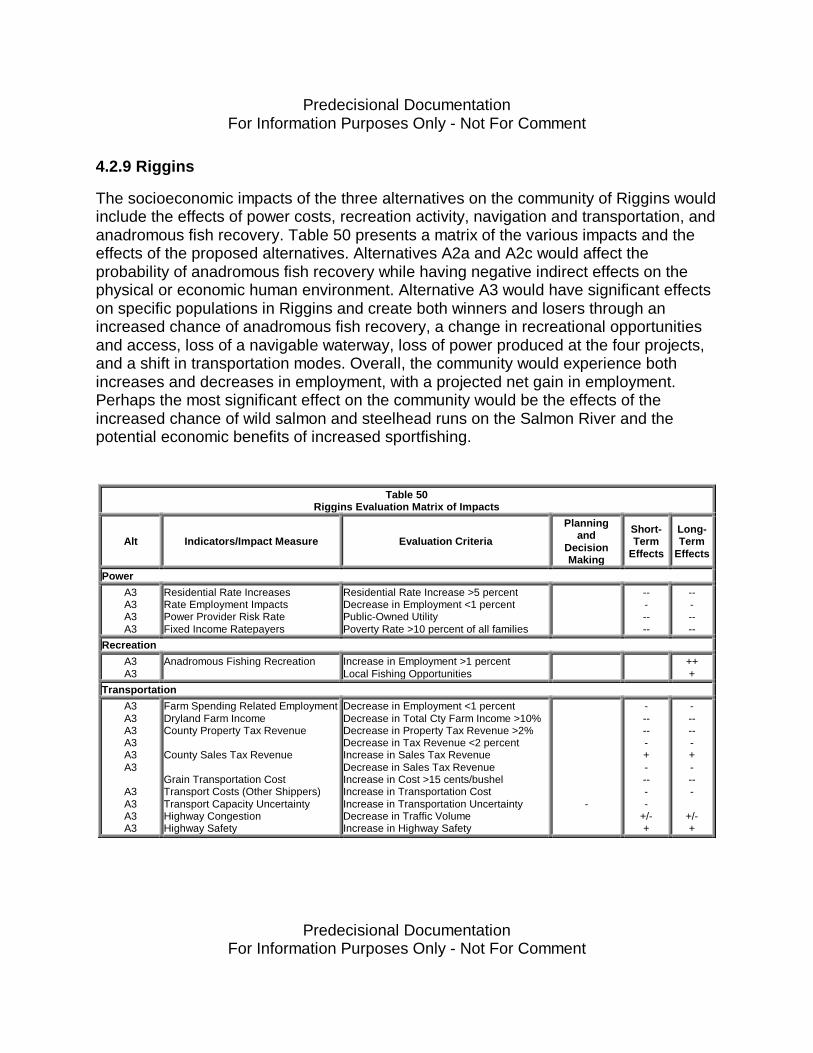
Predecisional DocumentationFor Information Purposes Only - Not For Comment
Predecisional DocumentationFor Information Purposes Only - Not For Comment
4.2.9 Riggins
The socioeconomic impacts of the three alternatives on the community of Riggins wouldinclude the effects of power costs, recreation activity, navigation and transportation, andanadromous fish recovery. Table 50 presents a matrix of the various impacts and theeffects of the proposed alternatives. Alternatives A2a and A2c would affect theprobability of anadromous fish recovery while having negative indirect effects on thephysical or economic human environment. Alternative A3 would have significant effectson specific populations in Riggins and create both winners and losers through anincreased chance of anadromous fish recovery, a change in recreational opportunitiesand access, loss of a navigable waterway, loss of power produced at the four projects,and a shift in transportation modes. Overall, the community would experience bothincreases and decreases in employment, with a projected net gain in employment.Perhaps the most significant effect on the community would be the effects of theincreased chance of wild salmon and steelhead runs on the Salmon River and thepotential economic benefits of increased sportfishing.
Table 50Riggins Evaluation Matrix of Impacts
Alt Indicators/Impact Measure Evaluation Criteria
Planningand
DecisionMaking
Short-Term
Effects
Long-Term
Effects
PowerA3A3A3A3
Residential Rate IncreasesRate Employment ImpactsPower Provider Risk RateFixed Income Ratepayers
Residential Rate Increase >5 percentDecrease in Employment <1 percentPublic-Owned UtilityPoverty Rate >10 percent of all families
-------
-------
RecreationA3A3
Anadromous Fishing Recreation Increase in Employment >1 percentLocal Fishing Opportunities
+++
TransportationA3A3A3A3A3A3
A3A3A3A3
Farm Spending Related EmploymentDryland Farm IncomeCounty Property Tax Revenue
County Sales Tax Revenue
Grain Transportation CostTransport Costs (Other Shippers)Transport Capacity UncertaintyHighway CongestionHighway Safety
Decrease in Employment <1 percentDecrease in Total Cty Farm Income >10%Decrease in Property Tax Revenue >2%Decrease in Tax Revenue <2 percentIncrease in Sales Tax RevenueDecrease in Sales Tax RevenueIncrease in Cost >15 cents/bushelIncrease in Transportation CostIncrease in Transportation UncertaintyDecrease in Traffic VolumeIncrease in Highway Safety
-
------+-----
+/-+
------+----
+/-+
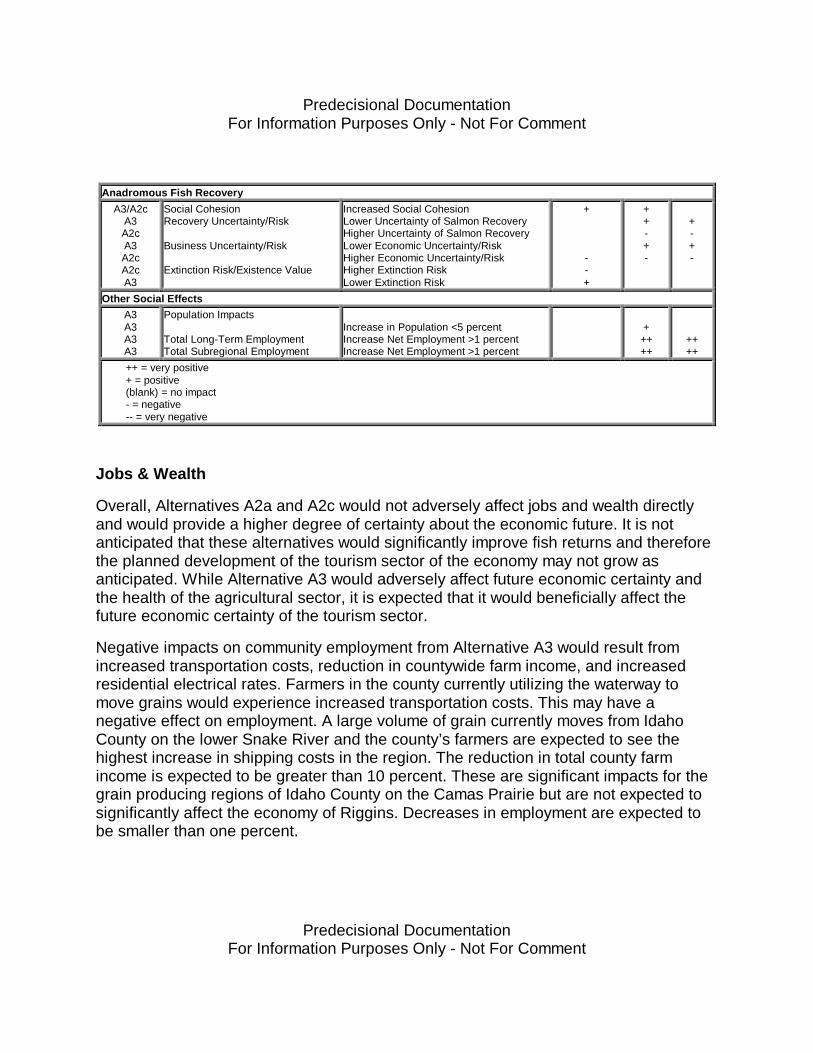
Predecisional DocumentationFor Information Purposes Only - Not For Comment
Predecisional DocumentationFor Information Purposes Only - Not For Comment
Anadromous Fish RecoveryA3/A2c
A3A2cA3A2cA2cA3
Social CohesionRecovery Uncertainty/Risk
Business Uncertainty/Risk
Extinction Risk/Existence Value
Increased Social CohesionLower Uncertainty of Salmon RecoveryHigher Uncertainty of Salmon RecoveryLower Economic Uncertainty/RiskHigher Economic Uncertainty/RiskHigher Extinction RiskLower Extinction Risk
+
--+
++-+-
+-+-
Other Social EffectsA3A3A3A3
Population Impacts
Total Long-Term EmploymentTotal Subregional Employment
Increase in Population <5 percentIncrease Net Employment >1 percentIncrease Net Employment >1 percent
+++++
++++
++ = very positive+ = positive(blank) = no impact- = negative-- = very negative
Jobs & Wealth
Overall, Alternatives A2a and A2c would not adversely affect jobs and wealth directlyand would provide a higher degree of certainty about the economic future. It is notanticipated that these alternatives would significantly improve fish returns and thereforethe planned development of the tourism sector of the economy may not grow asanticipated. While Alternative A3 would adversely affect future economic certainty andthe health of the agricultural sector, it is expected that it would beneficially affect thefuture economic certainty of the tourism sector.
Negative impacts on community employment from Alternative A3 would result fromincreased transportation costs, reduction in countywide farm income, and increasedresidential electrical rates. Farmers in the county currently utilizing the waterway tomove grains would experience increased transportation costs. This may have anegative effect on employment. A large volume of grain currently moves from IdahoCounty on the lower Snake River and the county’s farmers are expected to see thehighest increase in shipping costs in the region. The reduction in total county farmincome is expected to be greater than 10 percent. These are significant impacts for thegrain producing regions of Idaho County on the Camas Prairie but are not expected tosignificantly affect the economy of Riggins. Decreases in employment are expected tobe smaller than one percent.
Predecisional DocumentationFor Information Purposes Only - Not For Comment
Predecisional DocumentationFor Information Purposes Only - Not For Comment
Positive impacts on community employment from Alternative A3 would result fromincreased anadromous fishing opportunities. The projected increases in wild fish returnsafter 20 years are expected to increase employment by approximately 2 percent. Giventhe established sport fishing industry and the strong retail trade and service sectors inRiggins, the magnitude of this increase may be much greater given the potential futurefish harvests.
Place
Riggins’s natural and built environment would not be significantly changed underAlternatives A2a, A2c, and A3. The short-term displacement of lower Snake Riverrecreationists may create crowding at sites on the Salmon River. This may provide ashort-term economic benefit to the community. The financial pressures exerted on localfarmers from higher transportation costs may lead to a greater consolidation of farmsand a change in the rural land-use patterns around Riggins.
One long-term benefit of Alternative A3 would be the decrease in truck traffic along US95 as grains from Southern Idaho move to new transportation corridors. This wouldhave a positive effect of lessening traffic congestion and improving highway safety but itmay also decrease the existing economic benefits of through traffic. Another long-termbenefit of Alternative A3 would be the increased chance of salmon recovery. Theincreased chance of salmon recovery would benefit the identity of the community as aplace where wild salmon continue to exist and local fishermen would continue to pursuethis element of Riggins’ quality of life. Alternatives A2a and A2c have higher risksassociated with salmon recovery and may adversely community quality of life.
Vision & Vitality
Alternatives A2a, A2c, and A3 would affect Riggins’ vision and vitality by decreasing thesocial cohesion of the community over the issue of salmon recovery and the best way toachieve that goal. The community has worked to develop recreation and tourismalternatives in steelhead fishing and whitewater rafting after the community sawmillburned down. Alternatives A2a and A2c would adversely affect the development oftourism related to anadromous fish. Alternative A3 would provide support for thesedevelopment efforts. Additionally, the negative effects of decreased farm income onboth local and county property values and property tax revenue may create difficulties inobtaining sufficient funding to pursue new avenues of economic development andmaintain the current level of community services.
Predecisional DocumentationFor Information Purposes Only - Not For Comment
Predecisional DocumentationFor Information Purposes Only - Not For Comment
People
Changes in the physical and economic human environment would affect distinctpopulations in the community. The high number of fixed income families would berequired to pay a larger proportion of their income to power bills.
The forecast increase in long-term employment under Alternative A3 suggests thatrecent population trends should continue to increase, but given the 10 to 20 yearhorizon for increased salmon populations, population may increase slightly in theinterim.
5. Mitigation Analysis
5.1 Summary of Mitigation
This mitigation analysis examines the potential employment impacts and communitysocial impacts identified in this report and in the regional impact analysis. Based onthese projected impacts, similar Federal mitigation programs for natural resource policychanges were reviewed to determine the scope and budgetary outlays of theseprograms. Based on the review of the types of impacts and potential measures thatmight serve to mitigate or minimize negative impacts, estimates were made of totalmitigation for employment and community level impacts.
Total long-term employment losses across the Pacific Northwest forecast by theregional study indicate that between approximately 5,338 and 6,008 jobs might be lostas a result of Alternative A3. Total jobs gained are forecast at between 3,796 and 4,722after 20 years. Some of these job losses represent identifiable dislocated or displacedworkers while others are dispersed and difficult to identify. Of these losses,approximately 4,000 might be classified as dislocated. (This should, however, beconsidered preliminary as the Regional Study Team still has outstanding andunresolved issues that may significantly change these estimates.)
Employment losses based on middle estimates are distributed throughout the threesubregions: upriver -320 jobs, reservoir -2803, downriver -856. The state distribution ofemployment losses based on middle estimates are approximately -4332, -549, and -507for the states of Washington, Idaho and Oregon, respectively.
Predecisional DocumentationFor Information Purposes Only - Not For Comment
Predecisional DocumentationFor Information Purposes Only - Not For Comment
Approximately 67 communities in the lower Snake River subregion would be adverselyaffected by increased transportation costs. An additional 15 communities outside thedesignated study area would also be significantly affected by increased transportationcosts. These affected communities are primarily smaller than 1,000 inhabitants but alsoinclude the larger cities of Lewiston, Clarkston, Pasco, Kennewick, Richland, and WallaWalla.
Overall adverse community level social impacts identified through the CommunityForums and the community based impact assessment include the following:
1. Decreased net farm income and increased financial pressure on dryland farmersthroughout the region.
2. Increased consolidation of family farms and a decrease in rural farm population.
3. Decreased county property tax base in 20 regional counties.
4. Dislocated workers from Ice Harbor Irrigated agricultural lands and loss of asource of local school revenue.
5. Shifted economic base of communities and changed potential for future growth.
Many of these significant community level and employment impacts are caused by theincreased transportation costs of trucking grain and by the loss of irrigated agricultureon the Ice Harbor Reservoir. These impacts could be minimized in part by mitigationspending to modify the irrigation pumps and direct upgrades to expand rail capacity inthe region. Another strategy would be to directly subsidize the farms currently shippingon the lower Snake River. The costs of these mitigation measures have been discussedin the Transportation and Irrigation reports. In the absence of direct mitigation,employment and community level impacts could be mitigated or minimized as describedbelow.
Potential mitigation expenditures for 4,000 dislocated workers have been estimated atbetween $45.1 million and $48.1 million to address employment losses. Potentialmitigation for 82 affected communities has been estimated at between $4.3 million and$12.9 million based on previous mitigation expenditures described below.
Predecisional DocumentationFor Information Purposes Only - Not For Comment
Predecisional DocumentationFor Information Purposes Only - Not For Comment
Under Alternative A2, the lower probability of salmon recovery and eventual increasedor resumed harvest would affect approximately 10 communities in the lower SnakeRiver region, an unknown number of CRITFIC member tribal communities, as well as anunknown number of coastal fishing communities. No estimate for future mitigation underthis alternative is given. One proxy might be the opportunity cost of foregone fishingrevenue as forecast by the Recreation Team and the Anadromous Fish EconomicTeam.
5.2 Potential Mitigation for Employment Impacts
To identify possible strategies for mitigating potential adverse social and employmentimpacts caused by salmon recovery alternatives, a literature review was conducted onexisting rural development programs in the states of Washington, Idaho, and Oregon,as well as programs specifically targeting workers dislocated as a result of the spottedowl legislation. Both federal and state programs were reviewed. The following programswere identified to provide a benchmark of potential mitigation.
5.2.1 Conservation Reserve Program (CRP)
The USDA initiated the CRP in 1985 to conserve highly erodible croplands throughretiring agricultural lands for 10-year periods and converting these lands to soil-conserving grasses or trees. In addition to reducing soil erosion, the CRP also provideshabitat for wildlife and protects water quality. The program is achieved through payingincentives to farmers who volunteer to leave a portion of their land fallow for up to 10years. Over $27,000,000 dollars were paid out in 1995 through this program to farmersin the lower Snake River study area (approximately $5,400 per harvested farm, onaverage).
5.2.2 The Timber Retraining Benefits Program
The Timber Retraining Benefits (TRB) Program was initiated in 1991 and is aWashington state-based program based out of the Employment Security Departmentfunded in part under Title III of the Job Training Partnership Act (JTPA). The TRBprogram’s principle purpose is to serve timber-dependent communities. The programprovides funding for retraining efforts for dislocated natural resource workers who havebeen impacted by changes in the economy. Workers impacted by the downturn innatural resource jobs and who participated in this program have an 81 percentemployment rate and have recovered 91 percent of their former wage. Benefits areusually for timber-related losses, although it has been recently proposed to have TRBinclude salmon-dislocated workers as well. To date, the TRB program has spentapproximately $161,694,794 for worker retraining. Approximately 13,942 individualshave been served, at a cost of $11,597.67 per worker.
Predecisional DocumentationFor Information Purposes Only - Not For Comment
Predecisional DocumentationFor Information Purposes Only - Not For Comment
5.2.3 Trade Adjustment Assistance Program
The Trade Adjustment Assistance (TAA) Program targets workers who lose their jobs orexperience wage reductions due to foreign import competition. It provides vocationaland academic training, income support, and reimbursement. In Washington State, 1997spending on this program was approximately 6 million dollars or $2,598 per worker.
5.2.4 NAFTA Trade Adjustment Assistance
The NAFTA Trade Adjustment Assistance program grew out of the TAA and targetsjobs impacted by trade with Canada and Mexico after implementation of the NorthAmerican Free Trade Agreement. In 1998, support to 507 dislocated workers inWashington State was $257,794 or $508 per worker.
5.2.5 Dislocated Workers Program of Washington State
The Dislocated Workers Program of Washington State is intended to assist workerswho have been terminated from employment and are unlikely to return to work in theindustry or occupation due to diminished demand for their skills. The program has had4,439 workers complete training, 3,714 have been placed in jobs, and the averagewage earned is $12.35 per hour. No cost was obtained for this program.
5.2.6 Community Recommendations for Mitigation A1 -- A3
[This will be completed based on the University of Idaho Final Report]
5.3 Potential Mitigation Examples for Community Social Impacts
The Northwest Economic Adjustment Initiative is part of President Clinton’s NorthwestForest Plan and is aimed at providing economic stability to Northwest timber dependentcommunities by developing new economic opportunities for year-round, family-wage,high-skilled jobs. The Initiative brings together nine federal agencies as well as stateand local governments to fund and assist projects that have been identified as prioritiesby local communities or counties. The Initiative provides four categories of assistance:workers and families, business and industry, communities and infrastructure, andecosystem investment. Congress initially authorized the program for 5 years with anallocation of 1.2 billion dollars. The program has been extended for two years to theyear 2000. Funding for the Initiative was channeled through State Community EconomicRevitalization Teams (SCERTs) established in the states of Washington, Oregon andIdaho.
Predecisional DocumentationFor Information Purposes Only - Not For Comment
Predecisional DocumentationFor Information Purposes Only - Not For Comment
The goal of the Initiative is to provide seamless access to technical support and fundingthrough leading and supporting local communities through interagency coordination.One example of this program is the work coordinated by the USFS through the OregonCERT in the Columbia River Gorge. The target communities were those identified astimber-distressed. Fourteen grants worth $496,655 have been appropriated for thisproject ($35,475 per community plus $16,979 cost sharing). These awards have beenmatched by $237,715 of funds from the project's proponents. Projects have beenchanneled through counties, communities, and non-profit groups for projects such asinfrastructure development, comprehensive plans, and leadership development training.Other types of projects eligible for funding include feasibility studies, marketing andtourism, business development, downtown beautification, education and training, andjob skill development.
5.4 Compensation Potential
The employment impacts identified in the regional analysis could be addressed byproviding targeted job retraining and education credits to dislocated workers. Theeffects on net farm income due to increased transportation costs could be mitigatedthrough a program similar to the Conservation Reserve Program whereby farmerswould receive compensation equal to the transportation cost increases. Communitylevel impacts could be addressed by providing block grants to affected communities inthe region for economic diversification activities. For example, to mitigate farmcommunities most affected by the loss of river transportation, economic developmentprograms similar to those mentioned above could be utilized to create more local valueadded products and decrease dependency on the export of unprocessed grains toforeign markets.
Under Alternative A2, the lower probability of and higher degree of risk associated withanadromous fish recovery may lead to negative economic and social impacts to sportfishing dependent communities. These communities may lose an important componentof their economic base and may need assistance to transition to another non-fisherydependent job base.
6. Literature Cited
References will be provided in the Final Social Analysis Report.
Predecisional DocumentationFor Information Purposes Only - Not For Comment
Predecisional DocumentationFor Information Purposes Only - Not For Comment
Annex A:Regional Information
Annex B:The Effects of Socioeconomic Changes on Rural Agricultural Communities:A Review of the Literature