Time and Time Transfer - Frequency Electronics Inc - Precision

1
Low-Loss Materials in High Frequency Electronics and the Challenges of Measurement
Glenn [email protected]

E.I. Du Pont de Nemours
2
• Company founded in 1802 – First Century: Gun Powder
• Supplied US Military
• Trust Busted in 1912 – Second Century: Chemical Company
• First polymers: Neoprene, Nylon
• Ongoing brands: Teflon®, Tyvek®, Nomex®, Kevlar®, Kapton®, Corian®
• Third Century: Science to Feed, Protect, and Sustain
• In: Danisco, Pioneer
• Out: Commodity Polymers, Coatings, Chemours

Drivers of Higher Frequency - Mobile
Ericsson Mobility Report –November 2014
http://www.ericsson.com/ericsson-mobility-report
3
• People now expect high quality video content.
• Almost everyone will have mobile devices utilizing more and more bandwidth.

Drivers of Higher Frequency – Cloud Data
4
• Examples from Cisco Systems
• Not only does the video content need to be delivered, but it needs to be stored and connected.
http://www.cisco.com/c/en/u
s/solutions/service-
provider/global-cloud-index-
gci/index.html

Material Requirements for High Frequency
Dielectric for Cables:
• Film, Tape or Melt Processible
Dielectrics for Printed Circuits:
• Adhesion of dielectric to metal
• Not absorb chemicals from wet processing (etching & plating)
• Able to reliably connect between layers (vias)
• Withstand solder assembly and thermal cycles during operation
5
Most Cases: Low Dielectric Constant and Low Loss

What is Special about Fluoropolymers?
• Chemically inert and resistant to solvents
• Non-stick (self cleaning)
• Low friction (self lubricating)
• Broad operating temperature range (-200 C to +260 C)
• Does not degrade in humidity and UV light
• Non-toxic and non-flammable
• Low dielectric constant and dielectric loss
6
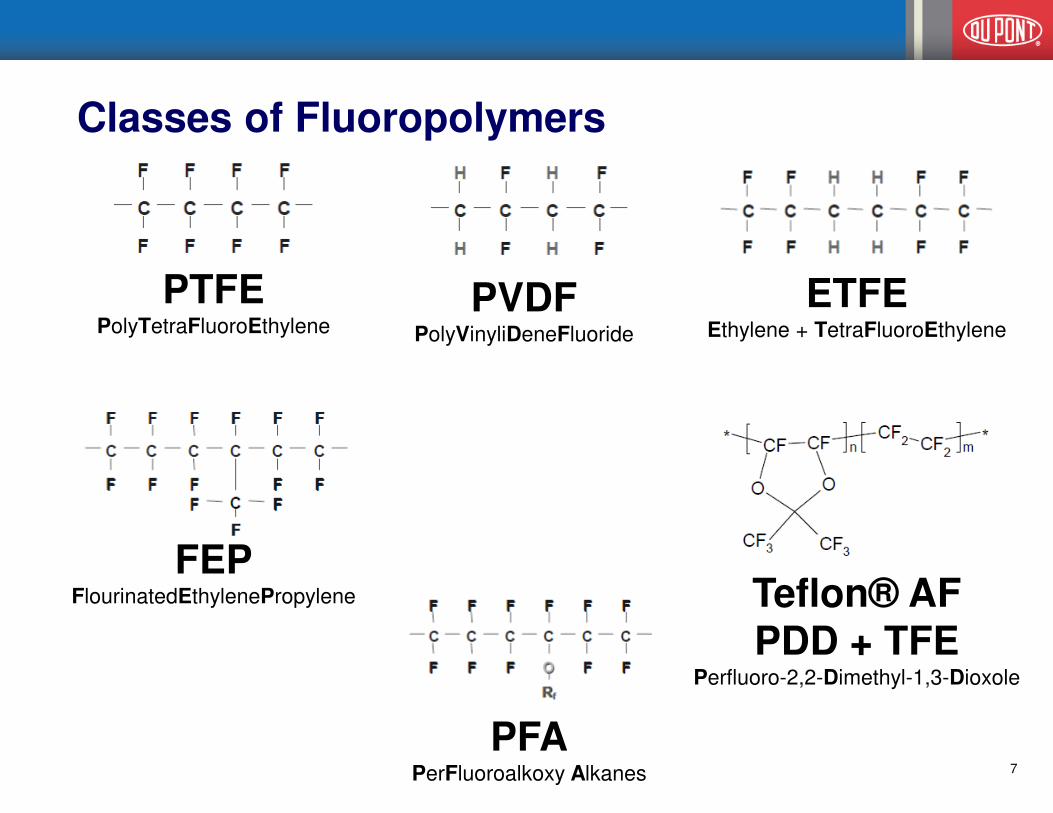
Classes of Fluoropolymers
7
PTFEPolyTetraFluoroEthylene
PVDFPolyVinyliDeneFluoride
ETFEEthylene + TetraFluoroEthylene
FEPFlourinatedEthylenePropylene
PFAPerFluoroalkoxy Alkanes
Teflon® AFPDD + TFE
Perfluoro-2,2-Dimethyl-1,3-Dioxole
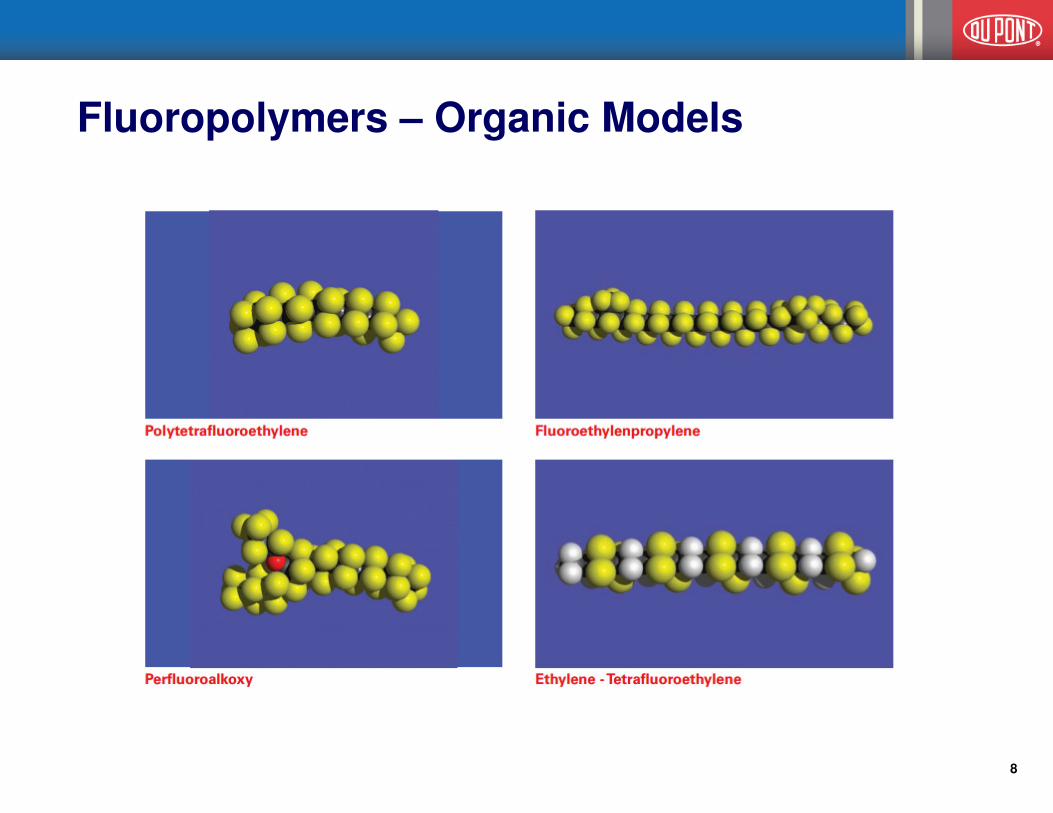
8
Fluoropolymers – Organic Models

9
Alumina particles
Low Temperature Cofired Ceramic (LTCC)
Roughly speaking, think of a
unfired (green) ceramic cast
into a tape consisting of
Alumina particles (green), glass
particles (red) and polymeric
binder (blue).
The packing density of the
particles in Green Tape™ is
very high, with binder occupying
interstitial areas. This allows for
screen printing of metal on the
unfired tape.
The binder will burn out during
firing
Glass particles

Dielectric Constant
10
Reference: Keysight Applications Note “Basics of Measuring the Dielectric Properties of Materials”
http://cp.literature.agilent.com/litweb/pdf/5989-2589EN.pdf (Note: Agilent is now Keysight)
DC Case: Very simple. κ‘ is real and just depends on capacitance. There is no loss
because there is no current (open circuit).
Electric field is static.
AC Case: Now
there is current. Electric field
changes with
frequency.

Permittivity is a complex number.
Real component = κ‘ = εr‘= “Dk”
Imaginary component = εr “
Tan (εr “/ εr ‘) = Tan δ = Loss Tangent
Relative Permittivity and Loss Tangent
• Relative Permittivity is the more correct way to express “Dk” above 1 GHz.
• Magnitude of permittivity is fairly constant at low frequencies.
• As frequencies increase, more interaction with materials since wavelengths are on same scale as circuit features• at 1 GHz, λair = 30 cm• at 10 GHz, λair = 3 cm
Reference: Keysight Applications Note “Basics of Measuring the Dielectric Properties of Materials”
http://cp.literature.agilent.com/litweb/pdf/5989-2589EN.pdf (Note: Agilent is now Keysight)11

Permittivity: Vector and Complex Property
� NOT CONSTANT WITH FREQUENCY!
� ω = 2π * frequency
� More precisely, εεεεr(ω) (ω) (ω) (ω) ==== εεεεr (ω)(ω)(ω)(ω)’ + + + + i εεεεr (ω)(ω)(ω)(ω)”
• Real component εr (ω)’ associated with energy STORED
• Imaginary component εr (ω)” associated with energy ABSORBED
� These are complex, vector components
� Most circuit materials are planar, and regular in the x-y
direction so the permittivity components are generally
referred to as “in plane” and “normal”
� The difference between these two directions can be
between 0%– 20 % for common commercial circuit
materials.12
normal εεεεr
In plane εεεεr

Basic Mechanisms that affect
real and complex permittivity.
In the GHz range, the most common
mechanism is Rotation or
Precession of Dipoles. Rotation is
shown here.
13
Complex Permittivity
Reference: Keysight Applications Note “Basics of Measuring the Dielectric Properties of Materials”
http://cp.literature.agilent.com/litweb/pdf/5989-2589EN.pdf (Note: Agilent is now Keysight)
Note: Every material has different curves (different
elements, bonds, etc.) AND how the materials are
polymerized affect these curves.

Printed Circuit Materials are Usually Composites
• Almost all dielectrics > 100 um thick are
composites of dielectric, glass, and
fillers
• Glass fabric is used as reinforcement
• Some inorganic fillers are used to tune
properties like dielectric constant or
linear expansion
• Often organics are thermosets like
epoxies that cross-link
• It is practically impossible to model all of
the composite materials individually to
build correct models of their high
frequency behavior. Measurements are
required14

How to Measure Permittivity and Loss < 20 MHz
15
• Capacitance (IEC 60250 / ASTM D150)
• Mature Technology – These techniques have not changed
in many decades.
Intertek Plastics Technology Labhttp://www.ptli.com/
Keysight Technologieshttp://www.keysight.com/

How to Measure Permittivity and Loss < 1 GHz
16
• FSR (Full Sheet Resonance)
• IPC-TM-650 2.5.5.6
• Copper clad panel acting as a parallel plate waveguide
• Resonance peaks are established within the panel
• Resonates at frequency where a ½ wave is within the panel
• Multiples of ½ waves will have resonance peaks too
• This is a low microwave frequency test, because the panels are relatively large (18”x12” or more) and a ½ wave which is that long, will be low frequency
Borrowed from John Coonrod of Rogers Corporateion – We gave a workshop together in 2014 at DesignCon

Resonator Methods from 2-20 GHz
Three Common Approaches:
1. Dielectric Resonators
2. Waveguide Cavity Resonator Perturbation
3. Cylindrical Cavity Resonator Perturbation
17
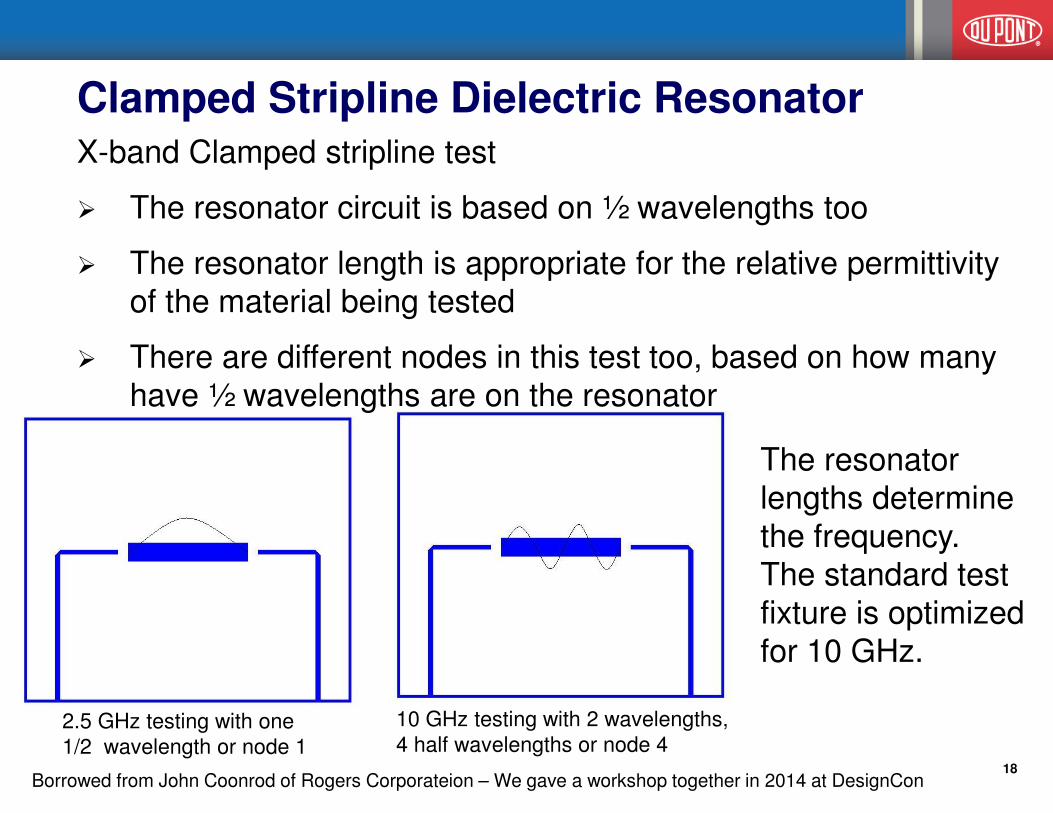
Clamped Stripline Dielectric ResonatorX-band Clamped stripline test
� The resonator circuit is based on ½ wavelengths too
� The resonator length is appropriate for the relative permittivity of the material being tested
� There are different nodes in this test too, based on how many have ½ wavelengths are on the resonator
18
10 GHz testing with 2 wavelengths,
4 half wavelengths or node 42.5 GHz testing with one
1/2 wavelength or node 1
The resonator lengths determine the frequency. The standard test fixture is optimized for 10 GHz.
Borrowed from John Coonrod of Rogers Corporateion – We gave a workshop together in 2014 at DesignCon

Clamped Stripline Dielectric Resonator
19Borrowed from John Coonrod of Rogers Corporateion – We gave a workshop together in 2014 at DesignCon

Waveguide Cavity Resonator Perturbation
20
Basic principle is to define a resonant structure of a constant volume and compare the changes
in resonant frequency and Q resulting from adding the material under test.
Vc = Volume of Cavity Vs = Volume of Sample
Qc = Q of Empty Cavity Qs = Q of Cavity with Sample
fc = Resonant Frequency of Empty Cavity fs = Resonant Frequency of Cavity with Sample
Approximate equations shownto illustrate the main factors and
how they relate.
In practice, transcendental equations solved numerically.
In a rectangular waveguide cavitythe electric field is oriented in thesame plane as the dielectric.
resonance
magnitude
fs fc
Qs
Qc
resonant
frequency
cavity with
dielectric
inside
empty
cavity
3 dB
points
)11
(4
''css
cr
QQV
V−≈ε
)(
)(' airr
ss
sccr
fV
ffVεε +
−≈

Waveguide Cavity Resonator Perturbation
21
Resonant Cavity measured with film inside and data is stored….
Then the sample is removed without changing cavity dimensions…
The effect of the cavity is calibrated out and you are left with the frequency
response of the material.
Network Analyzer
Resonant Cavity
Two sets of measurements done for each sample, one rotated 90 degrees from the
other (to see if the two planar directions are equal).
First six odd-mode resonances measured. For this geometry, these are at
2.2, 3.4, 5, 6.8, 8.6 and 10.4 GHz.
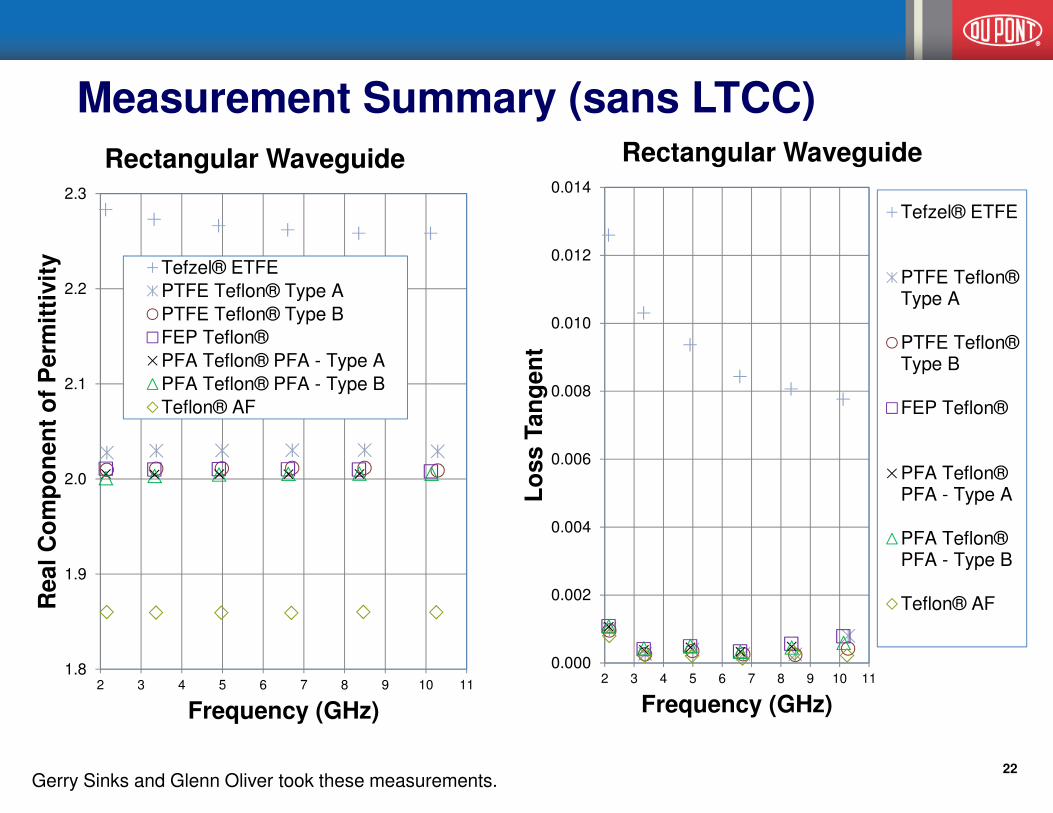
Measurement Summary (sans LTCC)
22
1.8
1.9
2.0
2.1
2.2
2.3
2 3 4 5 6 7 8 9 10 11
Real
Co
mp
on
en
t o
f P
erm
itti
vit
y
Frequency (GHz)
Rectangular Waveguide
Tefzel® ETFE
PTFE Teflon® Type A
PTFE Teflon® Type B
FEP Teflon®
PFA Teflon® PFA - Type A
PFA Teflon® PFA - Type B
Teflon® AF
0.000
0.002
0.004
0.006
0.008
0.010
0.012
0.014
2 3 4 5 6 7 8 9 10 11
Lo
ss T
an
gen
t
Frequency (GHz)
Rectangular Waveguide
Tefzel® ETFE
PTFE Teflon®Type A
PTFE Teflon®Type B
FEP Teflon®
PFA Teflon®PFA - Type A
PFA Teflon®PFA - Type B
Teflon® AF
Gerry Sinks and Glenn Oliver took these measurements.

Raw Data Example
23
At 2.2 GHz:Lowest Q resonance and affected by moisture in air
At 10.4 GHz:Interfering mode nearby,
affecting repeatability

Split Cylinder Resonator Perturbation
24
• Standard Method developed by NIST
• Very precise method
• Size of cavity depends on the thickness of the
sample so…
– Sample must be almost perfectly flat
– Thickness measurement accuracy and precision is
critical
• Electric Field oriented IN THE PLANE of the
dielectric.

2/4/2015 25
Cavity used in our
lab pictured below:
Inside radius about
19 mm
Inside cavity depth
about 10 mm

Animation of E Fields: TE011
2/4/2015 26
TOP VIEW
SIDE VIEW
Big thanks to Brad Thrasher
at DuPont for helping
generate these HFSS
models.

Split Cylinder Resonator – Higher Order Modes
2/4/2015 27
OK
OK
NO!!

Split Cylinder – Summary Results
2/4/2015 28
Jim Parisi of DuPont took these measurements.

Resonator Method for 15-65 GHz
Open Resonator (Fabry-Perot)
• Hemispherical Mirrors
• Distance between mirrors allow
for different useable bandwidths
• Close together good at 20 GHz
• Far apart good at 60 GHz
• Very precise (Q >105 common)
• Quite tedious – thermal
expansion causes cavity length
to change due to very slight
temperature changes
29

2/4/2015 30
Lowest and Flattest response of any polymer.
Open Resonator Measurements
0.0000
0.0005
0.0010
0.0015
0.0020
5 15 25 35 45 55 65
Lo
ss T
an
gen
t
Frequency (GHz)
Green TapeTM 9K7 LTCC
L=4.8"
L=8.4"
L=10.5"
6.95
7.00
7.05
7.10
7.15
5 15 25 35 45 55 65Perm
itti
vit
y (
Real
Co
mp
on
en
t)
Frequency (GHz)
Green TapeTM 9K7 LTCC
L=4.8"
L=8.4"
L=10.5"
1.90
1.95
2.00
2.05
2.10
5 15 25 35 45 55 65Perm
itti
vit
y (
Real
Co
mp
on
en
t)
Frequency (GHz)
PTFE Teflon® Type A
L=4.8"
L=8.4"
L=10.5"
0.0000
0.0005
0.0010
0.0015
0.0020
5 15 25 35 45 55 65
Lo
ss T
an
gen
t
Frequency (GHz)
PTFE Teflon® Type A
L=4.8"
L=8.4"
L=10.5"
Positive slope due mostly to sintered glass. Larger error bars due to
stability of lab ambient temperature.

2/4/2015 3131
0.0000
0.0005
0.0010
0.0015
0.0020
5 15 25 35 45 55 65
Lo
ss T
an
gen
t
Frequency (GHz)
Teflon® FEP
L=4.8"
L=8.4"
L=10.5"
1.90
1.95
2.00
2.05
2.10
5 15 25 35 45 55 65Perm
itti
vit
y (
Real
Co
mp
on
en
t)
Frequency (GHz)
Teflon® FEP
L=4.8"
L=8.4"
L=10.5"
0.0000
0.0005
0.0010
0.0015
0.0020
5 15 25 35 45 55 65
Lo
ss T
an
gen
t
Frequency (GHz)
PTFE Teflon® Type B
4.8"
L=8.4"
L=10.5"
1.90
1.95
2.00
2.05
2.10
5 15 25 35 45 55 65Perm
itti
vit
y (
Real
Co
mp
on
en
t)
Frequency (GHz)
PTFE Teflon® Type B
4.8"
L=8.4"
L=10.5"
Type B is easier to process than Type A
Open Resonator Measurements

2/4/2015 32
Open Resonator Measurements
0.0000
0.0005
0.0010
0.0015
0.0020
5 15 25 35 45 55 65
Lo
ss T
an
gen
t
Frequency (GHz)
Teflon® PFA – Type A
L=4.8"
L=8.4"
L=10.5"
1.90
1.95
2.00
2.05
2.10
5 15 25 35 45 55 65Perm
itti
vit
y (
Real
Co
mp
on
en
t)
Frequency (GHz)
Teflon® PFA – Type A
L=4.8"
L=8.4"
L=10.5"
0.0000
0.0005
0.0010
0.0015
0.0020
5 15 25 35 45 55 65
Lo
ss T
an
gen
t
Frequency (GHz)
Teflon® PFA – Type B
L=4.8"
L=8.4"
L=10.5"
1.90
1.95
2.00
2.05
2.10
5 15 25 35 45 55 65Perm
itti
vit
y (
Real
Co
mp
on
en
t)
Frequency (GHz)
Teflon® PFA – Type B
L=4.8"
L=8.4"
L=10.5"
Type B is a more pure grade of PFA than Type A

2/4/2015 33
0.0000
0.0020
0.0040
0.0060
0.0080
0.0100
5 15 25 35 45 55 65
Lo
ss T
an
gen
t
Frequency (GHz)
Tefzel® ETFE
L=4.8"
L=8.4"
L=10.5"
2.20
2.25
2.30
2.35
2.40
5 15 25 35 45 55 65Perm
itti
vit
y (
Real
Co
mp
on
en
t)
Frequency (GHz)
Tefzel® ETFE
L=4.8"
L=8.4"
L=10.5"
0.0000
0.0005
0.0010
0.0015
0.0020
5 15 25 35 45 55 65
Lo
ss T
an
gen
t
Frequency (GHz)
Teflon® AF
L=4.8"
L=8.4"
L=10.5"
1.80
1.85
1.90
1.95
2.00
5 15 25 35 45 55 65Perm
itti
vit
y (
Real
Co
mp
on
en
t)
Frequency (GHz)
Teflon® AF
L=4.8"
L=8.4"
L=10.5"
Note: order of magnitude difference in loss tangent between Teflon® and Tefzel®
Open Resonator Measurements
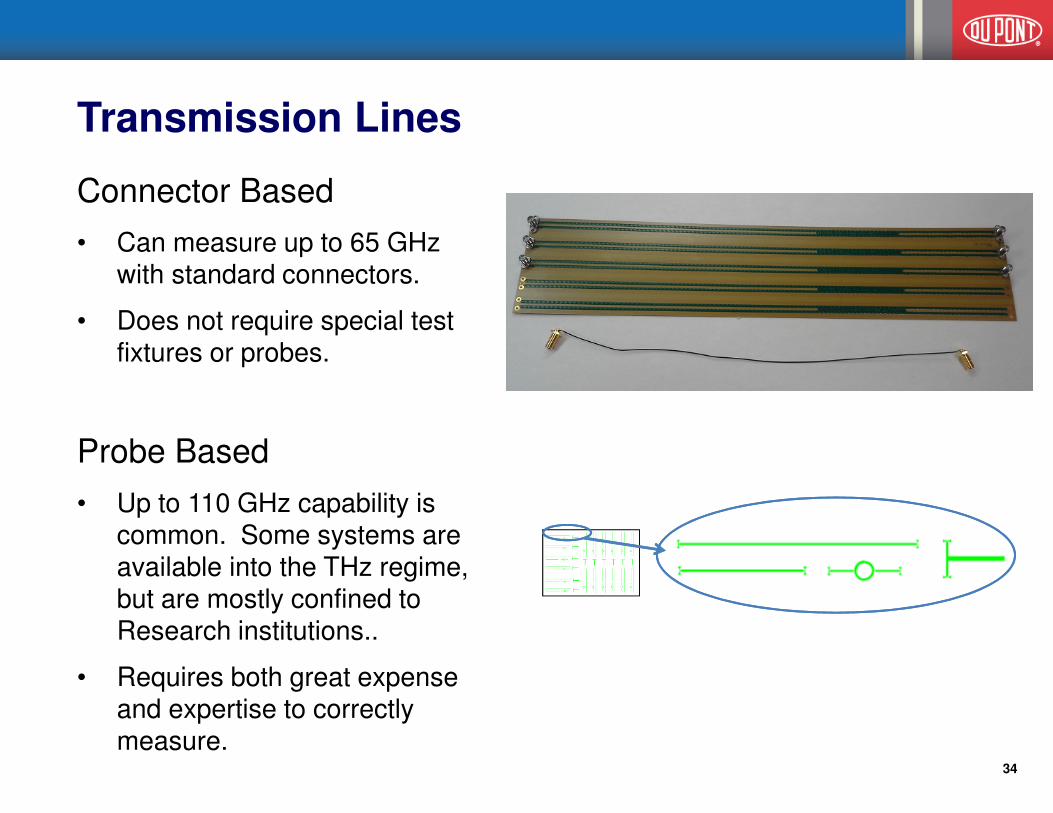
Transmission Lines
Connector Based
• Can measure up to 65 GHz with standard connectors.
• Does not require special test fixtures or probes.
Probe Based
• Up to 110 GHz capability is common. Some systems are available into the THz regime, but are mostly confined to Research institutions..
• Requires both great expense and expertise to correctly measure.
34

Measurements of du Pont materials by SWISSto12
using its MCK product
January 2015
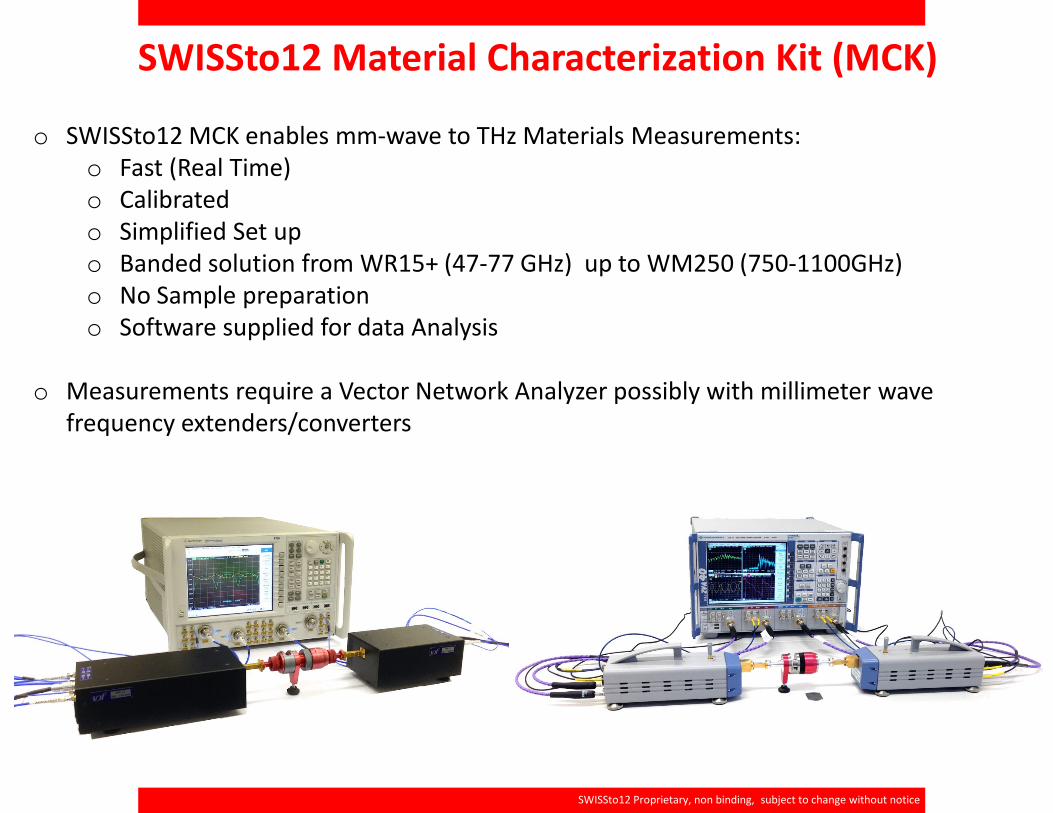
SWISSto12 Material Characterization Kit (MCK)
o SWISSto12 MCK enables mm-wave to THz Materials Measurements:
o Fast (Real Time)
o Calibrated
o Simplified Set up
o Banded solution from WR15+ (47-77 GHz) up to WM250 (750-1100GHz)
o No Sample preparation
o Software supplied for data Analysis
o Measurements require a Vector Network Analyzer possibly with millimeter wave
frequency extenders/converters
SWISSto12 Proprietary, non binding, subject to change without notice
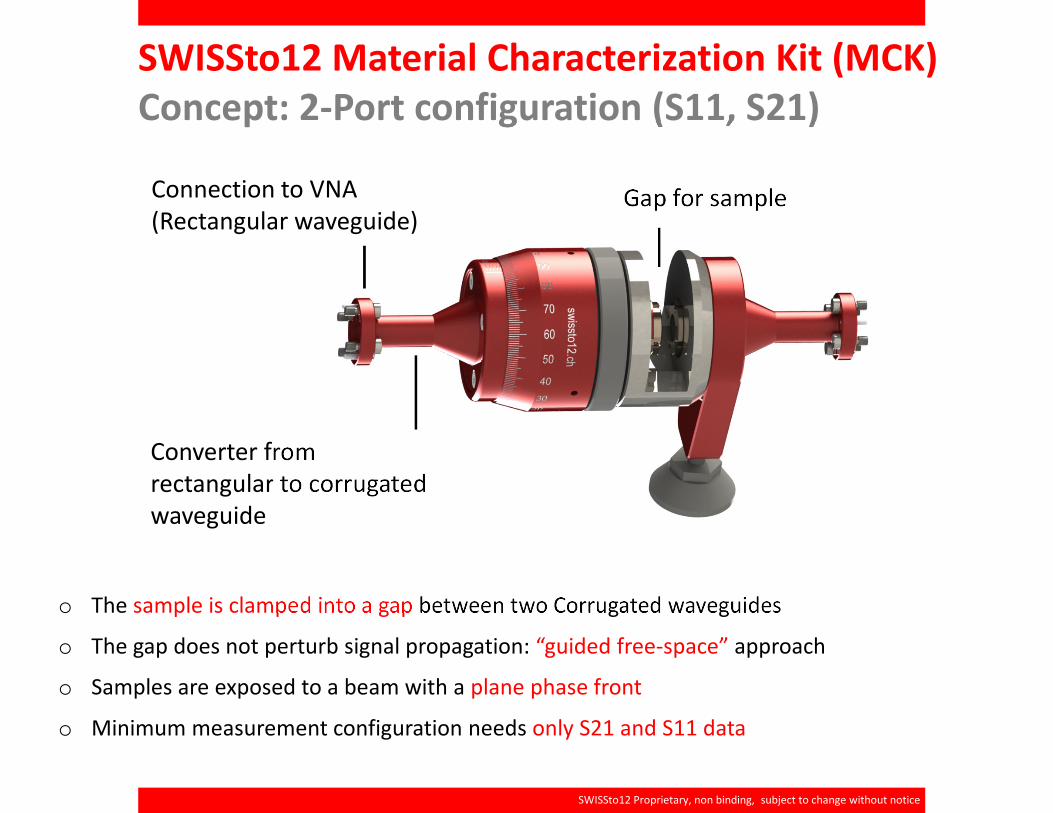
SWISSto12 Material Characterization Kit (MCK)
Concept: 2-Port configuration (S11, S21)
o The sample is clamped into a gap between two Corrugated waveguides
o The gap does not perturb signal propagation: “guided free-space” approach
o Samples are exposed to a beam with a plane phase front
o Minimum measurement configuration needs only S21 and S11 data
Gap for sample
Converter from
rectangular to corrugated
waveguide
Connection to VNA
(Rectangular waveguide)
SWISSto12 Proprietary, non binding, subject to change without notice
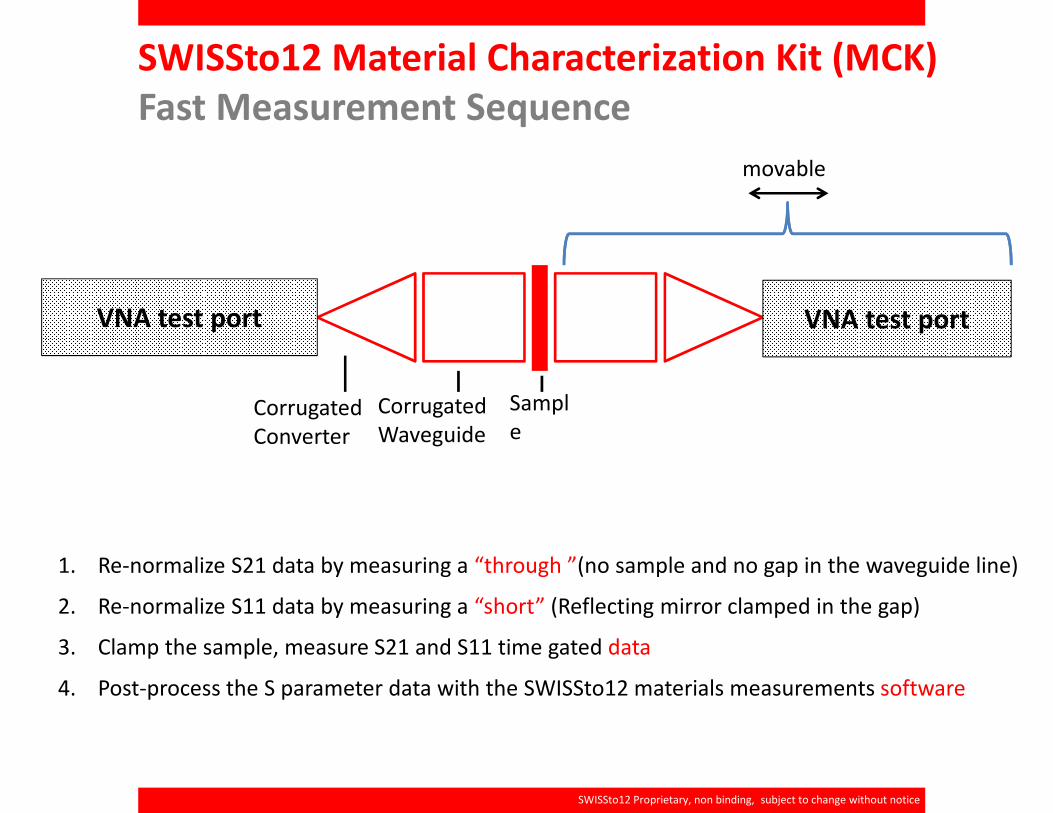
1. Re-normalize S21 data by measuring a “through ”(no sample and no gap in the waveguide line)
2. Re-normalize S11 data by measuring a “short” (Reflecting mirror clamped in the gap)
3. Clamp the sample, measure S21 and S11 time gated data
4. Post-process the S parameter data with the SWISSto12 materials measurements software
VNA test port VNA test port
movable
Corrugated
Waveguide
Corrugated
Converter
Sampl
e
SWISSto12 Material Characterization Kit (MCK)
Fast Measurement Sequence
SWISSto12 Proprietary, non binding, subject to change without notice

Material Characterization KIT (MCK)
Example: setup in WR-1.5 band (500-750 GHz)
SWISSto12 Short for calibration
SWISSto12 MCK
SWISSto12 Proprietary, non binding, subject to change without notice
39

DuPont Teflon® FEP (constant permittivity assumed)
Measurement 1
• Thickness = 2.58 mm
• ε = 2.06
• Tanδ = 1.08 E-3
Measurement 2
• Thickness = 2.63 mm
• ε = 1.98
• Tanδ = 1.19 E-3

DuPont Teflon® AF (constant permittivity assumed)
Measurement 1
• Thickness = 1.53 mm
• ε = 1.94
• Tanδ = 1.21 E-3
Measurement 2
• Thickness = 1.51 mm
• ε = 1.95
• Tanδ = 1.25 E-3

DuPont Tefzel® ETFE Frequency Dependent Model
2.55 mm thick sample

Summary of All Measurements - Er
43
6.9
7.0
7.1
7.2
7.3
1 10 100 1000
Re
lati
ve
Pe
rmit
tiv
ity
Frequency (GHz)
Broadband Summary of Er
9K7 LTCC
1.8
1.9
2.0
2.1
2.2
2.3
2.4
1 10 100 1000
Re
lati
ve
Pe
rmit
tiv
ity
Frequency (GHz)
Tefzel® ETFE
PTFE Teflon® Type A
PTFE Teflon® Type B
PFA Teflon® Type B
PFA Teflon® Type A
Teflon® FEP
Teflon® AF

Summary of All Measurements - Er
2/4/2015 44
Ambient H20
and low Q bias
All within measurement error of each other
Suggests electronic
mechanism beginning to
dominate over dipole
rotation

Summary Table with Uncertainty
2/4/2015 45