Low Loss 67 Material for High Frequency Power Applications … · 2016-04-04 · Low Loss 67...
23
Low Loss 67 Material for High Frequency Power Applications Presented by: Fair-Rite Products Corporation APEC 2016 Rachael Parker & Michael Arasim
Transcript of Low Loss 67 Material for High Frequency Power Applications … · 2016-04-04 · Low Loss 67...
Low Loss 67 Material for High Frequency Power Applications
Presented by: Fair-Rite Products Corporation
APEC 2016 Rachael Parker & Michael Arasim
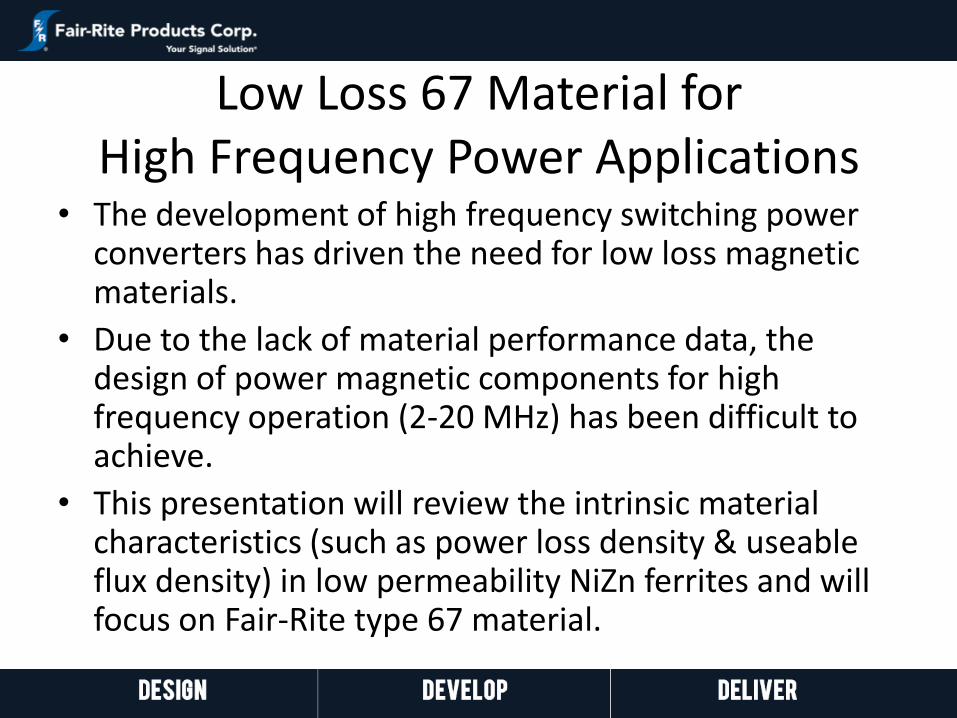
Low Loss 67 Material for High Frequency Power Applications
• The development of high frequency switching power converters has driven the need for low loss magnetic materials.
• Due to the lack of material performance data, the design of power magnetic components for high frequency operation (2-20 MHz) has been difficult to achieve.
• This presentation will review the intrinsic material characteristics (such as power loss density & useable flux density) in low permeability NiZn ferrites and will focus on Fair-Rite type 67 material.
Agenda
• Market Motivation
• Classic methods for estimating Performance Factor
• New Test method – “Resonant Q”
• Performance data 67 and other Fair-Rite materials
Market Motivation
• Miniaturization is a driving force in electronics design. – Magnetics are typically the largest component in
power supplies.
• In order to minimize power supply footprints, operating frequency has been increasing. – Power loss of magnetic components
incorporated into these designs can cause issues with efficiency and heat management.
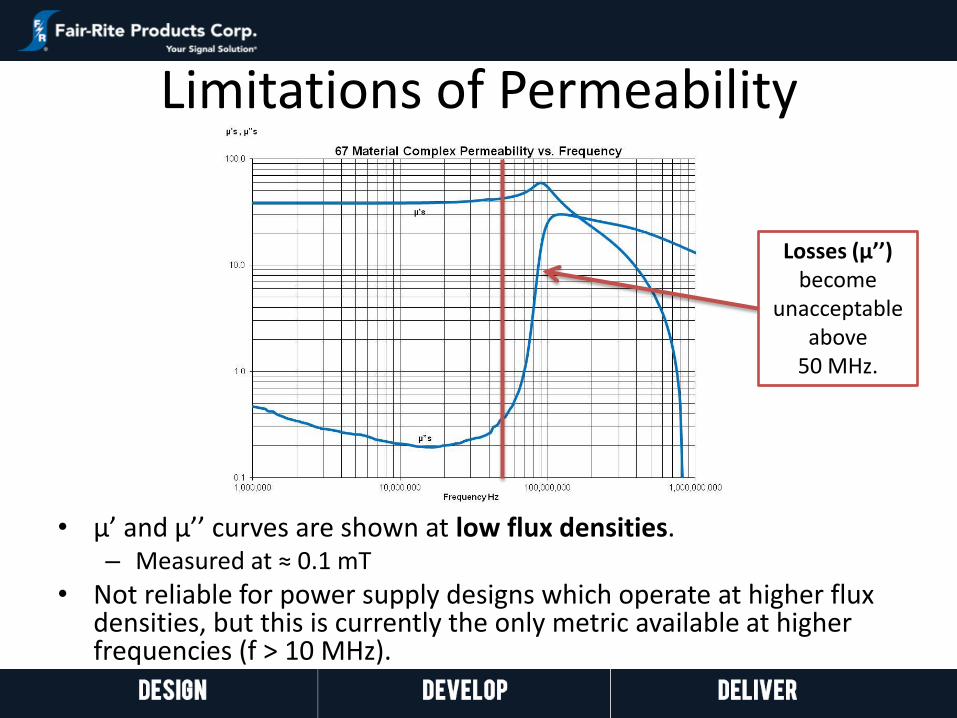
Limitations of Permeability
• µ’ and µ’’ curves are shown at low flux densities. – Measured at ≈ 0.1 mT
• Not reliable for power supply designs which operate at higher flux densities, but this is currently the only metric available at higher frequencies (f > 10 MHz).
Losses (µ’’) become
unacceptable above
50 MHz.

Current Testing Methods • Until recently, methods of testing power
materials at higher frequencies have been expensive and/or unreliable. – Clark Hess has been the industry standard test
method for materials up to 1MHz. – Current systems rely on phase angle, which at higher
frequencies is difficult to measure accurately. • “As the phase angle θ becomes close to 90°, the
measurement accuracy of the core loss Pc becomes worse.” – Iwatsu Electric Co.
• Only measures up to 10MHz.
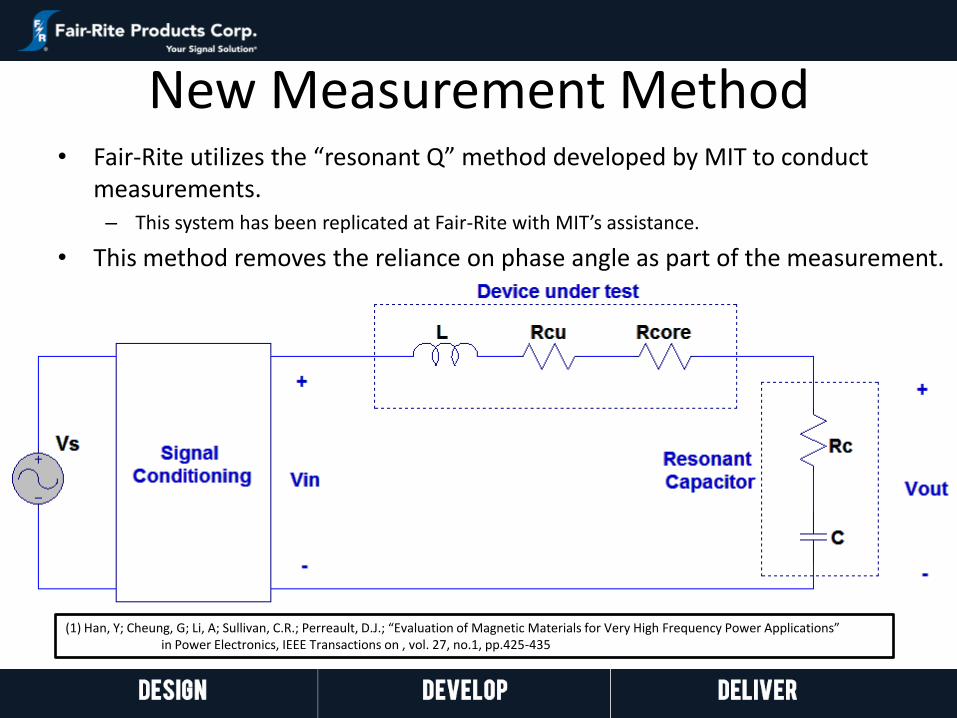
New Measurement Method • Fair-Rite utilizes the “resonant Q” method developed by MIT to conduct
measurements. – This system has been replicated at Fair-Rite with MIT’s assistance.
• This method removes the reliance on phase angle as part of the measurement.
(1) Han, Y; Cheung, G; Li, A; Sullivan, C.R.; Perreault, D.J.; “Evaluation of Magnetic Materials for Very High Frequency Power Applications” in Power Electronics, IEEE Transactions on , vol. 27, no.1, pp.425-435
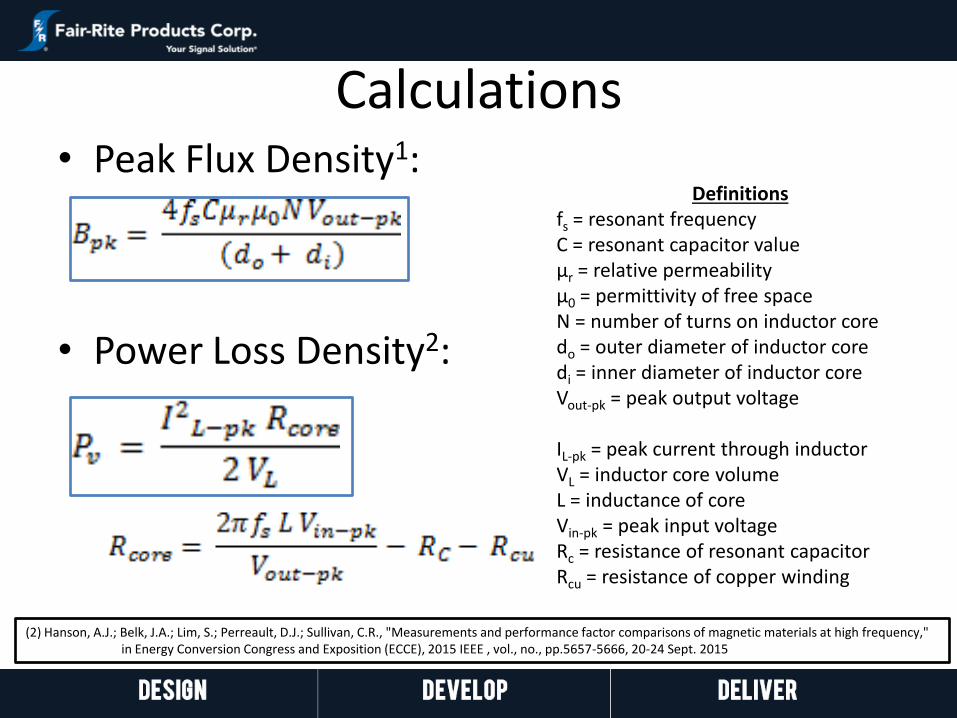
Calculations • Peak Flux Density1:
• Power Loss Density2:
Definitions fs = resonant frequency C = resonant capacitor value µr = relative permeability µ0 = permittivity of free space N = number of turns on inductor core do = outer diameter of inductor core di = inner diameter of inductor core Vout-pk = peak output voltage IL-pk = peak current through inductor VL = inductor core volume L = inductance of core Vin-pk = peak input voltage Rc = resistance of resonant capacitor Rcu = resistance of copper winding
(2) Hanson, A.J.; Belk, J.A.; Lim, S.; Perreault, D.J.; Sullivan, C.R., "Measurements and performance factor comparisons of magnetic materials at high frequency," in Energy Conversion Congress and Exposition (ECCE), 2015 IEEE , vol., no., pp.5657-5666, 20-24 Sept. 2015
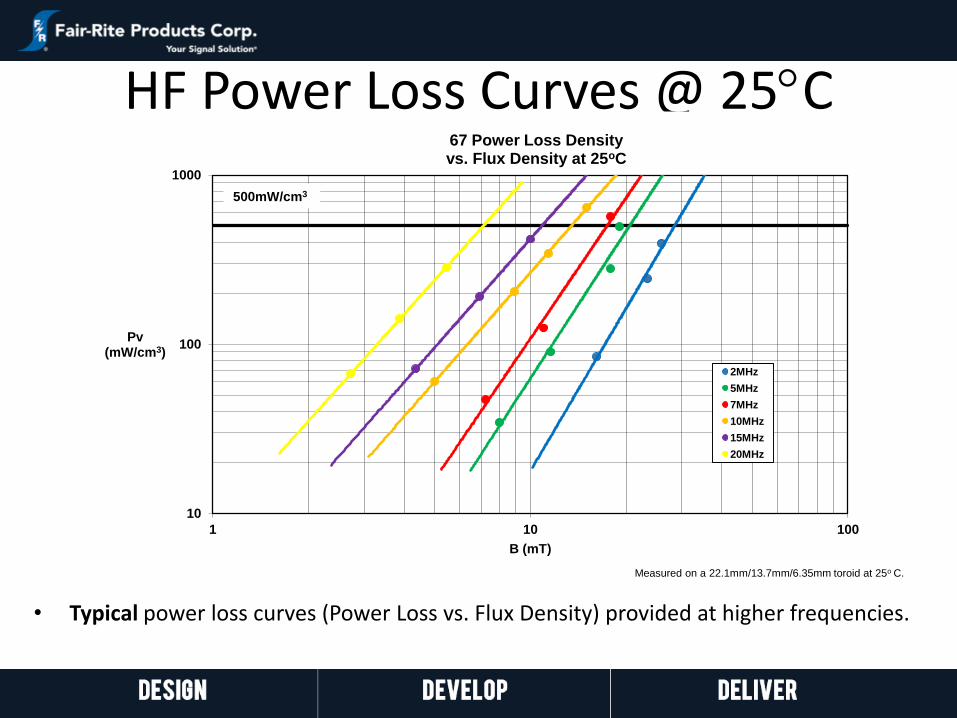
HF Power Loss Curves @ 25C
• Typical power loss curves (Power Loss vs. Flux Density) provided at higher frequencies.
10
100
1000
1 10 100
Pv (mW/cm3)
B (mT)
67 Power Loss Density vs. Flux Density at 25oC
2MHz
5MHz
7MHz
10MHz
15MHz
20MHz
Measured on a 22.1mm/13.7mm/6.35mm toroid at 25o C.
500mW/cm3
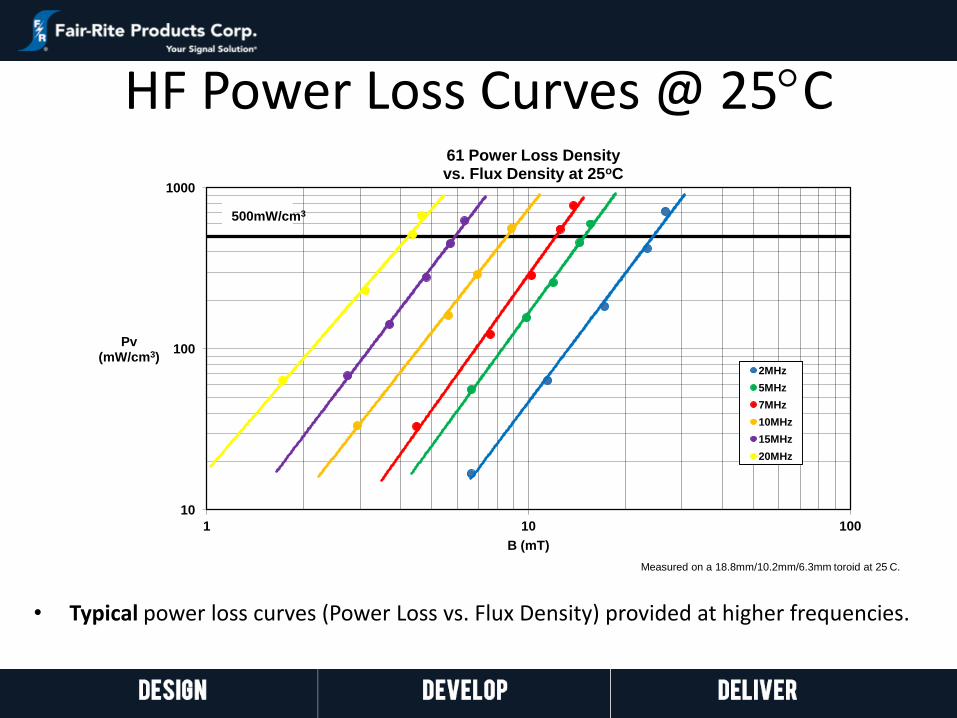
HF Power Loss Curves @ 25C
• Typical power loss curves (Power Loss vs. Flux Density) provided at higher frequencies.
10
100
1000
1 10 100
Pv (mW/cm3)
B (mT)
61 Power Loss Density vs. Flux Density at 25oC
2MHz
5MHz
7MHz
10MHz
15MHz
20MHz
Measured on a 18.8mm/10.2mm/6.3mm toroid at 25 C.
500mW/cm3
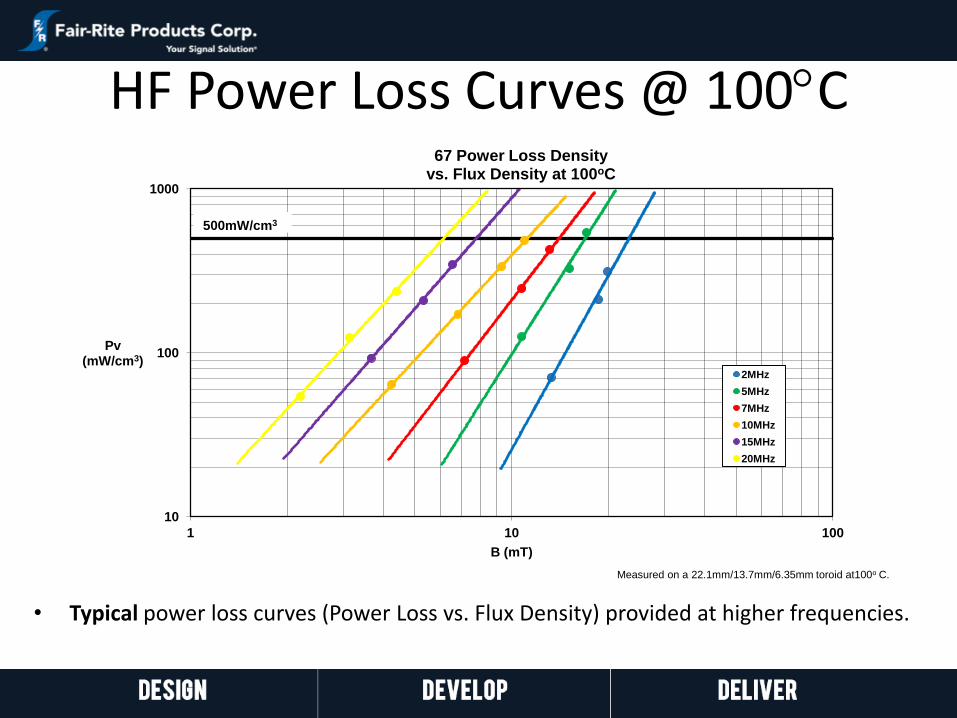
HF Power Loss Curves @ 100C
10
100
1000
1 10 100
Pv (mW/cm3)
B (mT)
67 Power Loss Density vs. Flux Density at 100oC
2MHz
5MHz
7MHz
10MHz
15MHz
20MHz
Measured on a 22.1mm/13.7mm/6.35mm toroid at100o C.
500mW/cm3
• Typical power loss curves (Power Loss vs. Flux Density) provided at higher frequencies.
What is “Performance Factor”?
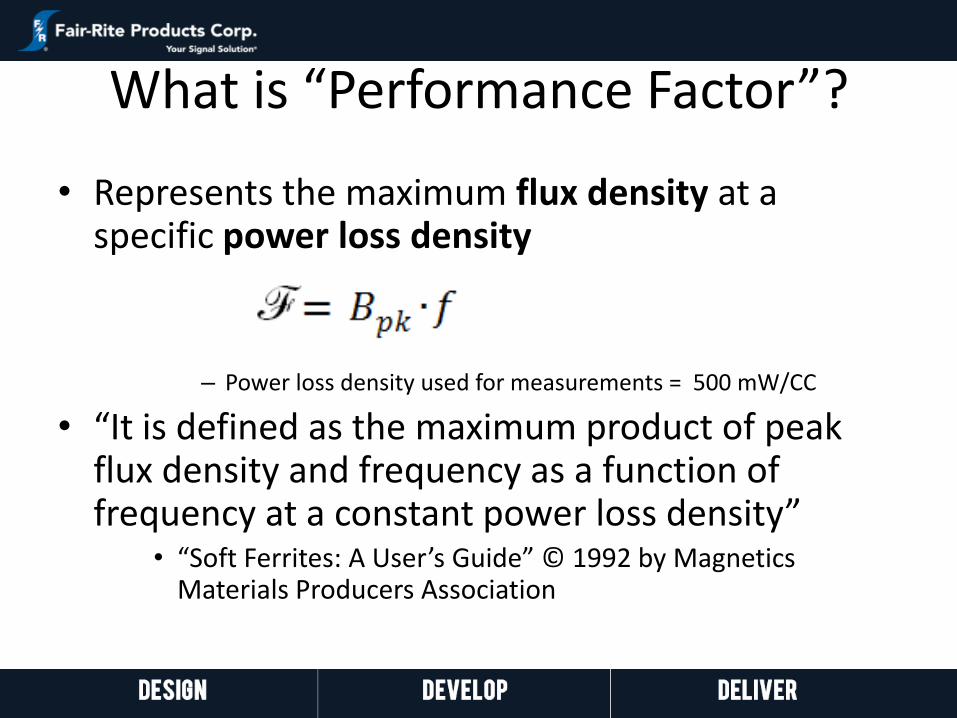
• Represents the maximum flux density at a specific power loss density
– Power loss density used for measurements = 500 mW/CC
• “It is defined as the maximum product of peak flux density and frequency as a function of frequency at a constant power loss density”
• “Soft Ferrites: A User’s Guide” © 1992 by Magnetics Materials Producers Association
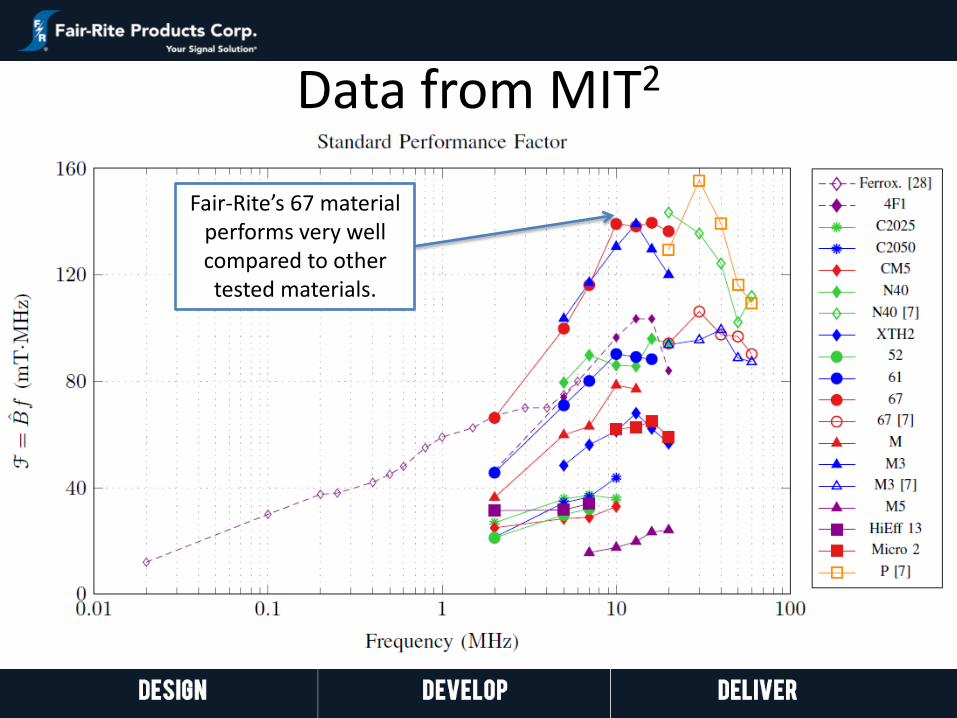
Data from MIT2
Fair-Rite’s 67 material performs very well compared to other tested materials.
Operating temperature comparison
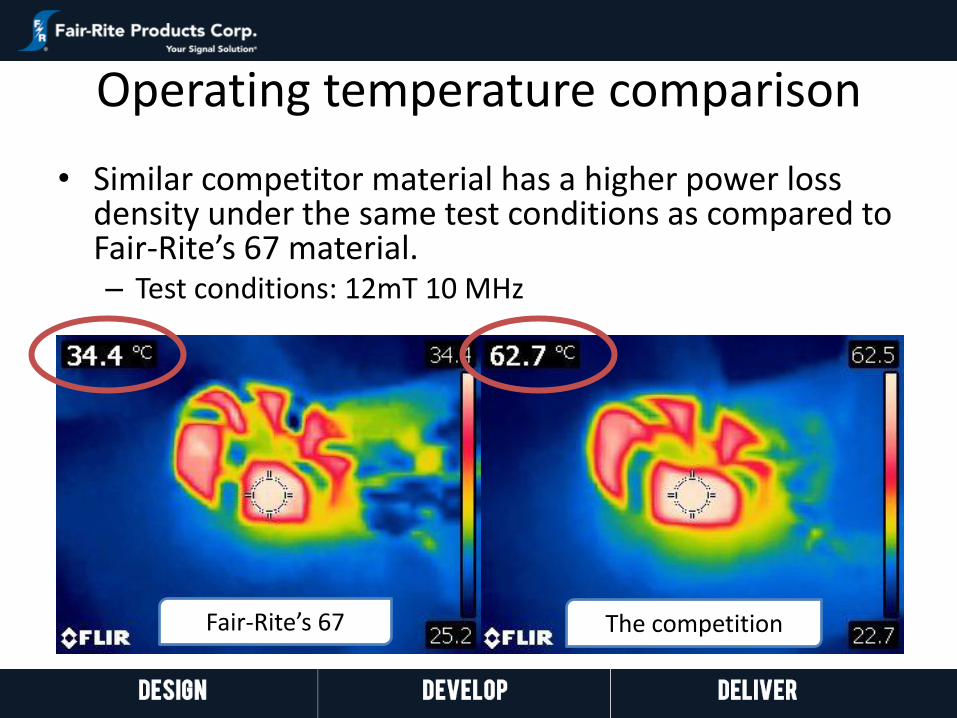
• Similar competitor material has a higher power loss density under the same test conditions as compared to Fair-Rite’s 67 material. – Test conditions: 12mT 10 MHz
The competition Fair-Rite’s 67
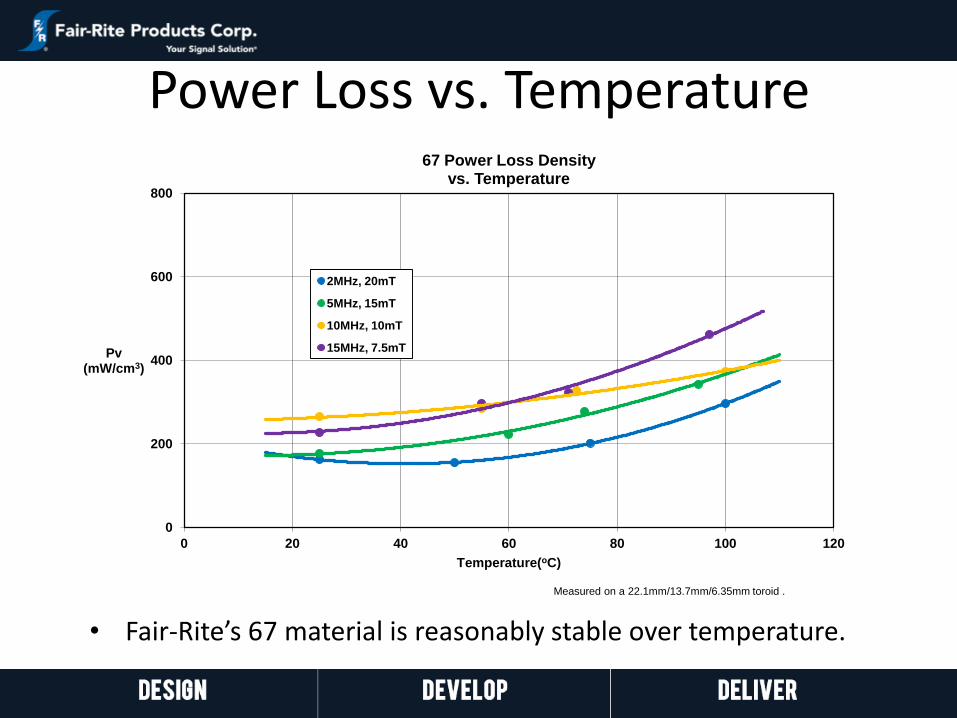
Power Loss vs. Temperature
• Fair-Rite’s 67 material is reasonably stable over temperature.
0
200
400
600
800
0 20 40 60 80 100 120
Pv (mW/cm3)
Temperature(oC)
67 Power Loss Density vs. Temperature
2MHz, 20mT
5MHz, 15mT
10MHz, 10mT
15MHz, 7.5mT
Measured on a 22.1mm/13.7mm/6.35mm toroid .
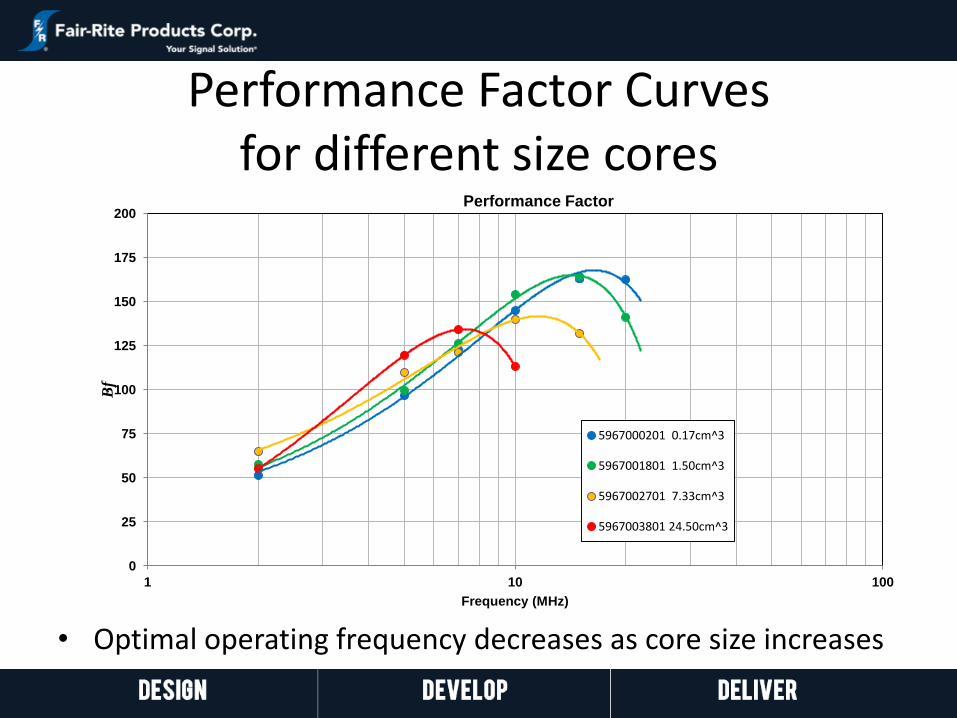
Performance Factor Curves for different size cores
• Optimal operating frequency decreases as core size increases
0
25
50
75
100
125
150
175
200
1 10 100
Bf
Frequency (MHz)
Performance Factor
5967000201 0.17cm^3
5967001801 1.50cm^3
5967002701 7.33cm^3
5967003801 24.50cm^3
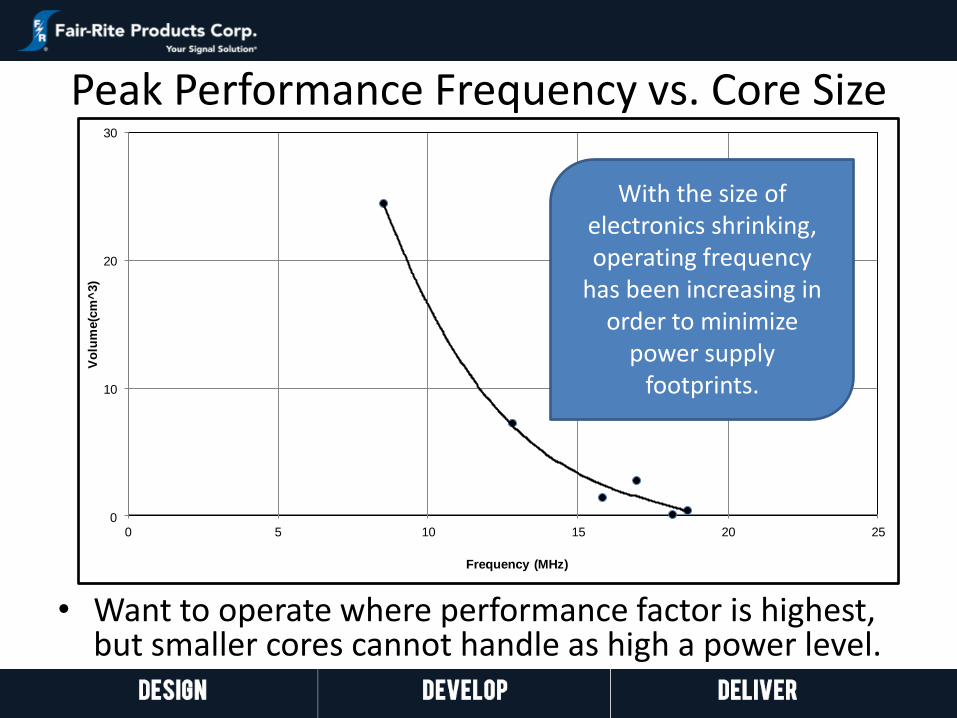
Peak Performance Frequency vs. Core Size
• Want to operate where performance factor is highest, but smaller cores cannot handle as high a power level.
R² = 0.9932
0
10
20
30
0 5 10 15 20 25
Vo
lum
e(c
m^
3)
Frequency (MHz)
With the size of electronics shrinking, operating frequency
has been increasing in order to minimize
power supply footprints.

Design Considerations
• 67 material is a perminvar material, meaning that strong magnetic fields or excessive mechanical stresses may result in irreversible changes in permeability and losses.
• Benefits of a permivar material are:
– Flatter temperature response
– Higher Curie temperature
– Lower losses out to higher frequencies.

Affect on Permeability
1
10
100
1,000,000 10,000,000 100,000,000 1,000,000,000
ms'ms''
Frequency Hz
5967001101 after varying levels of B at 10MHz
Initial
After B 22 mT
After B 25 mT
ms'
ms''
Losses at low flux densities increases after exposure to B = 25mT @ 10MHZ.
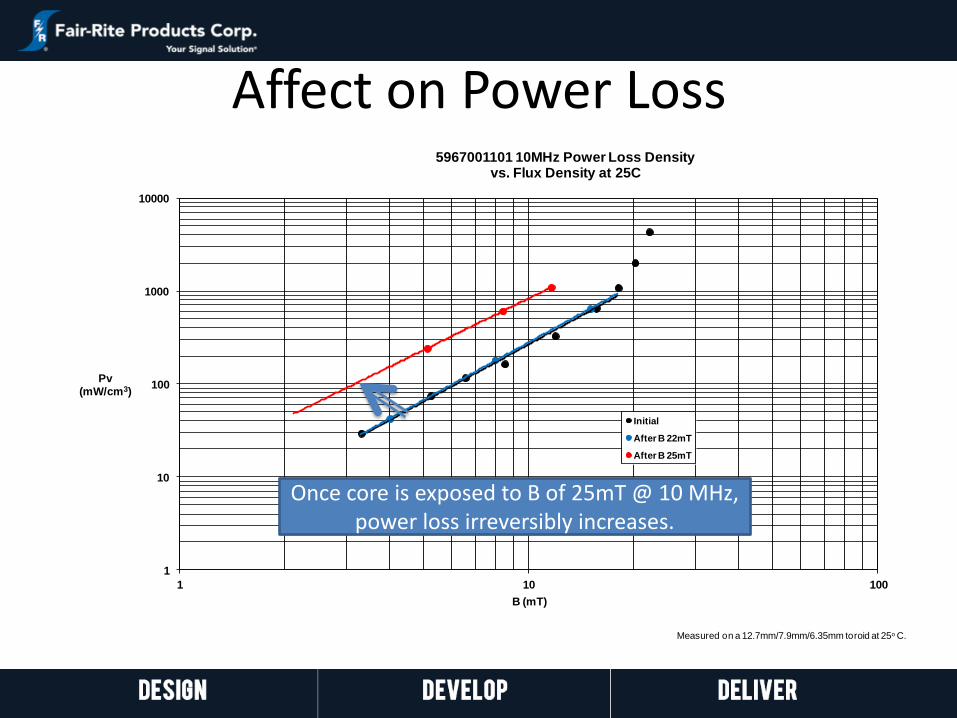
Affect on Power Loss
1
10
100
1000
10000
1 10 100
Pv(mW/cm3)
B (mT)
5967001101 10MHz Power Loss Densityvs. Flux Density at 25C
Initial
After B 22mT
After B 25mT
Measured on a 12.7mm/7.9mm/6.35mm toroid at 25o C.
Once core is exposed to B of 25mT @ 10 MHz, power loss irreversibly increases.
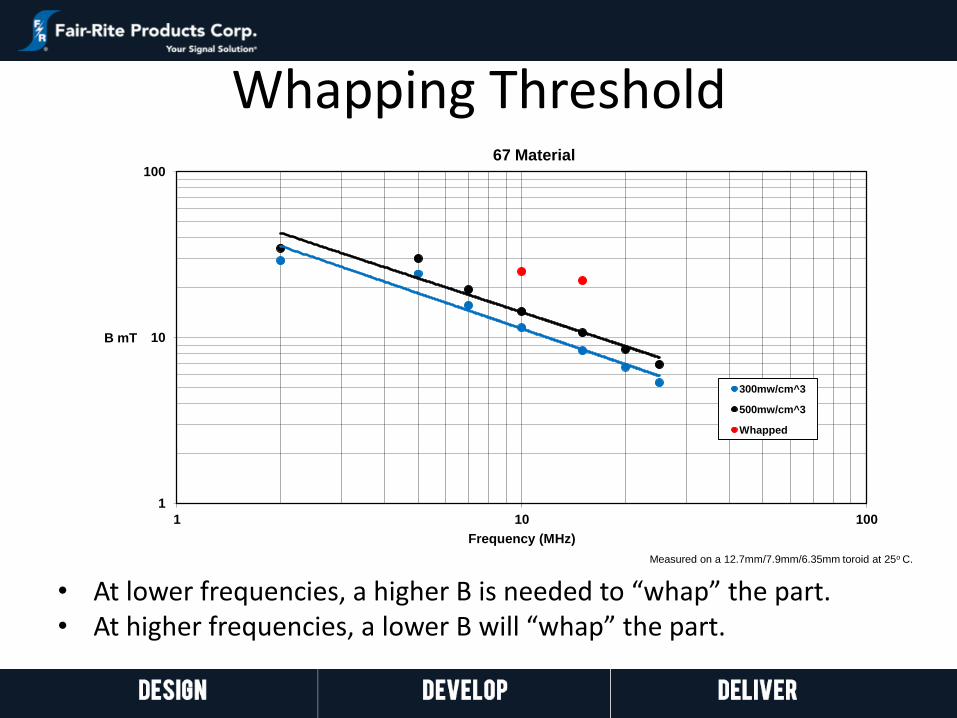
Whapping Threshold
• At lower frequencies, a higher B is needed to “whap” the part. • At higher frequencies, a lower B will “whap” the part.
1
10
100
1 10 100
B mT
Frequency (MHz)
67 Material
300mw/cm^3
500mw/cm^3
Whapped
Measured on a 12.7mm/7.9mm/6.35mm toroid at 25o C.
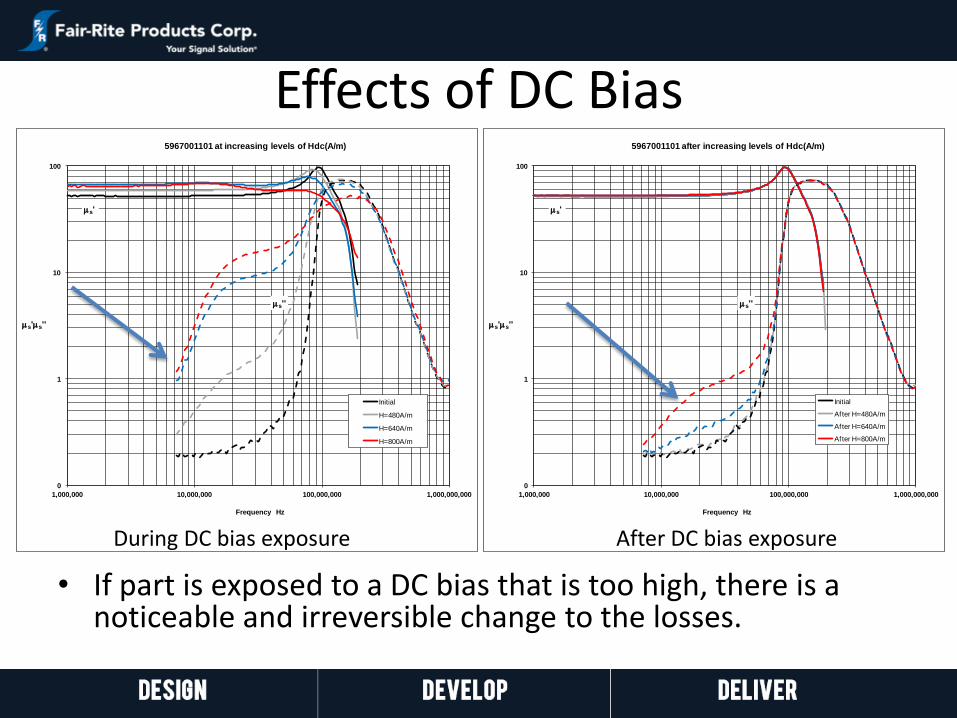
Effects of DC Bias
• If part is exposed to a DC bias that is too high, there is a noticeable and irreversible change to the losses.
0
1
10
100
1,000,000 10,000,000 100,000,000 1,000,000,000
ms'ms''
Frequency Hz
5967001101 after increasing levels of Hdc(A/m)
Initial
After H=480A/m
After H=640A/m
After H=800A/m
ms'
ms''
0
1
10
100
1,000,000 10,000,000 100,000,000 1,000,000,000
ms'ms''
Frequency Hz
5967001101 at increasing levels of Hdc(A/m)
Initial
H=480A/m
H=640A/m
H=800A/m
ms'
ms''
During DC bias exposure After DC bias exposure
Thank you!
• Visit us at booth #1842. • Stay current on our latest developments at Fair-Rite.com


![Loss and material culture in South London DANIEL MILLER ... · 1 Loss and material culture in South London DANIEL MILLER & FIONA PARROTT University College London]abs[This article](https://static.fdocuments.in/doc/165x107/5b3be7307f8b9a0e628d3e1c/loss-and-material-culture-in-south-london-daniel-miller-1-loss-and-material.jpg)