Low Emission Feed - WUR
168
Low Emission Feed Using feed additives to decrease methane production in dairy cows Geronda Klop
Transcript of Low Emission Feed - WUR

Low Emission Feed
Using feed additives to decrease methane production in dairy cows
Geronda Klop
Thesis committee Promotor Prof. Dr W.H. Hendriks Professor of Animal Nutrition Wageningen University Co-promotors Dr J. Dijkstra Associate professor, Animal Nutrition Group Wageningen University Dr A. Bannink Senior researcher, Wageningen UR Livestock Research Other members Prof. Dr I. J. M. de Boer, Wageningen University Dr H. B. Perdok Dr P. Lund, Aarhus University, Tjele, Denmark Dr D. R. Yáñez-Ruiz, Spanish National Research Council, Madrid, Spain This research was conducted under the auspices of the Graduate School of Wageningen Institute of Animal Science (WIAS).

Low Emission Feed
Using feed additives to decrease methane production in dairy cows
Geronda Klop
Thesis
submitted in fulfilment of the requirements for the degree of doctor
at Wageningen University
by the authority of the Rector Magnificus
Prof. Dr A.P.J. Mol,
in the presence of the
Thesis Committee appointed by the Academic Board
to be defended in public
on Wednesday 5 October 2016
at 1.30 p.m. in the Aula.

Geronda Klop Low Emission Feed - Using feed additives to decrease methane production in dairy cows 168 pages. PhD thesis, Wageningen University, Wageningen, NL (2016) With references, with summary in English ISBN 978-94-6257-894-4 DOI 10.18174/387944
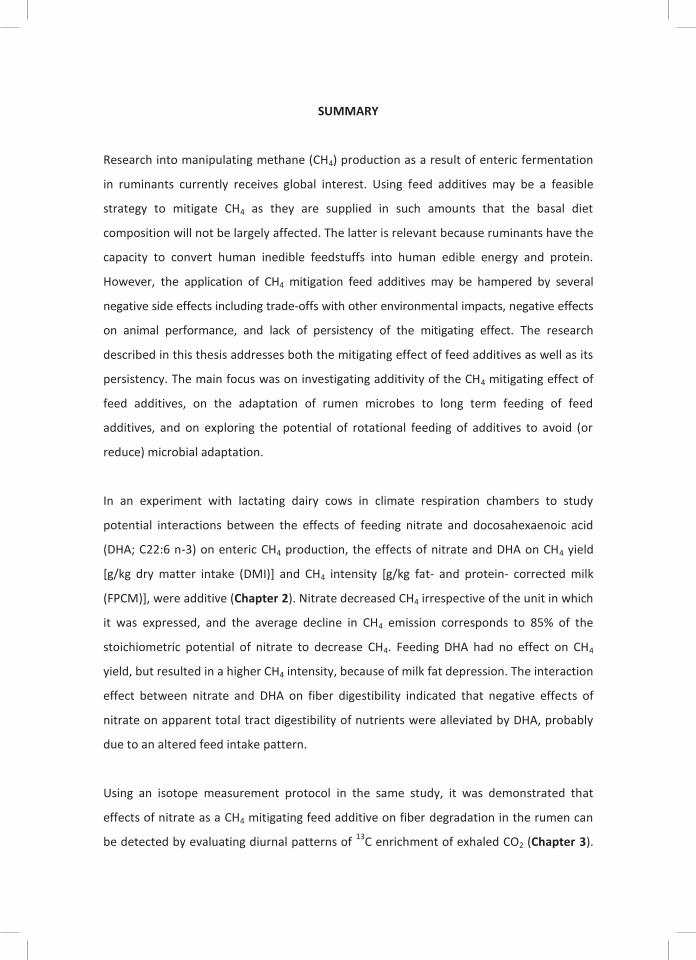
SUMMARY
Research into manipulating methane (CH4) production as a result of enteric fermentation
in ruminants currently receives global interest. Using feed additives may be a feasible
strategy to mitigate CH4 as they are supplied in such amounts that the basal diet
composition will not be largely affected. The latter is relevant because ruminants have the
capacity to convert human inedible feedstuffs into human edible energy and protein.
However, the application of CH4 mitigation feed additives may be hampered by several
negative side effects including trade-offs with other environmental impacts, negative effects
on animal performance, and lack of persistency of the mitigating effect. The research
described in this thesis addresses both the mitigating effect of feed additives as well as its
persistency. The main focus was on investigating additivity of the CH4 mitigating effect of
feed additives, on the adaptation of rumen microbes to long term feeding of feed
additives, and on exploring the potential of rotational feeding of additives to avoid (or
reduce) microbial adaptation.
In an experiment with lactating dairy cows in climate respiration chambers to study
potential interactions between the effects of feeding nitrate and docosahexaenoic acid
(DHA; C22:6 n-3) on enteric CH4 production, the effects of nitrate and DHA on CH4 yield
[g/kg dry matter intake (DMI)] and CH4 intensity [g/kg fat- and protein- corrected milk
(FPCM)], were additive (Chapter 2). Nitrate decreased CH4 irrespective of the unit in which
it was expressed, and the average decline in CH4 emission corresponds to 85% of the
stoichiometric potential of nitrate to decrease CH4. Feeding DHA had no effect on CH4
yield, but resulted in a higher CH4 intensity, because of milk fat depression. The interaction
effect between nitrate and DHA on fiber digestibility indicated that negative effects of
nitrate on apparent total tract digestibility of nutrients were alleviated by DHA, probably
due to an altered feed intake pattern.
Using an isotope measurement protocol in the same study, it was demonstrated that
effects of nitrate as a CH4 mitigating feed additive on fiber degradation in the rumen can
be detected by evaluating diurnal patterns of 13C enrichment of exhaled CO2 (Chapter 3).

Feeding nitrate, but not DHA, resulted in a pronounced increase in 13C enrichment of CO2
in the first 3 to 4 h after feeding only. Results support the hypothesis that effects of a feed
additive on the rate of fiber degradation in the rumen can be detected by evaluating
diurnal patterns of 13C enrichment of CO2. A prerequisite for this detection method is that
the main ration components differ in natural 13C enrichment (e.g., C3 and C4 plants), and
in content of the nutrients that are expected to be involved in a shift in fermentation (e.g.,
starch and fiber) or in degradability of a nutrient.
In a combined in vivo and in vitro trial, the adaptation to CH4 mitigating feed additives, viz.
an essential oil blend or lauric acid (C12:0), compared with a control diet was first
investigated using the in vitro gas production technique during the period that lactating
cows were adapting to certain feed additives (Chapter 4). Rumen fluid was collected from
each cow at several days relative to the introduction of the additives in the diets and used
as inoculum for the gas production experiment with each of the three different substrates
that reflected the treatment diets offered to the cows. The feed additives in the donor
cow diet had a stronger effect on in vitro gas and CH4 production than the same additives
in the incubation substrate. From day 4 onwards, the C12:0 diet persistently reduced gas
and CH4 production, total volatile fatty acid concentration, acetate molar proportion and
in vitro organic matter degradation, and increased propionate molar proportion. In
contrast, in vitro CH4 production was reduced by the essential oils diet on day 8, but not
on days 15 and 22. In line with these findings, the molar proportion of propionate in
fermentation fluid was higher, and that of acetate smaller, for the essential oils diet than
for the control diet on day 8, but not on days 15 and 22. Overall, the data indicate a
transient effect of the essential oils on CH4 production, which may indicate microbial
adaptation, whereas the CH4 mitigating effect of C12:0 persisted. It is recommended that
this phenomenon is considered in the planning of future studies on the mitigation
potential of feed additives in vitro.
In a follow-up in vivo study, it was investigated whether the alternate feeding of two CH4
mitigating feed additives with a different mode of action (viz. C12:0 and a blend of
essential oils) would result in a persistently lower CH4 production compared to feeding a

single additive over a period of 10 weeks. The experiment comprised a pre-treatment
period and three two-week measurement periods, with two periods of 2 weeks in
between in which CH4 emission was not measured. Cows received either continuously the
essential oil blend, or both the essential oil blend and C12:0 following a weekly rotation
schedule (Chapter 5). Both CH4 yield and CH4 intensity changed over time, but were not
affected by treatment. Methane yield and intensity were significantly lower (12 and 11%,
respectively) in period 1 compared with the pre-treatment period, but no significant
difference relative to the pre-treatment period was observed in period 3 (numerically 9
and 7% lower, respectively) and in period 5 (numerically 8 and 4% lower, respectively).
These results indicate a transient decrease in CH4 yield and intensity in time, but no
improvement in extent or persistency of CH4 reduction due to rotational feeding of
essential oils and C12:0 in lactating dairy cows. However, there were indications that the
concept of rotation may be effective and warrants further investigation.
The additives and concepts tested in this thesis are applied under specific experimental
conditions. More mechanistic understanding is required to predict the response of the
same additives when supplemented to other basal diets or cows in a different
physiological state. Trade-offs in environmental impact, and effects on cow health and
performance, and on milk processing parameters and food safety are important aspects to
consider in future research on the application of feed additives as CH4 mitigation strategy.

Table of contents
Summary
Chapter 1 General introduction 11
Chapter 2 Feeding nitrate and docosahexaenoic acid affects enteric
methane production and milk fatty acid composition in
lactating dairy cows
31
Chapter 3 Using diurnal patterns of 13C enrichment of CO2 to evaluate
the effects of nitrate and docosahexaenoic acid on fiber
degradation in the rumen of lactating dairy cows
59
Chapter 4 Changes in in vitro gas and methane production from
rumen fluid from dairy cows during adaptation to feed
additives in vivo
71
Chapter 5 Effects of continuous feeding of essential oils or rotational
feeding of essential oils and lauric acid on enteric methane
production in lactating dairy cows
95
Chapter 6 General discussion 123
Chapter 7
Co-authored peer-reviewed publications related to this
thesis
155
Curriculum vitae 158
Overview of scientific publications 159
Training and Supervision Plan 162
Acknowledgements 164


Chapter 1
General introduction

12
GENERAL INTRODUCTION
Methane research
Research into manipulating methane (CH4) production as a result of enteric fermentation
in ruminants currently receives global interest (Hristov et al., 2013b). Approximately 90%
of total enteric CH4 production in ruminants, originates from rumen fermentation of
feedstuffs, which implies that nutrition can have a large impact on total CH4 emissions. For
this reason, the topic of nutritional strategies to reduce CH4 emissions from ruminants has
been the subject of several qualitative and quantitative reviews (see Hristov et al., 2013b,c
for a recent overview in which more than 900 studies on the mitigation of direct nitrous
oxide (N2O) and CH4 emissions were reviewed).
Metabolizable energy (ME) and Net energy (NE) systems are widely used in feed
evaluation for cattle. The ME is the heat of combustion (gross energy; GE) of feed, minus
the energy in faeces, urine and gases. To accurately determine ME, losses of energy in CH4
have to be measured. Methane represents, on average, a loss of 6.5% of GE, but with a
wide range (2-12% of GE; Johnson and Johnson 1995). Initially, research into manipulating
CH4 production was related to the loss of GE represented by CH4. However, more recently
the research focus shifted from enteric CH4 as an inefficiency in animal production,
towards the contribution of CH4 to global greenhouse gas emissions (see Hristov et al.,
2013b,c).
Metrics to express enteric methane production in ruminants
The effect of a mitigation strategy may vary across different units in which enteric CH4
production can be expressed. As discussed by Hristov et al. (2013b), metrics used to
quantify emissions should be standardized. The commonly used CH4 yield factor that
expresses CH4 production as a percentage of GE intake (GEI) does for example not
adequately describe the impact of changes in nutrient composition of the diet. Ellis et al.
(2010) explained that using a GEI based calculation cannot distinguish between an
increased dry matter intake (DMI) or increased dietary fat content. Both scenarios may
result in the same GEI value, but the effect on CH4 production may differ.

13
As most of the CH4 production originates from rumen fermentation, less fermentation will
consequently lower the total CH4 production per day. Less fermentation of feed in the
rumen may lower the amount of available nutrients to the animal, and consequently
animal productivity. Thus, if a mitigation strategy negatively affects animal performance
then CH4 production rate in g/d may decrease whilst CH4 production in g/kg DMI and g/kg
fat- and protein-corrected milk (FPCM) may actually increase. In the context of global food
supply and efficient use of resources, it is important to consider the latter two units, which
are often referred to with the terms CH4 yield and intensity, respectively. The focus in this
thesis will also be on lowering CH4 production per kg DMI and per kg FPCM produced.
Function of methanogenesis in ruminants
Before proposing any CH4 mitigation strategy, it is important to understand the function of
methanogenesis in ruminant animals. For digestion of the fibrous feedstuffs that are
typical for ruminant diets, the animals largely depend on the rumen microbial ecosystem.
Microbial fermentation in the rumen yields volatile fatty acids (VFA) and microbial protein,
which are quantitatively important sources of energy and protein for the animal.
Figure 1.1. Simplified representation of causal factors to decrease methane production in the rumen.

14
During microbial fermentation of feedstuffs, also hydrogen (H2) is produced. Methanogens
(Archaea) are a specific group of rumen microbes that use carbon sources like carbon
dioxide (CO2), formate and methyl groups together with H2 to form CH4. By doing so, a low
redox potential is maintained in the rumen. The latter is important to maintain proper
rumen fermentation, because an increased H2 pressure in the rumen would inhibit re-
oxidation of reduced enzymatic co-factors (NADH, NADPH and FADH). As a consequence,
the rate of rumen fermentation would cease as well (McAllister and Newbold, 2008).
Given the crucial role of methanogenesis in supporting adequate conditions for rumen
fermentation, any strategy that inhibits the production of CH4 should provide an
alternative H2 removal pathway (McAllister and Newbold, 2008; Van Zijderveld et al., 2010)
or lead to less H2 being produced.
Mechanisms to decrease ruminal methane production
As most of the CH4 is produced following fermentation of feed in the rumen, nutrition is
the factor with the largest impact on CH4 production. Several options for lowering the
production of CH4 in the rumen are presented in Figure 1.1. The first option is to increase
the proportion of nutrients in the diet that bypass rumen fermentation. An example of
this strategy is supplementation of fat (Grainger and Beauchemin, 2011) or increasing the
amount of bypass starch or protein. Both fat and bypass starch or protein remain
unfermented in the rumen but are enzymatically digested in the small intestine. By
feeding more bypass starch and protein, less use is made however of the unique capacity
of ruminants to convert human inedible biomass into human edible energy and protein.
An option not indicated in Figure 1.1 is the increase of the formation of microbial mass per
unit of organic matter fermented, as this will lower VFA and CH4 production. Volatile fatty
acids are the most important end products of rumen fermentation, as these provide
approximately two-third of the required energy for maintenance, production and/or
growth. Acetate, propionate and butyrate are quantitatively the most important VFA
formed in the rumen. A shift in the profile of VFA formed towards more propionate is the
second option indicated in Figure 1.1, as production of acetate and butyrate releases H2 in
the rumen environment, whereas propiogenesis is a H2 consuming process. Rumen
15
degradable starch is mainly a propionate precursor, thus increasing the amount of rumen
degradable starch could in theory lower CH4 production. However, both Hassanat et al.
(2013) and Van Gastelen et al. (2015) suggested that based on their experimental
observations, a minimum starch level is required to achieve a reduction in CH4 production.
Effects of dietary starch on CH4 emissions in dairy cows were extensively investigated in
the PhD work of Hatew (2015) who also concluded that starch contents were too low to
obtain a reduced methane yield.
Another way to stimulate propionate formation connects to option number 3 indicated in
Figure 1.1, which is lowering the amount of H2 available for methanogenesis. This can be
achieved by directing fermentation processes towards alternative H2 consuming pathways
other than by altering dietary fermentable substrates, such as by propiogenesis, reduction
of carboxylic acids, nitrate- or sulfate reduction, and biohydrogenation of fatty acids.
However, the quantitative importance of these pathways is variable (Ellis et al., 2008;
Martin et al., 2010).
The fourth option indicated in Figure 1.1 is the inhibition of methanogens, not indirectly
by lowering substrate availability, but directly upon feeding compounds that are inhibitory
to methanogens. Recently, the compound 3-nitrooxypropanol (3NOP) received a lot of
attention as a newly developed mitigation strategy. The compound was specifically
designed to inhibit methyl coenzyme-M reductase, which is the enzyme that catalyzes the
last step of methanogenesis in the rumen. As reviewed by Latham et al. (2016), several in
vivo experiments have been conducted to evaluate the effect of 3NOP on CH4 production
in dairy and beef cattle. There seems to be a strong and repeatable mitigating effect,
although the size of this effect varies across studies. As this additive was not yet available
for research at the start of this PhD project, it could not be considered as mitigation
strategy to study in the experiments described here.
Why feed additives?
Feed additives may be a viable mitigation strategy as they are usually only supplied in
small amounts to the animal. In this way, the basal diet composition will not be largely

16
affected. The latter is relevant, because ruminants have the capacity to convert human
inedible feedstuffs into human edible energy and protein. According to Regulation (EC) No
1831/2003 on additives for use in animal nutrition, feed additives can be defined as
substances, micro-organisms or preparations, other than feed material and premixtures,
which are intentionally added to feed or water in order to perform, in particular, one or
more of the following functions:
1. favourably affect the characteristics of feed,
2. favourably affect the characteristics of animal products,
3. favourably affect the colour of ornamental fish and birds,
4. satisfy the nutritional needs of animals,
5. favourably affect the environmental consequences of animal production,
6. favourably affect animal production, performance or welfare, particularly
by affecting the gastro-intestinal flora or digestibility of feedingstuffs, or
7. have a coccidiostatic or histomonostatic effect.
In the context of this thesis, the fifth characteristic is the target function of the feed
additives, but obviously a mitigating feed additive should not negatively affect the
characteristics listed under 1, 2, 4, and 6.
Feed additives with potential to decrease methane production
The focus in this thesis will be on three categories of feed additives with potential to
decrease CH4 production:
1. Alternative electron sinks
2. Fat/fatty acids
3. Essential oils
Alternative electron sinks
Chemical reactions, whether carried out by microbes or not, are in general subject to
kinetic, or thermodynamic regulation. Kinetic regulation is based on the presence and
concentration of the required substrate, whereas thermodynamic regulation can be
described as the formation of reaction (end) products based on the ratio between
substrate and end product. Kinetic advantage of an alternative H2 consuming pathway to

17
methanogenesis in the rumen depends on the H2 affinity constant (Km), which should be
low (Ellis et al., 2008). Thermodynamic regulation of chemical reactions in the rumen is
based on the question whether it is energetically favourable for the reaction to occur. This
can be quantified as the change in Gibbs free energy (∆G). The change in energy under
standardized conditions is expressed as ∆G°. A negative ∆G° value indicates that a reaction
may occur spontaneously.
Theoretically, the pathway in which carboxylic acids like malate and fumarate are reduced
by rumen microbes as precursors of propionate is energetically more favourable (ΔG0 = -
63.6 KJ/mole H2) than methanogenesis (Ungerfeld et al., 2007; Ellis et al., 2008)1. Although
the reduction of carboxylic acids is energetically more favourable, the Km related to these
reduction pathways is much higher compared to the Km of methanogens (Asanuma et al.,
1999; Ungerfeld and Kohn, 2006). Moreover, it was demonstrated by Van Zijderveld et al.
(2011b) that dietary supplementation of calcium fumarate in concentrations that could be
fed in practice did not reduce enteric CH4 production. It was discussed by the authors that
calcium fumarate is not completely converted to propionate but also to acetate, with the
latter conversion being a H2 producing pathway that makes the reduction of fumarate less
H2 consuming. Given the costs and poor palatability of calcium fumarate, it was concluded
that the dietary concentrations of fumarate that would be required to achieve a significant
CH4 reduction are too high for practical use. It was also discussed by Van Zijderveld et al.
(2011b) that only a few studies had observed a lower CH4 production upon feeding
fumarate (Bayaru et al., 2001; Wallace et al, 2006), but that their results actually were in
line with several other studies in which also no effect of fumarate on CH4 production was
found (Beauchemin and McGinn, 2006; Kolver and Aspin, 2006; Molano et al., 2008).
Other pathways with potential of outcompeting methanogenesis are the reduction
pathways of sulfate and nitrate. Sulfate-reducing microbes in the rumen have a lower Km
and H2-threshold compared to methanogens and the sulfate reduction pathway is also
1 Note: The standardized conditions used to calculate ∆G° differ from the rumen environment, and caution should be taken in drawing firm conclusions related to reaction processes in the rumen based on ∆G°.

18
energetically slightly more favorable (ΔG0 = -21.1 KJ/ mole H2) (Ungerfeld and Kohn, 2006;
Ellis et al., 2008). However, the limiting factor in this pathway is the Sulfur (S)
concentration of the ration that would be required to substantially reduce CH4. A potential
risk of high S intake is S-associated polioencephalomalacia. This neurological condition is
caused by excessive production and absorption of ruminal hydrogen sulphide (H2S), which
is the final product of sulfate reduction. Production and absorption of ruminal H2S are
influenced by S source, total S intake and state of S-reducing ruminal microbes (Dewhurst
et al., 2007). Excess H2S in the rumen head space is released by eructation and subsequent
inhalation and systemic absorption can occur (Gould, 1998). The necessary dietary
amount of sulfate, required to substantially reduce CH4 production (Van Zijderveld et al.,
2010), exceeds the safety limits set for ruminant diets (NRC, 2001), and, therefore, sulfate
is not suitable as a sole H2 sink.
The use of nitrate as alternative H2 acceptor was proven to effectively reduce CH4
production in vivo in sheep (Van Zijderveld et al., 2010), and a persistent effect was also
shown in vivo in lactating dairy cows (Van Zijderveld et al., 2011c). However, its use as a
mitigating additive may also result in undesirable side effects, which will be discussed later.
Fat and fatty acids
A mitigating effect of fat on CH4 production has been observed in a large number of
studies, but the duration of this effect is not consistent across studies (Grainger and
Beauchemin, 2011). Dietary fat is thought to have an influence on CH4 production by
several mechanisms (Martin et al., 2010). Indirect effects of dietary fat on CH4 production
may be found as a result of a reduction in DMI or a dilution of the fermentable organic
matter, as fat is not fermented in the rumen but after outflow from the rumen highly
digestible in the intestine. Moreover, specific fatty acids may have a direct negative effect
on methanogens (medium chain fatty acids) or on cellulolytic bacteria and protozoa
(polyunsaturated fatty acids). Utilization of H2 with biohydrogenation of unsaturated fatty
acids reduces the amount of H2 available for methanogens, but this is quantitatively of
minor importance. The meta-analysis of Patra (2013) showed that fat supplementation

19
also resulted in a linear increase in propionate as proportion of total VFA. As propionate
acts as a H2 sink, this contributes to the mitigating effect of fat supplementation.
A meta-analysis, in which data from in vivo studies in the practical range of dietary fat
concentration in ruminant diets (<80 g fat/kg DM) were used to investigate the effects of
dietary fat on CH4 production, showed a strong negative relationship between dietary fat
concentration and production of CH4 (-1 g CH4/kg DMI per 1% increase of fat in feed DM),
but no effect of the fatty acid profile of dietary fat on CH4 production could be established
(Grainger and Beauchemin, 2011). However, the meta-analysis by Patra (2013) showed
that CH4 emissions were not affected by saturated fatty acid concentration in the diet,
whereas concentrations of mono- and polyunsaturated fatty acids significantly decreased
CH4 emissions (g/kg DM). It was noted that lauric acid (C12:0) and linolenic acid (C18:3)
exerted a strong inhibitory effect on CH4 production (g/kg DM) compared with other fatty
acids. The extent of CH4 reduction by C12:0 was affected by the non-fiber carbohydrate
content of the diet. The dataset of Patra (2013) comprised a larger number of
observations than the one of Grainger and Beauchemin (2011), which may explain the
contrasting results of both studies. The magnitude of the CH4 supressing effect of fat
supplementation may vary across species and the mitigation effect is likely to be stronger
in sheep than in cattle (Grainger and Beauchemin, 2011; Patra, 2014).
Essential oils
Essential oils are plant secondary metabolites that are responsible for specific plant
characteristics as flavour and fragrance (Benchaar and Greathead, 2011). The precise
mode of action may vary between different essential oils but, generally speaking, they all
exhibit some antimicrobial activity. In a recent review by Benchaar and Greathead (2011),
it was concluded that some essential oils (derived from garlic and cinnamon) show in vitro
a reduction of CH4 production, but these results have not been confirmed in vivo.
Although no CH4 was measured, Benchaar et al. (2008) observed for example no effect of
cinnamaldehyde (1 g/cow/d; 43mg/kg DMI) on pH, total VFA concentration and molar
proportions of individual VFA in the rumen of lactating dairy cows. In a recent study by
Benchaar (2015), feeding cinnamon oil, cinnamaldehyde, or monensin to dairy cows did

20
not lower CH4 production determined with the SF6 technique. In vitro, promising results
have been obtained using other plant extracts and essential oils with potential to be
added to a concentrate-based diet (Durmic et al. 2014). Hristov et al. (2013a) observed an
in vivo decrease in CH4 production upon feeding oregano leaves to dairy cattle, but
measurements were only taken until 8 h after feeding. Therefore, it is not known if the
effect was of the same size on a 24 h basis. If oregano caused a shift in the moment and
rate of fermentation after feeding and a more equally divided CH4 emissions over a 24 h
period, the overall CH4 production may still have remained rather unaffected.
In summary, mixed results have been reported in the scientific literature and mechanisms
underlying the (absence of) effects of essential oils on CH4 production have not been fully
elucidated. Therefore, these compounds require further study before deciding if they have
potential to be applied in mitigation strategies.
Issues related to the application of additives with potential to mitigate methane
production
General issues
Although all three categories of feed additives, as discussed above, show potential for CH4
mitigation, it is important to consider potential adverse effects and/or trade-offs before
applying them in practice. One of the most evident issues is that a decrease in CH4
production should not be accompanied by a lower DMI, milk production or milk quality. In
this respect it is also important to express CH4 production not only in g/d, but also relative
to DMI and milk production (as discussed earlier in the section on metrics to express CH4
production).
Another issue is that persistency of a mitigating effect of a feed additive often has not
been established in vivo (Hristov et al. 2013b). As noted in the general discussion of the
PhD thesis of Van Zijderveld (2011), there is a possibility that the effect of feed additives
on CH4 production is amplified in an in vitro test compared to effects obtained with the
same level of feed additive applied in vivo (g additive/kg feed or substrate), because of a

21
higher concentration of additive relative to the microbial density applied in the in vitro
test. Moreover, the microbial population used in in vitro systems may have had
insufficient time to adapt to the feed additives as occurs in the in vivo situation, or lack
adaptive capacity at all, resulting in a larger CH4 reduction in vitro than observed in the in
vivo situation. Recently, Yáñez-Ruiz et al. (2016) published a review on design,
implementation and interpretation of in vitro batch culture experiments to assess enteric
CH4 mitigation in ruminants. Aspects like e.g. donor animal species, use of adapted or non-
adapted rumen fluid, composition of the buffer, and buffer:medium ratio all have such a
strong influence on the results, that these require a well-described protocol. They also
argued that in most cases the research question determines the protocol that is adopted
for an in vitro study. Therefore, there may not be a standard protocol for evaluating CH4
production in ruminants using the in vitro gas production technique. Consequently, effects
found in in vitro experiments, need to be interpreted with care, as they may differ from
the effects observed in vivo.
Besides factors to be considered at the animal level, also factors along the animal
production chain should be taken into account when evaluating feed additive-based
mitigation strategies. For example, if a mitigating feed additive reduces CH4 production at
the expense of increased nitrogen emissions into the environment, ‘pollution swapping’
occurs. As shown by Van Middelaar et al. (2013), conclusions on the potential of a
mitigation strategy depend on the level of analysis (animal, farm or chain level). This can
be explained by trade-offs in environmental pollution between CH4 production and other
emissions along the production chain. Moreover, Van Middelaar et al. (2014) also
determined the cost-effectiveness of three mitigating feeding strategies (viz. feeding
linseed oil, feeding nitrate, or feeding grass at an earlier stage of maturity) using a chain
level approach, and concluded that all these strategies involve additional costs to the
farmer. The economic aspects are important factor adopting mitigation strategies in
practice.

22
Issues related to feeding nitrate
Although nitrate persistently reduces CH4 production, its use as a feed additive also has
some disadvantages. Mixed results have been reported regarding the effect of nitrate on
DMI (Lee et al., 2014; Newbold et al., 2014), but it may lower voluntary intake. Moreover,
nitrite is an intermediate in the process of reduction of nitrate to ammonia. The process of
converting nitrate to nitrite in the rumen occurs rapidly whereas the conversion of nitrite
to ammonia occurs at a slower rate in non-adapted animals (Allison and Reddy, 1984).
Nitrite in the rumen is absorbed through the rumen wall into the bloodstream, where it
may cause oxidation of hemoglobin to methemoglobin, thereby inhibiting oxygen
transport. However, gradual adaptation to increasing levels of dietary nitrate may prevent
the accumulation of nitrite and the occurrence of methemoglobinemia (Van Zijderveld et
al., 2010; Van Zijderveld et al., 2011c). As mentioned in the previous paragraph, nitrate is
currently not cost-effective as a mitigation strategy, and also pollution swapping is a
concern (Van Middelaar et al., 2014). Furthermore, Petersen et al. (2015) found that
increasing dietary nitrate, also increases N2O emission in cows, which is considered to be a
more potent greenhouse gas than CH4.
Issues related to feeding fat and fatty acids
As discussed by Hristov et al. (2013b), expressing the response to dietary fat as CH4 /kg
DMI (Grainger and Beauchemin, 2011) does not account for reduced DMI or milk
production upon fat supplementation. In case of negative DMI and milk production
responses, more (replacement) animals would be required to produce the same amount
of milk which increases emissions, making fat supplementation a less effective mitigation
strategy. Increasing dietary fat concentrations above 5-6% of dietary DM increases the risk
of negative effects on DMI, fiber digestion, milk production and milk composition (NRC,
2001). If fiber degradation is impaired, both DMI and milk fat concentration might
decrease, and such adverse effects upon feeding fat have been reported from quantitative
reviews (Grainger and Beauchemin, 2011; Patra, 2013).
Van Middelaar et al. (2014) investigated the cost-effectiveness of feeding linseed oil as a
mitigation strategy. It was concluded by the latter authors that the method was the least

23
cost-effective for current practice compared to the other strategies that were evaluated
(feeding grass harvested at a lower stage of maturity, or nitrate), and that the uncertainty
range was large.
Issues related to feeding essential oils
The levels of essential oil addition required to effectively reduce CH4 production in vivo are
likely to inhibit overall rumen fermentation as well. Moreover, microbial adaptation to the
presence of essential oils may result in a transient effect on CH4 only (Cardozo et al., 2004).
Another noteworthy aspect is that essential oils may easily be transferred into the animal
product. For example, in the study of Van Zijderveld et al. (2011b) feeding diallyl disulfide
(a component of garlic oil) at a level of 200 mg/kg DM resulted in a distinctive garlic taint
in the milk whereas CH4 production was not affected. Such effects relate to another
important general aspect that needs to be considered before adopting any feed additive-
based mitigation strategy, which is consumer acceptance of animal products.
Search for solutions
Negative effects of feed additives on DMI, milk production and/or milk composition are
frequently reported in scientific literature. Therefore, a positive interaction of two
mitigating additives would be of interest, as it would allow for a similar decrease in CH4
emissions using lower doses of the separate additives. Subsequently, the risk of negative
effects of the additives on cow health and performance will be alleviated too.
Another complication in the search for feed additive-based mitigation strategies is that
the rumen microbial ecosystem may adapt to the use of a certain feed additive. In that
case, only a transient reduction of CH4 emissions can be achieved. This process of
adaptation is an important aspect that requires further study. Cardozo et al. (2004)
reported a transient effect of plant extracts on fermentation characteristics that
disappeared after six days. This result indicates that microbial adaptation can occur after
short term exposure. The alternating use of two or more CH4 reducing feed additives with
a different mode of action may alleviate the problem of microbial adaptation in the rumen.

24
This concept is similar to what is used with agronomical applications, where herbicide
rotations are applied as a strategy to prevent or to delay the resistance of weeds against
herbicides (Beckie, 2006). Similarly, shuttle programmes with two or more anticoccidial
compounds, usually with different modes of action, are widely used to reduce resistance
of protozoan parasites in broilers (Chapman, 2001).
If the concept of rotational feeding of additives would also be effective in CH4 mitigation, a
persistent lower CH4 production could be achieved without the need for a persistent CH4
reduction by a single feed additive. However, several knowledge gaps need to be
addressed before this concept can be tested in vivo. First of all, suitable additives need to
be selected based on available knowledge from the scientific literature and in vitro
screening of their effect. Second, more information is needed on the size and duration of
the mitigating effect of these additives to determine the optimal rotation interval for the
inclusion of these additives in the diet.
Research objectives
Development of feed additive-based mitigation strategies has been subject of many research
efforts, which will likely continue during the next years. To increase our understanding of the
CH4 reducing potential of feed additives, more detailed information regarding the dynamics
and effectiveness of these additives to mitigate CH4 is required than currently available.
Moreover, application of feed additives as mitigation strategy may have negative side effects,
in particular reduced animal health and performance, and a lack of persistency of the
mitigating effect. The overall aim of the work presented in this thesis is, therefore, to
investigate possible solutions to those frequently reported problems in relation to feed
additive-based mitigation strategies. The effectiveness and side effects of feed additives
may vary depending on the mode of action of the additive, the way it is provided to the
animal and whether a single additive is fed or additives are fed in combination. Therefore,
the specific research objectives of this PhD project are:
1. To investigate if the effects of two different additives, with different modes of action
on CH4 production and dairy cow performance, are additive or not.
2. To study the in vivo adaptation to potential CH4 reducing feed additives, using the

25
in vitro gas production technique.
3. To compare CH4 production and performance of dairy cows, fed either a single feed
additive or two different additives following a rotation schedule.
Outline of this thesis
The work described in this thesis was part of the Low Emission Feed project (Dutch project
‘EmissieArm Veevoer’). This project comprised research related to the effects of source
and quantity of dietary starch, grass silage and grass herbage quality and feed additives on
enteric CH4 production in dairy cows. As outlined above, the research in this thesis focuses
on the effect of feed additives on CH4 production. Chapter 2 describes an experiment with
the aim to determine whether the effects of nitrate and docosahexaenoic acid (DHA) on
CH4 production and animal performance in lactating dairy cows are additive. Methane
reducing feed additives, including nitrate, may adversely affect fiber degradation. Chapter
3 deals with the hypothesis that negative effects of a feed additive on fiber degradation in
the rumen can be detected by evaluating diurnal patterns of 13C enrichment of CO2. The
main ration components should then differ in starch and non-fiber carbohydrate content
as well as in natural 13C enrichment, as achieved in this trial. In Chapter 4, CH4 production
was evaluated at different time points during the course of microbial adaptation to CH4
reducing feed additives in vivo, using the in vitro gas production technique and inoculum
from cows in the in vivo trial. Chapter 5 outlines an in vivo study that was conducted to
compare CH4 production of dairy cows that were assigned to either continuous feeding of
a commercial blend of essential oils or to a weekly rotation in feeding the essential oil
blend and C12:0. In Chapter 6, the outcomes of the experiments described in the previous
chapters are discussed together to derive some overall conclusions and implications of
this research project. Chapter 7 provides an overview of other scientific output, related to
the research discussed in this thesis.
REFERENCES
Allison, M. J., and C. A. Reddy. 1984. Adaptations of gastrointestinal bacteria in response to changes
in dietary oxalate and nitrate. In: Klug, M. J., and C. A. Reddy (eds.) Current perspectives in
26
microbial ecology. Proceedings of the Third International Symposium on Microbial Ecology,
Michigan State University. American Society for Microbiology, Washington, D.C. ,USA.
Asanuma, N., M. Iwamoto, and T. Hino. 1999. Effect of the addition of fumarate on methane
production by ruminal microorganisms in vitro. J. Dairy Sci. 82:780–787.
Bayaru, E., S. Kanda, T. Kamada, H. Itabashi, N. Andoh, T. Nishida, M. Ishida, T. Itoii, K. Nagara, and Y.
Isobe. 2001. Effect of fumaric acid on methane production, rumen fermentation and
digestibility of cattle fed roughage alone. Anim. Sci. J. 72:139–146.
Beauchemin, K. A., and S. M. McGinn. 2006. Methane emissions from beef cattle: Effects of fumaric
acid, essential oil, and canola oil. J. Anim. Sci. 84:1489–1496.
Beauchemin, K. A., M. Kreuzer, F. O'Mara, and T. A. McAllister. 2008. Nutritional management for
enteric methane abatement: a review. Austr. J. Exp. Agric. 48:21–27.
Beckie, H. J. 2006. Herbicide-resistant weeds: management tactics and practices. Weed Technol.
20:793–814.
Benchaar, C., S. Calsamiglia, A. V. Chaves, G. R. Fraser, D. Colombatto, T. A. McAllister, and K. A.
Beauchemin. 2008. A review of plant-derived essential oils in ruminant nutrition and
production. Anim. Feed Sci. Technol. 145:209–228.
Benchaar, C. 2015. Diet supplementation with cinnamon oil, cinnamaldehyde, or monensin does not
reduce enteric methane production of dairy cows. Animal 1:418–425.
Benchaar, C., and H. Greathead. 2011. Essential oils and opportunities to mitigate enteric methane
emissions from ruminants. Anim. Feed Sci. Technol. 166–167:338–355.
Cardozo, P. W., S. Calsamiglia, A. Ferret, and C. Kamel. 2004. Effects of natural plant extracts on
ruminal protein degradation and fermentation profiles in continuous culture. J. Anim. Sci.
82:3230–3236.
Chapman, H. D. 2001. Use of anticoccidial drugs in broiler chickens in the USA: Analysis for the years
1995 to 1999. Poultry Sci. 80:572–580.
Dewhurst, R. J., E. J. Kim, R. T. Evans, A. R. J. Cabrita, and A. J. M. Fonseca. 2007. Effects of dietary
sulphur sources on concentrations of hydrogen sulphide in the rumen head-space gas of
dairy cows. Animal 1:531–535.
Durmic, Z., P. J. Moate, R. Eckard, D. K. Revel, R. Williams, and P. E. Vercoe. 2014. In vitro screening
of selected feed additives, plant essential oils and plant extracts for rumen methane
mitigation. J. Sci. Food Agric. 94:1191–1196.
Ellis, J. L., J. Dijkstra, E. Kebreab, A. Bannink, N. E. Odongo, B. W. McBride, and J. France. 2008.
Aspects of rumen microbiology central to mechanistic modelling of methane production in
cattle. J. Agric. Sci. 146:213–233.
27
Ellis, J. L., A. Bannink, J. France, E. Kebreab, and J. Dijkstra. 2010. Evaluation of enteric methane
prediction equations for dairy cows used in whole farm models. Global Change Biol.
16:3246–3256.
Gould, D. H. 1998. Polioencephalomalacia. J. Anim. Sci. 76:309–314.
Grainger, C., and K. A. Beauchemin. 2011. Can enteric methane emissions from ruminants be
lowered without lowering their production? Anim. Feed Sci. Technol. 166–167:308–320.
Hassanat, F., R. Gervais, C. Julien, D. I. Massé, A. Lettat, P. Y. Chouinard, H. V. Petit, and C. Benchaar,.
2013. Replacing alfalfa silage with corn silage in dairy cow diets: Effects on enteric methane
production, ruminal fermentation, digestion, N balance, and milk production. J. Dairy Sci.
96:4553–4567.
Hatew, B. 2015. Low Emission Feed: Opportunities to Mitigate Enteric Methane Production of Dairy
Cows. PhD thesis, Wageningen University, Wageningen, the Netherlands (228 pages).
Hatew, B., S. C. Podesta, H. Van Laar, W. F. Pellikaan, J. L. Ellis, J. Dijkstra, and A. Bannink. 2015.
Effects of dietary starch content and rate of fermentation on methane production in
lactating dairy cows. J. Dairy Sci. 98:486–499.
Hristov, A. N., C. Lee, T. Cassidy, K. Heyler, J. A. Tekippe, G. A. Varga, B. Corl, and R. C. Brandt. 2013a.
Effect of Origanum vulgare L. leaves on rumen fermentation, production, and milk fatty acid
composition in lactating dairy cows. J. Dairy Sci. 96:1189–1202.
Hristov, A. N., J. Oh, J. Firkins, J. Dijkstra, E. Kebreab, G. Waghorn, A. Adesogan, W. Yang, J. Tricarico,
C. Lee, P. J. Gerber, B. Henderson, and H. P. S. Makkar. 2013b. Mitigation of methane and
nitrous oxide emissions from animal operations: I. A review of enteric methane mitigation
options. J. Anim. Sci. 91:5045–5069.
Hristov, A. N., J. Oh, C. Lee, R. Meinen, F. Montes, T. Ott, J. Firkins, A. Rotz, C. Dell, A. Adesogan, W.
Yang, J. Tricarico, E. Kebreab, G. Waghorn, J. Dijkstra, and S. Oosting. 2013c. Mitigation of
greenhouse gas emissions in livestock production – A review of technical options for non-
CO2 emissions. In: Gerber, P.J., B. Henderson, and H.P.S. Makkar (eds). FAO Animal
Production and Health Paper No. 177. FAO, Rome, Italy.
Johnson, K. A., and D. E. Johnson. 1995. Methane emissions from cattle. J. Anim. Sci. 73:2483-2492.
Kolver, A. S., and P. W. Aspin. 2006. Supplemental fumarate did not influence milk solids or methane
production from dairy cows fed high quality pasture. Proc. N. Z. Soc. Anim. Prod. 66:409–415.
Latham, E. A., R. C. Anderson, W. E. Pinchak, and D. J. Nisbet. 2016. Insight on alterations to the
rumen ecosystem by nitrate and nitrocompounds. Front. Microbiol. 7:228.
28
Lee, C., and K. A. Beauchemin. 2014. A review of feeding supplementary nitrate to ruminant animals:
Nitrate toxicity, methane emissions, and production performance. Can. J. Anim. Sci. 94:557–
570.
Martin, C., D. P. Morgavi, and M. Doreau. 2010. Methane mitigation in ruminants: from microbe to
the farm scale. Animal 4:351–365.
McAllister, T. A., and Newbold, C. J. 2008. Redirecting rumen fermentation to reduce
methanogenesis. Austr. J. Exp. Agric. 48:7–13.
Molano, G., T. W. Knight, H. Clark. 2008. Fumaric acid supplements have no effect on methane
emissions per unit of feed intake in wether lambs. Aust. J. Exp. Agric. 48:165–168.
Newbold, J. R., S. M. Van Zijderveld, R. B. A. Hulshof, W. B. Fokkink, R. A. Leng, P. Terencio, W. J.
Powers, P. S. J. Van Adrichem, N.D. Paton, and H. B. Perdok. 2014. The effect of incremental
levels of dietary nitrate on methane emissions in Holstein steers and performance in Nelore
bulls. J. Anim. Sci. 92:5032–5040.
NRC. 2001. Nutrient Requirements of Dairy Cattle. 7th revised edition. Natl. Acad. Sci., Washington
DC.
Patra, A. K. 2013. The effect of dietary fats on methane emissions, and its other effects on
digestibility, rumen fermentation and lactation performance in cattle: A meta-analysis. Livest.
Sci. 155:244–254.
Patra, A. K. 2014. A meta-analysis of the effect of dietary fat on enteric methane production,
digestibility and rumen fermentation in sheep, and a comparison of these responses
between cattle and sheep. Livest. Sci. 162:97–103.
Petersen S. O., A. L. F. Hellwing, M. Brask. O. Højberg, M. Poulsen, Z. Zhu, K. R. Baral, and P. Lund.
2015. Dietary nitrate for methane mitigation leads to nitrous oxide emissions from dairy
cows. J. Environ. Qual. 44:1063–1070.
Ungerfeld, E. M., and R. A. Kohn. 2006. The role of thermodynamics in the control of ruminal
fermentation. Ruminant Physiology. Wageningen Academic Publishers, Wageningen, The
Netherlands.
Ungerfeld, E. M., R. A. Kohn, R. J. Wallace, and C. J. Newbold. 2007. A meta-analysis of fumarate
effects on methane production in ruminal batch cultures. J. Anim. Sci. 85:2556–2563.
Van Gastelen, S., E. C. Antunes-Fernandes, K. A. Hettinga, G. Klop, S. J. J. Alferink, W. H. Hendriks,
and J. Dijkstra. 2015. Enteric methane production, rumen volatile fatty acid concentrations,
and milk fatty acid composition in lactating Holstein-Friesian cows fed grass silage- or corn
silage-based diets. J. Dairy Sci. 98:1915–1927.

29
Van Middelaar, C. E., P. M. Berentsen, J. Dijkstra, and I. J. M. De Boer. 2013. Evaluation of a feeding
strategy to reduce greenhouse gas emissions from dairy farming: The level of analysis
matters. Agric. Sys. 121:9–22.
Van Middelaar, C. E., J. Dijkstra, P. M. Berentsen, and I. J. M. De Boer. 2014. Cost-effectiveness of
feeding strategies to reduce greenhouse gas emissions from dairy farming. J. Dairy. Sci. 97:
2427–2439.
Van Zijderveld, S.M. 2011. Dietary Strategies to Reduce Methane Emissions from Ruminants. PhD
thesis., Wageningen University, Wageningen, the Netherlands (132 pages).
Van Zijderveld, S. M., W. J. J. Gerrits, J. A. Apajalahti, J. R. Newbold, J. Dijkstra, R. A. Leng, and H. B.
Perdok. 2010. Nitrate and sulfate: Effective alternative hydrogen sinks for mitigation of
ruminal methane production in sheep. J. Dairy Sci. 93:5856–5866.
Van Zijderveld, S. M., B. Fonken, J. Dijkstra, W. J. J. Gerrits, H. B. Perdok, W. Fokkink, and J. R.
Newbold. 2011a. Effects of a combination of feed additives on methane production, diet
digestibility, and animal performance in lactating dairy cows. J. Dairy Sci. 94:1445–1454.
Van Zijderveld, S. M., J. Dijkstra, H. B. Perdok, J. R. Newbold, and W. J. J. Gerrits. 2011b. Dietary
inclusion of diallyl disulfide, yucca powder, calcium fumarate, an extruded linseed product,
or medium-chain fatty acids does not affect methane production in lactating dairy cows. J.
Dairy Sci. 94:3094–3104.
Van Zijderveld, S. M., W. J. J. Gerrits, J. Dijkstra, J. R. Newbold, R. B. A. Hulshof, and H. B. Perdok.
2011c. Persistency of methane mitigation by dietary nitrate supplementation in dairy cows. J.
Dairy Sci. 94:4028–4038.
Yáñez-Ruiz, D. R., A. Bannink, J. Dijkstra, E. Kebreab, D. P. Morgavi, P. O’Kiely, C. K. Reynolds, A.
Schwarm, K. J. Shingfield, Z. Yu, and A. N. Hristov. 2016. Design, implementation and
interpretation of in vitro batch culture experiments to assess enteric methane mitigation in
ruminants – a review. Anim. Feed Sci. Technol. 216:1–18.
Wallace, R. J., T. A. Wood, A. Rowe, J. Price, D. R. Yanez, S. P. Williams, C. J. Newbold. 2006.
Encapsulated fumaric acid as a means of decreasing ruminal methane emissions. Int. Congr.
Ser. 1293:148–151.

30

Chapter 2
Feeding nitrate and docosahexaenoic acid affects enteric
methane production and milk fatty acid composition in
lactating dairy cows
G. Klop*, B. Hatew*, A. Bannink†, J. Dijkstra*
* Animal Nutrition Group, Wageningen University, PO Box 338, 6700 AH Wageningen, The
Netherlands † Wageningen UR Livestock Research, PO Box 338, 6700 AH Wageningen, The Netherlands
(Journal of Dairy Science 99:1161 – 1172)

32
ABSTRACT
An experiment was conducted to study potential interaction between the effects of
feeding nitrate and docosahexaenoic acid (DHA; C22:6 n-3) on enteric CH4 production and
performance of lactating dairy cows. Twenty-eight lactating Holstein dairy cows were
grouped into 7 blocks of 4 cows. Within blocks, cows were randomly assigned to 1 of 4
treatments: control (CON; urea as alternative nonprotein N source to nitrate), NO3 [21 g of
nitrate/kg of dry matter (DM)], DHA (3 g of DHA/kg of DM and urea as alternative
nonprotein N source to nitrate), or NO3 + DHA (21 g of nitrate/kg of DM and 3 g of DHA/kg
of DM, respectively). Cows were fed a total mixed ration consisting of 21% grass silage, 49%
corn silage, and 30% concentrates on a DM basis. Feed additives were included in the
concentrates. Cows assigned to a treatment including nitrate were gradually adapted to
the treatment dose of nitrate over a period of 21 d during which no DHA was fed. The
experimental period lasted 17 d, and CH4 production was measured during the last 5 d in
climate respiration chambers. Cows produced on average 363, 263, 369, and 298 g of
CH4/d on CON, NO3, DHA, and NO3 + DHA treatments, respectively, and a tendency for a
nitrate × DHA interaction effect was found where the CH4-mitigating effect of nitrate
decreased when combined with DHA. This tendency was not obtained for CH4 production
relative to dry matter intake (DMI) or to fat- and protein corrected milk (FPCM). The NO3
treatment decreased CH4 production irrespective of the unit in which it was expressed,
whereas DHA did not affect CH4 production per kilogram of DMI, but resulted in a higher
CH4 production per kilogram of fat- and protein-corrected milk (FPCM) production. The
FPCM production (27.9, 24.7, 24.2, and 23.8 kg/d for CON, NO3, DHA, and NO3 + DHA,
respectively) was lower for DHA-fed cows because of decreased milk fat concentration.
The proportion of saturated fatty acids in milk fat was decreased by DHA, and the
proportion of polyunsaturated fatty acids was increased by both nitrate and DHA. Milk
protein concentration was lower for nitrate-fed cows. In conclusion, nitrate but not DHA
decreased enteric CH4 production and no interaction effects were found on CH4
production per kilogram of DMI or per kilogram of FPCM.
Key words: methane, nitrate, docosahexaenoic acid, milk fatty acid

33
INTRODUCTION
Enteric CH4 production in ruminants has received global interest (Hristov et al., 2013), and
various feed additives have been suggested as a nutritional mitigation strategy. Feeding
nitrate as alternative electron receptor effectively decreases CH4 production in sheep (Van
Zijderveld et al., 2010), and a persistent effect was shown in lactating dairy cows (Van
Zijderveld et al., 2011). A sudden inclusion of high concentrations of nitrate in ruminant
diets may result in a condition known as methemoglobinemia, which decreases the
oxygen carrying capacity of the blood. Symptoms of nitrate toxicity depend on the level of
methemoglobin in the blood and may include reduced intake and performance, brown
discoloration of mucosae, and even death (Bruning-Fann and Kaneene, 1993). When
animals are gradually adapted to higher concentrations of nitrate in their diets, no signs of
(sub)clinical methemoglobinemia were observed (Van Zijderveld et al., 2010, 2011; Lee
and Beauchemin, 2014).
Supplementation of fat to ruminant diets also lowers CH4 production (Grainger and
Beauchemin, 2011). Specific fatty acids (FA) have been evaluated for their effect on rumen
fermentation, and docosahexaenoic acid (DHA; an n-3 FA; C22:6 n-3) has been shown to
have a particularly marked effect on microbial metabolism in the rumen (Boeckaert et al.,
2008a). Micro-algae enriched in DHA have been shown to decrease CH4 production in vitro
(Fievez et al., 2007), but this could not be confirmed in vivo (Moate et al., 2013).
The VFA profile in rumen fluid may shift toward more acetate when nitrate is fed, whereas
DHA may cause a shift toward a larger relative proportion of propionate (Boeckaert et al.,
2008b; Guyader et al., 2015). Propionate production is an H2-consuming process and can
therefore decrease CH4 production. Because nitrate and DHA have different mechanisms
of affecting ruminal methanogenesis, we hypothesize that their effects on CH4 production
are additive. An additive, or positive, interaction effect of the 2 additives would be of
interest because it would allow for a similar decrease in CH4 emissions using lower doses
of the separate additives. The latter would alleviate the risk of negative effects of the
additives on cow health and performance. Moreover, feeding DHA to lactating dairy cows

34
has been reported to increase the proportions of CLA and DHA in milk fat and decrease
the SFA proportion (Boeckaert et al., 2008b). From a human health perspective, such an
alteration in milk FA composition is of interest (Shingfield et al., 2013). To the best of our
knowledge, the effect of feeding nitrate on milk FA profile is unknown.
The main objective of this study was to investigate whether the effects of nitrate and DHA
on CH4 production and animal performance in lactating dairy cows are additive or not.
Milk FA profile is a potential indicator of CH4 production (van Lingen et al., 2014), and,
therefore, the effects of nitrate and DHA fed alone or in combination on milk FA
composition were also evaluated.
MATERIALS AND METHODS
Experimental design, animals, and housing
All experimental procedures were approved by the Animal Care and Use Committee of
Wageningen University (Wageningen, the Netherlands). The experiment was set up as a
completely randomized block design with 4 treatments. Eight primiparous and 20
multiparous lactating Holstein cows (125 ± 16 DIM at the start of the experimental period;
mean ± SD) were blocked according to parity, lactation stage, milk production and
presence or absence of a previously fitted rumen cannula. Within blocks, animals were
randomly assigned to 1 of the 4 experimental diets. One of the 8 cows with a rumen
cannula had to be culled because of foot injuries and was replaced by a nonfistulated
reserve animal already adapted to the same experimental diet (NO3).
Animals were housed in a freestall barn from which blocks of 4 cows consecutively
entered a 17-d experimental period. This 17-d period consisted of 12 d in tie-stalls, and
from 1500 h on d 13 until 0900 h on d 17, cows were housed individually in climate
respiration chambers (CRC).
35
Diets and feeding
The experimental diets consisted of 49% corn silage, 21% grass silage, and 30%
concentrates on a DM basis. Treatments consisted of a control treatment (CON; no nitrate
or DHA added), a nitrate treatment (NO3; 21 g of nitrate/kg of total DM), a DHA treatment
(DHA; 3 g of DHA/kg of total DM), and a treatment including both nitrate and DHA in the
diet (NO3 + DHA; 21 g of nitrate/kg of total DM and 3 g of DHA/kg of total DM). Nitrate,
DHA, or both were included in the concentrates (Table 2.1). Diets were balanced for N
content by isonitrogenous exchange of nitrate and urea. Cellulose and limestone were
added to balance DM and Ca content of the concentrate mixtures. DHAgold (DSM
Nutritional Products, Columbia, MD) was exchanged against wheat because of the similar
CP content. The chemical composition of DHAgold was described by Boeckaert et al. (2007)
where the DHA content was 198 g/kg of DM. In the present study, DHA content of
DHAgold was 254 g/kg of DM. Chromium oxide (1.7 g/ kg of DM) was included in all
concentrates to estimate total-tract diet digestibility of energy and nutrients. Diets were
offered to the cows as TMR (Table 2.2). Drinking water was continuously available during
the entire experiment.
All animals that were assigned to either the NO3 or the NO3 + DHA treatment, including 2
reserve animals, were gradually adapted to the experimental level of dietary nitrate (21
g/kg of DM) over a period of 21 d. Cows were group-fed once daily around 0900 h and
received 25% of the experimental dose of dietary nitrate during the first week, followed
by incremental steps of 25% per week and thereafter all cows received the full
experimental dose of dietary nitrate. No DHA was fed during this period of adaptation to
increasing levels of dietary nitrate.
During the experimental periods, cows were fed individually with 2 equal portions offered
twice daily (at 0600 and 1600 h). A mixture of grass silage and corn silage was prepared
twice weekly and weighed into crates that were stored in a cooling room (±7°C). The
concentrates were in meal form and weighed separately into buckets and manually mixed
into the roughage mixture at the moment of feeding. Until d 9 of the tie-stall period, each
block of cows had free access to feed. Thereafter, DMI within a block was restricted to 95%

36
Table 2.1. Ingredient composition (g/kg of DM) of the experimental concentrates containing no treatment additive (CON), nitrate (NO3), docosahexaenoic acid (DHA), or NO3 + DHA as feed additives Ingredient CON NO3 DHA NO3 + DHA Wheat 194 194 155 155 Dry, ground corn 145 145 145 145 Beet pulp 165 165 165 165 Formaldehyde-treated soybean meal 321 321 321 321 Molasses 33 33 33 33 Trace mineral and vitamin premix 9 9 9 9 Monocalcium phosphate 17 17 17 17 NaCl 17 17 17 17 CaCO3 57 — 57 — Nitrate source1 — 98 — 98 Urea 39 — 39 — DHAgold2 — — 39 39 Cellulose 2 — 2 — Cr2O3 1.7 1.7 1.7 1.7
15Ca(NO3)2NH4NO310H2O, containing 75% nitrate. 2DHAgold (DSM Nutritional Products, Columbia, MD) = dried, whole cell algae product (seaweed meal), containing 25.4% DHA; trademark of Martek Biosciences Corporation, Royal DSM NV.
of that of the animal with the lowest voluntary DMI between d 5 and 8, while ensuring
that none of the animals in the block was restricted to less than 80% of its voluntary DMI.
Measurements, sampling, and laboratory analyses
Methane was measured in CRC with a volume of 35 m3 (for details of CRC, see van
Gastelen et al., 2015). Briefly, temperature in the chambers was set at 16°C and the
relative humidity was maintained at 65%. The ventilation rate was 43 m3/h per chamber,
inlet and exhaust air of each compartment was sampled at 10 min intervals, and the light
schedule allowed for 16 h of light per d, starting from 0530 h onward. Concentrations of
CH4, O2, and CO2 in inlet and exhaust air of each compartment were sampled, and
ventilation rates were corrected for air pressure, temperature, and humidity to arrive at
standard temperature pressure dew point volumes of inlet and exhaust air. Heat
production rates were calculated from gaseous exchange (Brouwer, 1965). Cows were
weighed immediately after entering and just before leaving the CRC.
Representative samples of all individual TMR components were collected at the moments
of feed preparation for measurement periods in the CRC. Orts were collected during the

37
period that cows were in the CRC. If the amount composed more than 4% of the
estimated DM supply, a representative subsample was analyzed for DM and ash content.
If the amount was less than 4% of DM supply, composition of the orts was assumed to be
similar to the composition of the offered diet. During CRC periods, the total amount of
manure was collected and mixed, and a representative subsample was taken for analysis
of DM, gross energy (GE), and N content. Fecal grab samples were collected at each
milking in the CRC for analysis of DM, GE, N, crude fat, starch, NDF, ash, and chromium
content to estimate apparent total-tract digestibility of nutrients. Samples were stored at
−20°C pending analysis. After thawing, samples were dried at 60°C until constant weight
and ground to pass a 1-mm screen. The N concentrations in manure and of roughages
were determined in fresh material. For the determination of NH3 content, fresh silage
samples were deproteinized by the addition of 10% (wt/vol) trichloroacetic acid solution
followed by centrifugation. Subsequently, indophenol blue was formed using the
Berthelot reaction with phenol and hypochlorite in an alkaline solution, which was
determined spectroscopically at 623 nm. The DM content of air dry samples was
gravimetrically determined by drying at 103°C until constant weight (ISO 6496; ISO, 1999b).
Ash was determined after combustion at 550°C (ISO 5984; ISO, 2002). Crude protein
content was calculated as N × 6.25, where N was determined using the Kjeldahl method
with CuSO4 as catalyst (ISO 5983; ISO, 2005). Based on findings of Guo et al. (2007), N
content of nitrate containing concentrates was corrected assuming a nitrate-N recovery of
53% after Kjeldahl analysis. The nitrate concentrations in all concentrates were analyzed
at the Eurofins laboratory (Barendrecht, the Netherlands). Briefly, nitrate was extracted
from the feed using Milli-Q water and converted into nitrite using a cadmium/copper
column. Subsequently, the reaction product formed after combination of nitrite and
sulfanilamide in an acidic environment was combined with N-1-naphtylethylene diamine
dihydrochloride into a red/purple color, which was measured spectrophotometrically at
550 nm. Nitrite concentration of the original sample was analyzed separately to correct
the result for nitrate. Hydrolysis with HCl and extraction with light petroleum was used to
determine crude fat content of samples (ISO 6492; ISO, 1999a). Starch was determined
enzymatically (ISO 15914; ISO, 2004). The NDF content of samples was analyzed according
to Van Soest et al. (1991) after pretreatment with α-amylase, but without sodium sulfite.

38
Table 1.2. Average analyzed chemical composition of TMR ingredients (corn silage, grass silage, and concentrates) and calculated composition of complete TMR for the control (CON) diet and diets with nitrate (NO3), docosahexaenoic acid (DHA), or NO3 + DHA as feed additives (g/ kg of DM unless otherwise stated)
Roughages Concentrates TMR Item Corn
silage1 Grass silage2
CON NO3 DHA NO3+DHA CON NO3 DHA NO3+DHA Inclusion (g/kg DM)
490 210 300 300 300 300 - - - - DM (g/kg) 326 586 884 874 894 881 454 452 455 453 Gross energy (MJ/kg DM)
18.6 18.5 16.4 15.7 16.8 16.1 17.9 17.7 18.0 17.8 Crude Ash 36 76 134 135 135 134 74 74 74 74 CP 78 109 347 345 341 349 165 165 163 166 Crude fat 33 30 22 21 40 31 29 29 34 32 NDF 380 561 165 163 155 177 354 356 351 357 ADF 221 327 72 70 70 69 199 198 198 198 ADL 21 25 7 8 7 9 18 18 18 18 Starch 353 NA 239 231 209 209 245 242 236 236 Sugar 6 130 16 13 16 16 35 34 35 35 Nitrate NA3 NA 0 71 0 72 0 21 0 21 1NEL = 6.2 MJ/kg of DM. 2NEL = 6.9 MJ/kg of DM. 3NA = not analyzed.
Methods described by Van Soest et al. (1991) were also used for analysis of ADF content
and ADL was analyzed using sulfuric acid (Robertson and Van Soest, 1981). An adiabatic
bomb calorimeter (IKA-C700, Janke and Kunkel, Heitersheim, Germany) was used for
determination of GE content (ISO 9831; ISO, 1998). Chromium contents of concentrates
and feces were analyzed using atomic absorption spectrophotometry (Williams et al.,
1962).
Milk Production and Milk Composition
Cows were milked twice daily (0600 and 1600 h) throughout the entire experiment. Milk
production was recorded at each milking. A subsample of milk from each milking in the
CRC was analyzed for fat, protein, lactose, and GE, and N and MUN content were analyzed
in a pooled sample from all milkings in the CRC (5 g/kg of milk produced) according to
methods described by Hatew et al. (2015a). Average milk composition for each cow was
calculated from the weighted average of all samples taken during the 72-h measurement
period in the CRC. Fat- and protein-corrected milk yield (FPCM) was calculated according
to the formula FPCM (kg/d) = (0.337 + 0.116 × fat % + 0.06 × protein %) × milk yield (kg/d)
(CVB, 2008). For each cow, an additional milk sample was collected (5 g/kg of milk at each

39
milking in the chambers) and analyzed for milk FA composition through gas
chromatography as described by van Gastelen et al. (2015). Milk FA were expressed in
grams per 100 g of total FA.
Blood Samples
During the 21 d of pre-experimental period of adaptation to the final inclusion level of
dietary nitrate, a blood sample was collected from all 16 cows fed nitrate after each
incremental dose of nitrate in the diet (i.e., d 1, 7, 14, and 21 of this pre-experimental
period). Blood was collected from the tail vein in heparinized collection tubes at 3 h post
feeding. Blood samples were analyzed for hemoglobin (Hb) and methemoglobin (MetHb)
content within 1.5 h after sampling in the laboratory of Hospital Gelderse Vallei (Ede, the
Netherlands) using a blood gas analyzer ABL-825 (Radiometer, Copenhagen, Denmark).
Statistical analysis
Data on DMI, milk production, milk composition, and CH4 production are based on
measurements during the last 72 h of the measurement period when cows were in the
CRC. For one cow (DHA treatment) only the last 48 h of the measurement period were
used, because this cow had an extremely low DMI and water intake during the first 24 h of
the measurement period. Two cows (CON and NO3 treatment) were excluded from the
analyses because of a feeding error in the CRC. Energy and N retention and digestibility
values were calculated based on the entire period in the CRC and averaged per day. For
milk FA composition, values below the detection limit (<0.02 g/100 g of FA) were
considered missing values.
All data were analyzed using PROC MIXED (SAS 9.2, SAS Inst. Inc., Cary, NC). The model
contained main and interaction effects of dietary treatment factors (nitrate and DHA) as
fixed effects and the effect of period (which is equal to block) as a random factor using a
variance components (VC) covariance structure. The effect of chamber was initially
included as fixed effect in the model, but was removed because it was not significant.
Denominator degrees of freedom were estimated using the Kenward-Roger option.
Multiple comparisons between treatments were made using the Tukey-Kramer method.

40
Results are reported as least squares means, and significance of effects was declared at P
≤ 0.05 and trends at 0.05 < P ≤ 0.10.
RESULTS AND DISCUSSION
Methane production and cow performance
The main objective of this study was to examine if the effects of dietary nitrate and DHA
on enteric CH4 production of lactating dairy cows are additive. For CH4 production in
grams per day, a tendency for a nitrate × DHA interaction was found (Table 2.3), showing
that the effect of nitrate and DHA is different when combined. This was most likely a
result of the lower DMI of cows receiving the NO3 treatment, despite the restricted
feeding regimen. Nevertheless, if DMI would have been equal across all treatments, the
CH4 production per kilogram of DMI might have been slightly higher for cows on the NO3
treatment, but not to such an extent that it would have altered the overall conclusions of
this experiment because the feed intake of the NO3 treatment is still ~95% of the intake of
the other treatments. Decreased feed intake after feeding dietary nitrate to ruminant
animals has been reported previously (Newbold et al., 2014; Lee et al., 2015b).
With CH4 production expressed in grams per kilogram of DMI or grams per kilogram of
FPCM, the nitrate × DHA interaction term was not significant, showing an additive effect
between nitrate and DHA. Nitrate decreased CH4 irrespective of the unit in which it was
expressed, whereas DHA had no effect on CH4 per kilogram of DMI or CH4 per kilogram of
digestible OM intake, but resulted in a higher CH4 production per kilogram of FPCM (Table
2.3). Moate et al. (2013) reported increased CH4 emissions per kilogram of DMI and per
kilogram of ECM in response to increasing levels of DHA in the diet. Cows in the study of
Moate et al. (2013) had unrestricted access to roughage, whereas in the present
experiment a restricted feeding regimen was applied. The latter may explain the absence
of an effect of DHA on DMI in the present study, whereas in the study of Moate et al.
(2013), DMI was significantly reduced at higher doses of DHA (22.1, 22.4, 21.3, and 20.5 kg
of DMI/d for the treatments receiving 0, 25, 50, or 75 g of DHA/d, respectively). Previously,
DHA has been found to reduce CH4 production in vitro (Fievez et al., 2007), but this

41
reduction could not be confirmed in vivo by Moate et al. (2013) and in the present trial.
Hatew et al. (2015b) showed that effects of starch source and level on in vitro CH4
production were not observed in vivo in animals adapted to the various starch sources and
levels when CH4 production was expressed per unit of OM intake. We hypothesize that in
the present trial the rumen microbial ecosystem adapted to DHA supply resulting in
unchanged CH4 production compared with the control. If 21 g of nitrate/kg of DMI is
completely reduced to ammonia, CH4 emission should be lowered by 5.4 g/kg of DMI
based on stoichiometry. With an average CH4 production of 17.6 and 22.2 g/kg of DMI for
cows receiving a diet with and without nitrate, respectively, the average decline in CH4
reduction corresponds to 85% of the stoichiometric potential to decrease CH4. This agrees
with findings from previous studies in which similar dietary inclusion levels of nitrate were
fed to lactating dairy cows (Lund et al., 2014) or beef cattle (Hulshof et al., 2012) and
where CH4 production was lowered by 86% and 87% of the stoichiometric potential,
respectively. The present decrease in CH4 production is higher compared with the study of
Van Zijderveld et al. (2011), who found a decrease of 59% of the theoretical potential. The
feed intake of cows in the study of Van Zijderveld et al. (2011) was higher (±19 kg of
DMI/d) than the DMI of cows in the current experiment (±16 kg of DMI/d). The lower DMI
in the present study may have resulted in a longer retention time of feed or fluid, and of
nitrate, in the rumen and thus more time for nitrate to be completely reduced to
ammonia. Although this argument seems to be in contrast with findings of Lund et al.
(2014), who reported a similar decline in CH4 yield at DMI values above 19 kg/d when
nitrate was fed, this contrast may be partly explained by the differences in experimental
setup. In the study of Van Zijderveld et al. (2011) methods of adaptation and feed
restriction were similar to the present study, whereas in the study of Lund et al. (2014) no
feed restriction was imposed and cows were also not gradually adapted to the
experimental level of nitrate in their diet. Such differences in experimental setup may
have affected rumen metabolism differently. Moreover, based on visual observations in
the tie-stalls, cows receiving any of the additive treatments in the present study also
seemed to have a more gradual feed intake pattern than cows on the CON treatment.
Based on visual observations of the diurnal patterns of the respiration quotient (RQ; data
not included), we noticed that the RQ value showed a sharp increase for the CON

42
Table 2.3. Dry matter intake, milk production, milk composition, and CH4 production of dairy cattle fed the control (CON) diet or diets with nitrate (NO3), docosahexaenoic acid (DHA), or NO3 + DHA as feed additives Treatment1 P-value Item CON NO3 DHA NO3+DHA SEM NO3 DHA NO3×DHA DMI (kg/d) 16.5 15.7 16.5 16.4 0.81 0.020 0.044 0.060 Milk production (kg/d) 27.8 25.1 28.0 28.0 1.64 0.201 0.180 0.228 FPCM (kg/d)2 27.9 24.7 24.2 23.8 1.58 0.128 0.062 0.233 Fat (g/kg) 40.9 39.5 29.8 29.4 2.12 0.602 <0.001 0.744 Fat (g/d) 1147 1008 824 814 76.4 0.231 <0.001 0.296 Protein (g/kg) 31.2 30.4 31.0 29.5 0.68 0.047 0.369 0.561 Protein (g/d) 869 765 869 826 53.0 0.030 0.354 0.338 Lactose (g/kg) 44.8 45.6 46.6 46.2 0.69 0.728 0.043 0.281 MUN (mg/dL) 11.4 11.4 13.1 11.2 0.88 0.288 0.393 0.311 CH4 (g/d) 363 263 369 298 14.5 <0.001 0.016 0.069 CH4 (g/kg DMI) 22.0 16.9 22.4 18.2 0.52 <0.001 0.086 0.305 CH4 (g/kg DOMI3) 31.4 24.7 31.9 25.5 0.69 <0.001 0.352 0.759 CH4 (g/kg FPCM) 13.1 10.8 15.4 12.6 0.57 <0.001 0.001 0.629 CH4 (% of GEI4) 6.8 5.3 7.0 5.7 0.35 <0.001 0.090 0.487 1CON (urea as nonprotein N source), NO3 (21 g of nitrate/kg of DM), DHA (3 g of DHA/kg of DM and urea as nonprotein N source), NO3 + DHA (21 g of nitrate/kg of DM and 3 g of DHA/kg of DM). For CON and NO3 treatments n = 6, for DHA and NO3 + DHA treatments n = 7. 2Fat- and protein-corrected milk (FPCM) = (0.337 + 0.116 × fat % + 0.06 × protein %) × milk yield (kg/d) (CVB, 2008). 3DOMI = digestible organic matter intake. 4GEI = gross energy intake.
treatment shortly after feeding, whereas the other treatments had lower RQ peak values
after feeding. This numerical difference supports the visual observations in tie-stalls and
CRC that the feed intake pattern was different across treatments. Alteration of feeding
behavior as a result of dietary nitrate supplementation has been reported previously for
beef calves (Lichtenwalner et al., 1973). Such a difference in feed intake pattern could not
be quantified in the present study, but a more gradual feed intake, with smaller portions
per meal, may have contributed as well to a longer retention time of nitrate in the rumen.
Guyader et al. (2015) fed nitrate (22.5 g/ kg of DMI) to nonlactating cows with an average
DMI of 12.3 kg/d and found a decrease in CH4 production of 5.6 g/kg of DM compared
with the control diet. This corresponds to 96% of the stoichiometric potential of 5.8 g/kg
of DM. The difference in physiological state (nonlactating), as well as an increased rumen
retention time of nitrate as a result of the lower feed intake in the former study, may
explain the larger decrease in CH4 as compared with the present experiment.

43
Milk production was not affected by dietary treatment, but FPCM production tended to be
decreased by DHA as a result of a significantly lower milk fat production (Table 2.3).
Several rumen biohydrogenation intermediates, including trans-10 FA, increase upon
feeding DHA, and after absorption such intermediates may decrease de novo FA synthesis
in the mammary gland (Boeckaert et al., 2008b). Feeding DHA decreased SFA
concentrations (expressed as g/100 g of total FA) in milk and increased concentrations of
PUFA (Table 2.4). The latter is comparable to findings of Boeckaert et al. (2008b) and
Moate et al. (2013). To our knowledge, the effect of dietary nitrate on milk FA
composition has not yet been reported. Nitrate had no effect on SFA proportion and
proportion of MUFA, but increased the proportion of PUFA in milk FA. The proportion of
C4:0 in milk FA was increased by feeding nitrate. Unlike other saturated short-chain FA,
C4:0 in milk fat does not require acetate for its production as it can be produced directly
from β-hydroxybutyrate derived from the blood. Nitrate also increased the proportion of
C18:0 in milk fat (Table 2.4), which is indicative for more biohydrogenation in the rumen.
This may be a consequence of the aforementioned longer retention time of feed in the
rumen as compared with cows on the CON treatment. The proportions of C14:0 iso and
C15:0 iso were also increased by nitrate, whereas CH4 was decreased. This is in contrast
with findings of Castro-Montoya et al. (2011), who reported a positive relationship
between iso-FA and CH4 yield. This relationship was associated with the higher abundance
of iso-FA in fibrolytic microbes (Vlaeminck et al. 2006), which in turn are associated with a
higher CH4 yield. However, feeding nitrate only was observed to decrease total-tract
apparent fiber digestion, and the increased levels of C14:0 iso and C15:0 iso in milk fat,
indicative of increased abundance of fibrolytic bacteria, are not in line with the reduced
fiber digestion observed when feeding nitrate without DHA. The increase in trans-11 FA
together with a decline in CH4 production in cows receiving nitrate is in line with van
Lingen et al. (2014). In contrast to feeding nitrate, feeding DHA decreased the proportion
of C18:0 in milk fat. This agrees qualitatively with in vitro studies with DHA added to
rumen fluid of cows adapted to DHA, where biohydrogenation of C18:2 trans-11,cis-15
was hindered and no biohydrogenation of C18:1 trans-11 to C18:0 occurred (Vlaeminck et
al., 2008). Feeding DHA increased proportions of several MUFA, including C18:1 trans-10

Tabl
e 2.
4. F
atty
aci
d co
mpo
sitio
n of
milk
from
dai
ry c
attle
fed
the
cont
rol (
CON
) die
t or d
iets
with
nitr
ate
(NO
3), d
ocos
ahex
aeno
ic a
cid
(DHA
), or
NO
3 +
DHA
as fe
ed a
dditi
ves
Tr
eatm
ent1
P-
valu
e Fa
tty
acid
(g
/100
g o
f FA
)
CO
N
N
O3
D
HA
N
O3
+ D
HA
SEM
NO
3
DH
A
NO
3 ×
DH
A
C4:0
3.
98
4.16
3.
85
4.42
0.
165
0.03
4 0.
709
0.24
9 C6
:0
2.40
2.
41
2.35
2.
33
0.07
1 0.
962
0.36
7 0.
833
C8:0
1.
22
1.22
1.
25
1.14
0.
070
0.42
6 0.
736
0.42
6 C1
0:0
2.59
2.
54
2.92
2.
35
0.45
7 0.
188
0.75
4 0.
264
C12:
0 2.
88
2.79
3.
37
2.68
0.
263
0.15
7 0.
472
0.26
5 C1
4:0
10.6
2 10
.72
12.1
0 10
.87
0.53
2 0.
295
0.14
1 0.
222
C14:
0 iso
0.
06
0.08
0.
05
0.07
0.
006
0.00
4 0.
056
0.58
7 C1
4:1
cis-9
1.
07
1.00
1.
19
1.14
0.
099
0.53
2 0.
198
0.94
3 C1
5:0
0.78
0.
83
0.86
0.
83
0.05
0 0.
850
0.42
5 0.
344
C15:
0 iso
0.
18
0.23
0.
18
0.19
0.
014
0.03
4 0.
093
0.10
9 C1
5:0
ante
iso
0.30
0.
38
0.39
0.
40
0.02
2 0.
027
0.00
9 0.
070
C16:
0 35
.00
32.0
3 33
.73
32.2
2 1.
354
0.08
0 0.
666
0.55
3 C1
6:0
iso
0.15
0.
16
0.16
0.
14
0.01
1 0.
902
0.97
6 0.
079
C16:
1 cis
-9
2.20
1.
84
1.69
1.
59
0.14
9 0.
133
0.01
8 0.
375
C16:
1 tr
ans-
9 0.
19
0.23
0.
19
0.21
0.
016
0.04
5 0.
485
0.56
2 C1
7:0
0.51
b 0.
58a
0.53
ab
0.53
ab
0.02
0 0.
036
0.41
1 0.
029
C17:
0 iso
0.
36
0.40
0.
42
0.39
0.
023
0.76
2 0.
332
0.18
5 C1
7:0
ante
iso
0.36
0.
39
0.43
0.
41
0.01
9 0.
731
0.02
7 0.
218
C17:
1 cis
-9
0.29
0.
28
0.21
0.
22
0.02
3 0.
886
0.00
3 0.
721
C18:
0 7.
23
8.68
2.
11
3.54
0.
423
0.00
3 <0
.001
0.
977
C18:
1 cis
-92
19.3
8 19
.46
10.2
0 14
.13
1.39
7 0.
054
<0.0
01
0.06
3 C1
8:1
cis-1
2 0.
29
0.31
0.
13
0.16
0.
017
0.09
7 <0
.001
0.
919
C18:
1 cis
-13
0.14
0.
16
0.23
0.
21
0.02
1 0.
951
0.00
1 0.
367
C18:
1 tr
ans-
9 0.
16
0.20
0.
79
0.82
0.
065
0.58
3 <0
.001
0.
966
C18:
1 tr
ans-
10
0.30
c 0.
48c
5.60
a 1.
90b
0.33
6 <0
.001
<0
.001
<0
.001
C1
8:1
tran
s-11
0.
72
1.24
3.
20
4.40
0.
421
0.03
7 <0
.001
0.
380
C18:
1 tr
ans-
15 +
C18
:1 ci
s-11
0.
77
0.82
1.
08
1.15
0.
071
0.34
5 <0
.001
0.
878
C18:
2 cis
-9, t
rans
-11
0.40
0.
55
1.35
2.
08
0.18
7 0.
027
<0.0
01
0.12
6

Tabl
e 2.
4. c
ontin
ued.
Trea
tmen
t1
P-va
lue
Fatt
y ac
id
(g/1
00 g
of
FA)
C
ON
NO
3
DH
A
NO
3 +
DH
A
SE
M
N
O3
D
HA
N
O3
× D
HA
C1
8:2n
-6
1.72
1.
86
1.86
1.
88
0.08
0 0.
340
0.32
7 0.
509
C18:
3n-3
0.
32
0.33
0.
31
0.31
0.
018
0.50
9 0.
348
0.61
2 C1
8:3n
-6
0.07
0.
08
0.07
0.
08
0.00
3 0.
002
0.12
5 0.
207
C20:
0 0.
10
0.12
0.
06
0.08
0.
007
0.04
3 <0
.001
0.
915
C20:
1 cis
-11
0.06
0.
06
0.09
0.
11
0.00
8 0.
125
<0.0
01
0.36
5 C2
0:2n
-6
0.04
0.
04
0.05
0.
05
0.00
3 0.
690
<0.0
01
0.15
5 C2
0:3n
-6
0.07
0.
07
0.10
0.
11
0.00
7 0.
943
<0.0
01
0.56
7 C2
0:4n
-6
0.12
0.
12
0.25
0.
24
0.01
0 0.
506
<0.0
01
0.90
6 C2
0:5n
-3
0.05
0.
05
0.15
0.
14
0.00
8 0.
494
<0.0
01
0.49
4 C2
2:0
0.04
0.
04
0.03
0.
04
0.00
4 0.
039
0.37
6 0.
335
C22:
5n-3
0.
08
0.08
0.
18
0.17
0.
007
0.09
4 <0
.001
0.
873
C22:
6n-3
N
.D.3
N.D
. 0.
65
0.70
-
- -
- C2
4:0
0.03
0.
03
0.04
0.
04
0.00
3 0.
411
0.02
1 0.
411
SFA4
68.7
6 67
.75
64.8
4 62
.61
1.57
8 0.
282
0.00
7 0.
680
MU
FA5
25.6
2 26
.14
24.5
8 26
.04
1.44
0 0.
402
0.63
6 0.
688
PUFA
6 2.
87
3.18
4.
97
5.76
0.
258
0.04
6 <0
.001
0.
352
n-6
: n-3
ratio
7 4.
59
4.76
1.
82
1.79
0.
010
0.47
2 <0
.001
0.
327
a–c M
eans
with
in a
row
with
diff
eren
t sup
ersc
ripts
diff
er (P
< 0
.05)
. 1 CO
N (u
rea
as n
onpr
otei
n N
sour
ce),
NO
3 (21
g o
f nitr
ate/
kg o
f DM
), DH
A (3
g o
f DHA
/kg
of D
M a
nd u
rea
as n
onpr
otei
n N
sour
ce),
NO
3 + D
HA (2
1 g
of n
itrat
e/kg
of D
M a
nd 3
g
of D
HA/k
g of
DM
). Fo
r CO
N a
nd N
O3 t
reat
men
ts, n
= 6
; for
DHA
and
NO
3 + D
HA tr
eatm
ents
, n =
7.
2 C18:
1 cis
-9 c
onsis
ts o
f the
sum
of C
18:1
cis-
9 an
d C1
8:1
tran
s-12
, bec
ause
thes
e 2
fatt
y ac
ids c
ould
not
be
sepa
rate
d in
the
anal
ysis.
The
pro
- por
tion
of C
18:1
tran
s-12
is
usua
lly n
eglig
ible
. 3 N
D =
not d
etec
ted
(det
ectio
n lim
it =
0.02
g/1
00 g
of f
atty
aci
ds).
4 Sum
of S
FA re
port
ed in
this
tabl
e.
5 Sum
of M
UFA
repo
rted
in th
is ta
ble.
6 Su
m o
f PU
FA re
port
ed in
this
tabl
e.
7 Ratio
bet
wee
n th
e su
m o
f C18
:2n-
6, C
18:3
n-6,
C20
:2n-
6, C
20:3
n-6,
and
C20
:4n-
6, a
nd th
e su
m o
f C18
:3n-
3, C
20:5
n-3,
C22
:5n-
3, a
nd fo
r tre
at- m
ents
DHA
and
NO
3 + D
HA a
lso
C22:
6n-3
.

46
and C18:1 trans-11. The alteration in milk FA profile is in line with findings of Boeckaert et
al. (2008b). However, contrary to the present study, these FA are often associated with a
decrease in CH4 per unit of feed and per unit of FPCM (van Lingen et al. 2014). If the best
performing equations (viz. equations 3 and 4) of van Lingen et al. (2014) are used to
predict CH4/kg of DMI and CH4/kg of FPCM, respectively, from the present milk FA data, a
considerable deviation is present between observed and predicted values. Predicted CH4
production is 20.8, 19.9, 12.4, and 14.8 g/kg of DMI and 12.1, 11.5, 9.7, and 9.4 g/kg of
FPCM for the CON, NO3, DHA, and NO3 + DHA treatments, respectively. Based on the
prediction equations, CH4 production should be decreased by DHA and nitrate would have
almost no effect, which is in contrast with the present observations. These comparisons
indicate that relationships between CH4 production and milk FA profile, obtained on a
wide variety of diets (van Lingen et al. 2014), differ from relationships between CH4
production and milk FA profile when CH4-mitigating supplements such as nitrate and DHA
are included in the diet, and thus also limit the general potential of milk FA to predict CH4
production. No DHA was detected in milk from cows receiving the CON or NO3 treatment.
The absence of DHA levels above the detection limit of 0.02 g/100 g of FA in milk of cows
that were not supplemented with DHA corresponds to the findings of van Valenberg et al.
(2013), who investigated milk FA composition of representative Dutch bovine milk
samples that were collected weekly for a period of 1 yr. On average 0.67 g of DHA/100 g
of FA was detected in milk from cows receiving DHA. The DHA content of the TMR (3 g/kg
of DM) resulted in a daily intake of almost 50 g of DHA/cow. This intake is comparable to
the 50 g of DHA/cow (D50) dose fed by Moate et al. (2013) who found a similar amount of
0.60 g of DHA/100 g of FA in milk.
Milk protein content was not affected by DHA, but feeding nitrate resulted in a small, but
significant reduction in milk protein content and yield (Table 2.3). Dietary nitrate also
resulted in a lower protein concentration in the study of Van Zijderveld et al. (2011).
However, protein yield was not affected by nitrate in their study in contrast to the present
study where protein yield was 796 and 869 g/d for diets with or without nitrate,
respectively (P = 0.030). In the Dutch protein evaluation system (DVE/OEB system), DVE
indicates digestible feed and microbial true protein digested in the small intestine

47
(Tamminga et al., 1994). In the current experiment, the calculated DVE supply based on
diet composition exceeded 100% of the calculated DVE requirements, indicating that
supply of protein did not limit milk protein synthesis. Incomplete reduction of dietary
nitrate may decrease the amount of rumen-available N and consequently impair microbial
protein synthesis and result in a lower DVE supply than expected based on standard feed
values. The resulting lower DVE supply would then negatively affect milk protein yield.
However, the actual decline in CH4 production in the current study was rather close to
stoichiometric potential of nitrate, which implies that most of the nitrate must have been
reduced to ammonia and has contributed to rumen available N. Alternatively, the negative
effect of nitrate on milk protein yield may be related to a decreased supply of
gluconeogenic precursors. Nitrate has been shown to increase the acetate:propionate
ratio in the rumen (Guyader et al., 2015), which could also affect milk protein content.
Rigout et al. (2003) reported an experiment and bibliographical study showing a positive
linear relationship between the supply of glucogenic precursors and milk protein content.
Glucose is an important factor in signaling pathways thought to regulate milk protein
synthesis (Rius et al., 2010). No treatment effects were found for MUN content of milk
(Table 2.3), and values were comparable to those found by Van Zijderveld et al. (2011),
who fed a similar diet as in the present study.
Blood methemoglobin
The average Hb content (mmol/L) of blood of the 16 cows that were gradually adapted to
increasing levels of dietary nitrate was 5.9 on d 1 and 7, and 5.6 on d 14 and 21 of the
adaptation period before the experimental period. Blood MetHb (% of total Hb) was on
average 1.3% on both d 1 and d 7, 2.5% on d 14, and 3.4% on d 21. The highest MetHb
value measured for an individual animal was 11.8% on d 21. This level is substantially
below the level of 30% that is considered to cause subclinical methemoglobinemia
(Bruning-Fann and Kaneene, 1993).
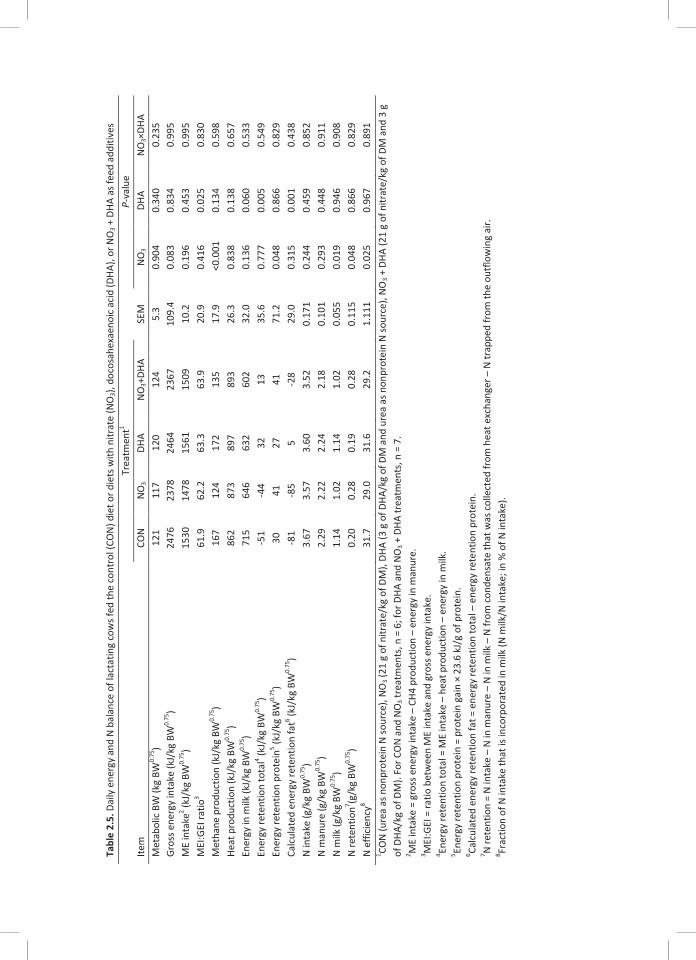
Tabl
e 2.
5. D
aily
ene
rgy
and
N b
alan
ce o
f lac
tatin
g co
ws f
ed th
e co
ntro
l (CO
N) d
iet o
r die
ts w
ith n
itrat
e (N
O3),
doc
osah
exae
noic
aci
d (D
HA),
or N
O3 +
DHA
as f
eed
addi
tives
Trea
tmen
t1
P-va
lue
Item
CO
N
NO
3 DH
A N
O3+
DHA
SEM
N
O3
DHA
NO
3×DH
A M
etab
olic
BW
(kg
BW0.
75)
121
117
120
124
5.3
0.90
4 0.
340
0.23
5 Gr
oss e
nerg
y in
take
(kJ/
kg B
W0.
75)
2476
23
78
2464
23
67
109.
4 0.
083
0.83
4 0.
995
ME
inta
ke2 (k
J/kg
BW
0.75
) 15
30
1478
15
61
1509
10
.2
0.19
6 0.
453
0.99
5 M
EI:G
EI ra
tio3
61.9
62
.2
63.3
63
.9
20.9
0.
416
0.02
5 0.
830
Met
hane
pro
duct
ion
(kJ/
kg B
W0.
75)
167
124
172
135
17.9
<
0.00
1 0.
134
0.59
8 He
at p
rodu
ctio
n (k
J/kg
BW
0.75
) 86
2 87
3 89
7 89
3 26
.3
0.83
8 0.
138
0.65
7 En
ergy
in m
ilk (k
J/kg
BW
0.75
) 71
5 64
6 63
2 60
2 32
.0
0.13
6 0.
060
0.53
3 En
ergy
rete
ntio
n to
tal4 (k
J/kg
BW
0.75
) -5
1 -4
4 32
13
35
.6
0.77
7 0.
005
0.54
9 En
ergy
rete
ntio
n pr
otei
n5 (kJ/
kg B
W0.
75)
30
41
27
41
71.2
0.
048
0.86
6 0.
829
Calc
ulat
ed e
nerg
y re
tent
ion
fat6 (k
J/kg
BW
0.75
) -8
1 -8
5 5
-28
29.0
0.
315
0.00
1 0.
438
N in
take
(g/k
g BW
0.75
) 3.
67
3.57
3.
60
3.52
0.
171
0.24
4 0.
459
0.85
2 N
man
ure
(g/k
g BW
0.75
) 2.
29
2.22
2.
24
2.18
0.
101
0.29
3 0.
448
0.91
1 N
milk
(g/k
g BW
0.75
) 1.
14
1.02
1.
14
1.02
0.
055
0.01
9 0.
946
0.90
8 N
rete
ntio
n7 (g/k
g BW
0.75
) 0.
20
0.28
0.
19
0.28
0.
115
0.04
8 0.
866
0.82
9 N
effi
cien
cy8
31
.7
29.0
31
.6
29.2
1.
111
0.02
5 0.
967
0.89
1 1 CO
N (u
rea
as n
onpr
otei
n N
sour
ce),
NO
3 (21
g o
f nitr
ate/
kg o
f DM
), DH
A (3
g o
f DHA
/kg
of D
M a
nd u
rea
as n
onpr
otei
n N
sour
ce),
NO
3 + D
HA (2
1 g
of n
itrat
e/kg
of D
M a
nd 3
g
of D
HA/k
g of
DM
). Fo
r CO
N a
nd N
O3 t
reat
men
ts, n
= 6
; for
DHA
and
NO
3 + D
HA tr
eatm
ents
, n =
7.
2 ME
inta
ke =
gro
ss e
nerg
y in
take
– C
H4 p
rodu
ctio
n –
ener
gy in
man
ure.
3 M
EI:G
EI =
ratio
bet
wee
n M
E in
take
and
gro
ss e
nerg
y in
take
. 4 En
ergy
rete
ntio
n to
tal =
ME
inta
ke –
hea
t pro
duct
ion
– en
ergy
in m
ilk.
5 Ener
gy re
tent
ion
prot
ein
= pr
otei
n ga
in ×
23.
6 kJ
/g o
f pro
tein
. 6 Ca
lcul
ated
ene
rgy
rete
ntio
n fa
t = e
nerg
y re
tent
ion
tota
l – e
nerg
y re
tent
ion
prot
ein.
7 N
rete
ntio
n =
N in
take
– N
in m
anur
e –
N in
milk
– N
from
con
dens
ate
that
was
col
lect
ed fr
om h
eat e
xcha
nger
– N
trap
ped
from
the
outf
low
ing
air.
8 Frac
tion
of N
inta
ke th
at is
inco
rpor
ated
in m
ilk (N
milk
/N in
take
; in
% o
f N in
take
).
49
Energy and nitrogen retention
No NO3 × DHA interaction effects on energy and N retention were found (Table 2.5). The
MEI:GEI ratio was higher for the diets containing DHA (Table 2.5). The calculated energy
retention was positive for cows receiving DHA and negative for cows on the CON or NO3
treatment. The tendency for decreased energy output in milk may explain the positive
energy retention of the cows receiving DHA. The absence of a significant effect of nitrate
on FPCM production or milk energy output is in line with results from a recent review by
Lee and Beauchemin (2014), who also reported that the consistent decline in CH4 yield by
dietary nitrate appears to be without directing additional energy toward animal
production.
Nitrogen retention was positive for all treatments (Table 2.5). The average N retention
was 28 g/d, which is in line with the generally small positive N retention reported for dairy
cattle N balance trials as reviewed by Spanghero and Kowalski (1997). Intake and
excretion of N was similar among treatments. As expected based on results for milk
protein, the N output in milk and N efficiency of milk production were lower for cows
receiving nitrate (Table 2.5). Nitrogen retention was significantly higher for cows receiving
nitrate, whereas N in manure was not affected.
Digestibility of nutrients
Supplementation of DHA generally resulted in higher total-tract digestibility of various
nutrients (Table 2.6). The higher fat digestibility on treatments with DHA is probably
caused by the slight difference in fat content of the TMR with and without DHA (Table 2.2).
If fat supplementation is higher, the calculated digestibility values are less affected by
fecal excretion of endogenous fat sources (Kil et al., 2010). This difference in dietary fat
content could not be prevented in the experimental set-up as exchanging DHA against
another fat source would not allow to distinguish between the effect of fat or a specific FA
on CH4 emissions.
Unlike the results for CH4 production, effects of nitrate and DHA on apparent total-tract
digestibility of nutrients were often not additive (Table 2.6). Digestibility of CP was not

50
Table 2.6. Apparent total-tract digestibility of nutrients in lactating dairy cows fed the control (CON) diet or diets
with nitrate (NO3), docosahexaenoic acid (DHA), or NO3 + DHA as feed additives
Treatment1 P-value Digestibility (%) CON NO3 DHA NO3+DHA SEM NO3 DHA NO3×DHA DM 73.9 71.2 75.2 75.6 0.72 0.133 0.001 0.051 OM 75.6ab 73.2b 76.9a 77.3a 0.67 0.143 <0.001 0.048 CP 70.8 69.7 68.6 69.8 1.10 0.989 0.313 0.265 NDF 61.0a 55.3b 63.6a 65.1a 1.31 0.132 <0.001 0.011 Crude fat 70.2 71.3 74.4 76.0 1.37 0.330 0.004 0.884 Starch 99.0 99.3 99.7 99.6 0.18 0.597 0.014 0.193 Gross energy 73.4a 70.3b 74.6a 75.1a 0.75 0.099 <0.001 0.027 a,bMeans within a row with different superscripts differ (P < 0.05). 1CON (urea as nonprotein N source), NO3 (21 g of nitrate/kg of DM), DHA (3 g of DHA/kg of DM and urea as nonprotein N source), NO3 + DHA (21 g of nitrate/kg of DM and 3 g of DHA/kg of DM). For CON and NO3 treatments, n = 6; for DHA and NO3 + DHA treatments, n = 7.
different between treatments and does therefore not provide an explanation for the
difference in milk protein yield and N utilization for milk production that was observed
between treatments with and without nitrate. Moreover, a reduction in DMI and nutrient
digestibility was only found for the NO3 treatment and not for the NO3 + DHA treatment
(Table 2.6). The effect of DHA on NDF digestibility and significance of the interaction term
seems mainly to be the result of the low NDF digestibility value obtained for the NO3
treatment (Table 2.6). The significantly lower NDF digestion may be related to a decreased
functioning of cell wall degrading microorganisms as a result of a temporarily increased
ruminal concentrations of H2. Such increases in H2 concentration after nitrate
supplementation have been reported previously (Van Zijderveld et al., 2011; Lund et al.,
2014). Accumulation of H2 in the rumen may impair regeneration of NAD+ from NADH
(McAllister and Newbold, 2008), and this may negatively affect cell wall degradation by
rumen microbes. Nitrite, as intermediate in the reduction of nitrate to ammonia,
decreased in vitro cell wall digestion and inhibited growth of cellulolytic bacteria (Marais
et al., 1988) and may also have negatively affected NDF digestibility. However, the MetHb
concentrations in blood of cows receiving nitrate were relatively low in the present study,
and it is thus less likely that nitrite accumulated to substantial amounts in the rumen.
Nevertheless, a possible negative effect of nitrite on fiber digestion cannot be excluded.
The findings of Lee et al. (2015b) suggest that a restricted feeding regimen influences the
potential adverse effects of nitrate on animal health and performance. Despite the poor

51
palatability of nitrate, cows may consume relatively large amounts of nitrate in one meal
under restricted feeding, which may exert negative effects in the rumen. Lee et al. (2015a)
observed no effect of nitrate on NDF digestibility in beef cattle that had free access to
feed. However, ADF digestibility was significantly decreased by nitrate, which indicated
that also in their study, fiber degradability did not remain completely unaffected. Better
NDF degradation in the rumen and thus more fermentation, probably explains the
numerically smaller decrease in CH4 per kilogram of DMI for cows on the NO3 + DHA
treatment as compared with cows on the NO3 treatment (Table 2.3).
CONCLUSIONS
Additive CH4-mitigating effects, or a positive interaction, of nitrate and DHA fed together
would have allowed for a significant decrease in CH4 at lower doses of individual additives.
Feeding DHA strongly affected milk FA composition, but did not decrease CH4 production
per kilogram of DMI and increased CH4 production per kilogram of FPCM, whereas nitrate
showed a large and consistent decrease in CH4 production irrespective of the unit in which
it was expressed. No interaction effect was found for the effects of nitrate and DHA on
CH4 in grams per kilogram of DMI and CH4 in grams per kilogram of FPCM. A significant
interaction effect between nitrate and DHA on NDF digestibility indicated that negative
effects of nitrate on apparent total-tract digestibility of nutrients were alleviated by DHA.
Such an interaction effect between nitrate and DHA could be of interest if nitrate is fed to
decrease CH4 production, because a decrease in CH4 production should not be
accompanied by reduced animal performance. Given the significant reductions in milk fat
and protein yield by DHA and nitrate, respectively, the current doses of the additives are
not recommended for application in practice.
ACKNOWLEDGMENTS
Abdulai Guinguina and Kitty Elsinghorst (Students of Wageningen University, the
Netherlands) and the staff of the experimental facilities “Carus” (Wageningen, the
Netherlands) are gratefully acknowledged for their assistance during the implementation
52
of the experiment. This study is part of the Low Emission Animal Feed project. The authors
acknowledge financial support of the Dutch Ministry of Economic Affairs (The Hague, the
Netherlands), Product Board Animal Feed (Zoetermeer, the Netherlands), and the Dutch
Dairy Board (Zoetermeer, the Netherlands), and acknowledge the TI Food and Nutrition
project “Reduced methane emission of dairy cows” for providing milk fatty acid data.
REFERENCES
Boeckaert, C., V. Fievez, D. Van Hecke, W. Verstraete, and N. Boon. 2007. Changes in rumen
biohydrogenation intermediates and ciliate protozoa diversity after algae supplementation
to dairy cattle. Eur. J. Lipid Sci. Technol. 109:767–777.
Boeckaert, C., B. Vlaeminck, V. Fievez, L. Maignien, J. Dijkstra, and N. Boon. 2008a. Accumulation of
trans C18:1 fatty acids in the rumen after dietary algae supplementation is associated with
changes in the Butyrivibrio community. Appl. Environ. Microbiol. 74:6923–6930.
Boeckaert, C., B. Vlaeminck, J. Dijkstra, A. Issa-Zacharia, T. Van Nespen, W. Van Straalen, and V.
Fievez. 2008b. Effect of dietary starch or micro algae supplementation on rumen
fermentation and milk fatty acid composition of dairy cows. J. Dairy Sci. 91:4714– 4727.
Brouwer, E. 1965. Report of sub-committee on constants and factors. Pages 441–443 in Energy
Metabolism: Proc. 3rd Symp. K. L. Blaxter, ed. EAAP Publ. No. 11. Academic Press, London,
UK.
Bruning-Fann, C. S., and J. B. Kaneene. 1993. The effects of nitrate, nitrite and N-nitroso compounds
on human health: A review. Vet. Hum. Toxicol. 35:521–538.
Castro Montoya, J., A. M. Bhagwat, N. Peiren, S. De Campeneere, B. De Baets, and V. Fievez. 2011.
Relationships between odd- and branched-chain fatty acid profiles in milk and calculated
enteric methane proportion for lactating dairy cattle. Anim. Feed Sci. Technol. 166:596–602.
CVB. 2008. CVB Table booklet feeding of ruminants. CVB series no. 43. Centraal Veevoederbureau,
Lelystad, the Netherlands.
Fievez, V., C. Boeckaert, B. Vlaeminck, J. Mestdagh, and D. Demeyer. 2007. In vitro examination of
DHA-edible micro-algae 2. Effect on rumen methane production and apparent degradability
of hay. Anim. Feed Sci. Technol. 136:80–95.
Grainger, C., and K. A. Beauchemin. 2011. Can enteric methane emissions from ruminants be
lowered without lowering their production? Anim. Feed Sci. Technol. 166–167:308–320.

53
Guo, W. S., L. P. Ren, Z. M. Zhou, and Q. X. Meng. 2007. Difference of nitrogen contents determined
by the combustion and Kjeldahl method in response to nitrate nitrogen in some feedstuffs. J.
Anim. Feed Sci. 16:178–183.
Guyader, J., M. Eugène, B. Meunier, M. Doreau, D. P. Morgavi, M. Silberberg, Y. Rochette, C. Gerard,
C. Loncke, and C. Martin. 2015. Additive methane-mitigating effect between linseed oil and
nitrate fed to cattle. J. Anim. Sci. 93:3564–3577.
Hatew, B., S. C. Podesta, H. Van Laar, W. F. Pellikaan, J. L. Ellis, J. Dijkstra, and A. Bannink. 2015a.
Effects of dietary starch content and rate of fermentation on methane production in
lactating dairy cows. J. Dairy Sci. 98:486–499.
Hatew, B., J. W. Cone, W. F. Pellikaan, S. C. Podesta, A. Bannink, W. H. Hendriks, and J. Dijkstra.
2015b. Relationship between in vitro and in vivo methane production measured
simultaneously with different dietary starch sources and starch levels in dairy cattle. Anim.
Feed Sci. Technol. 202:20–31.
Hristov, A. N., J. Oh, J. Firkins, J. Dijkstra, E. Kebreab, G. Waghorn, A. Adesogan, W. Yang, J. Tricarico,
C. Lee, P. J. Gerber, B. Henderson, and H. P. S. Makkar. 2013. Mitigation of methane and
nitrous oxide emissions from animal operations: I. A review of enteric methane mitigation
options. J. Anim. Sci. 91:5045–5069.
Hulshof, R. B. A., A. Berndt, W. J. J. Gerrits, J. Dijkstra, S. M. Van Zijderveld, J. R. Newbold, and H. B.
Perdok. 2012. Dietary nitrate supplementation reduces methane emission in beef cattle fed
sugarcane based diets. J. Anim. Sci. 90:2317–2323.
ISO. 1998. Animal feeding stuffs, animal products, and feces or urine. Determination of gross
calorific value – Bomb calorimeter method. International Standards Organization, Geneva,
Switzerland.
ISO. 1999a. Animal feeding stuffs. Determination of fat content. International Standards
Organization, Geneva, Switzerland.
ISO. 1999b. Animal feeding stuffs. Determination of moisture and other volatile matter content.
International Standards Organization, Geneva, Switzerland.
ISO. 2002. Animal feeding stuffs. Determination of crude ash. International Standards Organisation,
Geneva, Switzerland.
ISO. 2004. Animal feeding stuffs. Enzymatic determination of total starch content. International
Standards Organization, Geneva, Switzerland.
ISO. 2005. Animal feeding stuffs. Determination of nitrogen content and calculation of crude protein
content–Part1: Kjeldahl method. International Standards Organization, Geneva, Switzerland.

54
Kil, D. Y., T. E. Sauber, D. B. Jones, and H. H. Stein. 2010. Effect of the form of dietary fat and the
concentration of dietary neutral detergent fiber on ileal and total tract endogenous losses
and apparent and true digestibility of fat by growing pigs. J. Anim. Sci. 88:2959–2967.
Lee, C., and K. A. Beauchemin. 2014. A review of feeding supplementary nitrate to ruminant animals:
Nitrate toxicity, methane emissions, and production performance. Can. J. Anim. Sci. 94:557–
570.
Lee, C., R. C. Araujo, K. M. Koenig, and K. A. Beauchemin. 2015a. Effects of encapsulated nitrate on
enteric methane production, and nitrogen and energy utilization in beef heifers. J. Anim. Sci.
93:2391–2404.
Lee, C., R. C. Araujo, K. M. Koenig, and K. A. Beauchemin. 2015b. Effects of encapsulated nitrate on
eating behavior, rumen fermentation, and blood profile of beef heifers fed restrictively or ad
libitum. J. Anim. Sci. 93:2405–2418.
Lichtenwalner, R. E., J. P. Fontenot, and R. E. Tucker. 1973. Effect of source of supplemental nitrogen
and level of nitrate on feedlot performance and vitamin A metabolism of fattening beef
calves. J.Anim. Sci. 37:837–847.
Lund, P., R. Dahl, H. J. Yang, A. L. F. Hellwing, B. B. Cao, and M.R. Weisbjerg. 2014. The acute effect
of addition of nitrate on in vitro and in vivo methane emission in dairy cows. Anim. Prod. Sci.
54:1432–1435.
Marais, J. P., J. J. Therion, R. I. Mackie, A. Kistner, and C. Dennison. 1988. Effect of nitrate and its
reduction products on the growth and activity of the rumen microbial population. Br. J. Nutr.
59:301–313.
McAllister, T. A., and C. J. Newbold. 2008. Redirecting rumen fermentation to reduce
methanogenesis. Aust. J. Exp. Agric. 48:7–13.
Moate, P. J., S. R. O. Williams, M. C. Hannah, R. J. Eckard, M. J. Auldist, B. E. Ribaux, J. L. Jacobs, and
W. J. Wales. 2013. Effects of feeding algal meal high in docosahexaenoic acid on feed intake,
milk production, and methane emissions in dairy cows. J. Dairy Sci. 96:3177–3188.
Newbold, J. R., S. M. Van Zijderveld, R. B. A. Hulshof, W. B. Fokkink, R. A. Leng, P. Terencio, W. J.
Powers, P. S. J. Van Adrichem, N. D. Paton, and H. B. Perdok. 2014. The effect of incremental
levels of dietary nitrate on methane emissions in Holstein steers and performance in Nelore
bulls. J. Anim. Sci. 92:5032–5040.
Rigout, S., C. Hurtaud, S. Lemosquet, A. Bach, and H. Rulquin. 2003. Lactational effect of propionic
acid and duodenal glucose in cows. J. Dairy Sci. 86:243–253.
Rius, A. G., J. A. D. R. N. Appuhamy, J. Cyriac, D. Kirovski, O. Becvar, J. Escobar, M. L. McGilliard, B. J.
Bequette, R. M. Arkers, and M. D. Hanigan. 2010. Regulation of protein synthesis in
55
mammary glands of lactating dairy cows by starch and amino acids. J. Dairy Sci. 93:3114–
3127.
Robertson, J. B., and P. J. Van Soest. 1981. The detergent system of analysis. Chapter 9, pages 123–
158 in The Analysis of Dietary Fibre in Food. W. P. T. James, and O. Theander, ed. Marcel
Dekker, New York, NY.
Shingfield, K. J., M. Bonnet, and N. D. Scollan. 2013. Recent developments in altering the fatty acid
composition of ruminant-derived foods. Animal 7(Suppl. 1):132–162.
Spanghero, M., and Z. M. Kowalski. 1997. Critical analysis of N balance experiments with lactating
cows. Livest. Prod. Sci. 52:113–122.
Tamminga, S., W. M. Van Straalen, A. P. J. Subnel, R. G. M. Meijer, A. Steg, C. J. G. Wever, and M. C.
Blok. 1994. The Dutch protein evaluation system—The DVE/OEB-system. Livest. Prod. Sci.
40:139–155.
Van Gastelen, S., E. C. Antunes-Fernandes, K. A. Hettinga, G. Klop, S. J. J. Alferink, W. H. Hendriks,
and J. Dijkstra. 2015. Enteric methane production, rumen volatile fatty acid concentrations,
and milk fatty acid composition in lactating Holstein-Friesian cows fed grass silage or corn
silage-based diets. J. Dairy Sci. 98:1915–1927.
Van Lingen, H. J., L. A. Crompton, W. H. Hendriks, C. K. Reynolds, and J. Dijkstra. 2014. Meta-analysis
of relationships between enteric methane yield and milk fatty acid profile in dairy cattle. J.
Dairy Sci. 97:7115–7132.
Van Soest, P. J., J. B. Robertson, and B. A. Lewis. 1991. Methods for dietary fiber, neutral detergent
fiber, and non-starch polysaccharides in relation to animal nutrition. J. Dairy Sci. 74:3583–
3597.
Van Valenberg, H. J., K. A. Hettinga, J. Dijkstra, H. Bovenhuis, and E. J. M. Feskens. 2013.
Concentrations of n-3 and n-6 fatty acids in Dutch bovine milk fat and their contribution to
human dietary intake. J. Dairy Sci. 96:4173–4181.
Van Zijderveld, S. M., W. J. J. Gerrits, J. A. Apajalahti, J. R. Newbold, J. Dijkstra, R. A. Leng, and H. B.
Perdok. 2010. Nitrate and sulfate: Effective alternative hydrogen sinks for mitigation of
ruminal methane production in sheep. J. Dairy Sci. 93:5856–5866.
Van Zijderveld, S. M., W. J. J. Gerrits, J. Dijkstra, J. R. Newbold, R. B. A. Hulshof, and H. B. Perdok.
2011. Persistency of methane mitigation by dietary nitrate supplementation in dairy cows. J.
Dairy Sci. 94:4028–4038.
Vlaeminck, B., V. Fievez, A. R. J. Cabrita, A. J. M. Fonseca, and R. J. Dewhurst. 2006. Factors affecting
odd- and branched-chain fatty acids in milk: A review. Anim. Feed Sci. Technol. 131:389–417.
56
Vlaeminck, B., G. Mengistu, V. Fievez, L. de Jonge, and J. Dijkstra. 2008. Effect of in vitro
docosahexaenoic acid supplementation to marine algae-adapted and unadapted rumen
inoculum on the biohydrogenation of unsaturated fatty acids in freeze dried grass. J. Dairy
Sci. 91:1122–1132.
Williams, C. H., O. Iismaa, and D. J. David. 1962. Determination of chromic oxide in feces samples by
atomic absorption spectrophotometry. J. Agric. Sci. 59:381–385.

57
58

Chapter 3
Using diurnal patterns of 13C enrichment of CO2 to evaluate the
effects of nitrate and docosahexaenoic acid on fiber
degradation in the rumen of lactating dairy cows
G. Klop*, A. Bannink†, K. Dieho*, W.J.J. Gerrits*, J. Dijkstra* * Animal Nutrition Group, Wageningen University, PO Box 338, 6700 AH Wageningen, The
Netherlands † Wageningen UR Livestock Research, PO Box 338, 6700 AH Wageningen, The Netherlands
(Journal of Dairy Science 99:7216–7220)

60
ABSTRACT
Nitrate decreases enteric methane (CH4) production in ruminants, but may also negatively
affect fiber degradation. In this experiment, twenty-eight lactating Holstein dairy cows
were grouped into seven blocks. Within blocks, cows were randomly assigned to 1 of 4
isonitrogenous treatments in a 2 × 2 factorial arrangement: Control (CON); NO3 [21 g of
nitrate/kg dry matter (DM)]; DHA [3 g of docosahexaenoic acid (DHA)/kg of DM]; or
NO3+DHA (21 g of nitrate/kg of DM and 3 g of DHA/kg of DM). Cows were fed a total
mixed ration consisting of 21% grass silage, 49% corn silage and 30% concentrates on a
DM basis. Based on the difference in natural 13C enrichment and neutral detergent fiber
and starch content between grass silage and corn silage, we investigated whether a
negative effect on rumen fiber degradation could be detected by evaluating diurnal
patterns of 13C enrichment of exhaled carbon dioxide. A significant nitrate × DHA
interaction was found for neutral detergent fiber digestibility, which was reduced on the
NO3 treatment to an average of 55%, as compared with 61, 64, and 65% on treatments
CON, DHA and NO3+DHA, respectively. Feeding nitrate, but not DHA, resulted in a
pronounced increase in 13C enrichment of CO2 in the first 3 to 4 h after feeding only.
Results support the hypothesis that effects of a feed additive on the rate of fiber
degradation in the rumen can be detected by evaluating diurnal patterns of 13C
enrichment of CO2. To be able to detect this, the main ration components have to differ
considerably in fiber and nonfiber carbohydrate content as well as in natural 13C
enrichment.
Key words: feed additives, methane, fiber degradation, 13C enrichment

61
SHORT COMMUNICATION
Nitrate is among the relatively few feed additives that have been shown to effectively
mitigate enteric CH4 production in ruminants (reviewed by Hristov et al., 2013). However,
CH4 mitigating additives should not adversely affect animal health and performance or
quality of animal products to be applicable in practice. Methemoglobinemia is a health risk
of feeding nitrate to ruminants, but a gradual introduction of nitrate in the diet alleviates
this risk (Van Zijderveld et al., 2011). A growing body of literature also documents the
effects of nitrate feeding on animal performance. As discussed by Newbold et al. (2014),
nitrate might reduce feed intake and the magnitude of the decrease seems larger on diets
that contain more NDF. At least two factors may be associated with this decrease in feed
intake. First, nitrite, as an intermediate in the reduction of nitrate to ammonia, is toxic for
fibrolytic bacteria in vitro (Marais et al. 1988). Second, nitrate feeding increases hydrogen
production in the rumen (Van Zijderveld et al. 2011; Lund et al. 2014; Guyader et al., 2015),
which may indicate increased aqueous hydrogen concentrations (Guyader et al. 2015).
Increased hydrogen concentration inhibits the regeneration of NAD+ from NADH (Hegarty
and Gerdes, 1999), which may impair metabolism of fibrolytic bacteria. An increased ratio
of NADH to NAD+ will cause a shift from acetate towards propionate formation, partly via
the lactic acid pathway. The latter pathway yields less ATP for the fibrolytic microbes.
Impaired fibrolytic activity increases retention time of fiber in the rumen and therefore
may reduce feed intake.
The effects of nitrate and docosahexaenoic acid (C22:6n-3; DHA) on total enteric CH4
production and milk fatty acid composition in lactating dairy cows in climate respiration
chambers (CRC) were recently reported by Klop et al. (2016). A negative effect of nitrate
on DMI was observed as well as reduced total tract digestibility of fiber on the NO3
treatment. However, no adverse effect of DHA on total tract fiber digestion was observed.
Digestibility of NDF was not reported in other studies in which DHA was supplemented to
dairy cows (Boeckaert et al., 2008; Moate et al., 2013). It was hypothesized that the
between-treatment differences in fiber digestion would cause variation in diurnal pattern
of 13C enrichment of CO2. When nitrate is supplemented to a diet of which the main

62
components differ considerably in starch (or another non-NDF carbohydrate source) and
NDF content as well as in natural 13C enrichment, an adverse effect on fiber degradation
may be detectable from an increased 13C enrichment of exhaled CO2. In comparison with
corn, grass has a lower natural 13C enrichment (Knobbe et al. 2006) and it does not contain
starch. When fed as a TMR, changes in the 13C enrichment of CO2 after a meal hence likely
reflect changes in the degradation rate of starch or fiber by the rumen bacteria. The aim of
this study was to investigate if a negative effect on ruminal fiber degradation upon feeding
nitrate to dairy cattle can be detected by evaluating diurnal patterns of 13C enrichment of
exhaled CO2.
The experimental procedures were approved by the Animal Care and Use Committee of
Wageningen University (Wageningen, The Netherlands). Detailed information regarding
experimental design, diets, feeding, and measurements was reported by Klop et al. (2016).
Briefly, 8 primiparous and 20 multiparous (125 ± 16 DIM at the start of the experimental
period; mean ± SD) lactating Holstein dairy cows were divided over 7 blocks based on
parity, lactation stage, milk production, and presence or absence of a rumen cannula.
Within blocks, cows were randomly assigned to 1 of 4 experimental diets: control (CON;
no nitrate or DHA added and urea as NPN source), nitrate (NO3; 21 g of nitrate/kg of DM),
DHA (DHA; 3 g of DHA/kg of DM and urea as NPN source), or nitrate and DHA (NO3+DHA;
21 g of nitrate/kg of DM and 3 g of DHA/kg of DM). The sources of nitrate and DHA were
Bolifor CNF (Yara, Norway) containing 75% nitrate, and DHAgold (DSM Nutritional
Products, Columbia, MD), a whole cell algae product containing 25.4% DHA, respectively.
Feed additives were included in the concentrates and chromium oxide (Cr2O3; 1.7 g/kg of
DM) was used as external marker to determine apparent total-tract digestibility of
nutrients.
Diets were isonitrogenous, offered as TMR, and consisted of 49% corn silage, 21% grass
silage, and 30% concentrate on a DM basis. Dietary DM, CP, NDF and starch contents were
on average 454, 165, 355 and 240 g/kg of DM, respectively. Due to lameness, 1 of 8 rumen
cannulated cows was replaced by a non-cannulated cow already adapted to the same
experimental diet (NO3).

63
The experimental period lasted 17 d. During the experimental periods, cows were fed
individually with equal portions offered twice daily (at 0600 and 1600h). Until d 9, each
block of cows had free access to feed. Thereafter, DMI within a block was restricted to 95%
of that of the animal with the lowest voluntary DMI between d 5 and 8, while ensuring
that none of the animals in the block was restricted to less than 80% of its voluntary DMI.
Cows were housed in tie stalls until the afternoon of day 13 and in CRC for the remainder
of the experimental period. In the CRC, gaseous exchange (CH4, O2, and CO2) was
measured as described by van Gastelen et al. (2015) and 13CO2 production was determined
as described by Gerrits et al. (2012). Data relate to the last 72 h in the CRC, except for
digestibility values calculated over the complete period the cows were in the CRC. Natural 13C enrichment of the TMR components was determined by means of combustion isotope
ratio MS (Gerrits et al., 2012).
Data were analyzed using PROC MIXED (SAS Inst. Inc., Cary, NC). Two cows (receiving the
CON or NO3 treatment) were excluded from analysis because of a feeding error in the CRC.
Gaseous exchange data, heat production (HP), respiration quotient (RQ), and 13C
enrichment of CO2 were averaged per hour and analyzed using repeated measures ANOVA.
Main and interaction effects of nitrate, DHA, and time were included as fixed effects in the
model. Period (which equals block) was included as random factor in the model and
average values for each hour of the day were treated as repeated measures per cow ×
treatment combination using a first order autoregressive covariance structure. Multiple
comparisons between treatment least squares means for each hour were made using a
SLICE statement in the model. Effects were considered significant if P ≤ 0.05, and trends if
0.05 < P < 0.10.
Cows receiving nitrate consumed less DM and a tendency for a NO3 × DHA interaction was
observed, because the NO3 cows consumed less DM than the NO3+DHA cows. Daily fat-
and protein-corrected milk production was not affected by nitrate, and tended to be
reduced by DHA (Klop et al., 2016). Distinct responses to meals were observed for HP, RQ,
and CH4, and for 13C enrichment of the CO2 produced (Figure 3.1). Both HP and RQ

64
changed over time within day, but no interactions between treatment factors and time
were found. The numerically higher RQ and HP peak values for cows on the CON
treatment shortly after feeding (Figure 3.1B) can be explained by our visual observations
that cows on the CON treatment consumed their meals faster than cows on the other
treatments. In line with Van Zijderveld et al. (2011), the CH4-mitigating effect of nitrate
was largest during the first hours postfeeding (Figure 3.1C). The restricted feeding regimen
imposed during the measurement period and the more rapid degradation of starch
compared with fiber may explain the overall increase in 13C enrichment shortly after
feeding. The shorter interval between morning and afternoon feeding (10 h) as compared
with the interval between afternoon and morning feeding (14 h) may explain the
numerically lower 13C enrichment of CO2 in the morning (Figure 3.1D). Feeding nitrate, but
not DHA, resulted in a pronounced increase in 13C enrichment of CO2 in the first 3 to 4 h
after feeding only, which resulted in a significant nitrate × time interaction.
For cows receiving nitrate, the timing of the increased 13C enrichment of CO2 coincided
with that of a marked decrease in CH4 emission. Based on previous findings (Van
Zijderveld et al. 2011; Lund et al. 2014; Guyader et al., 2015), it is likely that the period of
decreased CH4 production coincided with an increased concentration of aqueous H2 in the
rumen, which may have impaired the functioning of fibrolytic bacteria. However, only
Guyader et al. (2015) measured aqueous H2 in the rumen, whereas Lund et al. (2014) and
Van Zijderveld et al. 2011, measured in vivo H2 emissions. An increase in aqueous H2 is
likely associated with increased H2 emissions (Hegarty and Gerdes, 1999), but it can also
be speculated that supersaturation in the liquid phase may occur, which may give rise to
poor relationships between concentrations of dissolved H2 and gaseous H2..
Neither aqueous H2 concentrations, nor H2 emissions were measured in the present
experiment. Therefore, it cannot be excluded that other mechanisms were involved in the
adverse effect of nitrate on ruminal fiber digestion and CH4 production. As reviewed by
Latham et al. (2016), the reduction intermediate nitrite can be particularly toxic to certain
fibrolytic microbes, as well as to methanogens. Also, a changed intraruminal reduction

65
potential may disturb reactions involved in electron transfer by microorganisms (Latham
et al., 2016).
A nitrate × DHA interaction was found for apparent total-tract digestibility of NDF (P =
0.011; Klop et al., 2016), with NDF digestibility only being reduced on the NO3 treatment
where it averaged 55%, compared with 61, 64, and 65% on treatments CON, DHA and
NO3+DHA, respectively. In line with reduced feed intake resulting from nitrate feeding
(Newbold et al., 2014), based on visual observations, cows on the NO3+DHA treatment
appeared to have a more gradual intake pattern than cows on the NO3 treatment. This
may explain why values for 13C enrichment of CO2 of these cows returned to baseline
values at a later time point than for the NO3 treatment (Figure 3.1D). The more gradual
feed intake pattern may also have resulted in a higher overall NDF degradation in the
rumen of NO3+DHA cows as compared with NO3 cows, because of a longer retention time
of feed. It would also provide an explanation for the numerically smaller decrease in CH4
per kg of DMI observed for cows on the NO3+DHA treatment compared with the NO3
treatment (CH4 production was 1.37, 1.05, 1.40, and 1.13 mol/kg of DMI on treatments
CON, NO3, DHA, and NO3+DHA, respectively; Klop et al., 2016). Total-tract starch
digestibility (> 99%) was not affected by feeding nitrate (Klop et al., 2016).
The significantly lower NDF digestibility, absence of changes in starch digestibility, and the
significantly higher 13C enrichment of CO2 for cows on the NO3 treatment provides a strong
lead that effects of feed additives on fiber degradation in the rumen can be detected by
evaluating diurnal patterns of 13C enrichment of CO2. The difference required to detect
effects depends on accuracy of the measurements, number of measurements and repeats,
frequency of feeding and meal size, and the expected size of the effect. The concept of
evaluating 13C enrichment of CO2 to evaluate dietary effects on fiber degradation in the
rumen might have a broader application potential than the study of effects of feed
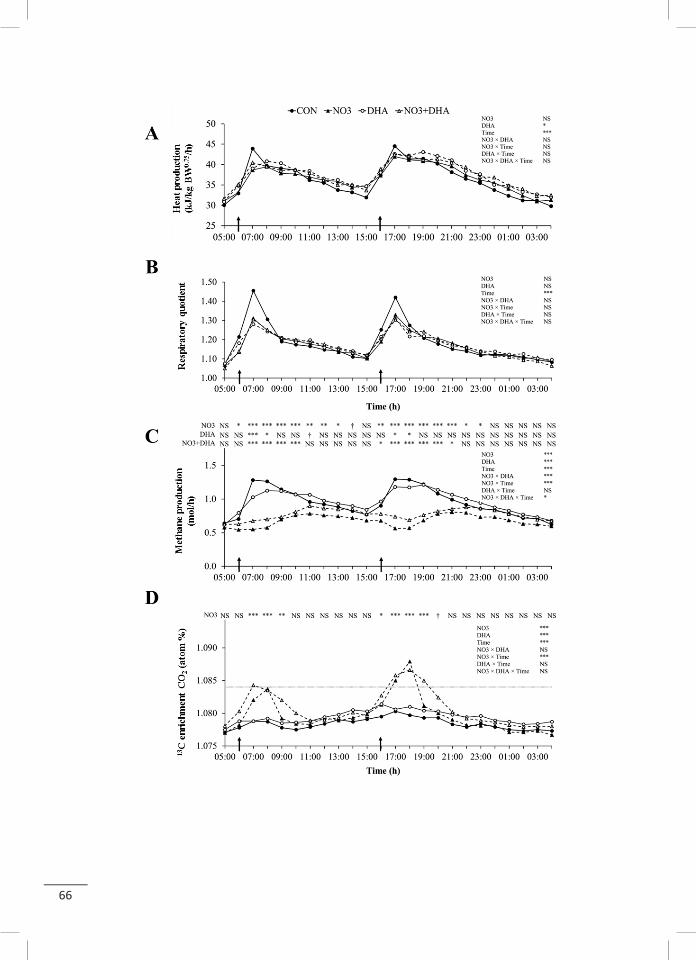
66
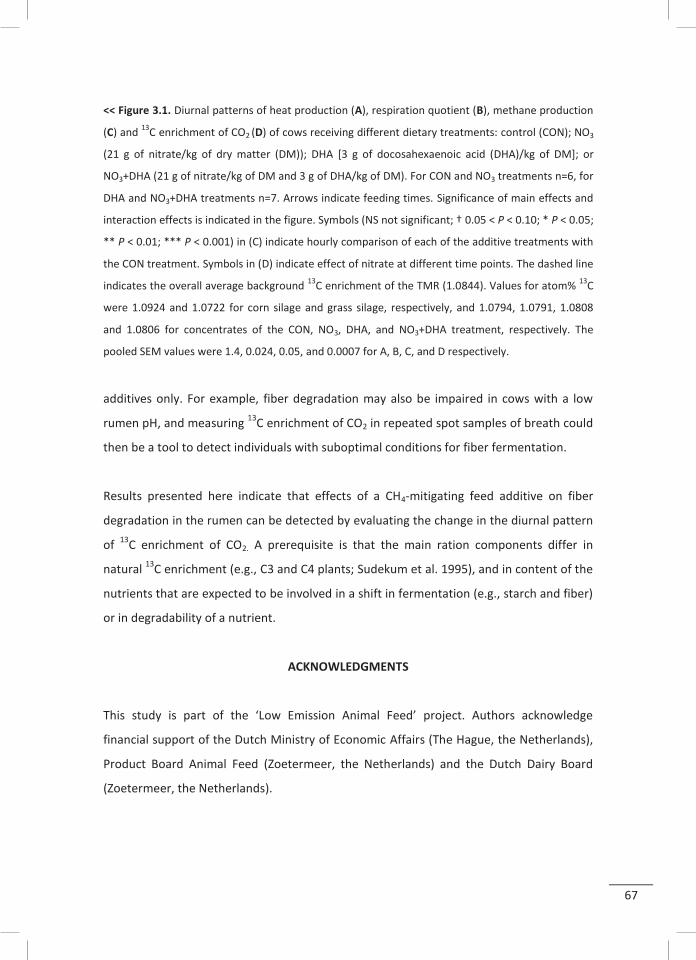
67
<< Figure 3.1. Diurnal patterns of heat production (A), respiration quotient (B), methane production
(C) and 13C enrichment of CO2 (D) of cows receiving different dietary treatments: control (CON); NO3
(21 g of nitrate/kg of dry matter (DM)); DHA [3 g of docosahexaenoic acid (DHA)/kg of DM]; or
NO3+DHA (21 g of nitrate/kg of DM and 3 g of DHA/kg of DM). For CON and NO3 treatments n=6, for
DHA and NO3+DHA treatments n=7. Arrows indicate feeding times. Significance of main effects and
interaction effects is indicated in the figure. Symbols (NS not significant; † 0.05 < P < 0.10; * P < 0.05;
** P < 0.01; *** P < 0.001) in (C) indicate hourly comparison of each of the additive treatments with
the CON treatment. Symbols in (D) indicate effect of nitrate at different time points. The dashed line
indicates the overall average background 13C enrichment of the TMR (1.0844). Values for atom% 13C
were 1.0924 and 1.0722 for corn silage and grass silage, respectively, and 1.0794, 1.0791, 1.0808
and 1.0806 for concentrates of the CON, NO3, DHA, and NO3+DHA treatment, respectively. The
pooled SEM values were 1.4, 0.024, 0.05, and 0.0007 for A, B, C, and D respectively.
additives only. For example, fiber degradation may also be impaired in cows with a low
rumen pH, and measuring 13C enrichment of CO2 in repeated spot samples of breath could
then be a tool to detect individuals with suboptimal conditions for fiber fermentation.
Results presented here indicate that effects of a CH4-mitigating feed additive on fiber
degradation in the rumen can be detected by evaluating the change in the diurnal pattern
of 13C enrichment of CO2. A prerequisite is that the main ration components differ in
natural 13C enrichment (e.g., C3 and C4 plants; Sudekum et al. 1995), and in content of the
nutrients that are expected to be involved in a shift in fermentation (e.g., starch and fiber)
or in degradability of a nutrient.
ACKNOWLEDGMENTS
This study is part of the ‘Low Emission Animal Feed’ project. Authors acknowledge
financial support of the Dutch Ministry of Economic Affairs (The Hague, the Netherlands),
Product Board Animal Feed (Zoetermeer, the Netherlands) and the Dutch Dairy Board
(Zoetermeer, the Netherlands).

68
REFERENCES
Boeckaert, C., V. Fievez, D. Van Hecke, W. Verstraete, and N. Boon. 2007. Changes in rumen
biohydrogenation intermediates and ciliate protozoa diversity after algae supplementation
to dairy cattle. Eur. J. Lipid Sci. Technol. 109:767–777.
Boeckaert, C., B. Vlaeminck, J. Dijkstra, A. Issa-Zacharia, T. Van Nespen, W. Van Straalen, and V.
Fievez. 2008. Effect of dietary starch or micro algae supplementation on rumen fermentation
and milk fatty acid composition of dairy cows. J. Dairy Sci. 91:4714–4727.
Gerrits, W.J.J., M.W. Bosch, and J.J.G.C. van den Borne. 2012. Quantifying resistant starch using
novel, in vivo methodology and the energetic utilization of fermented starch in pigs. J. Nutr.
142: 238–244.
Guyader, J., M. Eugène, B. Meunier, M. Doreau, D. P. Morgavi, M. Silberberg, Y. Rochette, C. Gerard,
C. Loncke, and C. Martin. 2015. Additive methane-mitigating effect between linseed oil and
nitrate fed to cattle. J. Anim. Sci. 93: 3564–3577.
Hegarty , R.S., and R. Gerdes. 1999. Hydrogen production and transfer in the rumen. Recent Adv.
Anim. Nutr. Austr. 12:37–44.
Hristov, A. N., J. Oh, J. Firkins, J. Dijkstra, E. Kebreab, G. Waghorn, A. Adesogan, W. Yang, J. Tricarico,
C. Lee, P. J. Gerber, B. Henderson, and H. P. S. Makkar. 2013. Mitigation of methane and
nitrous oxide emissions from animal operations: I. A review of enteric methane mitigation
options. J. Anim. Sci. 91:5045–5069.
Klop, G., B. Hatew, A. Bannink, and J. Dijkstra. 2016. Feeding nitrate and docosahexaenoic acid
affects enteric methane production and milk fatty acid composition in lactating dairy cows. J.
Dairy Sci. 99: 1161–1172.
Knobbe, K., J. Vogl, W. Pritzkow, U. Panne, H. Fry, H. M. Lochotzke, and A. Preiss-Weigert. 2006. C
and N stable isotope variation in urine and milk of cattle depending on the diet. Anal. Bioanal.
Chem. 386:104–108.
Latham, E.A., R.C. Anderson, W.E. Pinchak, and D.J. Nisbet. 2016. Insight on alterations to the rumen
ecosystem by nitrate and nitrocompounds. Front. Microbiol. 7:228.
Lund, P., R. Dahl, H. J. Yang, A. L. F. Hellwing, B. B. Cao, and M. R. Weisbjerg. 2014. The acute effect
of addition of nitrate on in vitro and in vivo methane emission in dairy cows. Anim. Prod. Sci.
54:1432–1435.
Marais, J. P., J. J. Therion, R. I. Mackie, A. Kistner, and C. Dennison. 1988. Effect of nitrate and its
reduction products on the growth and activity of the rumen microbial population. Br. J. Nutr.
59:301–313.
69
Moate P. J., S. R. O. Williams, M. C. Hannah, R. J. Eckard, M. J. Auldist, B. E. Ribaux, J. L. Jacobs, and
W. J. Wales. 2013. Effects of feeding algal meal high in docosahexaenoic acid on feed intake,
milk production, and methane emissions in dairy cows. J. Dairy Sci. 96:3177–3188.
Newbold, J. R., S. M. Van Zijderveld, R. B. A. Hulshof, W. B. Fokkink, R. A. Leng, P. Terencio, W. J.
Powers, P. S. J. van Adrichem, N. D. Paton, and H. B. Perdok. 2014. The effect of incremental
levels of dietary nitrate on methane emissions in Holstein steers and performance in Nelore
bulls. J. Anim. Sci. 92:5032–5040.
Sudekum, K-H., W. Ziggers, N. Roos, H. Sick, S. Tamminga, and M. Stangassinger. 1995. Estimating

70
the passage of digesta in steers and wethers using the ratio of 13C to 12C and titanium(Iv)-oxide.
Isotopes Env. Health Studies 31:219–227.
Van Gastelen, S., E. C. Antunes-Fernandes, K. A. Hettinga, G. Klop, S. J. J. Alferink, W. H. Hendriks,
and J. Dijkstra. 2015. Enteric methane production, rumen volatile fatty acid concentrations,
and milk fatty acid composition in lactating Holstein-Friesian cows fed grass silage- or corn
silage-based diets. J. Dairy Sci. 98:1915–1927.
Van Zijderveld, S. M., W. J. J. Gerrits, J. Dijkstra, J. R. Newbold, R. B. A. Hulshof, and H. B. Perdok.
2011. Persistency of methane mitigation by dietary nitrate supplementation in dairy cows. J.
Dairy Sci. 94:4028–4038.

Chapter 4
Changes in in vitro gas and methane production from rumen
fluid from dairy cows during adaptation to feed additives in
vivo
G. Klop*, S. van Laar-van Schuppen*, W.F. Pellikaan*, W.H. Hendriks*, A. Bannink† and J. Dijkstra* * Animal Nutrition Group, Wageningen University, PO Box 338, 6700 AH Wageningen, The
Netherlands † Wageningen UR Livestock Research, PO Box 338, 6700 AH Wageningen, The Netherlands
(A revised version is accepted for publication in ANIMAL)
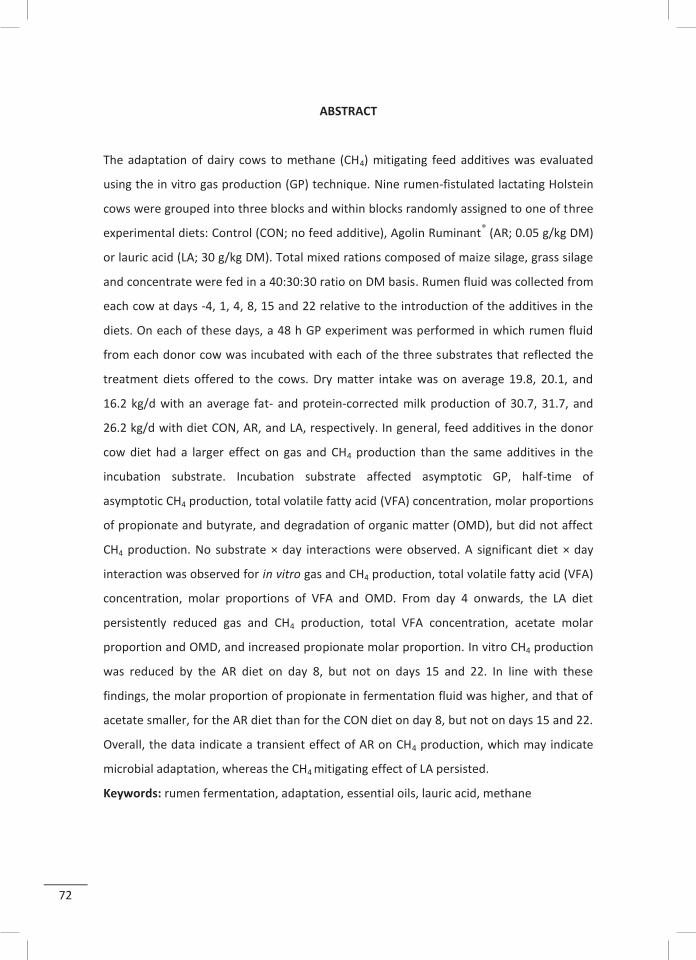
72
ABSTRACT
The adaptation of dairy cows to methane (CH4) mitigating feed additives was evaluated
using the in vitro gas production (GP) technique. Nine rumen-fistulated lactating Holstein
cows were grouped into three blocks and within blocks randomly assigned to one of three
experimental diets: Control (CON; no feed additive), Agolin Ruminant® (AR; 0.05 g/kg DM)
or lauric acid (LA; 30 g/kg DM). Total mixed rations composed of maize silage, grass silage
and concentrate were fed in a 40:30:30 ratio on DM basis. Rumen fluid was collected from
each cow at days -4, 1, 4, 8, 15 and 22 relative to the introduction of the additives in the
diets. On each of these days, a 48 h GP experiment was performed in which rumen fluid
from each donor cow was incubated with each of the three substrates that reflected the
treatment diets offered to the cows. Dry matter intake was on average 19.8, 20.1, and
16.2 kg/d with an average fat- and protein-corrected milk production of 30.7, 31.7, and
26.2 kg/d with diet CON, AR, and LA, respectively. In general, feed additives in the donor
cow diet had a larger effect on gas and CH4 production than the same additives in the
incubation substrate. Incubation substrate affected asymptotic GP, half-time of
asymptotic CH4 production, total volatile fatty acid (VFA) concentration, molar proportions
of propionate and butyrate, and degradation of organic matter (OMD), but did not affect
CH4 production. No substrate × day interactions were observed. A significant diet × day
interaction was observed for in vitro gas and CH4 production, total volatile fatty acid (VFA)
concentration, molar proportions of VFA and OMD. From day 4 onwards, the LA diet
persistently reduced gas and CH4 production, total VFA concentration, acetate molar
proportion and OMD, and increased propionate molar proportion. In vitro CH4 production
was reduced by the AR diet on day 8, but not on days 15 and 22. In line with these
findings, the molar proportion of propionate in fermentation fluid was higher, and that of
acetate smaller, for the AR diet than for the CON diet on day 8, but not on days 15 and 22.
Overall, the data indicate a transient effect of AR on CH4 production, which may indicate
microbial adaptation, whereas the CH4 mitigating effect of LA persisted.
Keywords: rumen fermentation, adaptation, essential oils, lauric acid, methane

73
IMPLICATIONS
In vitro fermentation characteristics and methane production depend on the composition
of the diet fed to donor animal, giving rise to inconsistent effects of additives in vitro. Feed
additives in the donor cow diet had stronger effects on in vitro gas and methane
production than the same additives in the incubation substrate. Over time, the extent of
this effect was affected by the adaptation to a diet with essential oils, but not with lauric
acid. These findings help to better understand adaptation to methane mitigating feeding
strategies.
INTRODUCTION
Several feed additives may mitigate methane (CH4) emissions from ruminants (Hristov et
al. 2013). However, the rumen microbial ecosystem can adapt to feed additives, which
results mostly in a transient decrease of CH4 production only. For example, promising
results on CH4 reduction using essential oils or their active ingredients have been obtained
using in vitro batch cultures, whereas no or only a temporary effect on fermentation
characteristics was found in continuous cultures or in vivo (Benchaar and Greathead,
2011; Van Zijderveld et al., 2011). Cardozo et al. (2004) reported a transient effect of plant
extracts on fermentation characteristics that disappeared after six days. The latter
indicates that microbial adaptation can occur after short term exposure. The response in
CH4 production to plant extracts evaluated in vitro may also vary with composition of the
diet consumed by the donor animals (O’Brien et al., 2014), as diet composition affects the
microbial activity in rumen inoculum.
In broilers, shuttle programmes with two or more anticoccidial compounds, usually with
different modes of action, are widely used to reduce resistance of protozoan parasites
(Chapman 2001). Similarly, the alternating use of two or more CH4 reducing feed additives
with a different mode of action may alleviate the problem of microbial adaptation in the
rumen. If successful, a persistently lower CH4 production could be achieved without the
requisite for a persistent CH4 reduction by a single feed additive. Before testing this
concept in vivo, more information is needed on the duration and persistency of the CH4

74
reducing effect of the selected additives. The present study, therefore, examined the
adaptation of dairy cows to CH4 reducing feed additives that have different modes of
action in vivo, using the in vitro gas production (GP) technique.
MATERIALS AND METHODS
Animals, diets and feeding
All experimental procedures were approved by the Animal Care and Use Committee of
Wageningen University (Wageningen, The Netherlands). Nine rumen cannulated, second
parity cows (105 ± 6.5 DIM; mean ± S.D. at the start of the experiment) were assigned to
three blocks based on milk yield. Within blocks, cows were randomly assigned to one of
three diets: Control (CON; no feed additive), Agolin Ruminant® (Agolin SA, Bière,
Switzerland; AR; 0.05 g/kg DM) or lauric acid (C12:0) (Sigma Aldrich, Zwijndrecht, the
Netherlands; LA; 30 g/kg DM). Agolin Ruminant® contains 0.2 g essential oils/g product
(Castro-Montoya et al., 2015) with eugenol, geranyl acetate and coriander oil being the
main components.
Additives were included in the concentrate meals (Table 4.1). The CON concentrate was
composed of maize (310 g/kg), maize gluten feed (140 g/kg), rapeseed meal (94 g/kg),
soybean meal (90 g/kg), rumen-protected soybean meal (formaldehyde-treated; 86 g/kg),
beet pulp (75 g/kg), palm kernel expeller (70 g/kg), rumen-protected rapeseed meal
(formaldehyde-treated; 57 g/kg), cane molasses (40 g/kg), limestone (13 g/kg), soybean
hulls (10 g/kg), vitamin and mineral premix (8 g/kg), salt (3.6 g/kg), sodium bicarbonate
(2.5 g/kg), and magnesium oxide (1.5 g/kg). Given the low inclusion level of Agolin
Ruminant® the ingredient composition of AR concentrate was the same as of the CON
concentrate. Agolin Ruminant® was first homogenously mixed with other ingredients,
before it was included in the large concentrate mixture. In the LA concentrate, ingredients
were proportionally exchanged against C12:0, except for the minerals and the vitamin and
mineral premix, which were kept at the same level as in the other two concentrates.
Before introduction of the additives in the diets, cows were adapted for a period of 19 d to
a total mixed ration (TMR) that consisted of grass silage, maize silage and CON
concentrate in a 30:40:30 ratio on a DM basis. During the first seven days of this period,

75
animals were housed in a freestall barn. Thereafter, cows were individually housed in tie-
stalls to determine dry matter intake (DMI) of each cow. Feed was supplied in equal
portions at 0600 and 1600 h. A mixture of grass silage and maize silage was prepared
twice weekly and stored in a cooled room (±7°C). The concentrate was weighed separately
into buckets and manually mixed into the roughage mixture at the moment of feeding.
After five days in the tie-stalls, feed supply to each cow was restricted to 95% of voluntary
to minimize the risk of feed refusals during the experiment. For cows assigned to either
the AR or LA diet, the CON concentrate in the TMR was replaced by the respective
treatment concentrate from day 12 in the tie-stalls onwards.
Sampling and analyses of TMR, substrate components and milk
Representative samples of all individual TMR components were collected at the moments
of feed preparation prior to one of the six rumen fluid collection days. The average DMI
per time point was calculated based on the two days prior to rumen fluid collection. Milk
samples of four milkings prior to each rumen fluid collection day were collected from all
cows and analysed for fat, protein and lactose according to Hatew et al. (2015a). Fat and
protein corrected milk yield (FPCM; kg/d) was calculated as (0.337 + 0.116 × fat% + 0.06 ×
protein%) × milk yield (kg/d) (CVB, 2008).
Samples of TMR components, incubation substrate components, and orts were analysed
for chemical composition as described by Klop et al. (2016) except for crude fat analysis,
which was based on NEN-ISO 1735 (ISO, 2004). A modification to the standard procedure
was that samples were hydrolysed with hydrochloric acid at 75°C and subsequently, the
solution containing hydrochloric acid and ethanol was extracted with diethyl ether and
petroleum ether. Solvents were removed by distillation before the mass of the extracted
material was determined.

Tabl
e 4.
1. A
naly
sed,
ave
rage
che
mic
al c
ompo
sitio
n of
mai
ze s
ilage
, gra
ss s
ilage
and
con
cent
rate
s an
d ca
lcul
ated
ave
rage
com
posit
ion
of th
e to
tal m
ixed
ratio
n (T
MR)
for t
he
diffe
rent
die
ts fe
d (g
/kg
DM u
nles
s oth
erw
ise st
ated
)
Roug
hage
s1
Conc
entr
ates
2
TMR
Item
M
aize
sila
ge
Gras
s sila
ge
CO
N
AR
LA
CO
N
AR
LA
Incl
usio
n, %
of D
M
40
30
30
30
30
- -
- DM
, g/k
g 31
4 52
4
890
887
885
46
0 45
9 45
9 Gr
oss e
nerg
y, M
J/kg
DM
18
.7
18.9
18.2
18
.3
20.2
18.6
18
.6
19.2
Cr
ude
ash
39
103
84
87
81
72
73
71
CP
82
212
22
2 23
1 21
0
163
166
159
Crud
e fa
t 35
41
44
45
134
40
40
67
N
DF
359
472
21
3 22
5 20
4
349
353
346
ADF
216
257
10
0 10
6 97
194
195
193
ADL
11
9
19
22
19
13
14
13
St
arch
32
9 N
.A.
26
5 24
6 23
1
211
205
201
Suga
r N
.A.3
68
80
81
75
44
45
43
1 Mai
ze si
lage
: NE L
(MJ/
kg D
M) =
6.9
; DVE
(g/k
g DM
; Tam
min
ga e
t al.
1994
) = 5
2; p
H =
3.8;
am
mon
ia-N
(% to
tal N
) = 7
G
rass
sila
ge: N
E L (M
J/kg
DM
) = 6
.6; D
VE (g
/kg
DM) =
90
; pH
= 5.
8; a
mm
onia
-N (%
tota
l N) =
8
2 Cont
rol (
CON
; no
addi
tive)
, Ago
lin R
umin
ant®
(AR;
0.0
5 g/
kg D
M) o
r lau
ric a
cid
(C12
:0) (
LA, 3
0 g/
kg D
M).
3 N.A
. = n
ot a
naly
zed.

77
Rumen fluid, in vitro gas production equipment and methods of incubation
Rumen fluid from each cow was collected just before morning feeding in pre-warmed
thermos flasks filled with CO2 as described by Hatew et al. (2015a) on days -4, 1, 4, 8, 15
and 22 relative to the introduction of the additives in the diets. Volatile fatty acid (VFA)
concentrations were determined in a subsample of strained rumen fluid from each cow.
The equipment described by Pellikaan et al. (2011) was used to determine in vitro gas and
CH4 production. Rumen fluid from individual cows was used as inoculum and after
straining through cheesecloths, mixed with a pre-warmed, semi-defined incubation
medium (medium B; Lowe et al., 1985 as modified by Williams et al., 2005). Each bottle
contained 84 mL of incubation medium mixed with 5mL of filtrated rumen fluid. Bottles
were directly placed into a shaking water bath (Haake SWB25, Clausthal-Zellerfeld,
Germany) at 39°C, connected to the automated GP system.
The incubation substrates (0.5 g) were a TMR of grass silage, maize silage and one of the
three concentrates at a 30:40:30 ratio on a DM basis. Silages were dried at 60°C and all
components were ground to pass a 1-mm screen before incubation. The three different
substrate components were weighed separately into each bottle and originated from the
same batches that were fed to the animals (Table 4.1). In each of the six runs, 90 bottles
were incubated for 48h. Total GP was continuously measured in triplicate and CH4
concentration was measured in duplicate at 2, 4, 6, 8, 10, 12, 14, 16, 24, 36, and 48 h of
incubation for all inoculum × substrate combinations.
Sampling and analyses of fermentation fluid and gas
Methane was determined using gas chromatography (see Ellis et al., 2016 for details). At
the end of each 48 h incubation, bottles were placed on ice and a subsample (0.6 mL) of
fermentation fluid was mixed with an equal volume of ortho-phosphoric acid, containing
isocaproic acid as internal standard, and stored at -20⁰C pending VFA analysis. The VFA
were separated by gas chromatography using a 30 m × 0.53 mm × 1.0 μm Agilent J&W HP-
FFAP (Santa Clara, USA) column, hydrogen as mobile phase and a flame ionization
detector. The residual incubation substrates were analysed for DM and ash following
Williams et al. (2005) to calculate organic matter degradation (OMD).

78
Calculations and curve fitting
For all analyses, the experimental unit was the average of the replicate bottles for each
inoculum × substrate combination. Triplicates for each inoculum × substrate combination
were visually explored for outliers. In the second run (day 1 after introduction of additives
in the diets), gas data from two out of eight units of the automated GP system had to be
excluded because of a technical problem. For three diet × substrate combinations (CON ×
LA, AR × AR, and AR × LA), the gas and CH4 results of the second run are therefore based
on rumen fluid from two instead of three cows.
Cumulative gas and CH4 production data were fitted with the following monophasic
Michaelis-Menten equation (Groot et al., 1996) using the NLIN procedure in SAS (SAS 9.2,
SAS Inst. Inc., Cary, NC):
G = A / [1 + (C/t)B]
where G (mL/g organic matter (OM)) is the cumulative amount of gas or CH4 produced, A
is the asymptotic G (mL/g OM), B is the switching characteristic of the curve, C is the time
at which half of the asymptotic G has been reached (half-time, h) and t is the time during
the in vitro incubation (h). Measured CH4 concentrations in individual bottles were
expressed relative to the maximum concentration in each bottle and fitted with the
monophasic Michaelis-Menten model, with further details presented by Pellikaan et al.
(2011).
Unlike the model estimated kinetic parameters for gas- and CH4 production, VFA
concentration and OMD are endpoint measurements only. As technical issues with the
recording of gas and CH4 do not affect these parameters, no VFA and OMD data were
excluded.
Statistical analysis
All data were analysed using PROC MIXED (SAS 9.2, SAS Inst. Inc., Cary, NC). Two-day
averages of individual cow data for DMI, milk production and milk composition at each
incubation day (-4, 1, 4, 8, 15 or 22 d relative to the introduction of the additives in the

79
diets) were analysed using a model containing block, diet, day and diet × day interaction
as fixed effects. Repeated measures for each cow × diet combination were accounted for.
Data on gas and CH4 production parameter estimates, VFA and OMD for each cow × diet ×
substrate combination were averaged per incubation day and analysed using repeated
measures ANOVA. Block and the main effects of diet, substrate and day and their
interactions were included as fixed effects. In all statistical analyses, a spatial power
(SP(POW)) covariance structure was fitted, because of unequal time intervals between
incubation days. Denominator degrees of freedom were estimated using the Kenward-
Roger method. In case of significant interaction terms, between-treatment comparisons
for each incubation day were made using a SLICE statement and P-values were corrected
using the Tukey-Kramer method. Results are reported as least squares means. Significance
of effects was declared at P ≤ 0.05 and trends at 0.05 < P ≤ 0.10.
RESULTS AND DISCUSSION
The objective of this study was to examine adaptation to CH4 mitigating feed additives
with different modes of action in vivo using the in vitro GP technique. The selection of
Agolin Ruminant® and C12:0 as feed additives for the present study was based on a pilot
study (data not shown) in which the following substrates were screened for their potential
to reduce CH4 production in vitro: Agolin Ruminant®, C12:0, activated charcoal, L-ascorbic
acid, coconut oil, krabok oil, and myristic acid (C14:0). The additive selection for the pilot
study was based on recent literature (Benchaar and Greathead, 2011; Hansen et al. 2012;
O’Brien et al. 2014; Panyakaew et al. 2013) and unpublished data from our research group.
Dry matter intake and milk yield
Dry matter intake was similar for all treatments on days -4 and 1. From day 4 onwards,
DMI of LA cows was significantly lower than for CON and AR, which resulted in a
significant treatment × day interaction for DMI (Table 4.2). A DMI depression after
supplementation with medium-chain fatty acids (MCFA) is frequently reported in
literature. As discussed by Faciola and Broderick (2014), dosage, delivery method and
characteristics of the basal diet all affect the DMI response to C12:0, and comparison of

80
effect of doses among experiments is, therefore, complicated. In their study, 13 g
C12:0/kg DM did not affect DMI, but did reduce total tract digestibility of NDF. Dohme et
al. (2001) found that MCFA, in particular C10:0 and C12:0, supplemented at 50 g/kg DM,
negatively affected NDF degradation using the rumen simulation technique (RUSITEC). A
treatment × day interaction was also observed for FPCM yield, which declined from day 8
onwards in cows receiving the LA diet. Based on the extent of the observed milk fat
depression, it is likely that not only the lower DMI, but also impaired fibre digestion
contributed to the lower FPCM yield of LA cows.
In vitro gas and CH4 production
The asymptotic GP (mL/g OM incubated) was lower for the LA substrate, but did not differ
between AR and CON substrate (Table 4.3). No substrate × day or substrate × diet
interactions were found (except for a substrate × diet interaction for GP halftime),
indicating that the effect of the LA substrate on GP was largely constant throughout the
experiment and independent of the effect of donor cow diets. The halftime of CH4
production (mL/g OM incubated), but not the asymptotic CH4 production, was affected by
substrate (Table 4.4). The effect of donor cow diet on gas and CH4 production varied after
introduction of an additive in the diet, which resulted in a significant diet × day
interaction. Using rumen fluid at day -4 from cows assigned to the AR diet resulted in a
lower (P = 0.003) gas production compared to cows assigned to the LA diet. This difference
on day -4 was unexpected, because all cows received the same basal diet. However, no
between diet differences were observed on day 1 (less than 24 h after introduction of the
additives in the diets).
From day 4 onwards, the LA diet always resulted in a lower (P ≤ 0.05) gas and CH4
production than the CON or AR diet. The findings of Zhou et al. (2013) using pure ruminal
Methanobrevibacter ruminantium cell suspensions support such a delay in the effect of
C12:0. A significant effect of C12:0 on survival was observed after 3 h, and after 24 h
almost all M. ruminantium cells were dead, which indicates a delay in the effect of C12:0
on cell death. Results of the present study indicate that similar effects may be present in a
mixed culture environment.

81
Table 4.2. Average dry matter intake (DMI), milk production and milk composition of dairy cattle fed the control diet (CON) or a diet with Agolin Ruminant® (AR) or lauric acid (LA) as feed additives Item Diet1 P-value CON AR LA SEM Treatment Day2 Treatment×Day DMI, kg/d 19.8 20.1 16.2 0.45 0.003 <0.001 <0.001 Milk, kg/d 30.0 30.8 28.9 0.94 0.426 <0.001 <0.001 FPCM, kg/d 30.7 31.7 26.2 1.00 0.019 <0.001 <0.001 Fat, g/kg 41.8 42.6 32.5 2.09 0.025 0.716 0.032 Protein, g/kg 34.5 33.0 31.1 1.38 0.333 0.065 0.079 Lactose, g/kg 46.7 45.6 44.2 0.95 0.292 0.013 0.024 FPCM = fat- and protein-corrected milk; SEM = standard error of the mean. 1CON (no additive), Agolin Ruminant® (AR; 0.05 g/kg DM) or lauric acid (C12:0) (LA; 30 g/kg DM). 2Relates to each day an in vitro run was conducted (-4, 1, 8, 15 and 22 days relative to the introduction of the additives in the diets).
Asymptotic gas and CH4 production from rumen fluid of cows on the AR diet differed (P ≤
0.05) from that of cows on the CON diet on day 8 but not on days 15 and 22. The latter
observation may indicate adaptation to effects of AR in the diet. A tendency for a reduced
CH4 production in g/d and g/kg DMI in dairy cows, but not in beef cattle, fed 1.0 g Agolin
Ruminant® per day was reported by Castro Montoya et al. (2015). One of the components
of Agolin Ruminant® is eugenol, a phenolic compound that has antimicrobial effects on
gram-positive and gram-negative bacteria (Calsamiglia et al., 2007). In a dose response
experiment, eugenol did not affect in vivo CH4 production of dairy cattle (Benchaar et al.,
2015). In the latter study, the CH4 measurement period was preceded by an 18-day
adaptation period to the experimental diets. Based on the observations in the present
study, the absence of an effect of eugenol in the experiment of Benchaar et al. (2015) may
be a result of adaptation to the additive. In an in vitro study of Durmic et al. (2013), Agolin
Ruminant® significantly reduced CH4 production (mL/g DM) by almost 30% when added to
rumen fluid from non-adapted sheep at a 10-fold higher dose (0.1 mg/g substrate) than
used in the present experiment. In contrast to such observations, Pirondini et al. (2015)
found no effect of Agolin Ruminant® on in vitro CH4 production using rumen fluid from
non-adapted cows. The dose of Agolin Ruminant® was similar to the dose used in the
present study, but it was dissolved in ethanol before incubation. This was not done in the
present experiment, as this would not mimic in vivo conditions.

82
Effects of additives on gas and CH4 production may appear at initial stages of in vitro
fermentation only, and be absent at the end of the incubation (48-h) (Ellis et al., 2016).
Endpoint in vitro measurements may not reflect substrate degradation and gas and CH4
production in vivo because retention time of feed in the rumen may differ from the end-
point retention time in vitro. Therefore, we examined the in vitro CH4 to total gas ratio
after 12 h incubation for all diet × substrate combinations on all six measurement days
(Figure 4.1). The numerical difference between the CON and AR diet was larger on day 8
than on days 15 and 22, but variation was also large and therefore the difference was not
significant (P = 0.112). Compared to days -4 and 1, the CH4 to total gas ratio with the LA
diet was significantly reduced from day 4 onwards, to almost zero at day 8, and to
increase again on days 15 and 22. The difference in CH4 to total gas ratio between day 8
on the one hand and day 15 or day 22 on the other hand is not significant, indicating that
for the duration of the present trial (22 days) the CH4 reducing effect of C12:0 in the diet
persisted. The higher half-time for CH4 production from the LA diet at day 8 compared
with day 15, but not when compared with day 22, may indicate that the CH4 depressing
effect is not fully persistent.
Results on CH4 production in vitro should be interpreted with care and may not reflect the
in vivo situation (Flachowsky and Lebzien, 2012). The relationship between in vitro and in
vivo CH4 production may also depend on the units of expression of CH4 production. In an
experiment in which rumen inocula was obtained from dairy cattle adapted to the same
experimental diet as incubated in vitro, Hatew et al. (2015b) reported CH4 production in
vitro (mL per g OM incubated) to be moderately related (R2 = 0.54) with in vivo CH4
production (mL per g of estimated rumen-fermentable OM). However, no association was
found when in vivo CH4 production was expressed per unit of ingested OM (R2 = 0.05).
Thus, even inoculum obtained from specifically adapted animals may still lead to large
differences between CH4 production observed in vitro and in vivo.
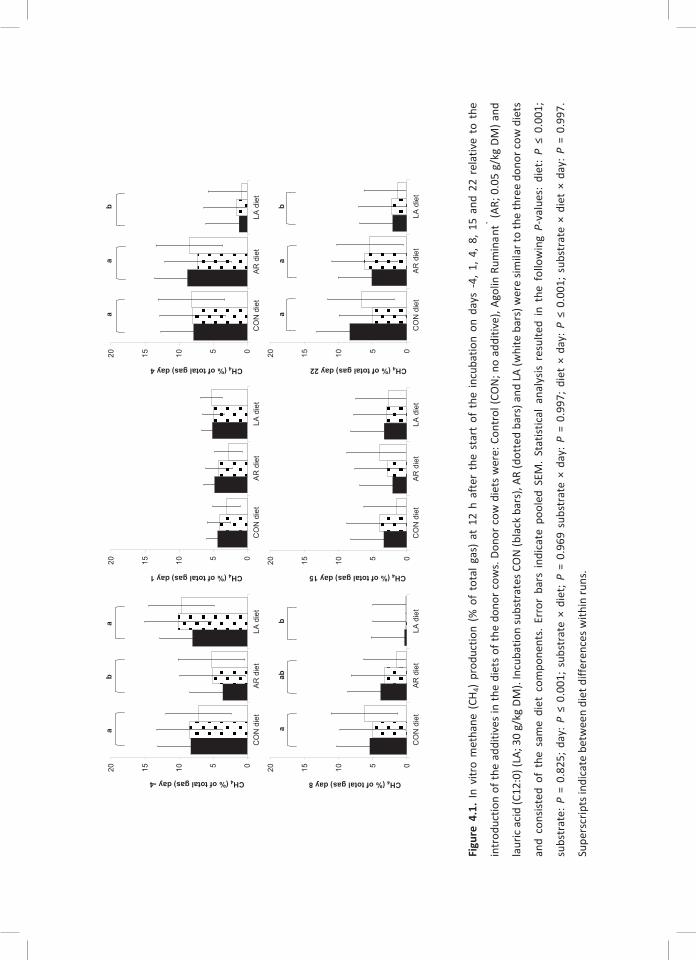
Fi
gure
4.1
. In
vitr
o m
etha
ne (
CH4)
pro
duct
ion
(% o
f to
tal g
as)
at 1
2 h
afte
r th
e st
art
of t
he in
cuba
tion
on d
ays
-4, 1
, 4, 8
, 15
and
22 r
elat
ive
to t
he
intr
oduc
tion
of th
e ad
ditiv
es in
the
diet
s of
the
dono
r cow
s. D
onor
cow
die
ts w
ere:
Con
trol
(CO
N; n
o ad
ditiv
e), A
golin
Rum
inan
t® (AR;
0.0
5 g/
kg D
M) a
nd
laur
ic a
cid
(C12
:0) (
LA; 3
0 g/
kg D
M).
Incu
batio
n su
bstr
ates
CO
N (b
lack
bar
s), A
R (d
otte
d ba
rs) a
nd L
A (w
hite
bar
s) w
ere
simila
r to
the
thre
e do
nor c
ow d
iets
and
cons
isted
of
the
sam
e di
et c
ompo
nent
s. E
rror
bar
s in
dica
te p
oole
d SE
M.
Stat
istic
al a
naly
sis r
esul
ted
in t
he f
ollo
win
g P-
valu
es:
diet
: P
≤ 0.
001;
subs
trat
e: P
= 0
.825
; day
: P ≤
0.0
01; s
ubst
rate
× d
iet;
P =
0.96
9 su
bstr
ate
× da
y: P
= 0
.997
; di
et ×
day
: P
≤ 0.
001;
sub
stra
te ×
die
t ×
day:
P =
0.9
97.
Supe
rscr
ipts
indi
cate
bet
wee
n di
et d
iffer
ence
s with
in ru
ns.
05101520
CO
N d
iet
AR
die
tLA
die
t
CH4(% of total gas) day -4
ab
a
05101520
CO
N d
iet
AR
die
tLA
die
t
CH4(% of total gas) day 1
05101520
CO
N d
iet
AR
die
tLA
die
t
CH4(% of total gas) day 4
05101520
CO
N d
iet
AR
die
tLA
die
t
CH4(% of total gas) day 8
05101520
CO
N d
iet
AR
die
tLA
die
t
CH4(% of total gas) day 15
05101520
CO
N d
iet
AR
die
tLA
die
t
CH4(% of total gas) day 22
aab
b
aa
b
aa
b
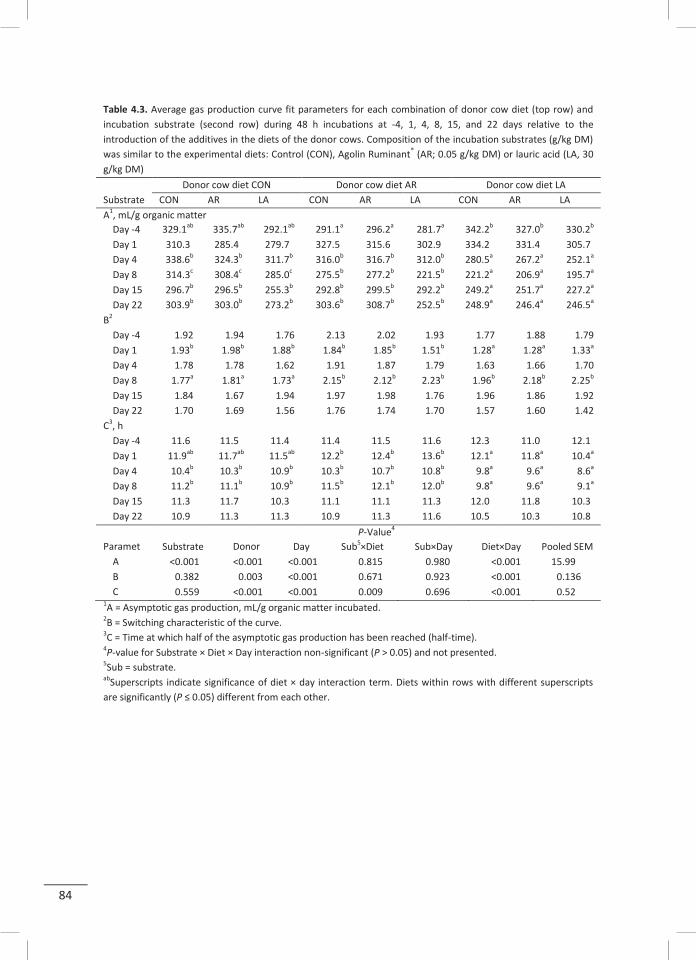
84
Table 4.3. Average gas production curve fit parameters for each combination of donor cow diet (top row) and incubation substrate (second row) during 48 h incubations at -4, 1, 4, 8, 15, and 22 days relative to the introduction of the additives in the diets of the donor cows. Composition of the incubation substrates (g/kg DM) was similar to the experimental diets: Control (CON), Agolin Ruminant® (AR; 0.05 g/kg DM) or lauric acid (LA, 30 g/kg DM) Donor cow diet CON Donor cow diet AR Donor cow diet LA Substrate CON AR LA CON AR LA CON AR LA A1, mL/g organic matter
Day -4 329.1ab 335.7ab 292.1ab 291.1a 296.2a 281.7a 342.2b 327.0b 330.2b Day 1 310.3 285.4 279.7 327.5 315.6 302.9 334.2 331.4 305.7 Day 4 338.6b 324.3b 311.7b 316.0b 316.7b 312.0b 280.5a 267.2a 252.1a Day 8 314.3c 308.4c 285.0c 275.5b 277.2b 221.5b 221.2a 206.9a 195.7a Day 15 296.7b 296.5b 255.3b 292.8b 299.5b 292.2b 249.2a 251.7a 227.2a Day 22 303.9b 303.0b 273.2b 303.6b 308.7b 252.5b 248.9a 246.4a 246.5a
B2 Day -4 1.92 1.94 1.76 2.13 2.02 1.93 1.77 1.88 1.79 Day 1 1.93b 1.98b 1.88b 1.84b 1.85b 1.51b 1.28a 1.28a 1.33a Day 4 1.78 1.78 1.62 1.91 1.87 1.79 1.63 1.66 1.70 Day 8 1.77a 1.81a 1.73a 2.15b 2.12b 2.23b 1.96b 2.18b 2.25b Day 15 1.84 1.67 1.94 1.97 1.98 1.76 1.96 1.86 1.92 Day 22 1.70 1.69 1.56 1.76 1.74 1.70 1.57 1.60 1.42
C3, h Day -4 11.6 11.5 11.4 11.4 11.5 11.6 12.3 11.0 12.1 Day 1 11.9ab 11.7ab 11.5ab 12.2b 12.4b 13.6b 12.1a 11.8a 10.4a Day 4 10.4b 10.3b 10.9b 10.3b 10.7b 10.8b 9.8a 9.6a 8.6a Day 8 11.2b 11.1b 10.9b 11.5b 12.1b 12.0b 9.8a 9.6a 9.1a Day 15 11.3 11.7 10.3 11.1 11.1 11.3 12.0 11.8 10.3 Day 22 10.9 11.3 11.3 10.9 11.3 11.6 10.5 10.3 10.8 P-Value4
Parameter
Substrate Donor diet
Day Sub5×Diet Sub×Day Diet×Day Pooled SEM A <0.001 <0.001 <0.001 0.815 0.980 <0.001 15.99 B 0.382 0.003 <0.001 0.671 0.923 <0.001 0.136 C 0.559 <0.001 <0.001 0.009 0.696 <0.001 0.52
1A = Asymptotic gas production, mL/g organic matter incubated.
2B = Switching characteristic of the curve.
3C = Time at which half of the asymptotic gas production has been reached (half-time).
4P-value for Substrate × Diet × Day interaction non-significant (P > 0.05) and not presented. 5Sub = substrate. abSuperscripts indicate significance of diet × day interaction term. Diets within rows with different superscripts are significantly (P ≤ 0.05) different from each other.

85
Table 4.4. Average gas production curve fit parameters of methane (CH4) production for each combination of donor cow diet (top row) and incubation substrate (second row) during 48 h incubations at -4, 1, 4, 8, 15, and 22 days relative to the introduction of the additives in the diets of the donor cows. Composition of the incubation substrates (g/kg DM) was similar to the experimental diets: Control (CON), Agolin Ruminant® (AR; 0.05 g/kg DM) or lauric acid (LA, 30 g/kg DM)
Donor cow diet CON Donor cow diet AR Donor cow diet LA Substrate CON AR LA CON AR LA CON AR LA
A1, mL/g organic matter Day -4 56.6 53.2 53.7 41.8 46.9 41.9 53.8 55.8 53.3 Day 1 44.5 43.7 44.3 39.9 45.3 42.2 49.7 45.9 39.6 Day 4 47.7b 44.9b 46.1b 48.2b 44.4b 46.1b 25.3a 28.0a 23.5a Day 8 47.1c 46.6c 45.7c 37.3b 34.9b 30.8b 18.8a 14.8a 13.6a Day 15 40.7b 43.0b 28.7b 32.7b 35.8b 40.0b 23.7a 24.8a 22.9a Day 22 50.8b 38.5b 46.6b 40.2b 46.8b 39.9b 23.0a 24.0a 16.3a
B2 Day -4 2.23 2.53 2.63 3.48 2.73 3.08 2.44 2.28 2.40 Day 1 2.95 2.91 2.96 3.27 3.69 3.33 2.36 2.42 2.67 Day 4 2.39 2.46 2.40 2.36 3.12 2.48 3.64 3.35 3.55 Day 8 2.74a 2.67a 2.70a 3.53a 3.55a 4.30a 5.20b 6.87b 5.71b Day 15 2.89 2.74 5.35 3.81 3.36 2.91 3.29 3.23 3.11 Day 22 2.16 3.13 2.76 3.09 2.67 3.14 3.52 3.50 4.27
C3,h Day -4 20.1 17.5 22.2 23.6 22.7 21.6 19.8 16.3 17.3 Day 1 21.5 23.1 25.9 20.2 22.1 26.4 24.7 23.6 20.9 Day 4 16.6a 16.0a 17.0a 16.9a 21.5a 16.8a 24.0b 24.7b 26.7b Day 8 21.0a 22.0a 22.8a 23.7a 22.2a 29.5a 28.4b 29.2b 35.6b Day 15 23.6 22.8 29.9 24.3 24.4 22.2 22.4 23.8 24.2 Day 22 18.6a 22.2a 23.5a 22.7ab 24.7ab 30.7ab 26.7b 26.7b 28.9b P-Value4 Parameter Substrate Donor
diet Day Sub5×Diet Sub×Day Diet×Day Pooled SEM
A 0.347 <0.001 <0.001 0.764 1.000 <0.001 5.87 B 0.565 0.013 <0.001 0.832 0.963 <0.001 0.572 C 0.019 0.002 <0.001 0.878 0.672 <0.001 2.61
1A = Asymptotic gas production.
2B = Switching characteristic of the curve.
3C = Time at which half of the asymptotic gas production has been reached (half-time).
4P-value for Substrate × Diet × Day interaction non-significant (P > 0.05) and not presented. 5Sub = substrate. abSuperscripts indicate significance of diet × day interaction term. Diets within rows, with different superscripts are significantly (P ≤ 0.05) different from each other.

86
Table 4.5. Average concentrations and molar proportions of volatile fatty acids (VFA) in fermentation fluid for each combination of donor cow diet (top row) and incubation substrate (second row) at the end of 48 h incubations at -4, 1, 4, 8, 15, and 22 days relative to the introduction of the additives in the diets of the donor cows. Composition of the incubation substrates (g/kg dry DM) was similar to the experimental diets: Control (CON), Agolin Ruminant® (AR; 0.05 g/kg DM) or lauric acid (LA, 30 g/kg DM) Donor cow diet CON Donor cow diet AR Donor cow diet LA Substrate CON AR LA CON AR LA CON AR LA Total VFA, mmol/L
Day -4 55 55 49 53 48 49 54 56 50 Day 1 53 51 46 54 48 46 49 50 42 Day 4 50b 50b 46b 51ab 47ab 45ab 45a 45a 43a Day 8 53b 50b 48b 49b 51b 43b 43a 41a 37a Day 15 49ab 47ab 40ab 48b 50b 46b 44a 44a 42a Day 22 50b 46b 45b 50b 48b 44b 44a 45a 41a
Acetic acid, % of total VFA Day -4 62.3 62.7 61.2 60.4 62.6 61.7 61.7 62.2 62.9 Day 1 60.6 59.0 59.8 61.0 61.8 59.3 61.9 61.1 63.6 Day 4 61.6b 61.1b 63.6b 61.3b 59.4b 63.5b 58.3a 57.6a 57.8a Day 8 61.7c 60.7c 63.0c 58.6b 57.9b 57.2b 54.6a 53.8a 55.4a Day 15 59.7 b 57.8b 58.2b 57.2b 59.7b 60.9b 55.9a 55.3a 56.0a Day 22 60.1 b 58.6b 61.8b 59.7b 58.7b 59.7b 56.3a 56.3a 57.2a
Propionic acid, % of total VFA Day -4 21.1 21.2 20.9 24.1 22.8 21.3 21.6 20.8 19.1 Day 1 22.3 22.8 19.8 23.1 23.2 21.9 23.0 22.9 20.6 Day 4 21.9a 22.0a 18.9a 21.3a 22.3a 19.0a 25.1 b 25.4b 23.8b Day 8 20.2a 20.1a 16.7a 23.0b 23.7b 20.3b 25.3b 24.8b 22.8b Day 15 22.1a 23.3a 20.4a 22.8a 21.9a 18.6a 25.9b 26.0b 25.6b Day 22 20.8a 21.7a 18.1a 19.8a 19.8a 16.9a 23.9b 24.0b 22.2b
Butyric acid, % of total VFA Day -4 9.0 9.0 10.2 8.3 7.0 9.3 10.0 9.7 10.6 Day 1 10.6b 11.2b 12.8b 8.7a 7.6a 9.6a 8.4a 9.1a 8.2a Day 4 8.0 8.1 9.1 8.6 8.5 8.9 7.6 8.0 8.1 Day 8 11.0 11.8 12.3 9.8 10.0 12.1 10.2 11.3 11.4 Day 15 10.8b 10.9b 12.3b 10.9b 10.2b 11.3b 8.7a 8.8a 9.0a Day 22 10.7b 11.1b 11.7b 11.4b 11.6b 12.8b 8.8a 8.9a 9.2a P-Value1
Parameter Substrate Donor diet
Day Sub2×Diet Sub×Day Diet×Day Pooled SEM Total VFA <0.001 <0.001 <0.001 0.412 0.948 <0.001 1.9 Acetic acid 0.253 <0.001 <0.001 0.900 0.837 <0.001 1.38 Propionic acid
<0.001 <0.001 0.025 0.896 0.997 <0.001 1.38 Butyric acid 0.026 0.005 <0.001 0.579 0.992 <0.001 0.97 1P-value for Substrate × Diet × Day interaction non-significant (P > 0.05) and not presented. 2Sub = substrate. abSuperscripts indicate significance of diet × day interaction term. Diets within rows, with different superscripts are significantly (P ≤ 0.05) different from each other.

Tabl
e 4.
6. O
rgan
ic m
atte
r deg
rada
bilit
y (O
MD;
g/k
g O
M in
cuba
ted)
for e
ach
com
bina
tion
of d
onor
cow
die
t (to
p ro
w) a
nd in
cuba
tion
subs
trat
e (s
econ
d ro
w) a
t the
end
of 4
8 h
incu
batio
ns a
t -4,
1, 4
, 8, 1
5 , a
nd 2
2 da
ys re
lativ
e to
the
intr
oduc
tion
of th
e ad
ditiv
es in
the
diet
s of
the
dono
r cow
s. C
ompo
sitio
n of
the
incu
batio
n su
bstr
ates
(g/k
g DM
) w
as si
mila
r to
the
expe
rimen
tal d
iets
: Con
trol
(CO
N),
Agol
in R
umin
ant® (A
R; 0
.05
g/kg
DM
) or l
auric
aci
d (L
A, 3
0 g/
kg D
M)
Do
nor c
ow d
iet C
ON
Do
nor c
ow d
iet A
R Do
nor c
ow d
iet L
A Su
bstr
ate
CON
AR
LA
CO
N
AR
LA
CON
AR
LA
O
MD
Day
-4
844c
845c
760a
843c
823bc
78
2ab
835c
845c
786ab
Da
y 1
837b
841b
771a
839b
823b
767a
842b
817b
739a
Day
4 83
7d 84
3d 78
3bc
836d
824cd
77
4b 77
5b 80
8bcd
731a
Day
8 82
9d 81
6cd
775bc
83
8d 83
6d 76
5b 80
9cd
798bc
d 71
8a Da
y 15
82
5cd
831cd
74
1a 83
1cd
834d
779ab
79
1bc
792bc
d 74
6a Da
y 22
83
2d 82
1cd
763ab
83
2d 82
8cd
769ab
79
4bcd
788ab
c 74
8a
P-Va
lue
Para
met
er
Subs
trat
e Do
nor d
iet
Day
Sub1 ×D
iet
Sub×
Day
Diet
×Day
S×
D×D2
Pool
ed S
EM
OM
D <0
.001
<0
.001
<0
.001
0.
330
0.64
4 <0
.001
0.
043
9.5
1 Sub
= su
bstr
ate.
2 S×
D×D =
Subs
trat
e ×
Diet
× D
ay
abSu
pers
crip
ts in
dica
te si
gnifi
canc
e of
subs
trat
e ×
diet
× d
ay in
tera
ctio
n te
rm. d
iet ×
subs
trat
e co
mbi
natio
ns w
ithin
row
s, w
ith d
iffer
ent s
uper
scrip
ts a
re si
gnifi
cant
ly (P
≤ 0
.05)
di
ffere
nt fr
om e
ach
othe
r.

88
Volatile fatty acids
Overall, significant diet × day interactions indicate that the LA diet reduced VFA
concentrations and relative molar proportions of acetate and butyrate in fermentation
fluid, and increased molar proportions of propionate, for all three substrates from day 4
onwards (Table 4.5). Such changes in VFA molar proportions correspond to an observed
reduction in CH4 production. Reductions in VFA concentration and acetate molar
proportion following C12:0 supplementation have been reported previously (Faciola and
Broderick, 2014; Hristov et al. 2011). Similar effects were observed for filtrated rumen
fluid before incubation after introduction of C12:0 into the diet of the cows (data not
shown). Only 5 mL of rumen fluid was added to 84 mL buffer solution, and thus this
similarity in results may indicate that the microbial composition of the rumen fluid was
affected by the donor cow diets.
Compared with the CON diet, the acetate and propionate molar proportions for the AR
diet were significantly lower and higher, respectively, on day 8 only, whereas total VFA
concentration in fermentation fluid was not different. This shift in relative proportions of
VFA is in line with the results for CH4 production on this day. Similar to the absence of
differences in CH4 production between the CON diet and the AR diet at days 15 and 22,
the relative proportions of acetate and propionate also did not differ between AR and
CON at days 15 and 22. Benchaar et al. (2015) and Pirondini et al. (2015) found no
treatment effect of eugenol or Agolin Ruminant® on total VFA concentrations or
acetate:propionate ratio, which is in line with the absence of a CH4 reduction in their
studies.
In vitro organic matter degradability
The OMD results (Table 4.6) generally support the data of the in vitro gas and CH4
production and VFA concentration for the various diet × substrate combinations. A
significant substrate × diet × day interaction was observed. The OMD results for the CON
and AR diet were not different and consistent over time, whereas OMD was reduced by
both the LA diet (from day 4 onwards) and the LA substrate (all days). The latter is in line
with earlier findings in vitro (Dohme et al., 2001) and in vivo (Faciola et al., 2014).

89
CONCLUSIONS
Feed additives in the donor cow diet have a stronger effect on in vitro gas and CH4
production than the same additives in the incubation substrate. The LA diet persistently
reduced in vitro gas and CH4 production from day 4 onwards, but also decreased DMI and
FPCM production of the donor cows. No negative effects on DMI and FPCM production
were observed in cows receiving the AR diet. In vitro gas and CH4 production was reduced
by the AR diet on day 8, but not on days 15 and 22, which may indicate a transient effect
of AR on CH4 production and adaptation of the rumen microbial ecosystem to AR.
ACKNOWLEDGEMENTS
Staff of the experimental facilities “Carus” (Wageningen, The Netherlands) and laboratory
staff of Wageningen UR Animal Nutrition Group are gratefully acknowledged for their
assistance during the implementation of the experiment. This study is part of the Low
Emission Animal Feed project. Authors acknowledge financial support of the Dutch
Ministry of Economic Affairs (The Hague, the Netherlands), the Product Board Animal
Feed (Zoetermeer, the Netherlands) and the Dutch Dairy Board (Zoetermeer, the
Netherlands).
REFERENCES
Benchaar, C., and H. Greathead. 2011. Essential oils and opportunities to mitigate enteric methane
emissions from ruminants. Anim. Feed Sci. Technol. 166-167:338–355.
Benchaar, C., F. Hassanat, and H. V. Petit. 2015. Dose-response to eugenol supplementation to dairy
cow diets: Methane production, N excretion, ruminal fermentation, nutrient digestibility,
milk production, and milk fatty acid profile. Anim. Feed Sci. Technol. 209:51-59.
Calsamiglia, S., M. Busquet, P. W. Cardozo, L. Castillejos, and A. Ferret. 2007. Invited Review:
Essential oils as modifiers of rumen microbial fermentation. J. Dairy Sci. 90:2580-2595.
Castro-Montoya, J., N. Peiren, J. W. Cone, B. Zweifel, V. Fievez, and S. De Campeneere. 2015. In vivo
and in vitro effects of a blend of essential oils on rumen methane mitigation. Livest. Sci.
180:134-142.

90
Cardozo, P. W., S. Calsamiglia, A. Ferret, and C. Kamel. 2004. Effects of natural plant extracts on
ruminal protein degradation and fermentation profiles in continuous culture. J. Anim. Sci.
82:3230-3236.
Chapman, H. D. 2001. Use of anticoccidial drugs in broiler chickens in the USA: Analysis for the years
1995 to 1999. Poultry Sci. 80:572-580.
CVB, 2008. CVB Table booklet feeding of ruminants. CVB series no. 43. Centraal Veevoederbureau,
Lelystad, the Netherlands.
Dohme, F., A. Machmüller, A. Wasserfallen, and M. Kreuzer. 2001. Ruminal methanogenesis as
influenced by individual fatty acids supplemented to complete ruminant diets. Lett. Appl.
Microbiol. 32:47-51.
Durmic, Z., P. J. Moate, R. Eckard, D. K. Revell, R. Williams, and P. E. Vercoe. 2013. In vitro screening
of selected feed additives, plant essential oils and plant extracts for rumen methane
mitigation. J. Sci. Food Agric. 94: 1191-1196.
Ellis, J. L., A. Bannink, I. K. Hindrichsen, R. D. Kinley, W. F. Pellikaan, N. Milora, and J. Dijkstra. 2016.
The effect of lactic acid bacteria included as a probiotic or silage inoculant on in vitro rumen
digestibility, total gas and methane production. Anim. Feed Sci. Technol. 211:61-74
Faciola, A. P., and G.A. Broderick. 2014. Effects of feeding lauric acid or coconut oil on ruminal
protozoa numbers, fermentation pattern, digestion, omasal nutrient flow, and milk
production in dairy cows. J. Dairy Sci. 97:5088-5100.
Flachowsky, G., and P. Lebzien. 2012. Effects of phytogenic substances on rumen fermentation and
methane emissions: A proposal for a research process. Anim. Feed Sci. Technol. 176:70-77.
Groot, J. C. J., J. W. Cone, B. A. Williams, F. M. A. Debersaques, and E. A. Lantinga. 1996. Multiphasic
analysis of gas production kinetics for in vitro fermentation of ruminant feeds. Anim. Feed
Sci. Technol. 64:77-89.
Hatew, B., S. C. Podesta, H. van Laar, W. F. Pellikaan, J. L. Ellis, J. Dijkstra, and A. Bannink. 2015a.
Effects of dietary starch content and rate of fermentation on methane production in
lactating dairy cows. J. Dairy Sci. 98:486-499.
Hatew, B., J. W. Cone, W. F. Pellikaan, S. C. Podesta, A. Bannink, W. H. Hendriks, and J. Dijkstra.
2015b. Relationship between in vitro and in vivo methane production measured
simultaneously with different dietary starch sources and starch levels in dairy cattle. Anim.
Feed Sci. Technol. 202:20-31.
Hansen, H. H., I. M. L. D. Storm, and A. M. Sell. 2012. Effect of biochar on in vitro rumen methane
production. Act. Agric. Scan. A – Anim. Sci. 62:305-309.
91
Hristov, A. N., J. Oh, J. Firkins, J. Dijkstra, E. Kebreab, G. Waghorn, A. Adesogan, W. Yang, J. Tricarico,
C. Lee, P. J. Gerber, B. Henderson, and H. P. S. Makkar. 2013. Mitigation of methane and
nitrous oxide emissions from animal operations: I. A review of enteric methane mitigation
options. J. Anim. Sci. 91:5045-5069.
Hristov, A. N., C. Lee, T. Cassidy, M. Long, K. Heyler, B. Corl, and R. Forster. 2011. Effects of lauric and
myristic acids on ruminal fermentation, production, and milk fatty acid composition in
lactating dairy cows. J. Dairy Sci. 94:382-395.
ISO. 2004. NEN-EN-ISO 1735:2004 Cheese and processed cheese products - Determination of fat
content – Gravimetric method (reference method). International Standards Organization.
Geneva. Switzerland.
Klop, G., B. Hatew, A. Bannink, and J. Dijkstra. 2016. Feeding nitrate and docosahexaenoic acid
affects enteric methane production and milk fatty acid composition in lactating dairy cows. J.
Dairy Sci. 99: 1161–1172.
Lowe, S., M. K. Theodorou, A. P. J. Trinci, and R. B. Hespell. 1985. Growth of anaerobic rumen fungi
on defined and semi-defined media lacking rumen fluid. J. Gen. Microbiol. 131:2225-2229.
O’Brien, M., A. Navarro-Villa, P. J. Purcell, T. M. Boland, and P. O’Kiely. 2014. Reducing in vitro rumen
methanogenesis for two contrasting diets using a series of inclusion rates of different
additives. Anim. Prod. Sci. 54:141-157.
Panyakaew, P., G. Goel, M. Lourenço, C. Yuangklang, and V. Fievez. 2013. Medium-chain fatty acids
from coconut or krabok oil inhibit in vitro rumen methanogenesis and conversion of non-
conjugated dienoic biohydrogenation intermediates. Anim. Feed Sci. Technol. 180:18-25.
Pellikaan, W. F., W. H. Hendriks, G. Uwimana, L. J. G. M. Bongers, P. M. Becker, and J. W. Cone. 2011.
A novel method to determine simultaneously methane production during in vitro gas
production using fully automated equipment. Anim. Feed Sci. Technol. 168:196-205.
Pirondini, M., S. Colombini, L. Malagutti, L. Rapetti, G. Galassi, R. Zanchi, and G. M. Crovetto. 2015.
Effects of a selection of additives on in vitro ruminal methanogenesis and in situ and in vivo
NDF digestibility. Anim. Sci. J. 86:59-68.
Tamminga, S., W. M. Van Straalen, A. P. J. Subnel, R. G. M. Meijer, A. Steg, C. J. G. Wever, and M. C.
Blok. 1994. The Dutch protein evaluation system—The DVE/OEB-system. Livest. Prod. Sci.
40:139-155.
Van Zijderveld, S. M., J. Dijkstra, H. B. Perdok, J. R. Newbold, and W. J. J. Gerrits. 2011. Dietary
inclusion of diallyl disulfide, yucca powder, calcium fumarate, an extruded linseed product,
or medium-chain fatty acids does not affect methane production in lactating dairy cows. J.
Dairy Sci. 94:3094-3104.
92
Williams, B. A. , M. W. Bosch, H. Boer, M. W. A. Verstegen, and S. Tamminga. 2005. An in vitro batch
culture method to assess potential fermentability of feed ingredients for monogastric diets.
Anim. Feed Sci. Technol. 123-124:445-462.
Zhou, X., L. Meile, M. Kreuzer, and J. O. Zeitz. 2013. The effect of saturated fatty acids on
methanogenesis and cell viability of Methanobrevibacter ruminantium. Archaea
2013:106916.

93

94
Chapter 5
Effects of continuous feeding of essential oils or rotational
feeding of essential oils and lauric acid on enteric methane
production in lactating dairy cows
G. Klop*, A. Bannink†, K. Dieho*, W.H. Hendriks*, J. Dijkstra* * Animal Nutrition Group, Wageningen University, PO Box 338, 6700 AH Wageningen, The
Netherlands † Wageningen UR Livestock Research, PO Box 338, 6700 AH Wageningen, The Netherlands
(to be submitted to Journal of Dairy Science)
96
ABSTRACT
The rumen microbes can adapt to feed additives, which may make the decrease in enteric
CH4 production upon feeding an additive a transient response only. This study investigated
alternate feeding of two CH4 mitigating feed additives with a different mode of action on
persistency of lowering CH4 production compared to feeding a single additive over a
period of 10 weeks. Four pairs of cows were selected, and within pairs, cows were
randomly assigned to either the control (AR-AR) or the alternating (AR-LA) concentrate
treatment. The AR concentrate contained a blend of essential oils (Agolin Ruminant®; 0.17
g/kg of DM) and the LA concentrate contained lauric acid (C12:0; 20 g/kg of DM). A basal
concentrate without Agolin Ruminant® and lauric acid was fed during the pre-treatment
period (2 weeks). Thereafter, the cows assigned to AR-AR treatment received the AR
concentrate during all 10 treatment weeks (5 periods of twee weeks each), whereas cows
assigned to the AR-LA treatment received AR and LA concentrates rotated on a weekly
basis. Methane emission was measured in climate respiration chambers during periods 1,
3 and 5. From period 3 onwards, DMI and milk protein concentration were reduced in the
AR-LA treatment. Milk fat concentration was not affected, but the proportion of C12:0 in
milk fat increased upon feeding C12:0. Molar proportions of acetate and propionate in
rumen fluid were lower and higher, respectively, in the AR-LA than in the AR-AR treatment.
Methane yield (g/kg of DMI) and intensity (g/kg FPCM) were not affected by treatment.
Methane yield and intensity were significantly lower (12 and 11%, respectively) in period 1
compared with the pre-treatment period, but no significant difference relative to pre-
treatment period was observed in period 3 (numerically 9 and 7% lower, respectively) and
in period 5 (numerically 8 and 4% lower, respectively). Results indicate a transient
decrease in CH4 yield and intensity in time, but no improvement in extent or persistency of
CH4 reduction due to rotational feeding of essential oils and C12:0 in lactating dairy cows.
Key words: methane, lauric acid, essential oils, dairy cow

97
INTRODUCTION
The mitigating effect of feed additives supplemented to dairy cow diets on enteric CH4
emission may be a transient effect if rumen microbes adapt to these additives. Guan et al.
(2006) compared the effect of feeding a single ionophore (monensin) with feeding a
rotation of ionophores (monensin and lasalocid) on enteric CH4 production in Angus steers.
Both the size and duration of the decrease in CH4 production were not different between
the two ionophore treatments, and the mitigating effect disappeared after several weeks.
The absence of an effect is probably a result of the similar mode of action of both
ionophores, which may be overcome if several additives with different mode of action are
rotated.
In agronomy, herbicide rotations are applied as tactic to prevent or delay herbicide
resistance of weeds (Beckie, 2006). In broilers, shuttle programmes with two or more
anticoccidial compounds, usually with different modes of action, are widely used to
reduce resistance of these protozoa (Chapman, 2001). Yáñez-Ruiz et al. (2016) reviewed
the use of in vitro batch culture technique to assess enteric CH4 production, and
recommended use of inoculum from animals that have been adapted to treatment for at
least 2 weeks. In Chapter 4, the adaptation of dairy cows to feed additives with different
modes of action in vivo [viz. lauric acid (C12:0) and Agolin Ruminant® (commercial blend of
essential oils, with eugenol, geranyl acetate and coriander oil being the main components)]
was evaluated using the in vitro gas production technique. Results indicated a transient
effect of the essential oil blend on in vitro CH4 production, with CH4 production being
lowered after 8 d of feeding the additive to the donor cows, whereas after 15 and 22 d, in
vitro CH4 production did not differ anymore from the control treatment. In contrast, a
persistent mitigating effect on in vitro CH4 production was observed when donor cows
were fed lauric acid.
Based on these findings, it was hypothesized that continuous feeding of AR would result in
a transient decrease of CH4 emission, whereas weekly rotation of AR and C12:0 would
result in a persistent CH4 decline. Therefore, the aim of the present study was to compare
98
the extent and duration of changes in CH4 emission and in performance of dairy cows
receiving either AR only or AR and C12:0 using a weekly rotation schedule.
MATERIALS AND METHODS
Experimental design, animals and housing
All experimental procedures were approved by the Animal Care and Use Committee of
Wageningen University (Wageningen, The Netherlands). Four pairs of cows (4 primiparous
and 4 multiparous; 139 ± 38 DIM at the start of the experimental period; mean ± SD), of
which 4 cows were fitted with a permanent rumen cannula (10 cm i.d., Type 1C, Bar
Diamond Inc., Parma, ID) were included in the experiment. Cows were paired based on
parity, lactation stage, milk production and presence or absence of a rumen fistula. Within
pairs, cows were randomly assigned to either the control (AR-AR) or the alternating (AR-
LA) concentrate treatment with a total treatment length of 10 wk (5 periods of 2 wks
each). The treatments were preceded by an 11-d pre-treatment period. In the pre-
treatment period, cows were housed in tie-stalls and fed the basal diet without
experimental feed additives. Thereafter, cows were individually housed in climate
respiration chambers (CRC) for a period of 2.5 d to measure CH4 emissions on the basal
diet. Four individual CRC were available at the same time and therefore a staggered
approach was taken with the first 2 pairs of cows (block A) starting 3 d earlier with the
pre-treatment period than the second 2 pairs of cows (block B). After the initial CH4
measurement in the CRC, block A cows returned to the tie-stalls and were fed the basal
ration without additives for another 17 d. During these 17 d, block B cows were housed in
CRC for their initial 2.5-d CH4 measurements, where after they started a treatment
schedule of 2 wks in the CRC (period 1, period 3, period 5) with intermediate 2 wk tie-stall
periods (period 2, period 4). In the 2 wk period that the block A cows were housed in the
tie-stalls, the cows of block B were housed in the CRC with a similar treatment schedule.
For each two-week CRC period, cows entered the CRC at 1500 h and left around 0900 h on
d 15. Days 2-7 and 9-14 were used to collect CH4 data. The CRC were cleaned in the
mornings of d 1 (before entrance of the cows) and d 8. Rotation (AR to LA or vice versa)
occurred in the mornings of d 2 and d 9.

99
A detailed description of the CRC design and gas measurements was reported by van
Gastelen et al. (2015). Briefly, in each CRC (volume 35 m3) relative humidity was
maintained at 70% and temperature at 16°C, and the ventilation rate in each
compartment was 42 m3/h. Inlet and exhaust air of each compartment was sampled at 10-
min intervals. Gas concentrations and ventilation rates were corrected for pressure,
temperature and humidity to arrive at standard temperature pressure dew point volumes
of inlet and exhaust air. Immediately prior to the experiment, compartments were
checked by releasing known amounts of CO2 in each compartment and the recovery
calculated. The recovered amounts of CO2 were between 98 and 100%. Cows were
exposed to 16 h of light per day.
Table 5.1. Ingredient composition (g/kg of DM) of the pre-treatment concentrate (Basal) and the treatment concentrates that contained either Agolin Ruminant® (AR) or lauric acid (LA) as feed additive. Concentrates Ingredient Basal AR LA Corn 305 305 285 Corn gluten feed 143 143 133 Soybean meal 99 99 93 Rapeseed meal 93 93 87 Formaldehyde treated soybean meal 85 85 79 Sugar beet pulp 78 78 73 Palm kernel expeller 73 73 68 Formaldehyde treated rapeseed meal 57 57 53 Sugar cane molasses 34 34 32 CaCO3 14 14 14 Trace mineral and vitamin premix 9 9 9 NaCl 4 4 4 NaHCO3 2.8 2.8 2.8 MgO 1.7 1.7 1.7 Cr2O3 1.7 1.7 1.7 Agolin Ruminant® - 0.17 - Lauric acid (C12:0) - - 65

Tabl
e 5.
2. A
vera
ge a
naly
zed
chem
ical
com
posit
ion
of T
MR
ingr
edie
nts
(cor
n sil
age,
gra
ss s
ilage
, pre
-tre
atm
ent
conc
entr
ate
(Bas
al)
and
the
trea
tmen
t co
ncen
trat
es t
hat
cont
aine
d ei
ther
Ago
lin R
umin
ant®
(AR)
or l
auric
aci
d (L
A) a
s fee
d ad
ditiv
e) a
nd th
e ca
lcul
ated
com
posit
ion
of th
e co
mpl
ete
TMR
(g/k
g of
DM
, unl
ess s
tate
d ot
herw
ise).
Roug
hage
s Co
ncen
trat
es
TMR
Item
Co
rn si
lage
2 Gr
ass s
ilage
3 Ba
sal
AR
LA
Basa
l AR
LA
In
clus
ion,
% o
f DM
40
30
30
30
30
-
- -
DM, g
/kg
309
354
878
879
876
403
403
403
Gros
s ene
rgy,
MJ/
kg o
f DM
18
.7
19.0
18
.2
18.3
19
.7
18.6
18
.7
19.1
Cr
ude
ash
39
100
88
89
86
72
72
71
CP
89
186
221
227
215
158
160
156
Crud
e fa
t 37
43
40
43
96
40
41
57
N
DF
383
459
245
249
231
364
366
360
ADF
223
277
116
120
111
207
208
206
ADL
13
9 27
29
26
16
17
16
St
arch
32
3 N
.A.1
247
238
229
203
201
198
Suga
r N
.A.
54
78
80
76
40
40
39
1 N
.A. =
not
ana
lyze
d.
2 NE L
, net
ene
rgy
for l
acta
tion,
6.9
MJ/
kg o
f DM
; DVE
, int
estin
al d
iges
tible
pro
tein
, 54
g/kg
of D
M; O
EB, r
umen
-deg
rade
d pr
otei
n ba
lanc
e, -3
8 g/
kg o
f DM
(val
ues b
ased
on
near
-infr
ared
spec
trom
etry
; Blg
g Ag
roXp
ertu
s, W
agen
inge
n, th
e N
ethe
rland
s).
3 NE L
, net
ene
rgy
for l
acta
tion,
6.6
MJ/
kg o
f DM
; DVE
, int
estin
al d
iges
tible
pro
tein
, 58
g/kg
of D
M; O
EB, r
umen
-deg
rade
d pr
otei
n ba
lanc
e, 6
9 g/
kg o
f DM
(val
ues b
ased
on
near
-in
frar
ed sp
ectr
omet
ry; B
lgg
Agro
Xper
tus,
Wag
enin
gen,
the
Net
herla
nds)
.

101
Diets and feeding
A TMR with basal concentrate was fed during the pre-treatment period. For the AR-AR
treatment, the TMR with AR concentrate was fed during all 10 treatment wks, whereas for
the AR-LA treatment AR and LA concentrates were rotated on a weekly basis (AR in wk 1
of each period, LA in wk 2 of each period). The AR concentrate contained Agolin
Ruminant® (0.17 g/kg of DM) and the LA concentrate contained lauric acid (C12:0; 20 g/kg
of DM) (Table 5.1). During the experimental period in the tie-stalls and CRC, animals were
fed twice daily (at 0600 and 1600 h). All cows received their experimental diet as a total
mixed ration (TMR), composed of 40% corn silage, 30% grass silage, and 30% concentrate
on a DM basis (Table 5.2). Portions of the grass silage and corn silage mixture were
weighed in crates twice weekly and stored at 6°C. Concentrates were weighed separately
for each cow and these were manually mixed with the roughage at the time of feeding.
The external marker Cr2O3 (1.7 g/kg of DM) was added to the compound feed (Research
Diet Services, Wijk bij Duurstede, the Netherlands) for estimation of apparent total-tract
digestibility (ATTD). During the first 8 d of the pre-treatment period, cows received the
basal diet ad libitum. From d 9 onwards, cows received their diet in amounts of 95% of the
average daily intake of the cow with the lowest intake within a pair. This feed restriction
was imposed throughout the remainder of the experiment in an effort to avoid
confounding effects of DMI on CH4 production. Cows had free access to water throughout
the experiment.
Measurements, sampling and laboratory analyses
Feed and feces samples
Representative samples of all individual TMR components were collected at the time of
feed preparation. Fecal grab samples were collected in the respiration chambers for
estimation of ATTD of nutrients. Fecal samples were collected at each milking during the
last 4 d before the moment of concentrate switch.
Samples were stored frozen (-20°C) pending analysis. After thawing, samples were air
dried at 60°C until constant weight, and ground to pass a 1-mm screen (Wiley mill;
Peppink 100AN, Olst, the Netherlands), before analysis. Dried samples were analyzed for

102
DM, crude ash, N, NDF, ADF, ADL, starch, sugar, GE, and chromium. In fresh silage samples,
NH3 was analyzed according to the methods described by Klop et al. (2016). Crude fat
content of dried feed and feces samples was analyzed based on NEN-ISO 1735 (ISO, 2004).
A modification to the standard procedure was that samples were hydrolysed with
hydrochloric acid at 75°C and subsequently the solution, containing hydrochloric acid and
ethanol, was extracted with diethyl ether and petroleum ether. Solvents were removed by
distillation before the mass of the extracted material was determined.
Orts were quantitatively collected and weighed daily during the period in the respiration
chambers. If the amount comprised more than 4% of DM supply, a representative
subsample was analyzed for DM, ash and crude fat content according to the same
methods as the feed samples.
Milk production and milk composition
Cows were milked twice daily (at 0600 h and 1600 h) throughout the experiment. Milk
production was recorded at each milking. For all cows, a subsample of milk from each
milking in the CRC was analyzed for fat, protein, lactose, and urea content according to
methods described by Hatew et al. (2015a). Average milk composition for each cow was
calculated from the weighted average of all samples taken during the measurement
period in the CRC. Separate samples were collected for analysis of milk fatty acid (FA)
profile through gas chromatography as detailed by van Gastelen et al. (2015). Fat and
protein corrected milk yield (FPCM) was calculated according to the formula: FPCM (kg/d)
= (0.337 + 0.116 × fat% + 0.06 × protein%) × milk yield (kg/d) (CVB, 2008).
Rumen content samples
In each of the tie-stall periods (viz. period 2 and 4), rumen fluid samples were collected
from the rumen cannulated cows at the day of concentrate switch and the day thereafter
(i.e., d 1, 2, 8, and 9 of each of the two 2-wk periods). Samples were collected at 0 h (just
before), and at 1, 2, 3, 4, 6, 8 and 10 h after morning feeding on both days. Rumen fluid
samples were collected in 3 equal amounts from the front and middle of the ventral sac
and from the cranial sac of the rumen. In each sample, pH was measured immediately
after sampling using a portable pH meter (HI 99141, Hannah instruments, IJsselstijn, the

103
Netherlands). A 600 μL aliquot of rumen fluid was mixed with an equal volume of 0.85% M
ortho-phosphoric acid, containing iso-caproic acid as internal standard and stored at -20°C.
After thawing, samples were centrifuged for 10 min at 10,000 × g at 4°C. Separation of
volatile fatty acids (VFA) was achieved by gas chromatography (Fisons HRGC Mega 2, CE
Instruments, Milan, Italy) with H2 as carrier gas as detailed by Dieho et al. (2016).
Statistical Analysis
All data were analyzed using PROC MIXED (SAS 9.2, SAS Inst. Inc., Cary, NC). For one cow
(AR-LA treatment) data from the pre-treatment period were excluded, because the cow
had a sudden large drop in milk production, while maintaining feed intake. No clinical
signs of disease were observed and milk yield increased again during the following 2
weeks in the tie-stalls. Data for CH4 emission, intake, milk production, milk composition
and ATTD all relate to the CRC periods and were averaged per period and cow.
Measurements from d 1 (cows entering the chambers around 1400 h) and d 8 (cleaning of
chambers in the morning) were not included in the analyses. Hence, the pre-treatment
period included 2 full d of data, and each CRC period comprised 2 weeks of 6 full d of data
each.
The 2 pairs of cows that went into the CRC at the same time throughout the experiment
were considered as one block. The following time points were included in the analyses:
Pre-treatment (background measurement), period 1 (first 2 weeks of dietary treatment),
period 3 (weeks 5 and 6 of dietary treatment) and period 5 (weeks 9 and 10 of dietary
treatment). The model contained block, treatment, time and treatment × time interaction
as fixed effects. Repeated measures over time for each cow × treatment combination
were taken into account using a first order autoregressive [AR(1)] covariance structure.
Rumen fluid from two sampling days was pooled before statistical analysis. One cow (AR-
LA treatment) had access to other feed than the treatment feed allocated to her on the
last rumen sampling day of period 4. Therefore, the values of this day were not used to
calculate average values for this cow. Rumen data were analyzed using a model with fixed
effects of treatment, time, hour, and treatment × time and treatment × hour. Cow × time
104
was included as random effect with repeated measurements for each time(cow)
combination included, and a spatial power covariance structure was fitted because of
unequal time intervals between sampling hours. In all statistical analyses, denominator
degrees of freedom were estimated using the Kenward-Roger option. Pairwise
comparisons of treatment means were evaluated using the Tukey-Kramer method. In case
of significant interaction terms, between-treatment comparisons for each period, or
within-treatment comparisons over periods were made using a SLICE statement and P-
values were corrected using the Tukey-Kramer method. Results are reported as least
squares means and significance of effects was declared at P ≤ 0.05 and trends at 0.05 < P ≤
0.10.
RESULTS AND DISCUSSION
Dry matter intake, milk production, and milk composition
The main aim of this study was to evaluate the alternate feeding of two CH4 mitigating
feed additives (Agolin Ruminant® and C12:0; AR-LA treatment) with a different mode of
action, compared to feeding a single additive (Agolin Ruminant® only; AR-AR treatment) on
CH4 emission and performance of dairy cows. Dry matter intake of AR-AR cows did not
differ between the pre-treatment and treatment periods. In contrast, despite the
restricted feeding regimen, DMI of AR-LA was significantly reduced from period 3 onwards
(Table 5.3). In comparison to C14:0 and C18:0 supplementation, C12:0 supplementation
decreases feed intake (Dohme et al., 2004). In line with the present results, Külling et al.
(2002) also observed a reduction in DMI upon supplementation with C12:0. If the
palatability of C12:0 is the main reason for the reduced DMI (Külling et al. 2002),
encapsulation of the product could provide a solution to avoid reductions in intake.
Milk production was not affected by treatment, but was decreased in period 5 as cows
were advancing in lactation. During periods 3 and 5, but not during the pre-treatment
period and period 1, milk protein concentration was reduced in the AR-LA treatment
which resulted in a treatment × time interaction. Feeding digestible lipid in significant
amounts is generally known to reduce the concentration of protein in milk (Walker et al.,

105
2004), but in the present experiment dietary lipid content only increased by 16 g/kg of DM.
The periods of reduced milk protein content correspond to the periods that AR-LA cows
had a reduced DMI. Therefore, the effect was most likely caused by a lower intake of
metabolizable energy or protein. Milk urea N content was not affected by treatment, time,
or their interaction.
Milk fat depression following C12:0 supplementation has been reported previously
(Faciola and Broderick, 2014; Hristov et al., 2011; Chapter 4). Although in the present
study milk fat concentration was numerically lower in periods 3 and 5 with AR-LA, there
was no treatment effect on milk fat concentration (Table 5.3). Santos et al. (2010)
reported increased milk fat content and production when cows were fed Agolin Ruminant®
(0.85 g/cow/d) and suggested that this could be the result of an increased
acetate:propionate (A:P) ratio in the rumen (which was not measured). However, the
cows in their study produced 49 kg of milk/d with an average DMI of 26 kg/cow/d, which
is higher than in the present experiment. In Chapter 4 a transient shift towards a larger
proportion of propionate was observed in vitro using rumen fluid from cows on a diet
containing Agolin Ruminant®. As the control cows in the study of Santos et al. (2010) had a
numerically higher DMI and a similar milk production level, a plausible explanation for the
increased milk fat concentration upon feeding Agolin Ruminant® is increased body fat
mobilization rather than a shift in VFA profile. The proportion of C12:0 in milk fat of cows
on the AR-LA treatment was higher than for AR-AR (Table 5.4), in particular in period 1.
The DMI of these cows was only reduced from period 3 onwards, which may explain that
the largest proportion of C12:0 in milk fat was observed in period 1. Dohme et al. (2004)
observed a higher proportion of C12:0 in milk fat upon supplementing the diet with C12:0
compared with C14:0 and C18:0. Van Zijderveld et al. (2011) also observed an elevated
proportion of C12:0 in milk fat and a lower proportion of C16:0 upon feeding a mixture of
additives including C12:0. The increased proportion of C12:0 and the reduced proportion
of C16:0 in milk fat of AR-LA cows in period 3 is in line with findings of Hristov et al. (2011),
who supplemented dairy cows with 240 g/d of either stearic acid (C18:0; control
treatment), C12:0, or myristic acid (C14:0). In their study, but not in the study of Dohme et
al. (2004), the proportion of saturated fatty acids (SFA) was lower in cows supplemented

106
with C12:0 than in cows receiving the C18:0 control treatment. In the present study, a
tendency for a treatment × time interaction was found for the proportion of SFA, which
was lower in the AR-LA treatment during the treatment periods compared to the pre-
treatment period, and is opposite to changes between periods in SFA proportions with the
AR-AR treatment.
In comparison with other periods, in period 1, when intake of C12:0 was highest,
proportions of several C18:1 fatty acids were increased in the AR-LA treatment but not in
the AR-AR treatment, resulting in a significant treatment × time interaction (Table 5.4).
Dohme et al. (2004) and Hristov et al. (2011) also reported larger proportions of trans
C18:1 and CLA isomers in milk of cows on a C12:0 treatment than in cows on a C18:0 or
C14:0 treatment. Apparently, C12:0 causes a larger proportion of biohydrogenation
intermediates to escape complete biohydrogenation in the rumen. After intestinal
absorption, such intermediates may decrease de novo fatty acid synthesis in the
mammary gland (Piperova et al., 2000).
Benchaar et al. (2007) evaluated the effect of a mixture of essential oil compounds (Crina
ruminants; includes thymol, eugenol, vanillin, guaiacol, and limonene) in dairy cattle and
did not find any effect on milk fatty acid profile. To our knowledge, the effect of Agolin
Ruminant® on milk fatty acid profile has not been reported previously. In both AR-AR and
AR-LA, the proportions of C15:0 iso and C15:0 anteiso were reduced in period 1 compared
with the pre-treatment period (Table 5.4). Castro Montoya et al. (2011) reported a
positive relationship between iso FA and calculated CH4 production (mmol/mol VFA).
Fibrolytic bacteria are generally enriched in iso FA, whereas amylolytic bacteria contain
high amounts of linear odd-chain FA and anteiso FA (Vlaeminck et al., 2006). Hence, a
positive relation between CH4 emission and iso FA can be assumed, as well as a negative
relation between CH4 emission and linear odd-chain FA and anteiso FA (reviewed by Van
Gastelen and Dijkstra, 2016). During period 1, in line with the change in iso-acid content of
milk fat, CH4 production was indeed lower than during the pre-treatment period, but in
contrast C15:0 anteiso and C17:0 anteiso were reduced in period 3 and C15:0 and C17:0
were not affected by treatment (Table 5.5). Within the AR-AR treatment, also the
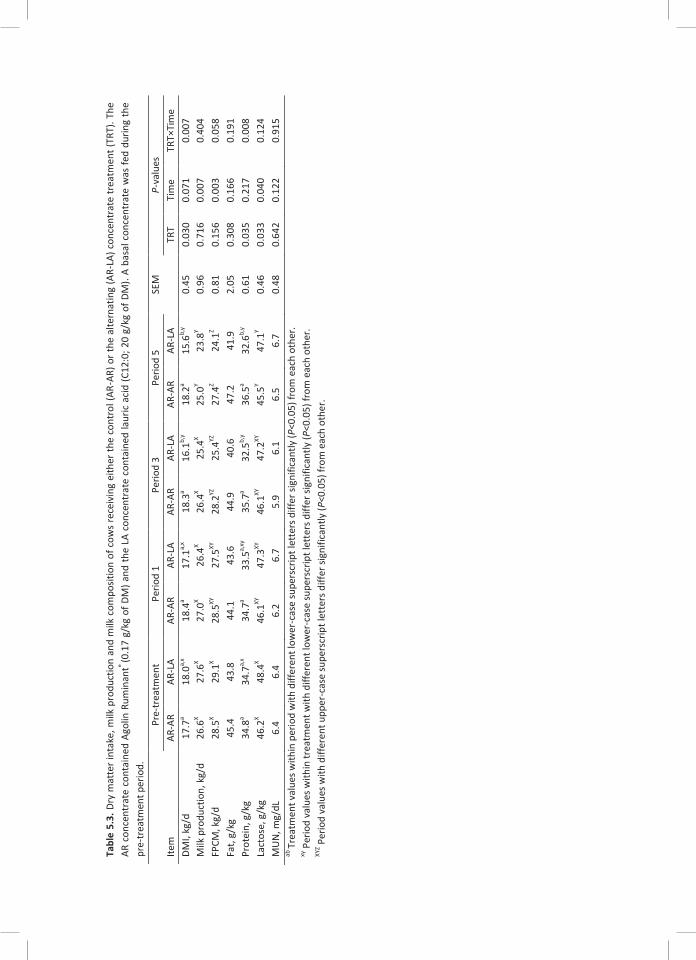
Ta
ble
5.3.
Dry
mat
ter i
ntak
e, m
ilk p
rodu
ctio
n an
d m
ilk c
ompo
sitio
n of
cow
s re
ceiv
ing
eith
er th
e co
ntro
l (AR
-AR)
or t
he a
ltern
atin
g (A
R-LA
) con
cent
rate
trea
tmen
t (TR
T). T
he
AR c
once
ntra
te c
onta
ined
Ago
lin R
umin
ant®
(0.1
7 g/
kg o
f DM
) and
the
LA c
once
ntra
te c
onta
ined
laur
ic a
cid
(C12
:0; 2
0 g/
kg o
f DM
). A
basa
l con
cent
rate
was
fed
durin
g th
e pr
e-tr
eatm
ent p
erio
d.
Pr
e-tr
eatm
ent
Perio
d 1
Perio
d 3
Perio
d 5
SEM
P-
valu
es
Item
AR
-AR
AR-L
A AR
-AR
AR-L
A AR
-AR
AR-L
A AR
-AR
AR-L
A TR
T Ti
me
TRT×
Tim
e DM
I, kg
/d
17.7
a 18
.0a,
x 18
.4a
17.1
a,x
18.3
a 16
.1b,
y 18
.2a
15.6
b,y
0.45
0.
030
0.07
1 0.
007
Milk
pro
duct
ion,
kg/
d 26
.6X
27.6
X 27
.0X
26.4
X 26
.4X
25.4
X 25
.0Y
23.8
Y 0.
96
0.71
6 0.
007
0.40
4 FP
CM, k
g/d
28.5
X 29
.1X
28.5
XY
27.5
XY
28.2
YZ
25.4
YZ
27.4
Z 24
.1Z
0.81
0.
156
0.00
3 0.
058
Fat,
g/kg
45
.4
43.8
44
.1
43.6
44
.9
40.6
47
.2
41.9
2.
05
0.30
8 0.
166
0.19
1 Pr
otei
n, g
/kg
34.8
a 34
.7a,
x 34
.7a
33.5
a,xy
35
.7a
32.5
b,y
36.5
a 32
.6b,
y 0.
61
0.03
5 0.
217
0.00
8 La
ctos
e, g
/kg
46.2
X 48
.4X
46.1
XY
47.3
XY
46.1
XY
47.2
XY
45.5
Y 47
.1Y
0.46
0.
033
0.04
0 0.
124
MU
N, m
g/dL
6.
4 6.
4 6.
2 6.
7 5.
9 6.
1 6.
5 6.
7 0.
48
0.64
2 0.
122
0.91
5 ab
Trea
tmen
t val
ues w
ithin
per
iod
with
diff
eren
t low
er-c
ase
supe
rscr
ipt l
ette
rs d
iffer
sign
ifica
ntly
(P<0
.05)
from
eac
h ot
her.
xy P
erio
d va
lues
with
in tr
eatm
ent w
ith d
iffer
ent l
ower
-cas
e su
pers
crip
t let
ters
diff
er si
gnifi
cant
ly (P
<0.0
5) fr
om e
ach
othe
r. XY
Z Per
iod
valu
es w
ith d
iffer
ent u
pper
-cas
e su
pers
crip
t let
ters
diff
er si
gnifi
cant
ly (P
<0.0
5) fr
om e
ach
othe
r.
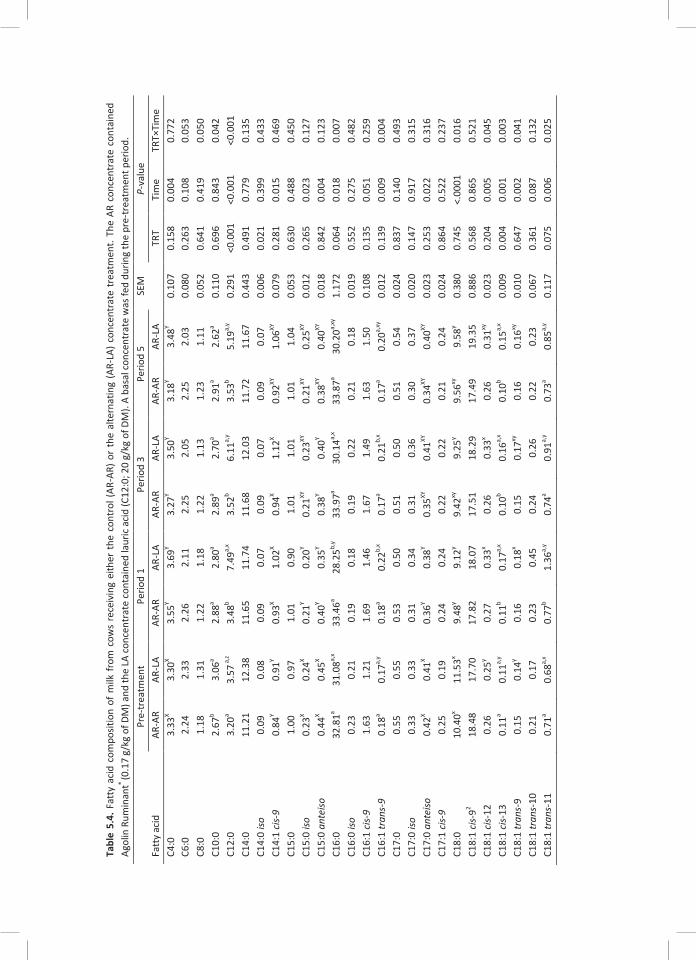
Tabl
e 5.
4. F
atty
aci
d co
mpo
sitio
n of
milk
from
cow
s re
ceiv
ing
eith
er t
he c
ontr
ol (A
R-AR
) or
the
alte
rnat
ing
(AR-
LA) c
once
ntra
te t
reat
men
t. Th
e AR
con
cent
rate
con
tain
ed
Agol
in R
umin
ant®
(0.1
7 g/
kg o
f DM
) and
the
LA c
once
ntra
te c
onta
ined
laur
ic a
cid
(C12
:0; 2
0 g/
kg o
f DM
). A
basa
l con
cent
rate
was
fed
durin
g th
e pr
e-tr
eatm
ent p
erio
d.
Pr
e-tr
eatm
ent
Perio
d 1
Perio
d 3
Perio
d 5
SEM
P-
valu
e Fa
tty
acid
(g
/100
g o
f FA)
AR
-AR
AR-L
A AR
-AR
AR-L
A AR
-AR
AR-L
A AR
-AR
AR-L
A TR
T Ti
me
TRT×
Tim
e C4
:0
3.33
X 3.
30X
3.55
Y 3.
69Y
3.27
Y 3.
50Y
3.18
Y 3.
48Y
0.10
7 0.
158
0.00
4 0.
772
C6:0
2.
24
2.33
2.
26
2.11
2.
25
2.05
2.
25
2.03
0.
080
0.26
3 0.
108
0.05
3 C8
:0
1.18
1.
31
1.22
1.
18
1.22
1.
13
1.23
1.
11
0.05
2 0.
641
0.41
9 0.
050
C10:
0 2.
67b
3.06
a 2.
88a
2.80
a 2.
89a
2.70
a 2.
91a
2.62
a 0.
110
0.69
6 0.
843
0.04
2 C1
2:0
3.20
a 3.
57 a
,z 3.
48b
7.49
a,x
3.52
b 6.
11a,
y 3.
53b
5.19
a,y
0.29
1 <0
.001
<0
.001
<0
.001
C1
4:0
11.2
1 12
.38
11.6
5 11
.74
11.6
8 12
.03
11.7
2 11
.67
0.44
3 0.
491
0.77
9 0.
135
C14:
0 iso
0.
09
0.08
0.
09
0.07
0.
09
0.07
0.
09
0.07
0.
006
0.02
1 0.
399
0.43
3 C1
4:1
cis-9
0.
84Y
0.91
Y 0.
93X
1.02
X 0.
94X
1.12
X 0.
92XY
1.
06XY
0.
079
0.28
1 0.
015
0.46
9 C1
5:0
1.00
0.
97
1.01
0.
90
1.01
1.
01
1.01
1.
04
0.05
3 0.
630
0.48
8 0.
450
C15:
0 iso
0.
23X
0.24
X 0.
21Y
0.20
Y 0.
21XY
0.
23XY
0.
21XY
0.
25XY
0.
012
0.26
5 0.
023
0.12
7 C1
5:0
ante
iso
0.44
X 0.
45X
0.40
Y 0.
35Y
0.38
Y 0.
40Y
0.38
XY
0.40
XY
0.01
8 0.
842
0.00
4 0.
123
C16:
0 32
.81a
31.0
8a,x
33.4
6a 28
.25b,
y 33
.97a
30.1
4a,x
33.8
7a 30
.20a,
xy
1.17
2 0.
064
0.01
8 0.
007
C16:
0 iso
0.
23
0.21
0.
19
0.18
0.
19
0.22
0.
21
0.18
0.
019
0.55
2 0.
275
0.48
2 C1
6:1
cis-9
1.
63
1.21
1.
69
1.46
1.
67
1.49
1.
63
1.50
0.
108
0.13
5 0.
051
0.25
9 C1
6:1
tran
s-9
0.18
a 0.
17a,
y 0.
18a
0.22
b,x
0.17
a 0.
21b,
x 0.
17a
0.20
a,xy
0.
012
0.13
9 0.
009
0.00
4 C1
7:0
0.55
0.
55
0.53
0.
50
0.51
0.
50
0.51
0.
54
0.02
4 0.
837
0.14
0 0.
493
C17:
0 iso
0.
33
0.33
0.
31
0.34
0.
31
0.36
0.
30
0.37
0.
020
0.14
7 0.
917
0.31
5 C1
7:0
ante
iso
0.42
X 0.
41X
0.36
Y 0.
38Y
0.35
XY
0.41
XY
0.34
XY
0.40
XY
0.02
3 0.
253
0.02
2 0.
316
C17:
1 cis
-9
0.25
0.
19
0.24
0.
24
0.22
0.
22
0.21
0.
24
0.02
4 0.
864
0.52
2 0.
237
C18:
0 10
.40x
11.5
3x 9.
48y
9.12
y 9.
42xy
9.
25y
9.56
xy
9.58
y 0.
380
0.74
5 <.
0001
0.
016
C18:
1 cis
-92
18.4
8 17
.70
17.8
2 18
.07
17.5
1 18
.29
17.4
9 19
.35
0.88
6 0.
568
0.86
5 0.
521
C18:
1 cis
-12
0.26
0.
25y
0.27
0.
33x
0.26
0.
33x
0.26
0.
31xy
0.
023
0.20
4 0.
005
0.04
5 C1
8:1
cis-1
3 0.
11a
0.11
a,y
0.11
b 0.
17a,
x 0.
10b
0.16
a,x
0.10
b 0.
15a,
x 0.
009
0.00
4 0.
001
0.00
3 C1
8:1
tran
s-9
0.15
0.
14y
0.16
0.
18x
0.15
0.
17xy
0.
16
0.16
xy
0.01
0 0.
647
0.00
2 0.
041
C18:
1 tr
ans-
10
0.21
0.
17
0.23
0.
45
0.24
0.
26
0.22
0.
23
0.06
7 0.
361
0.08
7 0.
132
C18:
1 tr
ans-
11
0.71
a 0.
68a,
x 0.
77b
1.36
a,y
0.74
a 0.
91a,
y 0.
73a
0.85
a,y
0.11
7 0.
075
0.00
6 0.
025

Ta
ble
5.4.
con
tinue
d.
Pr
e-tr
eatm
ent
Perio
d 1
Perio
d 3
Perio
d 5
SEM
P-
valu
e Fa
tty
acid
(g
/100
g o
f FA)
AR
-AR
AR-L
A AR
-AR
AR-L
A AR
-AR
AR-L
A AR
-AR
AR-L
A TR
T Ti
me
TRT×
Tim
e C1
8:1
tran
s-15
+
C18:
1 cis
-11
0.74
a 0.
73a,
y 0.
78b
1.00
a,x
0.73
b 0.
93a,
x 0.
71b
0.92
a,x
0.04
1 0.
018
<0.0
01
0.00
7 C1
8:2
cis-9
, tra
ns-1
11 0.
33a
0.28
a,y
0.36
b 0.
57a,
x 0.
35a
0.43
a,xy
0.
33a
0.40
a,y
0.05
2 0.
167
0.00
3 0.
021
C18:
2n-6
1.
38
1.27
y 1.
42
1.52
x 1.
39
1.22
y 1.
35
1.28
y 0.
107
0.65
7 0.
003
0.01
1 C1
8:3n
-3
0.41
0.
37
0.39
0.
36
0.39
0.
31
0.37
0.
34
0.03
5 0.
382
0.33
9 0.
334
C18:
3n-6
0.
08
0.09
0.
08
0.09
0.
08
0.08
0.
08
0.09
0.
002
0.08
3 0.
224
0.86
9 C2
0:0
0.15
X 0.
16X
0.14
Y 0.
13Y
0.15
Y 0.
14Y
0.16
X 0.
15X
0.00
5 0.
208
<0.0
01
0.19
4 C2
0:1
cis-1
1 0.
06a
0.06
a 0.
05b
0.07
a 0.
05a
0.05
a 0.
05a
0.06
a 0.
005
0.04
6 0.
441
0.03
5 C2
0:2n
-62
0.04
X 0.
04X
0.03
Y 0.
04Y
0.03
Y 0.
03Y
0.04
XY
0.04
XY
0.00
3 0.
865
0.00
7 0.
433
C20:
3n-6
0.
08X
0.08
X 0.
07Y
0.07
Y 0.
08XY
0.
06XY
0.
08XY
0.
06XY
0.
005
0.20
6 0.
037
0.09
0 C2
0:4n
-6
0.10
0.
10
0.10
0.
09
0.10
0.
08
0.10
0.
09
0.00
5 0.
204
0.26
5 0.
423
C20:
5n-3
0.
05b
0.06
a,x
0.05
a 0.
05a,
y 0.
05a
0.05
a,y
0.05
a 0.
05a,
xy
0.00
3 0.
386
0.02
3 0.
004
C22:
0 0.
06Y
0.06
Y 0.
05Y
0.05
Y 0.
06Y
0.06
Y 0.
08X
0.07
X 0.
003
0.31
8 <0
.001
0.
346
C22:
5n-3
0.
10X
0.09
X 0.
09Y
0.08
Y 0.
08Y
0.08
Y 0.
08Y
0.08
Y 0.
006
0.45
0 0.
002
0.86
3 C2
4:0
0.04
0.
04
0.04
0.
04
0.04
0.
03
0.04
0.
04
0.00
2 0.
813
0.07
7 0.
160
SFA3
70.9
3 72
.30
71.2
5 69
.08
71.7
2 70
.03
71.8
3 69
.05
1.06
1 0.
315
0.14
8 0.
072
MU
FA4
23.5
9 22
.30
23.2
1 24
.57
22.7
8 24
.13
22.6
5 25
.01
0.93
8 0.
368
0.44
6 0.
172
PUFA
5 2.
55
2.38
y 2.
59
2.86
x 2.
54
2.35
y 2.
48
2.48
xy
0.19
1 0.
871
0.00
6 0.
020
n-6
: n-3
ratio
6 3.
04a
3.03
a,z
3.21
b 3.
70a,
x 3.
25a
3.41
a,y
3.26
a 3.
30a,
yz
0.18
8 0.
145
<0.0
01
0.00
5 1 C1
8:1
cis-9
com
prise
s the
sum
of C
18:1
cis-
9 an
d C1
8:1
tran
s-12
, bec
ause
thes
e 2
fatt
y ac
ids c
ould
not
be
sepa
rate
d in
the
anal
ysis.
The
pro
port
ion
of C
18:1
tran
s-12
is
usua
lly n
eglig
ible
. 2 C2
0:2n
-6 co
mpr
ises t
he su
m o
f C20
:2n-
6 and
C21:
0, b
ecau
se th
ese
2 fa
tty
acid
s cou
ld n
ot b
e se
para
ted
in th
e an
alys
is.
3 SFA
= su
m o
f sat
urat
ed fa
tty
acid
s rep
orte
d in
this
tabl
e.
4 MU
FA =
sum
of m
ono
unsa
tura
ted
fatt
y ac
ids r
epor
ted
in th
is ta
ble.
5 PU
FA =
sum
of p
oly
unsa
tura
ted
fatt
y ac
ids r
epor
ted
in th
is ta
ble.
6 Ra
tio b
etw
een
the
sum
of C
18:2
n-6,
C18
:3n-
6, C
20:2
n-6,
C20
:3n-
6, a
nd C
20:4
n-6,
and
the
sum
of C
18:3
n-3,
C20
:5n-
3, a
nd C
22:5
n-3.
ab
Trea
tmen
t val
ues w
ithin
per
iod
with
diff
eren
t low
er-c
ase
supe
rscr
ipt l
ette
rs d
iffer
sign
ifica
ntly
(P<0
.05)
from
eac
h ot
her.
xy P
erio
d va
lues
with
in tr
eatm
ent w
ith d
iffer
ent l
ower
-cas
e su
pers
crip
t let
ters
diff
er si
gnifi
cant
ly (P
<0.0
5) fr
om e
ach
othe
r. XY
Z Per
iod
valu
es w
ith d
iffer
ent u
pper
-cas
e su
pers
crip
t let
ters
diff
er si
gnifi
cant
ly (P
<0.0
5) fr
om e
ach
othe
r.

Tabl
e 5.
5. M
etha
ne (C
H 4) p
rodu
ctio
n an
d ap
pare
nt to
tal t
ract
dig
estib
ility
(ATT
D) o
f nut
rient
s and
gro
ss e
nerg
y in
cow
s re
ceiv
ing
eith
er th
e co
ntro
l (AR
-AR)
or t
he a
ltern
atin
g (A
R-LA
) con
cent
rate
tre
atm
ent.
The
AR c
once
ntra
te c
onta
ined
Ago
lin R
umin
ant®
(0.1
7 g/
kg o
f DM
) and
the
LA
conc
entr
ate
cont
aine
d la
uric
aci
d (C
12:0
; 20
g/kg
of D
M).
A ba
sal c
once
ntra
te w
as fe
d du
ring
the
pre-
trea
tmen
t per
iod.
Pre-
trea
tmen
t Pe
riod
1 Pe
riod
3 Pe
riod
5 SE
M
P-va
lue
Item
AR
-AR
AR-L
A AR
-AR
AR-L
A AR
-AR
AR-L
A AR
-AR
AR-L
A
TRT
Tim
e TR
T×Ti
me
CH4,
g/d
408x
408x
378y
336y
386xy
32
8y 38
6xy
316y
21.9
0.
208
<0.0
01
0.01
2 CH
4, g/
kg
of D
MI
23.1
W
22.7
W
20.5
X 19
.7X
21.0
WX
20.5
WX
21.2
WX
20.8
WX
1.26
0.
769
<0.0
01
0.94
7 CH
4, g/
kg
FPCM
14
.3W
14
.1W
13
.2X
12.1
X 13
.6W
X 12
.9W
X 14
.0W
X 13
.2W
X 0.
71
0.45
6 <0
.001
0.
502
CH4,
%
GEI1
6.9y
6.8Y
6.1X
5.8X
6.2X
6.0X
6.3X
6.1X
0.38
0.
694
<0.0
01
0.88
2 AT
TD (%
)
D
M
71.8
WX
75.3
WX
74.0
WX
71.8
WX
73.6
W
73.8
W
71.4
X 72
.3X
1.30
0.
895
0.00
4 0.
554
OM
73
.0W
X 74
.9W
X 74
.5W
X 74
.6W
X 73
.0X
72.1
X 76
.4W
76
.0W
1.
34
0.89
5 0.
001
0.63
9 C
P 63
.8Y
64.9
Y 67
.3W
X 68
.3W
X 65
.6XY
66
.3XY
70
.4W
70
.8W
1.
23
0.48
6 <0
.001
0.
991
NDF
57
.8W
X 61
.1W
X 61
.1W
X 58
.9W
X 58
.9X
54.4
X 64
.0W
62
.6W
2.
63
0.71
9 0.
001
0.16
1 C
rude
fat
66.3
YZ
70.2
YZ
68.9
XZ
75.3
XZ
63.8
Y 69
.6Y
69.6
X 74
.5X,
1.
33
<0.0
01
0.00
4 0.
849
Sta
rch
97.5
97
.7
98.0
98
.1
97.6
98
.1
98.1
98
.3
0.36
0.
479
0.31
5 0.
902
Gro
ss
Ener
gy
70.3
YZ
72.2
YZ
72.8
WY
73.0
WY
70.9
Z 70
.6Z
74.8
W
74.3
W
1.27
0.
797
0.00
1 0.
715
1 GEI =
Gro
ss e
nerg
y in
take
. xy
Per
iod
valu
es w
ithin
trea
tmen
t with
diff
eren
t low
er-c
ase
supe
rscr
ipt d
iffer
sign
ifica
ntly
(P<0
.05)
from
eac
h ot
her.
WXY
Z Per
iod
valu
es w
ith d
iffer
ent u
pper
-cas
e su
pers
crip
t let
ters
diff
er si
gnifi
cant
ly (P
<0.0
5) fr
om e
ach
othe
r.

111
proportion of C18:0 in milk fat was reduced in period 1 compared to the pre-treatment
period, but not in periods 3 and 5 (Table 5.4). In several studies, milk C18:0 is not related
to CH4 production (Van Gastelen and Dijkstra, 2016), but decreases towards the end of a
lactation cycle (Stoop et al., 2009). Overall, Agolin Ruminant® does not seem to have
caused major shifts in the milk FA profile.
Methane emission
A significant treatment × time interaction was observed for CH4 production (g/d) (Table
5.5). Methane production with AR-AR in period 1 was lower than in the pre-treatment
period (7% lower), but in period 3 and 5 did not differ with the pre-treatment period (5%
lower; numerically only). However, with the AR-LA treatment, methane production in
periods 1, 3 and 5 was significantly lower (on average 20%) than in the pre-treatment
period. The reduced DMI in period 3 and 5 with the AR-LA treatment but not with the AR-
AR treatment offers an explanation for the treatment × time interaction that was
observed for CH4 production. Both CH4 yield (g/kg of DMI) and CH4 intensity (g/kg FPCM)
changed over time, but were not affected by treatment. Methane yield and intensity were
significantly lower (12 and 11%, respectively) in period 1 compared with the pre-
treatment period, but no significant difference relative to pre-treatment period was
observed in period 3 (numerically 9 and 7% lower, respectively) and in period 5
(numerically 8 and 4% lower, respectively). Similarly, CH4 energy loss (expressed as a
fraction of GE intake) was lower in period 1 compared with pre-treatment period, but in
period 3 and 5 the difference with pre-treatment period was not present anymore.
The results suggest that upon continuous feeding of Agolin the CH4 mitigating effect in the
initial 2 weeks is larger than from wk 5 onwards, indicating adaptation to the blend of
essential oils used. Furthermore, the absence of a more persistent decrease of CH4 yield
and intensity with rotational feeding implies that this rotation does not prevent or retard
adaptation. In a previous experiment (Chapter 4), in which rumen fluid was collected as
inoculum from donor cows fed Agolin Ruminant®, in vitro CH4 production was decreased 8
d after introduction of the additive to the donor cow diet, but no effect was observed
after 15 and 21 d. In the same study, feeding C12:0 to donor cows showed a persistent

112
decrease in CH4 production in vitro. Based on these in vitro results, in the present
experiment we evaluated the hypothesis that in vivo, the AR-AR treatment would result in
a transient drop of CH4 production, whereas AR-LA would decrease CH4 persistently. In
their review of in vitro batch culture systems, Yáñez-Ruiz et al. (2016) made several
recommendations related to potential differences in microbial profile and adaptation,
including using the same donor animals as the target species, choosing diets and
incubation substrates with similar nutrient composition, adapting donor animals to the
experimental diet before rumen fluid collection, rumen fluid collection before morning
feeding, and applying a restricted feeding regime to obtain a better interpretation of in
vitro data for the in vivo situation. In the experiment described in Chapter 4, many of
those criteria were met, but nevertheless the hypothesis based on these vitro results
could not be confirmed based on results of the present study. Also Hatew et al. (2015b)
observed a poor relationship between in vitro and in vivo CH4 production (expressed in
g/kg OM) when using cows in the in vivo trial as donor animals, although a moderate
relationship was obtained when CH4 was expressed per unit rumen fermentable OM. The
present results support the conclusion by Yáñez-Ruiz et al. (2016) that results from in vitro
incubations have to be interpreted with care, before such mitigation strategies can be
translated to the in vivo situation.
Castro-Montoya et al. (2015) supplemented a similar dose of Agolin Ruminant® (1 g/cow/d)
as used in the present study to a diet composed of grass silage (460 g/kg of DM), corn
silage (370 g/kg of DM), soybean meal (50 g/kg of DM) and concentrates (120 g/kg of DM)
for 6 wk. In their experiment, Agolin Ruminant® in wk 2 and 6 after first introduction
tended to persistently lessen CH4 production and CH4 yield by 15 and 14%, respectively,
but methane intensity was not affected. The overall average CH4 production of 247 g/d
and 15.8 g/kg of DMI during the weeks that Agolin Ruminant® was fed was lower than in
the present study. Methane expressed per kg milk was similar, because of a higher milk
production of cows in the present study. Interestingly, in an experiment with beef cattle of
the same authors (Castro-Montoya et al., 2015), daily CH4 production and CH4 yield did
not change upon Agolin Ruminant® supplementation in wk 2, 4 or 6.

113
Figure 5.1. Molar percentage of acetate (solid lines) and propionate (dashed lines) as % of total
volatile fatty acids (VFA) in rumen fluid from cows after a.m. feeding of either the AR-AR treatment
(Agolin Ruminant® (0.17 g/kg of DM; □; n = 2)) or the AR-LA treatment (weekly rotation of Agolin
Ruminant® (0.17 g/kg of DM) and lauric acid (20 g/kg of DM; ■; n = 2)). Each data point represents
the treatment average of the pre-treatment period, period 2 and period 4 for the hours indicated.
Symbols indicate significance of treatment differences at each time point (NS not significant; † 0.05
< P < 0.10; * P < 0.05; ** P < 0.01; *** P < 0.001). The top row of symbols relates to propionate and
the bottom row to acetate. Pooled SEM values were 0.44 and 0.43 for acetate and propionate,
respectively.
Van Zijderveld et al. (2011) found that feeding a mixture of additives (C12:0, C14:0, linseed
oil, and calcium fumarate) decreased CH4 production and CH4 energy loss as a fraction of
gross energy intake, but the additive mixture did not affect CH4 yield or intensity. In the
study of Külling et al. (2002), the addition of C12:0 (40 g/kg of DM) reduced DMI, CH4
production and CH4 intensity (expressed in g/kg energy corrected milk) compared with the
C18:0 control diet. No effect was observed for CH4 yield. Martin et al. (2010) concluded
that C12:0 and C14:0 have a more depressive effect on CH4 emission than other fatty acids.
114
However, Grainger and Beauchemin (2011) did not find an effect of type of fatty acid
(C12:0, C14:0, C18:1, C18:2, C18:3) on CH4 yield when total fat was restricted to < 80 g/kg
of DM. The present experiment had a dietary fat content of up to 57 g/kg of DM and is
within this range.
In view of the transitory decline in CH4 yield and intensity with Agolin Ruminant®, and
given the negative effects of C12:0 on feed intake, it is worthwhile to investigate
rotational feeding of Agolin Ruminant® in combination with another compound than in the
present study.
Digestibility of nutrients
Apparent total tract digestibility of nutrients was not affected by time × treatment
interaction or treatment, except for crude fat (Table 5.5). The higher fat digestibility in AR-
LA cows is most likely caused by the difference in fat content between the AR and LA
concentrate (Table 5.2). If fat supplementation is higher, the calculated digestibility values
are less affected by fecal excretion of endogenous fat sources (Kil et al., 2010). Faciola and
Broderick (2014) reported that both ruminal and total tract fiber digestion were depressed
following C12:0 supplementation. In general, milk fat depression caused by intermediates
of ruminal biohydrogenation may be associated with factors including low rumen pH and
reduced fiber degradation in the rumen (Bauman and Griinari, 2003). The absence of a
treatment effect on NDF digestibility in the present study may explain why milk fat
content was also not significantly affected with the AR-LA treatment. The period did
significantly affect ATTD of most nutrients, with in general a lower digestibility in period 3
than in other periods. The reason for this lower digestibility is unknown.
Rumen pH and VFA
Average rumen pH and total VFA concentration were not affected by treatment (Table
5.6). Molar proportions of acetate and propionate were lower and higher, respectively, in
the AR-LA treatment compared with the AR-AR treatment, resulting in a significantly lower
A:P ratio with the AR-LA treatment. No treatment × time interaction was found for these
parameters, but the numerical differences between AR-AR and AR-LA were larger during

115
the treatment period than during the pre-treatment period (Table 5.6), and in particular
the numerical difference in the A:P ratio became larger with advanced period. Molar
proportion of acetate in AR-LA was lower at 0, 8 and 10 h after am feeding, and tended to
be lower at 6 h after am feeding compared with that in AR-AR (Figure 5.1). Hristov et al.
(2011) and Faciola and Broderick (2014) reported reduced VFA concentrations (123 and
128 mM for C12:0 and control, respectively), and in line with the present results reported
reduced molar proportion of acetate (63.7 and 65.0% of total VFA for C12:0 and control,
respectively) following C12:0 supplementation. In both studies rumen samples were
collected at multiple time points relative to feeding, but only averaged values were
reported.
In the present study, the molar proportion of propionate was higher in the AR-LA
treatment than in the AR-AR treatment from 4 h post feeding onwards at the expense of
acetate (Figure 5.1). Feeding C12:0 often reduces protozoa counts in rumen fluid (Hristov
et al., 2011; Faciola et al., 2014). In the meta-analysis by Eugène et al. (2008) defaunation
resulted in a decreased molar proportion of acetate and butyrate, and an increased molar
proportion of propionate in rumen fluid, which might be associated with less CH4
production. Impaired fiber degradation in the rumen may also cause a relative increase in
propionate proportion. Apparent total tract digestibility of NDF was not affected by
additive treatment in this study, although numerically values were lower for AR-LA than
AR-AR during periods 1, 3 and 5 (Table 5.5). As discussed by Van Zijderveld et al. (2011) a
negative effect of a treatment on ruminal fiber degradation may be partly compensated
by fermentation in the hindgut. The latter will yield less nutrients to support milk
production than rumen degradation of fiber. Probably the lower DMI of the AR-LA
treatment in the present study resulted in longer rumen retention time of feed. This might
have alleviated treatment effects on NDF digestibility.

Tabl
e 5.
6. R
umen
pH
and
conc
entr
atio
n of
vol
atile
fatt
y ac
ids
(VFA
) in
cow
s re
ceiv
ing
eith
er t
he c
ontr
ol (A
R-AR
) or
the
alte
rnat
ing
(AR-
LA) c
once
ntra
te t
reat
men
t. Th
e AR
co
ncen
trat
e co
ntai
ned
Agol
in R
umin
ant®
(0.1
7 g/
kg o
f DM
) and
the
LA c
once
ntra
te c
onta
ined
laur
ic a
cid
(C12
:0; 2
0 g/
kg o
f DM
). A
basa
l con
cent
rate
was
fed
durin
g th
e pr
e-tr
eatm
ent p
erio
d.
Pr
e-tr
eatm
ent
Perio
d 2
Perio
d 4
SEM
P-
valu
e
Ite
m
AR-A
R AR
-LA
AR-A
R AR
-LA
AR-A
R AR
-LA
TRT
Tim
e1 Ho
ur2
TRT×
time
TRT×
hour
Ru
men
pH
6.34
6.
31
6.28
6.
34
6.28
6.
27
0.04
9 0.
936
0.59
3 <0
.001
0.
618
0.00
9 To
tal V
FA (m
M)
115XY
11
7XY
109XY
10
6XY
120X
122X
3.0
0.84
0 0.
014
<0.0
01
0.61
2 0.
004
VFA
(% o
f Tot
al V
FA)
Acet
ate
(A)
65.7
65
.2
65.7
64
.3
66.7
64
.2
0.51
0.
013
0.60
7 <0
.001
0.
223
<0.0
01
Prop
iona
te (P
) 18
.0
18.3
18
.1
19.7
18
.0
20.8
0.
58
0.01
5 0.
174
<0.0
01
0.17
6 <0
.001
Bu
tyra
te
11.5
12
.4
12.2
11
.7
11.5
11
.6
0.86
0.
823
0.84
7 <0
.001
0.
754
<0.0
01
Isob
utyr
ate
0.97
X 0.
90X
0.87
XY
0.79
XY
0.84
Y 0.
71Y
0.03
6 0.
019
0.01
2 <0
.001
0.
688
<0.0
01
Vale
rate
1.
61X
1.59
X 1.
47Y
1.40
Y 1.
41Y
1.42
Y 0.
053
0.60
9 0.
021
<0.0
01
0.72
3 <0
.001
Is
oval
erat
e 2.
10
1.55
1.
75
2.01
1.
59
1.33
0.
231
0.36
9 0.
220
<0.0
01
0.28
2 0.
446
A:P
3.66
3.
58
3.71
3.
35
3.77
3.
17
0.10
7 0.
007
0.42
8 <0
.001
0.
127
<0.0
01
1 Tim
e re
fers
to p
erio
d (p
re-t
reat
men
t per
iod,
per
iod
2, p
erio
d 4)
2 Sa
mpl
es w
ere
colle
cted
at 0
, 1, 2
, 3, 4
, 6, 8
and
10
h af
ter m
orni
ng fe
edin
g.
XYZ Pe
riod
valu
es w
ith d
iffer
ent u
pper
-cas
e su
pers
crip
t let
ters
diff
er si
gnifi
cant
ly (P
<0.0
5) fr
om e
ach
othe
r.
117
CONCLUSIONS
In the present study, continuous feeding of Agolin Ruminant® as well as rotational feeding
of Agolin Ruminant® and C12:0 resulted in a transient decline in CH4 yield and intensity.
The rotational feeding of Agolin Ruminant® and C12:0 did not improve the extent and
persistency of CH4 mitigation compared with Agolin Ruminant® only. Dietary levels of
C12:0 appeared to be too high for application in practice, as DMI was reduced in the
rotation treatment. Future research should clarify if rotational feeding of CH4 mitigating
additives (with a transient effect) can result in a persistent mitigation effect.
ACKNOWLEDGEMENTS
Stefan Regelink and Sanne Klerx (Wageningen University, The Netherlands) and the staff
of the experimental facilities 'Carus' are gratefully acknowledged for their assistance
during the experiment. This study is part of the ‘Low Emission Animal Feed’ project.
Authors acknowledge financial support of the Dutch Ministry of Economic Affairs (The
Hague, the Netherlands), Product Board Animal Feed (Zoetermeer, the Netherlands) and
the Dutch Dairy Board (Zoetermeer, the Netherlands), and acknowledge the TI Food and
Nutrition project ‘Reduced methane emission of dairy cows’ for providing milk FA data.
REFERENCES
Bauman, D. E., and J. M. Griinari 2003. Nutritional regulation of milk fat synthesis. Annu. Rev. Nutr.
23:203-227.
Beckie, H. J. 2006. Herbicide-resistant weeds: management tactics and practices. Weed Technol.
20:793–814.
Benchaar, C., H. V. Petit, R. Berthiaume, D. R. Ouellet, J. Chiquette, and P. Y. Chouinard. 2007. Effects
of essential oils on digestion, ruminal fermentation, rumen microbial populations, milk
production, and milk composition in dairy cows fed alfalfa silage or corn silage. J. Dairy Sci.
90:886–897.

118
Castro Montoya, J., A. M. Bhagwat, N. Peiren, S. De Campeneere, B. De Baets, and V. Fievez. 2011.
Relationships between odd- and branched-chain fatty acid profiles in milk and calculated
enteric methane proportion for lactating dairy cattle. Anim. Feed Sci. Technol. 166:596–602.
Castro-Montoya J., N. Peiren, J. W. Cone, B. Zweifel, V. Fievez, and S. De Campeneere. 2015. In vivo
and in vitro effects of a blend of essential oils on rumen methane mitigation. Livest. Sci.
180:134–142.
Chapman, H. D. 2001. Use of anticoccidial drugs in broiler chickens in the USA: Analysis for the years
1995 to 1999. Poultry Sci. 80:572–580.
CVB. 2008. CVB Table booklet feeding of ruminants. CVB series no. 43. Centraal Veevoederbureau,
Lelystad, the Netherlands.
Dieho, K., J. Dijkstra, J. T. Schonewille, and A. Bannink. 2016. Changes in ruminal volatile fatty acid
production and absorption rate during the dry period and early lactation as affected by rate
of increase of concentrate allowance. J. Dairy Sci. 99:5370–5384.
Dohme, F., A. Machmüller, F. Sutter, and M. Kreuzer. 2004. Digestive and metabolic utilization of
lauric, myristic and stearic acid in cows, and associated effects on milk fat quality. Arch.
Anim. Nutr. 58:99–116.
Eugène, M., H. Archimède, and D. Sauvant. 2004. Quantitative meta-analysis on the effects of
defaunation of the rumen on growth, intake and digestion in ruminants. Livest. Prod. Sci.
85:8581–8597.
Faciola, A. P., and G. A. Broderick. 2014. Effects of feeding lauric acid or coconut oil on ruminal
protozoa numbers, fermentation pattern, digestion, omasal nutrient flow, and milk
production in dairy cows. J. Dairy Sci. 97:5088–5100.
Grainger, C. and K. A. Beauchemin. 2011. Can enteric methane emissions from ruminants be
lowered without lowering their production? Anim. Feed Sci. Technol. 166–167:308–320.
Guan, H., K. M. Wittenberg, K. H. Ominski, and D. O. Krause. 2006. Efficacy of ionophores in cattle
for mitigation of enteric methane. J. Anim. Sci. 84:1896–1906.
Hatew, B., S. C. Podesta, H. van Laar, W. F. Pellikaan, J. L. Ellis, J. Dijkstra, and A. Bannink. 2015a.
Effects of dietary starch content and rate of fermentation on methane production in
lactating dairy cows. J. Dairy Sci. 98:486–499.
Hatew B, J. W. Cone, W. F. Pellikaan, S. C. Podesta, A. Bannink, W. H. Hendriks, and J. Dijkstra.
2015b. Relationship between in vitro and in vivo methane production measured
simultaneously with different dietary starch sources and starch levels in dairy cattle. Anim.
Feed Sci. Technol. 202:20–31.

119
Hristov, A. N., C. Lee, T. Cassidy, M. Long, K. Heyler, B. Corl, and R. Forster. 2011. Effects of lauric and
myristic acids on ruminal fermentation, production, and milk fatty acid composition in
lactating dairy cows. J. Dairy Sci. 94:382–395.
ISO 2004. NEN-EN-ISO 1735:2004. Cheese and processed cheese products - Determination of fat
content – Gravimetric method (reference method). International Standards Organization.
Geneva. Switzerland.
Kil, D. Y., T. E. Sauber, D. B. Jones, and H. H. Stein. 2010. Effect of the form of dietary fat and the
concentration of dietary neutral detergent fiber on ileal and total tract endogenous losses
and apparent and true digestibility of fat by growing pigs. J. Anim. Sci. 88:2959–2967.
Klop, G., B. Hatew, A. Bannink, and J. Dijkstra. 2016. Feeding nitrate and docosahexaenoic acid
affects enteric methane production and milk fatty acid composition in lactating dairy cows. J.
Dairy Sci. 99:1161–1172.
Külling, D. R., F. Dohme, H. Menzi, F. Sutter, P. Lischer, and M. Kreuzer. 2002. Methane emissions of
differently fed dairy cows and corresponding methane and nitrogen emissions from their
manure during storage. Environ. Monit. Assess.79:129–150.
Martin, C., D. P. Morgavi, and M. Doreau. 2010. Methane mitigation in ruminants: from microbe to
the farm scale. Animal 4:351–365.
Piperova, L. S., B. B. Teter, I. Bruckental, J. Sampugna, S. E. Mills, M. P. Yurawecz, J. Fritsche, K. Ku,
and R. A. Erdman. 2000. Mammary lipogenic enzyme activity, trans fatty acids and
conjugated linoleic acids are altered in lactating dairy cows fed a milk fat–depressing diet. J.
Nutr. 130:2568–2574.
Santos, M. B., P. H. Robinson, P. Williams, and R. Losa. 2010. Effects of addition of an essential oil
complex to the diet of lactating dairy cows on whole tract nutrient digestion and productive
performance. Anim. Feed Sci. Technol. 157:64–71.
Stoop, W. M., H. Bovenhuis, J. M. L. Heck, and J. A. M. van Arendonk. 2009. Effect of lactation stage
and energy status on milk fat composition of Holstein-Friesian cows. J. Dairy Sci. 92:1469–
1478.
Van Gastelen, S., E. C. Antunes-Fernandes, K. A. Hettinga, G. Klop, S. J. J. Alferink, W. H. Hendriks,
and J. Dijkstra. 2015. Enteric methane production, rumen volatile fatty acid concentrations,
and milk fatty acid composition in lactating Holstein-Friesian cows fed grass silage- or corn
silage-based diets. J. Dairy Sci. 98:1915–1927.
Van Gastelen, S., and J. Dijkstra. 2016. Prediction of methane emission from lactating dairy cows
using milk fatty acids and mid-infrared spectroscopy. J. Sci. Food Agric. In press.
http://dx.doi.org/10.1002/jsfa.7718.

120
Van Zijderveld, S. M., B. Fonken, J. Dijkstra, W. J. J. Gerrits, H. B. Perdok, W. Fokkink, and J. R.
Newbold. 2011. Effects of a combination of feed additives on methane production, diet
digestibility, and animal performance in lactating dairy cows. J. Dairy Sci. 94:1445–1454.
Vlaeminck, B., V. Fievez, A. R. J. Cabrita, A. J. M. Fonseca, and R. J. Dewhurst. 2006. Factors affecting
odd- and branched-chain fatty acids in milk: a review. Anim. Feed Sci. Technol. 131:389–417.
Walker G. P., F. R. Dunshea, and P. T. Doyle. 2004. Effects of nutrition and management on the
production and composition of milk fat and protein: a review. Austr. J. Agric. Res. 55:1009–
1028.
Yáñez-Ruiz, D. R., A. Bannink, J. Dijkstra, E. Kebreab, D. P. Morgavi, P. O’Kiely, C. K. Reynolds, A.
Schwarm, K. J. Shingfield, Z. Yu, and A. N. Hristov. 2016. Design, implementation and
interpretation of in vitro batch culture experiments to assess enteric methane mitigation in
ruminants – a review. Anim. Feed Sci. Technol. 216:1–18.

121

122

Chapter 6
General discussion

124
GENERAL DISCUSSION
Background and aims of this thesis
Over the past decades, there have been extensive research efforts aimed at identifying
and developing feed additives to mitigate enteric CH4 production by ruminants. According
to Regulation (EC) No 1831/2003 on additives for use in animal nutrition, feed additives
can be defined as substances, micro-organisms or preparations, other than feed material
and premixtures, which are intentionally added to feed or water in order to perform one
of the particular functions listed in the regulation. One of these functions is that the
additive shall favorably affect the environmental consequences of animal production, and
this aspect is relevant to the research described in this thesis. Methane production is often
expressed as CH4 yield (g/kg of DMI) and CH4 intensity [g/kg fat- and protein-corrected
milk (FPCM)]. At present, the search and development of enteric CH4 mitigate additive is
ongoing and it has become clear that several issues have to be resolved before such feed
additives can be applied as a viable mitigation strategy. These issues include for example,
long term efficacy, interaction with diet and other additives, safety, environmental trade-
offs and adverse effects on animal health and performance.
Feeding nitrate is an example of an effective feed additive-based mitigation strategy that
also may have some undesirable side effects. It is commonly agreed that feeding nitrate to
ruminant animals decreases CH4 production (see Van Zijderveld et al., 2011b; Lund et al.,
2014; Guyader et al., 2015, 2016; Troy et al., 2015; Olijhoek et al., 2016). However,
feeding nitrate imposes several restrictions on the formulation of the total diet. To avoid
trade-offs in nitrogen (N) emissions to the environment, the basal diet should be low in
rumen degradable N (e.g. corn silage based). This limits the applicability in countries with
N-rich pasture based systems, or diets containing relatively large amounts of high quality
grass silage.
Besides economic aspects and the possible trade-offs in environmental impact, feeding
relatively high doses of nitrate increases the risk of methemoglobinemia. This condition
may occur when nitrite, an intermediate in the nitrate reduction process, accumulates in

125
the rumen and enters the bloodstream. Nitrite causes the conversion of hemoglobin into
methemoglobin, with the latter being unable to transport oxygen. Although there is
considerable evidence that gradual adaptation and feeding regime (reviewed by Lee and
Beauchemin, 2014) successfully alleviates the risk of methemoglobinemia, it remains a
potential health risk associated with nitrate supplementation. A third aspect that may be
negatively affected is DMI (Newbold et al., 2014; Lee et al., 2015), which lowers reduction
in CH4 intensity due to a reduced animal performance.
Despite aforementioned side effects, an important advantage of nitrate as a CH4
mitigation strategy is that the effects persist over time (Van Zijderveld et al., 2011b).
Persistency is an important criterion in the search for feed additive-based CH4 mitigation
strategies because adaptation of the rumen microbes to the additive may occur, and an
initial reduction in CH4 production may become much smaller or even absent in the longer
term. For example, promising results on CH4 reduction using essential oils or their active
ingredients have been obtained using in vitro batch cultures, whereas no or only a
temporary effect on fermentation characteristics was found in continuous cultures or in
vivo (Benchaar and Greathead, 2011; Van Zijderveld et al., 2011a). Cardozo et al. (2004)
reported a transient effect of plant extracts on fermentation characteristics that
disappeared after six days. The latter indicates that microbial adaptation can occur after
short term exposure.
In summary, the application of CH4 mitigation feed additives may have several negative side
effects including trade-offs on other environmental impacts, negative effects on animal
health and performance, and lack of persistency of the mitigating effect. The overall aim of
this project was to investigate these aspects of application of feed additives as a CH4
mitigation strategy, going beyond the evaluation of the effect of single feed additives
commonly reported in literature. This thesis had the following objectives, which address
aspects of interaction between feed additives, adaptation of the rumen microbiota to feed
additives, and consequences of an alternating application of feed additives:

126
1. To investigate if the effects of two different feed additives, with different modes of
action on CH4 production, are additive.
2. To study adaptation to potential CH4 mitigating feed additives in vivo, using the in
vitro gas production technique.
3. To compare CH4 production and performance of dairy cows fed either a single feed
additive, or two different additives according to a rotation schedule.
Additivity
Nitrate is effective in decreasing CH4 production (Hristov et al., 2013), but unwanted side
effects hamper wide spread adoption. Moreover, the strategy is not cost-effective yet
(Van Middelaar et al., 2014). Fat supplementation is also known to have CH4 mitigating
effects (Grainger and Beauchemin, 2011; Patra, 2013), but high inclusion levels of fat or
specific fatty acids may adversely affect DMI, fiber digestion and milk fat or protein
concentration. Usually the negative effects of feed additives occur at higher inclusion
levels (Walker et al., 2004) and, therefore, it is worth investigating if the mitigating effects
of two additives in the rumen are additive. If so, a similar decrease in CH4 production can
be achieved by combining a lower dose of both individual additives, to alleviate the risk of
these negative side effects.
Van Zijderveld et al. (2010) reported an additive effect of nitrate and sulfate on CH4
production. However, these additives both act as an alternative hydrogen (H2) sink and
the inclusion level of sulfate in ruminant diets is limited to avoid the occurrence of
polioencephalomalacia (Gould, 1998; NRC, 2001). Recently, after completion of the
experiment described in Chapter 2, Guyader et al. (2015) reported additive effects of
nitrate and linseed oil, additives with different modes of action, on CH4 emission, with a
trend (P=0.07) for an interaction effect when CH4 was expressed per unit digested NDF.
In the experiment described in Chapter 2, the additivity of the effects of nitrate and
docosahexaenoic acid (C22:n-6; DHA) on CH4 production and performance was
investigated in lactating dairy cows. These additives have a different mode of action in the
rumen, where nitrate acts as an alternative H2 sink (Van Zijderveld et al., 2010) and DHA

127
has an effect on microbial metabolism in the rumen (Boeckaert et al., 2008a). In vitro CH4
production was reduced upon DHA supplementation (Fievez et al., 2007), but these results
have not (yet) been confirmed in vivo (Moate et al., 2013). If DHA would decrease CH4
production, the inclusion level has to be limited as high inclusion levels of DHA were
shown to induce severe milk fat depression and reduce DMI (Boeckaert et al., 2008b;
Moate et al., 2013).
The results of the experiment described in Chapter 2 indicate that there was no
interaction between the additives in affecting CH4 production (and their effect is hence
additive). However, DHA did not reduce CH4 production in g/kg DMI, and even increased
CH4 production in g/kg FPCM, largely as a result of milk fat depression. Therefore, this
particular combination of feed additives does not allow for a lower inclusion level of
nitrate. Guyader et al. (2015) tested the additivity of the effects of nitrate and linseed oil
on CH4 production in non-lactating cows. They concluded that effects on CH4 production
were additive, although a trend was observed for CH4 production per unit digested NDF,
and the reduction in CH4 yield with nitrate and linseed oil combined (-31%) was
numerically smaller than the sum of individual reductions (nitrate, -22%; linseed oil, -17%).
In a follow-up study the effect of a combination of nitrate and linseed oil on enteric CH4
production and nitrate and nitrite residuals in milk was compared to a control diet
(Guyader et al., 2016). The combination of nitrate and linseed reduced CH4 yield (-30%),
but also reduced DMI (-13%), milk protein yield (-15%), total volatile fatty acid (-12%) and
propionate (-31%) concentrations, which indicates that the applied doses (1.8% nitrate
and 3.5% fat from linseed on a DM basis) where probably still too high to avoid adverse
effects.
Although in the study described in Chapter 2 no interaction effect on CH4 production was
observed, the effects of nitrate and DHA on apparent total tract digestibility of NDF where
not additive, as discussed in Chapters 2 and 3. The presence of DHA seemed to alleviate
negative effects of nitrate on fiber digestion. Guyader et al. (2015) observed a trend of
reduced total tract NDF digestibility with linseed oil, without an effect of nitrate or linseed
x nitrate interaction. Numerically, the decline in NDF digestion with linseed oil and nitrate

128
together was larger (-10%) than the effect of linseed oil (-1%) or nitrate (+1%) only. In the
experiment described in Chapter 2, a restricted feeding regime was imposed to avoid a
confounding effect of DMI on CH4 production. Therefore, it is not certain if this interaction
effect would also have been present if no feed restriction was applied. The applied
treatments in Chapter 2 were: Control (CON); NO3 [21 g of nitrate/kg dry matter (DM)];
DHA [3 g of docosahexaenoic acid (DHA)/kg of DM]; or NO3+DHA (21 g of nitrate/kg of DM
and 3 g of DHA/kg of DM). Based on visual observations in the tie-stalls, the feed intake
pattern of cows receiving NO3, DHA or NO3+DHA was more gradual than that of control
cows. Cows on the control treatment were most restricted in their voluntary intake level
which may explain why they consumed their meals faster. Although in the applied
experimental setup it was not possible to quantify the difference in intake pattern, the
diurnal pattern of the respiration quotient (Chapter 3) supports the visual observation of
differences in the rate of feed intake. Further indications of differences in intake pattern
are provided by rumen pH and volatile fatty acids (VFA) data. Table 6.1 and Figure 6.1
contain unpublished data from the experiment described in Chapter 2, in which rumen
samples were collected during 2 consecutive days from the rumen-cannulated cows.
When cows are fed twice daily, it is typically expected that rumen pH will decrease after a
meal, and propionate as a fraction of total VFA will increase. This pattern was indeed
observed in the control cows, but not in cows receiving one of the nitrate treatments. In
particular, the VFA profile on the NO3+DHA treatment indicates a gradual, constant rate of
fermentation, whereas in the control treatment there seems to be a sharp increase in
fermentation shortly after feeding. These observations further support differences in feed
intake pattern between treatments.
For molar proportions of propionate, acetate (and [acetate + butyrate]:propionate ratio;
data not shown) a significant nitrate × time interaction was found (Table 6.1). The molar
proportion of propionate in rumen fluid from cows receiving NO3+DHA 2 h after a.m.
feeding was not different compared to the NO3 treatment, but was significantly lower
than in cows receiving no nitrate (Figure 6.1). The absence of an increase in propionate
proportion immediately after feeding nitrate seems to be the main reason for the overall
reduction in molar proportion of propionate in the full period in between meals.

129
Interestingly, Guyader et al. (2015) observed no effects of nitrate × DHA interaction on
VFA parameters obtained immediately prior to the morning feeding, but a trend for an
interaction was observed for molar proportion of propionate and the [acetate +
butyrate]:propionate ratio, 3 h after morning feeding. Overall, some interesting
differences were observed, including a non-additive effect of nitrate and DHA on the
molar proportion of propionate (Table 6.1).
Aschenbach et al. (2009) reported that nitrate impaired acetate uptake through the
rumen wall in vitro. Nolan et al. (2016) suggested this to be a possible explanation for a
shift in VFA profile towards acetate that has been reported upon nitrate supplementation,
both in vitro and in vivo (Zhou et al., 2012; Guyader et al., 2015, 2016; de Raphélis-Soissan
et al., 2016a). However, in the study of Aschenbach et al. (2009) only acetate uptake was
measured, and not uptake of propionate and butyrate. As the VFA uptake mechanisms
generally are not VFA specific, it is likely that nitrate will also have inhibited the uptake of
other VFA, instead of being specific for acetate.
Nolan et al. (2016) showed that methemoglobin (MetHb) levels in sheep receiving a diet
containing 2% nitrate remained constant and low (>12% of Hb) until 10 h after the first
meal, when the diet was fed in hourly portions of 42 g. The MetHb levels in sheep
receiving the same amount of feed (1 kg/d) not in hourly portions, but in either one or two
meals per day, peaked during the hours after feeding. The authors discuss that the rate of
nitrate reduction is increased when animals eat rapidly and/or when a feed restriction is
applied. The MetHb levels determined in the study described in Chapter 2, also remained
below the threshold for a subclinical disorder, but these were determined during the
period that no feed restriction was yet imposed. The formation of MetHb occurs as a
result of nitrite absorption into the bloodstream. It is, therefore, likely that a more gradual
intake pattern will alleviate nitrite accumulation in the rumen, and subsequent negative
effects on digestion and animal health (Lee and Beauchemin, 2014; Nolan et al., 2016).
Such an alteration in feed intake pattern may provide an explanation for the interaction
effect between nitrate and DHA on fiber digestion (Chapter 2, and 3).

130
Table 6.1. Total VFA concentration and VFA molar proportions in cows fed the control (CON; n = 2) diet or diets with nitrate (NO3; 21 g/kg DM; n=1), docosahexaenoic acid (DHA; 3 g/kg DM; n = 2) or nitrate and DHA (NO3+DHA; 21 g/kg DM and 3 g/kg DM; n=2) as feed additives Treatment P-value Item CON NO3 DHA NO3+DHA SEM NO3 DHA NO3×DHA Rumen pH 6.4b 6.6a 6.4b 6.4 b 0.03 0.031 0.016 0.001 Total VFA (mM/L) 102b 95b 101b 110a 2.0 0.752 0.006 0.001 VFA (mol/100 mol)
Acetate (A) 66.6 66.5 64.9 66.1 0.43 0.242 0.043 0.152 Propionate (P)
17.3ab 16.3bc 18.9a 14.4c 0.41 <0.001 0.730 0.005 Butyrate(B) 12.4 14.1 12.4 15.8 0.69 0.017 0.272 0.268 (A+B):P ratio
4.6b 5.0ab 4.2b 5.7a 0.18 0.005 0.544 0.025 a-c Means within a row with different superscripts differ (P < 0.05).
More recently, 3-nitrooxypropanol (3NOP) received considerable attention as newly
developed CH4 mitigating feed additive. The compound has been specifically designed to
inhibit methyl coenzyme-M Reductase, which is the enzyme that catalyzes the last step of
methanogenesis in rumen archaea. As reviewed by Latham et al. (2016), several in vivo
experiments have been conducted to evaluate the effect of 3NOP on methane production
in dairy and beef cattle. Methane production per kg DMI decreased between 6-60%
compared to the control treatments (Haisan et al., 2014; Reynolds et al., 2014; Romero-
Perez et al., 2014, 2015; Hristov et al., 2015). Although there seems to be an overall
mitigating effect after 3NOP supplementation, the variation in the size of the effect is
large. Latham et al. (2016) discussed that this is most likely a result from differences in the
method of application and methane measurement techniques.
Further research on additivity of the effect of feed additives might focus on the
combination of nitrate and 3NOP. It was discussed by Van Zijderveld (2011) that
decreasing CH4 production may rather divert energy losses toward other reducing
processes during which more heat is produced than during methanogenesis. The mode of
action of 3NOP and nitrate may complement each other in this respect. 3-
Nitrooxypropanol inhibits the activity of methanogens and methanogenesis, leading to an
increased accumulation of H2. Nitrate reduction is energetically more favourable than
methanogenesis, and may take away the H2 as a substrate for methanogens. Moreover,
the required inclusion level of 3NOP can be very low and, therefore, it likely does not
impose a strong restriction directly on the formulation of the basal diet. If the effects are
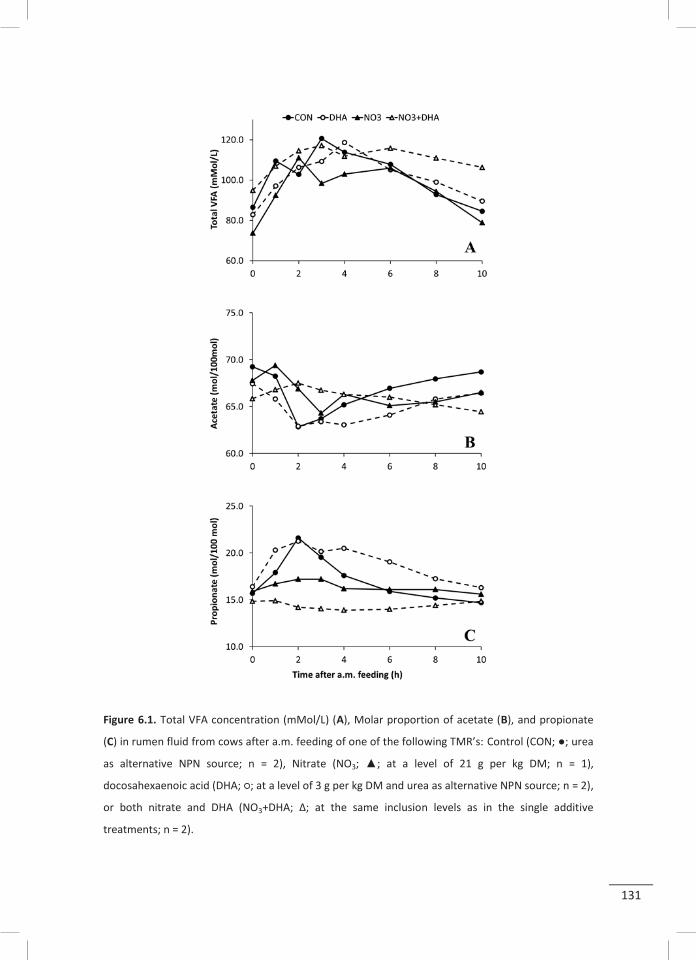
131
Figure 6.1. Total VFA concentration (mMol/L) (A), Molar proportion of acetate (B), and propionate
(C) in rumen fluid from cows after a.m. feeding of one of the following TMR’s: Control (CON; ●; urea
as alternative NPN source; n = 2), Nitrate (NO3; ▲; at a level of 21 g per kg DM; n = 1),
docosahexaenoic acid (DHA; ○; at a level of 3 g per kg DM and urea as alternative NPN source; n = 2),
or both nitrate and DHA (NO3+DHA; Δ; at the same inclusion levels as in the single additive
treatments; n = 2).

132
additive, a lower dose of nitrate in combination with 3NOP may effectively reduce CH4
production, without adverse effects of environmental trade-offs, or an impaired animal
health and productivity.
Adaptation
As outlined in this thesis, adaptation of the rumen microbes may cause effects of feed
additives on CH4 production to be transient. Adaptation is especially expected to additives
that exert an anti-microbial effect. For example, in dual flow continuous culture systems,
several effects of essential oils on fermentation disappeared after 6-7 d (reviewed by
Benchaar et al., 2008). In Chapter 2, the effect of DHA on CH4 production was investigated
after a 13-day adaptation period. In that experiment, no effect of DHA on CH4 production
was found. The absence of an effect of DHA on CH4 production in vivo after an adaptation
period, does not exclude a transient effect of DHA on CH4 production during that
adaptation period. However, this was not determined in the study described in Chapter 2.
Moate et al. (2013) also did not observe a lower CH4 production of cows fed different
levels of DHA after a 2-3 week adaptation period. It is known from in vitro experiments
that DHA has a marked effect on microbial metabolism in the rumen (Boeckaert et al.,
2008a).
In the scientific literature, the search for mitigating feed additives often focuses on the
aim to achieve a persistent decrease in CH4 production by a single additive. In this type of
experiments, CH4 production is determined after an adaptation period to the
experimental diet that includes the feed additive. In this way, with the absence of an
effect, a transient effect that may have occurred during the first days of the adaptation
period (when CH4 production was not measured) cannot be ruled out.
Adaptation over time was investigated and described in Chapter 4. Feeding a commercial
blend of essential oils decreased in vitro CH4 production after 8 days of dietary inclusion,
but not after 15 and 22 days. No such adaptation was observed for lauric acid (C12:0),
which persistently reduced in vitro CH4 production between 4 and 22 days after dietary
inclusion. In vivo observations upon weekly rotation of this blend of essential oils and
133
C12:0 also did not result in a persistently lower CH4 production, CH4 yield and CH4 intensity
compared with feeding the essential oils blend only (Chapter 5).
As recently reviewed by Yáñez-Ruiz et al. (2016), in vitro and in vivo results for the same
additives are usually poorly related, and mitigating effects of additives on CH4 production
were usually much more pronounced in vitro compared with in vivo. The authors provided
a summary of technical recommendations on the use of in vitro gas production methods
for measuring methane production. One of their recommendations that was not met in
the experiment described in Chapter 4 was the minimum of 3 independent incubation
runs as replications. The effects of time point and incubation run on the gas production
measurements were fully confounded, because rumen fluid had to be collected along the
course of adaptation to the experimental diets. An important finding of this study was that
in general, feed additives in the donor cow diet had a larger effect on gas and CH4
production than the same additives in the incubation substrate. Incubation substrate
affected asymptotic GP, half-time of asymptotic CH4 production, total volatile fatty acid
(VFA) concentration, molar proportions of propionate and butyrate, and degradation of
organic matter (OMD), but did not affect the amount of CH4 produced (mL/g OM). This
corresponds to the conclusion of Yáñez-Ruiz et al. (2016), who indicated that using rumen
fluid from adapted versus non-adapted animals significantly affects in vitro results, and
recommended donor animals to be fed the same diet as incubated or of similar nutrient
composition. This should also be considered when translating in vitro results to an in vivo
situation.
Rotation
As discussed in the ’adaptation’ section, the absence of a mitigating effect of a feed
additive (in this case DHA) after an adaptation period does not exclude the possibility that
a short-term mitigating effect occurred. However, even if such an effect would have
existed the mitigation benefit would probably not have outweighed the negative effects
observed on FPCM yield. Nevertheless, short-term mitigating effects of feed additives
could still be beneficial if these additives can be applied in a (short term) rotation schedule.
Similar to application of rotation schedules in herbicide use (Beckie et al., 2006) or for
134
anticoccidial compounds in broilers (Chapman, 2001), the rotational application of two or
more CH4 reducing feed additives with a short-term effect and with different modes of
action could alleviate the diminishing effect on CH4 reduction due to microbial adaptation
in the rumen.
In e.g. herbicide rotations, effective rotation schedules may also become ineffective in the
long run as a result of microbial adaptation. The most important reason for development
of herbicide resistance is overreliance on a single herbicide or on a group of herbicides
that share the same mode of action (Norsworthy et al., 2012). If a suitable combination of
mitigating additives can be found, the search for alternatives should, therefore, be
continued. The aim of the study described in Chapter 5 was to compare in vivo CH4
production and performance of dairy cows receiving either Agolin Ruminant® only and
continuously (AR; 0.05 g/kg total DM; AR-AR treatment), or AR and lauric acid (C12:0; 20
g/kg total DM; AR-LA treatment) using a weekly rotation schedule. After introduction of
the treatment additives in the diet, the experiment comprised five two-week periods. In
periods 1, 3, and 5, cows were housed in respiration chambers for continuous
measurement of CH4 production. A feed restriction was imposed already in the pre-
treatment period to avoid confounding effects of DMI on CH4 production. As the
experimental facilities did not allow additional treatment groups, no control group (none
of the additives fed) and no group that received only C12:0 could be included. Therefore,
the comparison was between continuous feeding of AR and rotation of AR with C12:0
based on two-week averages, and the specific effect of the single additives could not be
statistically evaluated within the experimental design. The changes in DMI and CH4
production on a weekly basis for the AR-LA rotation, though not statistically evaluated, are
presented in Figure 6.2.
The DMI in the weeks that the AR diet was fed are similar to those from the pre-treatment
period, whereas the numerical differences in DMI between the pre-treatment periods and
the C12:0 weeks are substantial. The CH4 yield (g/kg DMI) in the AR weeks keeps declining
over time (from 21.4 to 18.9 g/kg DM in period 1 and 5, respectively; Figure 6.2), but in-
creased from 18.1 (period 1) to 22.7 g/kg DMI (period 5) for the weeks that C12:0 was fed.

135
Figure 6.2. Average dry matter intake (DMI; top figure) and methane yield (g/kg DMI; bottom figure)
of cows receiving a diet with 30% treatment concentrate on a DM basis following a weekly rotation
schedule (first week of each period, AR diet; second week of each period, LA diet). The AR
concentrate contained Agolin Ruminant® (0.17 g/kg DM) and the LA concentrate contained lauric
acid (C12:0; 65 g/kg DM). A basal concentrate was fed during the pre-treatment period (n = 3 for
pre-treatment period, and n = 4 for periods 1, 3, and 5). Error bars represent standard errors.
17.6 18.4 15.7 17.6 14.6 17.9 13.2
0.0
5.0
10.0
15.0
20.0
25.0
Basal diet AR diet LA diet AR diet LA diet AR diet LA diet
Pre-treatment
Period 1 Period 1 Period 3 Period 3 Period 5 Period 5
Dry
mat
ter i
ntak
e (k
g/d)
22.7 21.4 18.1 20.1 21.0 18.9 22.7
0.0
5.0
10.0
15.0
20.0
25.0
Basal diet AR diet LA diet AR diet LA diet AR diet LA diet
Pre-treatment
Period 1 Period 1 Period 3 Period 3 Period 5 Period 5
Met
hane
pro
duct
ion
(g/k
g DM
I)

136
Figure 6.3. Methane production in g/kg dry matter intake (DMI) of cows (n = 4 per treatment) during
the weeks that both treatment groups received the AR concentrate, which contained Agolin
Ruminant® (0.17 g/kg DM) for periods 1, 3, and 5.). The diet contained 30% concentrate on a DM
basis. Grey bars represent the treatment group that received AR for a period of 10 weeks, white bars
represent the group that received both AR and lauric acid (C12:0; 65 g/kg concentrate DM) following
a weekly rotation schedule (see Chapter 5). Error bars represent SEM. Periods within treatment with
different superscript letters differ (P<0.05).
The latter may be explained by an increment in time in the selection of components of the
TMR. Based on chemical analysis of feed refusal samples, upon feeding the C12:0 diet, the
concentrate proportion in the refusal was larger than in the offered TMR. This increases
the relative contribution of fiber to total DMI. A low intake level may also increase rumen
retention time during which fiber fermentation by rumen microbes increases. In this
scenario it is plausible that CH4 yield is higher during LA feeding than with AR feeding for
which a higher DMI and a relatively larger proportion of concentrate in the diet was
achieved.
Weekly rotation of AR and C12:0 did not result in a persistently lower CH4 production
compared to feeding AR only. However, using the same statistical model as for the

137
complete data (as described in Chapter 5) on only the pre-treatment period and the weeks
in which AR was fed to both the AR-LA and AR treatment groups may also provide some
further insight in the applicability of the concept of rotation as a mitigation strategy
(Figure 6.3). The effect of treatment was not significant, but a significant effect of period
and a significant treatment × period interaction was observed. In period 5, but not in
period 1 and 3, feeding AR in the AR-LA rotation treatment significantly reduced CH4 yield
compared with the pre-treatment period. This may indicate that alternate feeding of
C12:0 and Agolin does result in reduced CH4 yield in the week that Agolin is fed. However,
it cannot be excluded that any carry-over effects of C12:0 in the second week of the
previous period have affected the CH4 yield upon feeding Agolin in the subsequent week,
as it is known that C12:0 can also have strong anti-bacterial and anti-methanogenic effects
(Hristov et al., 2011; Zhou et al., 2013). Nevertheless, the initial mitigating effect of AR
seems to be repeatable after a week of feeding C12:0.
Effects of feed additives on animal performance
Efficient mitigation?
The work described in this thesis focuses on CH4 yield (expressed per unit of DMI) and
intensity (expressed per unit of FPCM produced). These metrics indicate an efficiency, as
the emissions are scaled relative to intake or to production. However, one can view
efficiency in dairy cow nutrition from different perspectives.
A commonly used approach is to evaluate feed efficiency (defined as kg FPCM yield/kg
DMI), which does not directly apply to optimal microbial efficiency or resource use
efficiency. In swamps for example, where the concept of passage rate does not apply as in
the rumen, human inedible materials are slowly degraded by microbes. In this scenario, a
lot of acetate and methane can be formed from fibrous substrate, which could be
considered as polluting. However, the extent to which available nutrients are extracted
from the substrate is maximized. Feed intake capacity is a factor of interest in selection for
economic efficiency of dairy cows (Veerkamp, 1998). Higher feed intake will increase the
passage rate of feed, which gives the microbes less time to degrade feedstuffs. It is thus
important to realize that the current situation is not inherent to the nature of ruminants,

138
but has been imposed by humans through breeding and selection. If modern dairy cows
are fed in an appropriate manner, more nutrients will be available for milk production, for
maintenance energy requirements are diluted. However, present dairy cow diets often
include a larger proportion of human edible resources. Hence, increasing feed efficiency is
not necessarily the same as maximizing the efficiency of utilization of human inedible
resources by rumen microbes, to obtain human edible energy and protein.
The often observed negative effects of additive-based CH4 mitigation strategies on fiber
digestion (Latham et al., 2016; Chapter 2, 3), further add to the less efficient use of human
inedible resources to obtain human edible energy and protein. In order to unite the
different viewpoints on efficiency, it is important to understand mechanisms underlying a
certain response upon a mitigation strategy. This mechanistic understanding is also
important to predict the response to an additive under different conditions than the
experimental conditions of the research described in this thesis. With the mechanisms
unknown, all combinations have to be tested, which is usually not feasible in terms of
available time, funds and labour. Before a strategy can be implemented in practice, the
response under varying circumstances has to become a predictable one.
Effects of additives on performance in relation to the basal diet
Medium chain fatty acids (MCFA) may exert a stronger effect on CH4 production when
supplemented to a diet that is relatively low in NDF. Machmüller et al. (2001) tested the
effect of MCFA on in vitro CH4 production using incubation substrates with high or low
concentrations of fiber. Pure C12:0 strongly (~80%) depressed CH4 production
independent of the basal-diet type used. However, when expressed per unit of NDF
fermented, CH4 production was only significantly reduced when C12:0 was added to the
low fiber substrate. Results of Machmüller et al. (2001) may imply that results of the
experiment described in Chapter 5 could have been different if the basal diet would have
contained relatively more starch and sugars and less NDF. Interactions between CH4
mitigation additives and basal substrates on CH4 and VFA production have also been
investigated by Castro-Montoya et al. (2012) using an in vitro approach. In their study,
both the mitigating effect as well as the fermentation depressing effect of MCFA were

139
largest when added to a corn silage substrate. However, the strong inhibition of
fermentation by MCFA, impaired appropriate evaluation of the most promising substrate
× additive combination. Benchaar et al. (2015) investigated the effect of linseed oil
supplementation to red clover silage- or corn silage-based diets on CH4 production in
lactating dairy cows. The treatment effect was more pronounced in the corn silage-based
diet, which implies that the type of forage included in the basal diet is an important aspect
to consider when using fat supplementation as a mitigation strategy. Livingstone et al.
(2015) evaluated effects of linseed supplementation on grass silage or maize silage based
diets, and concluded that basal diet (fibre rich grass silage vs starch rich maize silage) did
not alter the methane emission in response to the linseed supplementation. However, in
their experiment, the amount of supplemental lipid provided by linseed was small.
Interaction effects between the feed additive and the composition of the basal diet also
have large implications for application of these additives in practice. For example, if an
additive only reduces CH4 emission when it is supplemented to a diet with a large
proportion of concentrates, feeding a concentrate rich diet may increase feed costs for
the farmer. Moreover, the applicability of such a feeding strategy also depends on
lactation stage of the cows, as late lactation or dry cows usually receive no or only small
amounts of concentrates. Moreover feeding more concentrates may lead to trade-offs in
environmental impacts of ruminant product (Hristov et al., 2013) and may reduce human
edible efficiency.
Effects of feed additives on DMI
After introducing the different efficiency perspectives from which the effect of additives
on animal performance can be viewed, it is obviously relevant to also compare responses
to mitigation strategies observed in the work of this thesis and to speculate about the
underlying mechanisms.
As discussed in Chapter 3, accumulation of H2 in the rumen may impair fiber digestion. If
fiber degradation in the rumen is impaired, retention time may increase (Hollman and
Beede 2012), which subsequently may lower feed intake. The negative effects of nitrate

140
and C12:0 (either fed as a single additive or in a rotation schedule) on DMI are likely
related to impaired fiber degradation in the rumen. Nitrate and C12:0 may have a direct
toxic effect on methanogens in the rumen (Zhou et al., 2013; Latham et al., 2016). Even
when an additive acting as an alternative H2 sink, such as nitrate, is fed, H2 may still
accumulate when methanogens are inhibited at the same time. Increased H2 levels upon
feeding nitrate have been observed previously (e.g., Van Zijderveld et al., 2011b; Lund et
al., 2014; Troy et al., 2015; Guyader et al., 2015), and H2 production increases quadratic
with increased nitrate levels in the diet (Olijhoek et al., 2016). Similarly, lauric acid
resulted in increased H2 emissions in vitro (O’Brien et al., 2014).
Petersen et al. (2015) measured a transient increase in ruminal nitrite concentrations in
cows receiving the medium (13.6 g nitrate/kg DM) and high (21.1 g nitrate/kg DM) nitrate
diets in the study of Olijhoek et al. (2016). As discussed by the latter authors and in
Chapter 3 of this thesis, nitrite may exert toxic effects on methanogens. The increased H2
emissions measured in nitrate fed cows support this hypothesis. Moreover, Latham et al.
(2016) discussed that calcium nitrate (often used in animal experiments) is not very
soluble in the normal pH range of the rumen. This would imply that not all nitrate will be
reduced, especially not at higher fractional passage rates that may occur upon increases in
DMI. Therefore, it is likely that nitrate supplementation may reduce CH4 emission not just
by nitrate being an alternative H2 sink, but also by other (indirect) mechanisms.
In view of the potentially toxic effects of nitrite, Nolan et al. (2016) discussed several
control points in nitrate metabolism in the rumen with the goal to alleviate toxic effects of
nitrite. Slowing the rate of presentation of nitrate to rumen microbes reduces the risk of
nitrite accumulation. Coating of nitrate may result in such a slower release rate of nitrate
in the rumen. However this should not lead to increased outflow of nitrate from the
rumen before being reduced to ammonia. Frequent feeding will also reduce the peak
levels of MetHb in blood, with much lower peak levels in sheep fed once a day compared
with sheep fed meals at hourly intervals (de Raphélis-Soissan et al., 2016b). The likelihood
of nitrate poisoning is reduced by the inclusion of fermentable energy sources
(concentrates) in nitrate-containing diets (Nolan et al., 2016). However, substituting fibre

141
rich feeds for starch or sugar rich concentrates may not be attractive from a human-edible
feed efficiency viewpoint.
Nitric oxide may also induce a DMI response in nitrate supplemented animals (Nolan et al.,
2016). The authors explained that nitric oxide can be produced from the reduction
intermediate nitrite, and elevated concentrations may reduce rumen primary contractions
and digesta turnover rate. The latter could explain the reduction in meal size
(Lichtenwalner et al., 1973), or the (tendency for) lower feed intake upon nitrate
supplementation (Lund et al., 2014; Newbold et al., 2014; Chapter 2, 3). It can be argued
that the latter is also a mechanism to avoid toxicity, as reduced feed intake also reduces
nitrate intake which consequently may lower the risk of nitrite formation.
Effects on milk production and milk composition
Except for AR, all other additives tested in in vivo experiments described in this thesis (viz.
nitrate, DHA, and C12:0) exerted negative effects on milk production or milk composition
(Table 6.2). In some cases the effects were not statistically significant, but the numerical
differences between the additive and the control treatment were still considerable. E.g.
average FPCM production of cows receiving DHA was around 4 kg lower than the control
treatment which would impose an important trade-off in case of practical application.
Impaired fiber degradation upon feeding C12:0 may not only lower voluntary DMI, but
may also induce milk fat depression. In Chapter 4, fiber degradation was not determined
in vivo, but C12:0 in the diet of the donor cows reduced organic matter degradation in
vitro. The observed lower DMI and milk fat concentration in donor cows receiving C12:0
was, therefore, likely related to impaired fiber degradation in the rumen. As discussed in
Chapters 4 and 5, others also observed negative effects of C12:0 on fiber digestibility
(Dohme et al., 2001, Faciola and Broderick, 2014).
Table 6.2 shows that none of the additives positively affected milk production parameters.
In all experiments described in this thesis, a light feed restriction was imposed to avoid
confounding effects of DMI on CH4 production and without detrimental effects on the

142
Table 6.2. Effects of feed additives investigated in this thesis on dry matter intake (DMI), fat- and protein-corrected milk (FPCM) production and milk composition. Additive (dose) Chapter DMI
(kg/d) FPCM production (kg/d)
Milk fat (g/kg)
Milk protein (g/kg)
Nitrate (21 g/kg DM) 2,3 - = = - DHA1 (3 g/kg DM) 2,3 + = * - = Lauric acid (30 g/kg DM) 4 - - - = * Agolin ruminant (0.05 g/kg DM) = +/-
4 = = = =
Agolin ruminant (0.05 g/kg DM = +/-)
5 = = = =
Lauric acid / Agolin Ruminant rotation
5 - = = -
1DHA: docosahexaenoic acid (C22:6 n-3). Symbols: = not affected, - decreased, + increased. ** Tendency for decrease.
cows. In view of this feed restriction, an increase in animal performance is unlikely. The
seemingly positive effect of DHA on DMI was numerically very small (0.4 kg). As the
variation in DMI is strongly reduced with a restricted feeding regimen, this effect is not
very likely to occur with ad libitum feeding. Nitrate and C12:0 negatively affected intake
even though a feed restriction was imposed. However, although in some cases lower CH4
production was observed, the lower amount of energy lost in CH4 was not compensated
by an increased milk production. For nitrate, this is in line with findings by Van Zijderveld
et al. (2011b) and Lee and Beauchemin (2014), who reported that the consistent decline in
CH4 yield upon feeding nitrate appears to be without directing additional energy toward
animal production.
Implementation of additive-based mitigation strategies
Animal nutrition research into mitigation of enteric CH4 production usually focuses on the
effect of a nutritional strategy on CH4 yield or intensity. Before effective feeding strategies
can be successfully implemented in practice, it should be investigated if there are no
trade-offs with other environmental impact factors. This should not only be evaluated at
the animal level, but also at the farm and dairy production chain level (e.g., Van Middelaar
et al., 2013). Trade-offs may hamper wide spread adoption of a mitigation strategy, but
also negative effects related to food safety and food processing may preclude adoption of
143
a CH4 reducing additive. Finally, the economic feasibility of a strategy should also be
evaluated (Van Middelaar et al., 2014), because strategies with a negative return on
investment are unlikely to be adopted by farmers and industry.
Residues in animal products
Nitrate is effective in reducing CH4 production, but overconsumption of nitrate by humans
may impose health risks. Therefore, the European Food Safety Authority has established
rules to keep consumption of nitrate and nitrate residuals within the maximum daily
allowances (EFSA, 2009). The maximum nitrate concentration allowed in drinking water in
Europe is 50 mg/L. Guyader et al. (2016) examined the effect of feeding nitrate and
linseed on the presence of nitrate residuals in milk products during a 17-week experiment.
The nitrate + linseed diet in their study contained 1.8% nitrate on a DM basis. In curd from
the control treatment in week 17 and in cheese from both treatments in week 9, low
nitrite concentrations were detected (1.5 mg/kg), but in the vast majority of milk and milk
product samples nitrate and nitrite concentrations were below the detection limit.
Similarly, El-Zaiat et al. (2013) did not observe a difference in nitrate residuals in meat of
lambs fed either a control diet, a nitrate diet with 4.51% of encapsulated calcium nitrate in
dietary DM, 4.51% of encapsulated calcium nitrate containing cashew nut shell liquid (2.96%
in the product DM). Nitrite was not detected in meat from any of the treatments. Olijhoek
et al. (2016) reported a linear increase in milk nitrate concentration (from 0.13 to 1.56
mg/l) with increasing dietary nitrate levels (from 0 to 21 g/kg DM), whereas nitrite
concentrations in milk were below the detection limit (< 30 μg/L).
Essential oils and other plant secondary compounds have been studied to examine their
mitigating potential, but the main reason for the increasing interest of the feed industry in
those compounds relates to the change in legislation on so-called medical feed additives
(Greathead, 2003). As outlined by Greathead (2003), these changes are an attempt to
prevent development of microbial resistance to antibiotics, but also the increasing
pressure from consumers is an important driver. Consumers consider consumption of
residues from antibiotics, other drugs, pesticides etc. as a major threat to their health. The
advantage of essential oils is that they are of natural origin and, therefore, more likely to

144
be accepted by consumers. However, the nature of essential oils is that they influence the
organoleptic properties of the plant they belong to (Benchaar and Greathead, 2011).
Therefore, they may also change organoleptic properties of animal products in a negative
way, which will hamper consumer acceptance. For example, in the study of Van Zijderveld
et al. (2011a) diallyl disulfide supplementation at a level that did not decrease CH4
production, already resulted in a clear garlic taint in milk.
Effect on milk processing parameters
Feeding DHA to lactating dairy cows has been reported to increase the proportions of
conjugated linoleic acid (CLA) and DHA in milk fat (Boeckaert et al., 2008b, Chapter 2).
From a human health perspective, such an alteration in milk composition is of interest
(Shingfield et al., 2013). However, alteration of the milk FA profile can also affect milk
processing parameters. Tzompa-Sosa et al. (2016a) investigated the association between
the ratio of C16:0 and C18:1cis-9 and the triacylglycerol (TAG) profile of milk. C16:0 and
C18:1cis-9 have an opposite effect on physical properties of milk fat (e.g. on solid fat
content). In the experiments reported in Chapter 2 and 5 of this thesis, this ratio was
affected by some of the dietary treatments applied. The TAG profile also affects solid fat
content of milk (Tzompa-Sosa et al., 2016b). From a milk processing perspective, highly
unsaturated milk fat with a low C16:0/C18:1cis-9 ratio is less desired. In this milk, the type
of crystals formed are long and give a sandy taste, whereas in more saturated milk shorter
crystals are formed that can form a network of solid fat. Solid fat is an important
processing parameter, because it positively influences sensory perception, functionality
and structure of fat-rich foods (e.g. muffins, puff pastry, ice cream) (Tzompa-Sosa et al.,
2016b). The alteration in milk FA profile towards more unsaturated fatty acids upon
feeding DHA is, therefore, desirable from a human health perspective, but not from a
processing perspective. Feeding of C12:0 reduced the proportion of C16:0 in milk fat at
the expense of C12:0. This fatty acid is associated with increases in low-density-
lipoproteins (LDL) cholesterol. This LDL represents the primary source of cholesterol that
accumulates in the artery wall, which negatively affects cardiovascular health (Salter, 2013;
Siri-Tarino et al., 2015).

145
As discussed in Chapter 2, milk protein concentration and yield were lowered upon nitrate
feeding. As propionate proportion was lowered, this decline may result from a decrease in
glucogenic precursors (Rigout et al., 2003), because glucose is an important factor in
signaling pathways that regulate milk protein synthesis (Rius et al., 2010). As protein is
generally the most valuable milk component, an additive that decreases milk protein
production may reduce interest in its adoption in practice. Guyader et al. (2016) also
reported reduced milk protein yield when a combination of nitrate and linseed was fed.
Van Zijderveld et al. (2011) found reduced milk protein concentration upon nitrate feeding,
whereas protein yield remained unaffected. Milk protein yield was not reported by
Olijhoek et al. (2016), but milk yield and milk protein concentration were not affected by
nitrate feeding although propionate molar proportion in the rumen linearly decreased
with increased dietary nitrate levels. As results are not consistent across studies, this
aspect as well as options to alleviate the negative effects on milk protein, requires further
investigation.
Moate et al. (2016) pointed out that the efficacy of 3NOP in grazing animals has not yet
been evaluated. The authors emphasize that the primary focus should be on testing if
using the compound does not lead to food safety problems (e.g. residues in animal
products). This holds not only for 3NOP, but for any potential mitigating additive. Herrero
et al. (2016) recently stressed the importance of issues related to environmental side-
effects, as well as consumer acceptance, as such issues may prevent widespread adoption
of CH4 mitigating feed additives.
Conclusions and recommendations
The research described in this thesis addresses issues that are frequently reported to
hamper the application of feed additive-based mitigation strategies. The main focus was
on investigating additivity of the CH4 mitigating effect of feed additives, on the adaptation
of rumen microbes to long term feeding of feed additives, and on exploring the potential
of rotational feeding of additives to avoid adaptation. In summary, the following
conclusions and recommendations are drawn:

146
The effects of nitrate and DHA on CH4 yield (g/kg DMI) and CH4 intensity (g/kg FPCM),
were additive. However, the interaction effect between nitrate and DHA on NDF
digestibility indicated that negative effects of nitrate on apparent total-tract
digestibility of nutrients were alleviated by DHA (Chapter 2, 3), probably due to an
altered feed intake pattern.
The effects of nitrate as a CH4 mitigating feed additive on fiber degradation in the
rumen can be detected by evaluating the change in the diurnal pattern of 13C
enrichment of exhaled CO2. A prerequisite for this detection method is that the main
ration components differ in natural 13C enrichment (e.g., C3 and C4 plants), and in
content of the nutrients that are expected to be involved in a shift in fermentation
(e.g., starch and fiber) or in degradability of a nutrient.
Feed additives in the donor cow diet have a stronger effect on in vitro gas and CH4
production than the same additives in the incubation substrate (Chapter 4). This
phenomenon should be considered in the planning of future studies on the mitigation
potential of feed additives in vitro.
DHA and nitrate significantly reduced milk fat and protein yield, respectively, and
C12:0 reduced DMI (Chapter 4, 5) milk fat content, and FPCM production (Chapter 4).
Therefore, the applied doses of these additives are not recommended for application
in practice.
In Chapter 5, rotational feeding of Agolin Ruminant® and C12:0 did not result in a
persistent decrease in CH4. However, there were indications that the concept of
rotation may be effective. Future research should clarify if rotational feeding of Agolin
Ruminant® with another additive could result in a persistent mitigation effect.
The additives tested in this thesis are applied under specific circumstances. More
mechanistic understanding is required to predict the response of the same additives
when supplemented to other basal diets or animals in a different physiological state.
Trade-offs in environmental impact, and effects of feed additives on animal health
and performance, and in milk processing parameters and food safety are important
aspects to consider in future research into mitigation strategies.

147
REFERENCES
Aschenbach J. R., S. Bilk, G. Tadesse, F. Stumpff, and G. Gäbel. 2009. Bicarbonatedependent and
bicarbonate-independent mechanisms contribute to non diffusive uptake of acetate in the
ruminal epithelium of sheep. Am. J. Physiol. Gastroint. Liver Physiol. 296:1098–1107.
Beckie, H. J. 2006. Herbicide-Resistant Weeds: Management Tactics and Practices. Weed Technol.
20:793–814.
Benchaar, C., S. Calsamiglia, A. V. Chaves, G. R. Fraser, D. Colombatto, T. A. McAllister, and K. A.
Beauchemin. 2008. A review of plant-derived essential oils in ruminant nutrition and
production. Anim. Feed Sci. Technol. 145:209–228.
Benchaar, C., and H. Greathead. 2011. Essential oils and opportunities to mitigate enteric methane
emissions from ruminants. Anim. Feed Sci. Technol. 166-167:338–355.
Benchaar, C., F. Hassanat, R. Martineau, and R. Gervais. 2015. Linseed oil supplementation to dairy
cows fed diets based on red clover silage or corn silage: Effects on methane production,
rumen fermentation, nutrient digestibility, N balance, and milk production. J. Dairy Sci.
98:7993–8008.
Boeckaert, C., B. Vlaeminck, V. Fievez, L. Maignien, J. Dijkstra, and N. Boon. 2008a. Accumulation of
trans C18:1 fatty acids in the rumen after dietary algae supplementation is associated with
changes in the Butyrivibrio community. Appl. Environ. Microbiol. 74: 6923–6930.
Boeckaert, C., B. Vlaeminck, J. Dijkstra, A. Issa-Zacharia, T. Van Nespen, W. Van Straalen, and V.
Fievez. 2008b. Effect of dietary starch or micro algae supplementation on rumen
fermentation and milk fatty acid composition of dairy cows. J. Dairy Sci. 91:4714–4727.
Castro-Montoya, J., S. De Campeneere, G. Van Ranst, and V. Fievez. 2012. Interactions between
methane mitigation additives and basal substrates on in vitro methane and VFA production.
Anim. Feed Sci. Technol. 176:47–60.
Cardozo, P.W., S. Calsamiglia, A. Ferret, and C. Kamel 2004. Effects of natural plant extracts on
ruminal protein degradation and fermentation profiles in continuous culture. J. Anim. Sci. 82,
3230–3236.
Chapman, H. D. 2001. Use of anticoccidial drugs in broiler chickens in the USA: Analysis for the years
1995 to 1999. Poultry Sci. 80:572–580.
de Raphélis-Soissan, V., J. V. Nolan, J. R. Newbold, I. R. Godwin, and R. S. Hegarty. 2016a. Can
adaptation to nitrate supplementation and provision of fermentable energy reduce nitrite
accumulation in rumen contents in vitro? Anim. Prod. Sci. 56: 605–612.

148
de Raphélis-Soissan, J. V. Nolan, J. R. Newbold, I. R. Godwin, and R. S. Hegarty. 2016b. Feeding
frequency and rate of nitrate ingestion affect nitrite toxicity in sheep supplemented with
dietary nitrate. In: Proceedings of the 31st biennial conference of the Australian Society of
Animal Production 31, in press.
Dohme F, A. Machmüller, A. Wasserfallen, and M. Kreuzer. 2001. Ruminal methanogenesis as
influenced by individual fatty acids supplemented to complete ruminant diets. Lett. Appl.
Microbiol. 32: 47–51.
El-Zaiat, H. M., H. O. Patiño, Y. A. Solan, A. S. Morsy, R. C. Aroujo, H. Louvandini, and A. L. Abdalla.
2013. Additive effect of nitrate and cashew nut shell liquid in an encapsulated product fed to
lambs on enteric methane emission and growth performance. Proc. of the 5th Greenhouse
Gases and Animal Agriculture conference, 2013, Dublin, Ireland.
European Food Safety Authority. 2009. Scientific opinion of the panel on contaminants in the food
chain on a request from the European Commission on nitrite as undesirable substances in
animal feed. EFSA J 1017:1–47.
Faciola A. P., and G. A. Broderick. 2014. Effects of feeding lauric acid or coconut oil on ruminal
protozoa numbers, fermentation pattern, digestion, omasal nutrient flow, and milk
production in dairy cows. J Dairy Sci. 97:5088–5100.
Fievez, V., C. Boeckaert, B. Vlaeminck, J. Mestdagh, and D. Demeyer. 2007. In vitro examination of
DHA-edible micro-algae 2. Effect on rumen methane production and apparent degradability
of hay. Anim. Feed Sci. Technol. 136:80–95.
Gould, D. H. 1998. Polioencephalomalacia. J. Anim. Sci. 76:309–314.
Greathead, H. 2003. Plants and plant extracts for improving animal productivity. Proc. Nutr. Soc.
62:279–290.
Guyader, J., M. Doreau, D. P. Morgavi, C. Gérard, C. Loncke, and C. Martin. 2016. Long-term effect of
linseed plus nitrate fed to dairy cows on enteric methane emission and nitrate and nitrite
residuals in milk. Animal 6:1–9.
Guyader, J., M. Eugène, B. Meunier, M. Doreau, D. P. Morgavi, M. Silberberg, Y. Rochette, C. Gerard,
C. Loncke, and C. Martin. 2015. Additive methane-mitigating effect between linseed oil and
nitrate fed to cattle. J. Anim. Sci. 93:3564–3577.
Haisan J., Y. Sun, L.L. Guan, K. A. Beauchemin, A. Iwaasa, S. Duval, D. R. Barreda, and M. Oba. 2014.
The effects of feeding 3-nitrooxypropanol on methane emissions and productivity of
Holstein cows in mid lactation. J. Dairy Sci. 97:3110–3119.

149
Herrero, M., B. Henderson, P. Havlik, P. K. Thornton, R. T. Conant, P. Smith, S. Wirsenius, A. N.
Hristov, P. Gerber, M. Gill, K. Butterbach-Bahl, H. Valin, T. Garnett, and E. Stehfest. 2016.
Greenhouse gas mitigation potentials in the livestock sector. Nat. Clim. Chan. 6:452–461.
Hollmann, M., and D. K. Beede. 2012. Comparison of effects of dietary coconut oil and animal fat
blend on lactational performance of Holstein cows fed a high-starch diet. J. Dairy. Sci.
95:1484–1499.
Hristov, A. N., C. Lee, T. Cassidy, M. Long, K. Heyler, B. Corl, and R. Forster. 2011. Effects of lauric and
myristic acids on ruminal fermentation, production, and milk fatty acid composition in
lactating dairy cows. J. Dairy Sci. 94: 382–395.
Hristov, A. N., J. Oh , F. Giallongo , T. W. Frederick, M. T. Harper, H. L. Weeks, A. F. Branco, P. J.
Moate, M. H. Deighton, S. R. O. Williams, M. Kindermann, ans S. Duval . 2015. An inhibitor
persistently decreased enteric methane emission from dairy cows with no negative effect on
milk production. Proc. Nat. Acad. Sci. USA 112:663–668.
Hristov, A. N., J. Oh, J. Firkins, J. Dijkstra, E. Kebreab, G. Waghorn, A. Adesogan, W. Yang, J. Tricarico,
C. Lee, P. J. Gerber, B. Henderson, and H. P. S. Makkar. 2013. Mitigation of methane and
nitrous oxide emissions from animal operations: I. A review of enteric methane mitigation
options. J. Anim. Sci. 91:5045–5069.
Latham, E. A., R. C. Anderson, W. E. Pinchak, and D. J. Nisbet. 2016. Insight on alterations to the
rumen ecosystem by nitrate and nitrocompounds. Front. Microbiol. 7:228.
Lee, C., R. C. Araujo, K. M. Koenig, and K. A. Beauchemin. 2015. Effects of encapsulated nitrate on
eating behavior, rumen fermentation, and blood profile of beef heifers fed restrictively or ad
libitum. J. Anim. Sci. 93:2405–2418.
Lee, C., and K. A. Beauchemin. 2014. A review of feeding supplementary nitrate to ruminant animals:
Nitrate toxicity, methane emissions, and production performance. Can. J. Anim. Sci. 94:557–
570.
Lichtenwalner, R. E., J. P. Fontenot, and R. E. Tucker. 1973. Effect of source of supplemental nitrogen
and level of nitrate on feedlot performance and vitamin A metabolism of fattening beef
calves. J. Anim. Sci. 37:837–847.
Livingstone, K. M., D. J. Humphries, P. Kirton, K. E. Kliem, D. I. Givens, and C. K. Reynolds. 2015.
Effects of forage type and extruded linseed supplementation on methane production and
milk fatty acid composition of lactating dairy cows. J. Dairy Sci. 98:4000–4011.
Lund, P., R. Dahl, H. J. Yang, A. L. F. Hellwing, B. B. Cao, and M. R. Weisbjerg. 2014. The acute effect
of addition of nitrate on in vitro and in vivo methane emission in dairy cows. Anim. Prod. Sci.
54:1432–1435.

150
Machmüller, A., F. Dohme, C. R. Soliva, M. Wanner, and M. Kreuzer. 2001. Diet composition affects
the level of ruminal methane suppression by medium-chain fatty acids. Aus. J. Agric. Res.
52:713–722.
Moate, P. J., M. H. Deighton, S. R. O. Williams, J. E. Pryce, B. J. Hayes, J. L. Jacobs, R. J. Eckard, M.C.
Hannah, and W. J. Wales. 2016. Reducing the carbon footprint of Australian milk production
by mitigation of enteric methane emissions. Anim. Prod. Sci. 56:1017–1034.
Moate P. J., S. R. O. Williams, M. C. Hannah, R. J. Eckard, M. J. Auldist, B. E. Ribaux, J. L. Jacobs, and
W. J. Wales. 2013. Effects of feeding algal meal high in docosahexaenoic acid on feed intake,
milk production, and methane emissions in dairy cows. J. Dairy Sci. 96:3177–3188.
Newbold, J. R., S. M. Van Zijderveld, R. B. A. Hulshof, W. B. Fokkink, R. A. Leng, P. Terencio, W. J.
Powers, P. S. J. Van Adrichem, N. D. Paton, and H. B. Perdok. 2014. The effect of incremental
levels of dietary nitrate on methane emissions in Holstein steers and performance in Nelore
bulls. J. Anim. Sci. 92:5032–5040.
Nolan, J. V., I. R. Godwin, V. de Raphélis-Soissan, and R. S. Hegarty. 2016. Managing the rumen to
limit the incidence and severity of nitrite poisoning in nitrate-supplemented ruminants. Anim.
Prod. Sci. In press DOI: http://dx.doi.org/10.1071/AN15324. .
Norsworthy, J.K., S. M. Ward, D. R. Shaw, R. S. Llewellyn, R. L. Nichols, T. M. Webster, K. W. Bradley,
G. Frisvold, S. B. Powles, N. R. Burgos, W. W. Witt, and M. Barrett. 2012. Reducing the risks
of herbicide resistance: best management practices and recommendations. Weed Sci.
60:31–62.
NRC. 2001. Nutrient Requirements of Dairy Cattle. 7th revised edition. Natl. Acad. Sci., Washington
DC.
O’Brien, M., A. Navarro-Villa, P. J. Purcell, T. M. Boland, and P. O’Kiely. 2014. Reducing in vitro rumen
methanogenesis for two contrasting diets using a series of inclusion rates of different
additives. Anim. Prod. Sci. 54:141–157.
Olijhoek, D.W., A. L. F. Hellwing, M. Brask, M. R. Weisbjerg, O. Højberg, M. K. Larsen, J. Dijkstra, E. J.
Erlandsen, and P. Lund. 2016. Effect of dietary nitrate level on enteric methane production,
hydrogen emission, rumen fermentation, and nutrient digestibility in dairy cows. J. Dairy Sci.
In press DOI: http://dx.doi.org/10.3168/jds.2015-10691.
Petersen S.O., A. L. F. Hellwing, M. Brask. O. Højberg, M. Poulsen, Z. Zhu, K. R. Baral, and P. Lund.
2015. Dietary nitrate for methane mitigation leads to nitrous oxide emissions from dairy
cows. J. Environ. Qual. 44:1063–1070.

151
Reynolds, C. K., D. J. Humphries, P. Kirton, M. Kindermann, S. Duval, and W. Steinberg. 2014. Effects
of 3-nitrooxypropanol on methane emission, digestion, and energy and nitrogen balance of
lactating dairy cows. J. Dairy Sci. 97:3777–3789.
Rigout, S., C. Hurtaud, S. Lemosquet, A. Bach, and H. Rulquin. 2003. Lactational effect of propionic
acid and duodenal glucose in cows. J. Dairy Sci. 86:243–253.
Rius, A. G., J. A. D. R. N. Appuhamy, J. Cyriac, D. Kirovski, O. Becvar, J. Escobar, M. L. McGilliard, B. J.
Bequette, R. M. Arkers, and M. D. Hanigan. 2010. Regulation of protein synthesis in
mammary glands of lactating dairy cows by starch and amino acids. J. Dairy Sci. 93:3114–
3127.
Romero-Perez, A., E. K. Okine, S. M. McGinn, L. L. Guan, M. Oba, S.M. Duval, M. Kindermann, and
K.A. Beauchemin. 2014. The potential of 3-nitrooxypropanol to lower enteric methane
emissions from beef cattle. J. Anim. Sci. 92:4682–4693.
Romero-Perez, A., E. K. Okine, S. M. McGinn, L. L. Guan, M. Oba, S.M. Duval, and K.A. Beauchemin.
2015. Sustained reduction in methane production from long-term addition of 3-
nitrooxypropanol to a beef cattle diet. J. Anim. Sci. 93:1780–1791.
Salter, A. M. 2013. Dietary fatty acids and cardiovascular disease. Animal 7:163–171.
Siri-Tarino, P. W., S. Chiu, N. Bergeron, and R. M. Krauss. 2015. Saturated fats versus
polyunsaturated fats versus carbohydrates for cardiovascular disease prevention and
treatment. Annu. Rev. Nutr. 35:517–543
Troy, S. M., C. A. Duthie, J. J. Hyslop, R. Roehe, D. W. Ross, R. J. Wallace, A. Waterhouse, and J.A.
Rooke. 2015. Effectiveness of nitrate addition and increased oil content as methane
mitigation strategies for beef cattle fed two contrasting basal diets. J. Anim. Sci. 93:1–9.
Tzompa-Sosa, D.A., H. J. F. van Valenberg, G. A. van Aken, and H. Bovenhuis. 2016a. Milk fat
triacylglycerols and their relations with milk fatty acid composition, DGAT1 K232A
polymorphism and milk production traits. J. Dairy Sci. 99:1–8.
Tzompa-Sosa, D. A., P. R. Ramel, H. J. F. van Valenberg, and G. A. van Aken. 2016b. Formation of β
polymorphs in milk fats with large differences in triacylglycerol profiles. J. Agric. Food Chem.
64:4152–4157.
Yáñez-Ruiz , D.R., A. Bannink, J. Dijkstra, E. kebreab, D. P. Morgavi, P. O’Kiely, C. K. Reynolds, A.
Schwarm, K. J. Shingfield, Z. Yu, and A. N. Hristov. 2016. Design, implementation and
interpretation of in vitro batch culture experiments to assess enteric methane mitigation in
ruminants - a review. Anim. Feed Sci. Technol. 216:1–18.
Shingfield, K. J., M. Bonnet, and N. D. Scollan. 2013. Recent developments in altering the fatty acid
composition of ruminant-derived foods. Animal 7:132–162.

152
Van Middelaar, C.E., P. M. Berentsen, J. Dijkstra, and I. J. M. De Boer. 2013. Evaluation of a feeding
strategy to reduce greenhouse gas emissions from dairy farming: The level of analysis
matters. Agric. Sys. 121: 9–22.
Van Middelaar, C.E., J. Dijkstra, P. M. Berentsen, and I. J. M. De Boer. 2014. Cost-effectiveness of
feeding strategies to reduce greenhouse gas emissions from dairy farming. J. Dairy. Sci. 97:
2427–2439.
Van Zijderveld, S. M., W. J. J. Gerrits, J. A. Apajalahti, J. R. Newbold, J. Dijkstra, R. A. Leng, and H. B.
Perdok. 2010. Nitrate and sulfate: Effective alternative hydrogen sinks for mitigation of
ruminal methane production in sheep. J. Dairy Sci. 93:5856–5866.
Van Zijderveld, S. M., J. Dijkstra, H. B., Perdok, J. R., Newbold, and W. J. J. Gerrits. 2011a. Dietary
inclusion of diallyl disulfide, yucca powder, calcium fumarate, an extruded linseed product,
or medium-chain fatty acids does not affect methane production in lactating dairy cows. J.
Dairy Sci. 94:3094–3104.
Van Zijderveld, S. M., W. J. J. Gerrits, J. Dijkstra, J. R. Newbold, R. B. A. Hulshof, and H. B. Perdok.
2011b. Persistency of methane mitigation by dietary nitrate supplementation in dairy cows. J.
Dairy Sci. 94:4028–4038.
Van Zijderveld, S.M. 2011. Dietary strategies to reduce methane emissions from ruminants. PhD
thesis., Wageningen University, Wageningen, the Netherlands (132 pages).
Veerkamp, R. F. 1998. Selection for economic efficiency of dairy cattle using information on live
weight and feed intake: A review. J. Dairy Sci. 81:1109–1119.
Walker G. P., F. R. Dunshea, and P. T. Doyle. 2004. Effects of nutrition and management on the
production and composition of milk fat and protein: a review. Aus. J. Agric. Res. 55:1009–
1028.
Zhou X., L. Meile, M. Kreuzer, and J. O. Zeitz. 2013. The effect of saturated fatty acids on
methanogenesis and cell viability of Methanobrevibacter ruminantium. Archaea, 2013,
Article ID 106916. doi:10.1155/2013/106916.
Zhou, Z., Z. Yu, and Q. Meng. 2012. Effects of nitrate on methane production, fermentation, and
microbial populations in in vitro ruminal cultures. Biores. Technol. 103:173–179.

153

154

Chapter 7
Co-authored peer-reviewed publications
related to this thesis
156
CO-AUTHORED PEER-REVIEWED PUBLICATIONS RELATED TO THIS THESIS
2016
Dijkstra J., S. van Gastelen, E. C. Antunes-Fernandes, D. Warner, B. Hatew, G. Klop, S. C.
Podesta, H. J. van Lingen, K. A. Hettinga, and A. Bannink. 2016. Relationships
between milk fatty acid profiles and enteric methane production in dairy cattle fed
grass- or grass silage-based diets. Anim. Prod. Sci. 56:541–548.
Ellis, J. L., I. K. Hindrichsen, G. Klop, R. D. Kinley, N. Milora, A. Bannink, and J. Dijkstra. 2016.
Effects of lactic acid bacteria silage inoculation on methane emission and
productivity of Holstein Friesian dairy cattle. J. Dairy Sci. 99:7159–7174.
Warner, D., B. Hatew, S. C. Podesta, G. Klop, S. van Gastelen, H. van Laar, J. Dijkstra, and A.
Bannink. 2016. Effects of nitrogen fertilisation rate and maturity of grass silage on
methane emission by lactating dairy cows. Animal 10:34–43.
2015
Van Gastelen, S., E. C. Antunes-Fernandes, K. A. Hettinga, G. Klop, S. J. J. Alferink, W. H.
Hendriks, and J. Dijkstra. 2015. Enteric methane production, rumen volatile fatty
acid concentrations, and milk fatty acid composition in lactating Holstein-Friesian
cows fed grass silage- or corn silage-based diets. J. Dairy Sci. 98:1915–1927.
Warner, D., S. C. Podesta, B. Hatew, G. Klop, H. van Laar, A. Bannink, and J. Dijkstra. 2015.
Effect of nitrogen fertilization rate and regrowth interval of grass herbage on
methane emission of zero-grazing lactating dairy cows. J. Dairy Sci. 98:3383–3393.
2014
Heeren, J. A. H., S. C. Podesta, B. Hatew, G. Klop, H. van laar, A. Bannink, D. Warner, L. H.
de Jonge, and J. Dijkstra. 2014. Rumen degradation characteristics of ryegrass
herbage and ryegrass silage are affected by interactions between stage of maturity
and nitrogen fertilisation rate. Anim. Prod. Sci. 54:1263–1267.

157

158
CURRICULUM VITAE
Geronda Klop was born in Dordrecht, the Netherlands on the 22nd of May 1987. She
followed several years of secondary education (VWO) at Insula College, Dordrecht, the
Netherlands. In 2004, she commenced intermediate vocational education (MBO) where
she obtained a diploma in animal husbandry and a diploma in veterinary assistance in
2007. In 2010, she completed her BSc in Animal Husbandry at HAS Den Bosch University of
applied sciences (HBO), ‘s-Hertogenbosch, the Netherlands. She followed the MSc
programme Animal Sciences at Wageningen University, Wageningen, the Netherlands,
where she did a minor thesis in the Soil Quality department and a major thesis in the
Animal Nutrition Group. She graduated (Cum Laude) in June 2012, and thereafter she
started the PhD project of which the results are described in this thesis.

159
OVERVIEW OF SCIENTIFIC PUBLICATIONS
Peer-reviewed scientific publications
Klop, G., S. van Laar-van Schuppen, W. F. Pellikaan, W. H. Hendriks, A. Bannink, and J.
Dijkstra. Changes in in vitro gas and methane production from rumen fluid from
dairy cows during adaptation to feed additives in vivo. Animal (accepted).
Klop, G., A. Bannink, K. Dieho, W.J.J. Gerrits, and J. Dijkstra. 2016. Short communication:
Using diurnal patterns of 13C enrichment of CO2 to evaluate the effects of nitrate
and docosahexaenoic acid on fiber degradation in the rumen of lactating dairy
cows. J. Dairy Sci. 99:7216–7220.
Ellis, J. L., I. K. Hindrichsen, G. Klop, R. D. Kinley, N. Milora, A. Bannink, and J. Dijkstra. 2016.
Effects of lactic acid bacteria silage inoculation on methane emission and
productivity of Holstein Friesian dairy cattle. J. Dairy Sci. 99:7159–7174.
Dijkstra J., S. van Gastelen, E. C. Antunes-Fernandes, D. Warner, B. Hatew, G. Klop, S. C.
Podesta, H. J. van Lingen, K. A. Hettinga, and A. Bannink. 2016. Relationships
between milk fatty acid profiles and enteric methane production in dairy cattle fed
grass- or grass silage-based diets. Anim. Prod. Sci. 56:541–548.
Klop, G., B. Hatew, A. Bannink, and J. Dijkstra. 2016. Feeding nitrate and docosahexaenoic
acid affects enteric methane production and milk fatty acid composition in lactating
dairy cows. J. Dairy Sci. 99:1161–1172.
Warner, D., B. Hatew, S. C. Podesta, G. Klop, S. van Gastelen, H. van Laar, J. Dijkstra, and A.
Bannink. 2016. Effects of nitrogen fertilisation rate and maturity of grass silage on
methane emission by lactating dairy cows. Animal 10:34–43.
Van Gastelen, S., E. C. Antunes-Fernandes, K. A. Hettinga, G. Klop, S. J. J. Alferink, W. H.
Hendriks, and J. Dijkstra. 2015. Enteric methane production, rumen volatile fatty
acid concentrations, and milk fatty acid composition in lactating Holstein-Friesian
cows fed grass silage- or corn silage-based diets. J. Dairy Sci. 98:1915–1927.
Warner, D., S. C. Podesta, B. Hatew, G. Klop, H. van Laar, A. Bannink, and J. Dijkstra. 2015.
Effect of nitrogen fertilization rate and regrowth interval of grass herbage on
methane emission of zero-grazing lactating dairy cows. J. Dairy Sci. 98:3383–3393.

160
Heeren, J. A. H., S. C. Podesta, B. Hatew, G. Klop, H. van laar, A. Bannink, D. Warner, L. H.
de Jonge, and J. Dijkstra. 2014. Rumen degradation characteristics of ryegrass
herbage and ryegrass silage are affected by interactions between stage of maturity
and nitrogen fertilisation rate. Anim. Prod. Sci. 54:1263–1267
Klop, G., J.L. Ellis, M. C. Blok, G.G. Brandsma, A. Bannink, and J. Dijkstra. 2014.Variation in
phosphorus content of milk from dairy cattle as affected by differences in milk
composition. J. Agric. Sci. 152:860 - 869.
Klop, G., J. L. Ellis, A. Bannink, E. Kebreab, J. France, and J. Dijkstra. 2013. Meta-analysis of
factors that affect the utilization efficiency of phosphorus in lactating dairy cows. J.
Dairy Sci. 96:3936–3949.
Klop, G., G. L. Velthof, and J. W. van Groenigen. 2012. Application technique affects the
potential of mineral concentrates from livestock manure to replace inorganic
nitrogen fertilizer. Soil Use Man. 28:468-477.
Contributions to conferences, symposia and other scientific output
Goselink, R.M.A., G. Klop, J. Dijkstra, and A. Bannink. 2015. Phosphorus metabolism in
dairy cattle : literature study on recent developments and gaps in knowledge.
Wageningen UR Livestock report 910.
Klop, G., B. Hatew, A. Bannink, and J. Dijkstra. 2015. Effects of nitrate and
docosahexaenoic acid on methane production in lactating dairy cows. Proceedings
Joint Annual Meeting of the American Diary Science Association, Orlando, Fl., USA.
Klop, G., B. Hatew, A. Bannink, and J. Dijkstra. 2015. Nitrate but not docosahexaenoic acid
reduces methane production in lactating dairy cows. WIAS Science Day 2015,
February 5, Wageningen, the Netherlands.
Dijkstra, J., J. France, A. Bannink, J. L. St-Pierre, E. Kebreab, R. M. A. Goselink, and G. Klop.
2014. A model of phosphorus utilization in lactating dairy cattle. Abstracts of the
8th International Workshop on Modelling Nutrient Digestion and Utilisation in
Farm Animals, Cairns, Australia.
Van Gastelen, S., E.C. Antunes Fernandes, K. A. Hettinga, G. Klop, S. J. J. Alferink, and J.
Dijkstra. 2014. Replacing grass silage with maize silage affects rumen fermentation

161
characteristics and enteric methane production in dairy cattle. Proceedings of the
39th Animal Nutrition Research Forum. Utrecht, the Netherlands.
Podesta, S. C. , B. Hatew, G. Klop, H. van Laar, R. D. Kinley, A. Bannink, and J. Dijkstra. 2013.
The effect of nitrogen fertilization level and stage of maturity of grass herbage on
methane emission in lactating cows. Proceedings of the 5th Greenhouse Gases and
Animal Agriculture Conference (GGAA2013), Dublin, Ireland.
Velthof, G.L., P. Hoeksma, J. J. Schröder, J. C. van Middelkoop, W. C. A. van; Geel, P. A. I.
Ehlert, G. Holshof, G. Klop, and J. P. Lesschen. 2012. Agronomic potential of mineral
concentrate from processed manure as fertiliser. Proceedings 716 of The
International Fertiliser Society, 20th Annual Conference, Leek, United Kingdom.
Van Vuuren, A.M., J. Dijkstra, G. Klop, W. H. Hendriks, and A. A. Dijkhuizen. 2012.
Challenges for future dairy nutrition. World Nutrition Forum. Marina Bay,
Singapore.
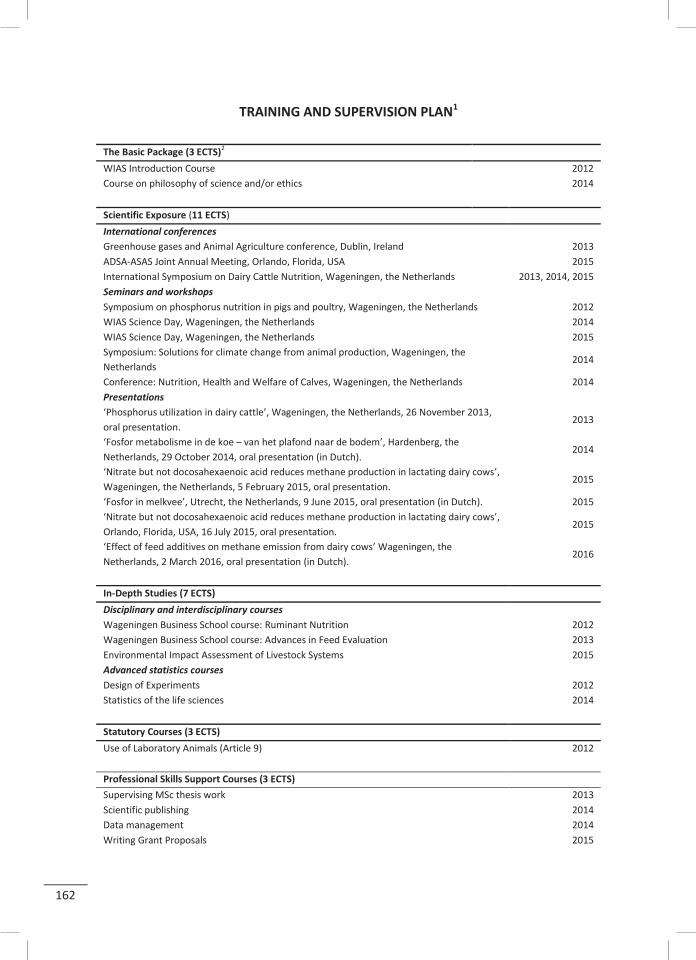
162
TRAINING AND SUPERVISION PLAN1
The Basic Package (3 ECTS)2 WIAS Introduction Course 2012 Course on philosophy of science and/or ethics 2014 Scientific Exposure (11 ECTS) International conferences Greenhouse gases and Animal Agriculture conference, Dublin, Ireland 2013 ADSA-ASAS Joint Annual Meeting, Orlando, Florida, USA 2015 International Symposium on Dairy Cattle Nutrition, Wageningen, the Netherlands 2013, 2014, 2015 Seminars and workshops
Symposium on phosphorus nutrition in pigs and poultry, Wageningen, the Netherlands 2012 WIAS Science Day, Wageningen, the Netherlands 2014 WIAS Science Day, Wageningen, the Netherlands 2015 Symposium: Solutions for climate change from animal production, Wageningen, the Netherlands
2014
Conference: Nutrition, Health and Welfare of Calves, Wageningen, the Netherlands 2014 Presentations
‘Phosphorus utilization in dairy cattle’, Wageningen, the Netherlands, 26 November 2013, oral presentation.
2013
‘Fosfor metabolisme in de koe – van het plafond naar de bodem’, Hardenberg, the Netherlands, 29 October 2014, oral presentation (in Dutch).
2014
‘Nitrate but not docosahexaenoic acid reduces methane production in lactating dairy cows’, Wageningen, the Netherlands, 5 February 2015, oral presentation.
2015
‘Fosfor in melkvee’, Utrecht, the Netherlands, 9 June 2015, oral presentation (in Dutch). 2015 ‘Nitrate but not docosahexaenoic acid reduces methane production in lactating dairy cows’, Orlando, Florida, USA, 16 July 2015, oral presentation.
2015
‘Effect of feed additives on methane emission from dairy cows’ Wageningen, the Netherlands, 2 March 2016, oral presentation (in Dutch).
2016
In-Depth Studies (7 ECTS) Disciplinary and interdisciplinary courses
Wageningen Business School course: Ruminant Nutrition 2012 Wageningen Business School course: Advances in Feed Evaluation 2013 Environmental Impact Assessment of Livestock Systems 2015 Advanced statistics courses
Design of Experiments 2012 Statistics of the life sciences 2014 Statutory Courses (3 ECTS) Use of Laboratory Animals (Article 9) 2012
Professional Skills Support Courses (3 ECTS)
Supervising MSc thesis work 2013 Scientific publishing 2014 Data management 2014 Writing Grant Proposals 2015
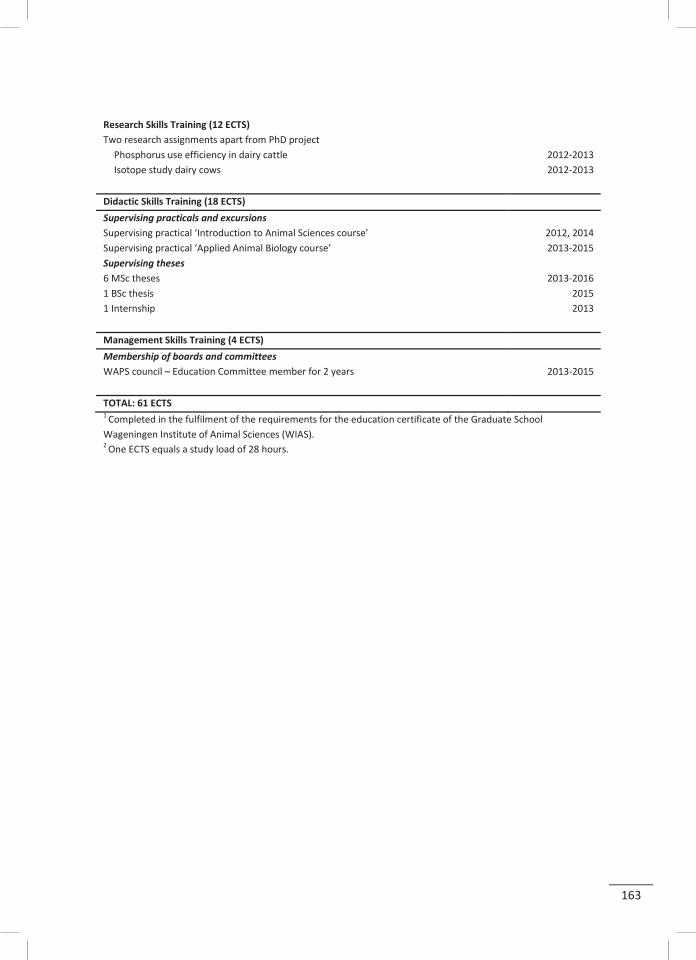
163
Research Skills Training (12 ECTS)
Two research assignments apart from PhD project Phosphorus use efficiency in dairy cattle 2012-2013
Isotope study dairy cows 2012-2013 Didactic Skills Training (18 ECTS) Supervising practicals and excursions
Supervising practical ‘Introduction to Animal Sciences course’ 2012, 2014 Supervising practical ‘Applied Animal Biology course’ 2013-2015 Supervising theses
6 MSc theses 2013-2016 1 BSc thesis 2015 1 Internship 2013 Management Skills Training (4 ECTS) Membership of boards and committees
WAPS council – Education Committee member for 2 years 2013-2015 TOTAL: 61 ECTS 1 Completed in the fulfilment of the requirements for the education certificate of the Graduate School Wageningen Institute of Animal Sciences (WIAS). 2 One ECTS equals a study load of 28 hours.

164
ACKNOWLEDGEMENTS
Toch wel bijzonder om na 4 jaar dan op het punt aan te komen dat ik het dankwoord voor
mijn proefschrift mag gaan schrijven. Mijn naam staat weliswaar op de kaft, maar dit
proefschrift is met hulp van heel veel anderen tot stand gekomen en daarom wil ik graag
van de gelegenheid gebruik maken om hen op deze plaats hartelijk te bedanken.
In de allereerste plaats wil ik de Heer Jezus Christus bedanken. Zonder Hem had ik dit
nooit voor elkaar gekregen.
Uiteraard wil ik ook mijn promotor en co-promotoren hartelijk bedanken voor de
begeleiding van de afgelopen jaren. Wouter, bedankt voor de begeleiding en de tips en
adviezen op de momenten dat het promotietraject allemaal wat minder volgens plan
verliep. Je gaf veel vrijheid en vertrouwen, maar als het nodig was kon ik altijd even
binnenlopen voor advies. Bedankt daarvoor! En Mirian, jij ook bedankt!
Jan en André, bedankt voor de goede inhoudelijke begeleiding en feedback. Ik heb veel
van jullie geleerd. Natuurlijk namen jullie het werk heel serieus, maar ik kan nog steeds
lachen als ik terugdenk aan de discussies over o.a. stellingen als ‘lactose is vet’, ‘alles
binnen 10 meter van een koe is natuur’, en dan was er nog het terugkerende
gespreksonderwerp over iets met een maisdoolhof… ;-). Jullie allebei heel erg bedankt, het
was leuk en leerzaam om met jullie samen te werken!
Walter en Wilbert, ook jullie hebben inhoudelijk een bijdrage geleverd aan dit proefschrift.
Ik mocht altijd even binnenlopen met een vraag. Ook als soms bleek dat dat weer een
paar nieuwe vragen opleverde en het dus iets meer tijd kostte dan gedacht. Bedankt!
Bayissa, also a special thank you for you. It was really fun to work with you in the same
project. You showed me how to successfully defend a thesis from the Low Emission Feed
project last year, and I hope to follow your example in that. Sabrina, ik heb goede
herinneringen aan de tijd die we samen in dit project hebben gewerkt. Het einde van ons
‘collega-zijn’ was niet het einde van onze vriendschap. En wij weten allebei dat de beste

165
resultaten van een project soms niet gepubliceerd worden. Bedankt voor al je support van
de afgelopen jaren en ik vind het super dat je mijn paranimf wilt zijn!
Willem, ook jij bedankt dat je mijn paranimf wilt zijn. Ik kijk met veel plezier terug op onze
samenwerking van de afgelopen jaren. En ook voor jou geldt dat je een heel betrokken
collega was. Greet, jij verdient ook een speciaal bedankje voor al die keren dat je ons van
eten/koffie hebt voorzien als het weer eens een keertje later werd met inkuilen dan
gepland. En jullie allebei natuurlijk ook heel erg bedankt voor jullie gastvrijheid en
betrokkenheid, ook buiten werktijden!
I also want to thank all my ANU colleagues from the past 4 years. I’m not going to mention
everybody separately (as I don’t want to forget anyone!), but thanks a lot to all of you for
creating such a nice working environment. I wish all of you all the best for the future!
Een aantal collega’s wil ik nog wel in het bijzonder bedanken voor hun support en
gezelligheid: Marijke, je was de beste buurvrouw! Bedankt voor alle ‘afleveringen’ van
Buurvrouw & Buurvrouw. Ik denk er met veel plezier aan terug! Sanne, ook jij bedankt
voor je gezelligheid en alle grappen die we hebben uitgehaald! Jij was de collega die me
regelmatig aan het huilen maakte... van het lachen wel te verstaan :’-). Kasper, jij ook heel
erg bedankt voor je gezelligheid en voor alle feedback op mijn schrijfsels. Was erg leuk om
met je samen te werken! Henk, bedankt voor de ‘ondertiteling’ bij artikelen over
chemische reacties die ik niet begreep. Sandra, ook jij was een heel leuke collega en ik
vond het erg gezellig in Florida! Tetske en Yvonne, jullie kende ik al voor ik aan dit project
begon. Het was leuk om samen met jullie te studeren en jullie zijn ook super leuke
collega’s geweest. Hopelijk blijven we elkaar in de toekomst tegenkomen. Jen, I already
met you before I started my PhD. You were a great thesis supervisor during my MSc, a nice
colleague during my PhD and also a good friend. Thanks for that! En Betty en Yvon, jullie
zijn essentieel voor ANU. Ontzettend bedankt voor al jullie hulp en gezelligheid!
Al het onderzoek dat beschreven staat in dit proefschrift moest eerst uitgevoerd worden.
Ook dat was niet mogelijk geweest zonder hulp van anderen. Ries, Teus, Willem, Rinie,
Tonnie, Ronald, Bert, André, Sabine, Debbie, jullie hebben allemaal meegeholpen om dit

166
project tot een goed einde te brengen. Bedankt voor jullie inzet en collegialiteit! Tamme,
Sven, Marcel en Joswita, jullie verdienen ook een speciaal bedankje. Jullie technische
assistentie was cruciaal en bovendien was het altijd erg gezellig om met jullie samen te
werken! Ook de mensen van het ANU lab wil ik hartelijk bedanken: Michel, Jane-Martine,
Erika, Xuan-Huong, Hans en Leon, bedankt voor het meedenken over de juiste procedures
en/of jullie hulp op momenten dat er op meer dan één plek werk te doen was. Saskia, ik
blijf het leuk vinden dat we in een intensieve proef met chronisch slaapgebrek toch geen
enkele keer onenigheid hebben gehad. Hoewel het serieus onderzoek was moet ik toch
ook terugdenken aan Donald Duck, een vrolijke hamster, vreselijke ‘muziek(?)’ en gezellige
maaltijden. Bedankt voor je hulp, want zonder jou had ik die proef nooit kunnen uitvoeren.
Het was gezellig! Harmen, ook jij bedankt voor de momenten dat je bij wilde springen!
Dit proefschrift had ook niet tot stand kunnen komen zonder de hulp van studenten. Kitty,
Stefan en Sanne, jullie hebben allemaal een belangrijke bijdrage geleverd aan de
uitvoering van het onderzoek en de analyses in het lab. Heel erg bedankt Het was ook erg
plezierig om met jullie samen te werken, wat de saaiere klusjes vaak toch een stuk leuker
maakte. Dus ook daarvoor hartelijk bedankt. Ik wens jullie allemaal het allerbeste toe!
Abdulai and Jeffry, thank you very much for your assistance in conducting the research
and the laboratory analyses. Both of you were a great help and a lot of fun to work with. I
wish you all the best for the future!
Sander en Sander, jullie verdienen ook een plekje in dit dankwoord. Sander, bij jou heb ik
de basics van voedingsonderzoek bij herkauwers geleerd. Ik denk met veel plezier terug
aan de stages in Velddriel, Wageningen en Brussel. Het was niet alleen leerzaam, maar
ook altijd gezellig om met jou samen te werken. En Sander, jij ook heel erg bedankt voor
alles wat je me hebt geleerd tijdens mijn afstudeeropdracht voor de HAS. Ook dat was
zowel leerzaam als gezellig! En tsja.. het blijft een feit dat jij al eerder wist dat ik een PhD
zou gaan doen dan dat ik er zelf van overtuigd was...;-).
Voor mijn familie en vrienden was ik niet altijd even gezellig de afgelopen jaren, omdat ik
vaak lange dagen en weekenden door moest werken. Bedankt voor jullie vriendschap,

167
begrip, en voor de gezelligheid op de momenten dat ik dankzij jullie even afstand kon
nemen van mijn werk.
Last, but not least: Pap, Mam, Eline, Peter, jullie verdienen een speciaal plekje hier.
Bedankt voor jullie steun, gezelligheid, en gebeden. Ik hou van jullie!
Geronda

168
COLOPHON
The research described in this thesis is financially supported by the Dutch financers (Dutch
Ministry of Economic Affairs, Product Board Animal Feed and the Dutch Dairy Board).
Cover design and lay-out: Geronda Klop Pictures: Mirian Hendriks