Low dimensional nanostructures of fast ion conducting ...
8
ARTICLE Low dimensional nanostructures of fast ion conducting lithium nitride Nuria Tapia-Ruiz 1,7,8 , Alexandra G. Gordon 2,8 , Catherine M. Jewell 1 , Hannah K. Edwards 2,3 , Charles W. Dunnill 1 , James M. Blackman 4 , Colin P. Snape 4 , Paul D. Brown 3 , Ian MacLaren 5 , Matteo Baldoni 2,6 , Elena Besley 2 , Jeremy J. Titman 2 & Duncan H. Gregory 1 ✉ As the only stable binary compound formed between an alkali metal and nitrogen, lithium nitride possesses remarkable properties and is a model material for energy applications involving the transport of lithium ions. Following a materials design principle drawn from broad structural analogies to hexagonal graphene and boron nitride, we demonstrate that such low dimensional structures can also be formed from an s-block element and nitrogen. Both one- and two-dimensional nanostructures of lithium nitride, Li 3 N, can be grown despite the absence of an equivalent van der Waals gap. Lithium-ion diffusion is enhanced compared to the bulk compound, yielding materials with exceptional ionic mobility. Li 3 N demonstrates the conceptual assembly of ionic inorganic nanostructures from monolayers without the requirement of a van der Waals gap. Computational studies reveal an electronic structure mediated by the number of Li-N layers, with a transition from a bulk narrow-bandgap semiconductor to a metal at the nanoscale. https://doi.org/10.1038/s41467-020-17951-6 OPEN 1 WestCHEM, School of Chemistry, University of Glasgow, Glasgow G12 8QQ, UK. 2 School of Chemistry, University of Nottingham, University Park, Nottingham NG7 2RD, UK. 3 Department of Mechanical, Materials and Manufacturing Engineering, University of Nottingham, University Park, Nottingham NG7 2RD, UK. 4 Department of Chemical and Environmental Engineering, University of Nottingham, University Park, Nottingham NG7 2RD, UK. 5 School of Physics and Astronomy, University of Glasgow, Glasgow G12 8QQ, UK. 6 Istituto per lo Studio dei Materiali Nanostrutturati (ISMN), Consiglio Nazionale delle Ricerche (CNR), Via P. Gobetti 101, 40129 Bologna, Italy. 7 Present address: Department of Chemistry, Lancaster University, Lancaster LA1 4YB, UK. 8 These authors contributed equally: Nuria Tapia-Ruiz, Alexandra G. Gordon. ✉ email: [email protected] NATURE COMMUNICATIONS | (2020)11:4492 | https://doi.org/10.1038/s41467-020-17951-6 | www.nature.com/naturecommunications 1 1234567890():,;
Transcript of Low dimensional nanostructures of fast ion conducting ...
ARTICLE
Low dimensional nanostructures of fast ionconducting lithium nitrideNuria Tapia-Ruiz 1,7,8, Alexandra G. Gordon2,8, Catherine M. Jewell1, Hannah K. Edwards2,3,
Charles W. Dunnill 1, James M. Blackman4, Colin P. Snape 4, Paul D. Brown3, Ian MacLaren 5,
Matteo Baldoni 2,6, Elena Besley 2, Jeremy J. Titman 2 & Duncan H. Gregory 1✉
As the only stable binary compound formed between an alkali metal and nitrogen, lithium
nitride possesses remarkable properties and is a model material for energy applications
involving the transport of lithium ions. Following a materials design principle drawn from
broad structural analogies to hexagonal graphene and boron nitride, we demonstrate that
such low dimensional structures can also be formed from an s-block element and nitrogen.
Both one- and two-dimensional nanostructures of lithium nitride, Li3N, can be grown despite
the absence of an equivalent van der Waals gap. Lithium-ion diffusion is enhanced compared
to the bulk compound, yielding materials with exceptional ionic mobility. Li3N demonstrates
the conceptual assembly of ionic inorganic nanostructures from monolayers without the
requirement of a van der Waals gap. Computational studies reveal an electronic structure
mediated by the number of Li-N layers, with a transition from a bulk narrow-bandgap
semiconductor to a metal at the nanoscale.
https://doi.org/10.1038/s41467-020-17951-6 OPEN
1WestCHEM, School of Chemistry, University of Glasgow, Glasgow G12 8QQ, UK. 2 School of Chemistry, University of Nottingham, University Park,Nottingham NG7 2RD, UK. 3 Department of Mechanical, Materials and Manufacturing Engineering, University of Nottingham, University Park, NottinghamNG7 2RD, UK. 4Department of Chemical and Environmental Engineering, University of Nottingham, University Park, Nottingham NG7 2RD, UK. 5 School ofPhysics and Astronomy, University of Glasgow, Glasgow G12 8QQ, UK. 6 Istituto per lo Studio dei Materiali Nanostrutturati (ISMN), Consiglio Nazionale delleRicerche (CNR), Via P. Gobetti 101, 40129 Bologna, Italy. 7Present address: Department of Chemistry, Lancaster University, Lancaster LA1 4YB, UK. 8Theseauthors contributed equally: Nuria Tapia-Ruiz, Alexandra G. Gordon. ✉email: [email protected]
NATURE COMMUNICATIONS | (2020) 11:4492 | https://doi.org/10.1038/s41467-020-17951-6 | www.nature.com/naturecommunications 1
1234
5678
90():,;
Lithium nitride, Li3N, was originally proposed for use as anelectrolyte in all solid-state Li+ ion batteries given itsexceptional ionic conductivity at room temperature
(ca. 10−3 S cm−1)1. Indeed, for several decades it remained thehighest conducting crystalline Li+ ion conductor at ambientconditions hampered chiefly by its low decomposition potentialdespite many ongoing attempts to stabilise it. Doping with latetransition metals, however, triggers electronic conductivity thatcan be exploited in anodes with more than twice the chargingcapacity of graphite2. Li3N has also been proposed for a myriad ofother applications, e.g. as a means of converting CO2 into usefulproducts3, as the electron injection layer in organic light-emittingdiodes4 and as an unusual reducing agent in preparative organicand organometallic chemistry5. Further, in 2002 Li3N wasrevealed as a potential candidate for solid-state hydrogen storagegiven its capability to accommodate up to 10.4 wt.% H2
6. Slowkinetics for H2 sorption and high (de)hydrogenation tempera-tures are the primary hurdles to overcome before the Li–N–Hsystem can be exploited commercially, however. By combiningexperiment and calculation, we demonstrate how the changes inelectronic structure and reduction of diffusion lengths broughtabout by chemically nanostructuring Li3N can lead to dramaticchanges in electronic properties and ionic transport behaviour.
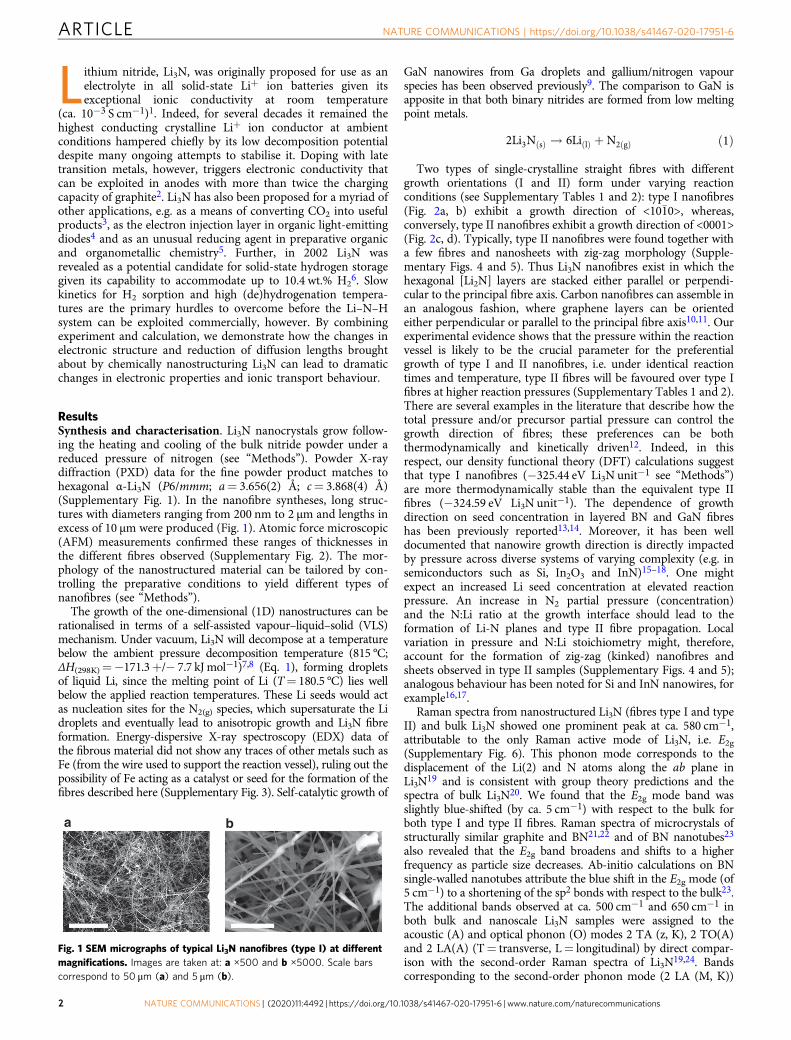
ResultsSynthesis and characterisation. Li3N nanocrystals grow follow-ing the heating and cooling of the bulk nitride powder under areduced pressure of nitrogen (see “Methods”). Powder X-raydiffraction (PXD) data for the fine powder product matches tohexagonal α-Li3N (P6/mmm; a= 3.656(2) Å; c= 3.868(4) Å)(Supplementary Fig. 1). In the nanofibre syntheses, long struc-tures with diameters ranging from 200 nm to 2 μm and lengths inexcess of 10 μm were produced (Fig. 1). Atomic force microscopic(AFM) measurements confirmed these ranges of thicknesses inthe different fibres observed (Supplementary Fig. 2). The mor-phology of the nanostructured material can be tailored by con-trolling the preparative conditions to yield different types ofnanofibres (see “Methods”).
The growth of the one-dimensional (1D) nanostructures can berationalised in terms of a self-assisted vapour–liquid–solid (VLS)mechanism. Under vacuum, Li3N will decompose at a temperaturebelow the ambient pressure decomposition temperature (815 °C;ΔH(298K)=−171.3+/− 7.7 kJ mol−1)7,8 (Eq. 1), forming dropletsof liquid Li, since the melting point of Li (T= 180.5 °C) lies wellbelow the applied reaction temperatures. These Li seeds would actas nucleation sites for the N2(g) species, which supersaturate the Lidroplets and eventually lead to anisotropic growth and Li3N fibreformation. Energy-dispersive X-ray spectroscopy (EDX) data ofthe fibrous material did not show any traces of other metals such asFe (from the wire used to support the reaction vessel), ruling out thepossibility of Fe acting as a catalyst or seed for the formation of thefibres described here (Supplementary Fig. 3). Self-catalytic growth of
GaN nanowires from Ga droplets and gallium/nitrogen vapourspecies has been observed previously9. The comparison to GaN isapposite in that both binary nitrides are formed from low meltingpoint metals.
2Li3NðsÞ ! 6LiðlÞ þ N2ðgÞ ð1Þ
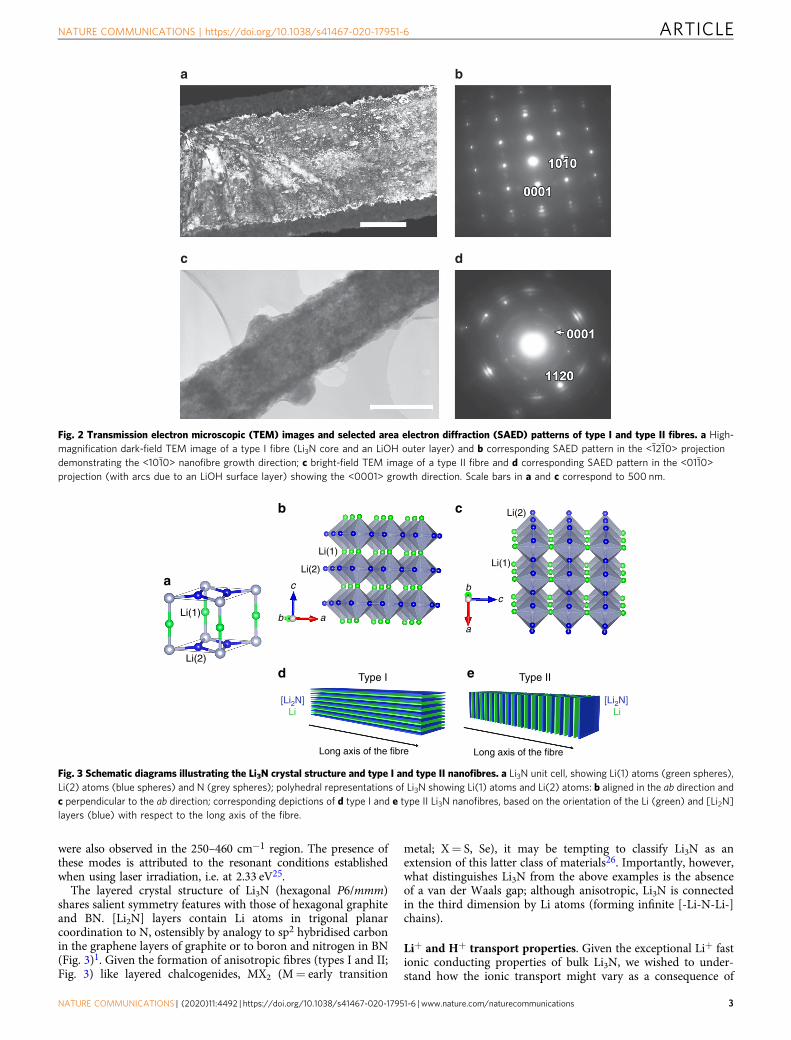
Two types of single-crystalline straight fibres with differentgrowth orientations (I and II) form under varying reactionconditions (see Supplementary Tables 1 and 2): type I nanofibres(Fig. 2a, b) exhibit a growth direction of <10�10>, whereas,conversely, type II nanofibres exhibit a growth direction of <0001>(Fig. 2c, d). Typically, type II nanofibres were found together witha few fibres and nanosheets with zig-zag morphology (Supple-mentary Figs. 4 and 5). Thus Li3N nanofibres exist in which thehexagonal [Li2N] layers are stacked either parallel or perpendi-cular to the principal fibre axis. Carbon nanofibres can assemble inan analogous fashion, where graphene layers can be orientedeither perpendicular or parallel to the principal fibre axis10,11. Ourexperimental evidence shows that the pressure within the reactionvessel is likely to be the crucial parameter for the preferentialgrowth of type I and II nanofibres, i.e. under identical reactiontimes and temperature, type II fibres will be favoured over type Ifibres at higher reaction pressures (Supplementary Tables 1 and 2).There are several examples in the literature that describe how thetotal pressure and/or precursor partial pressure can control thegrowth direction of fibres; these preferences can be boththermodynamically and kinetically driven12. Indeed, in thisrespect, our density functional theory (DFT) calculations suggestthat type I nanofibres (−325.44 eV Li3N unit−1 see “Methods”)are more thermodynamically stable than the equivalent type IIfibres (−324.59 eV Li3N unit−1). The dependence of growthdirection on seed concentration in layered BN and GaN fibreshas been previously reported13,14. Moreover, it has been welldocumented that nanowire growth direction is directly impactedby pressure across diverse systems of varying complexity (e.g. insemiconductors such as Si, In2O3 and InN)15–18. One mightexpect an increased Li seed concentration at elevated reactionpressure. An increase in N2 partial pressure (concentration)and the N:Li ratio at the growth interface should lead to theformation of Li-N planes and type II fibre propagation. Localvariation in pressure and N:Li stoichiometry might, therefore,account for the formation of zig-zag (kinked) nanofibres andsheets observed in type II samples (Supplementary Figs. 4 and 5);analogous behaviour has been noted for Si and InN nanowires, forexample16,17.
Raman spectra from nanostructured Li3N (fibres type I and typeII) and bulk Li3N showed one prominent peak at ca. 580 cm−1,attributable to the only Raman active mode of Li3N, i.e. E2g(Supplementary Fig. 6). This phonon mode corresponds to thedisplacement of the Li(2) and N atoms along the ab plane inLi3N19 and is consistent with group theory predictions and thespectra of bulk Li3N20. We found that the E2g mode band wasslightly blue-shifted (by ca. 5 cm−1) with respect to the bulk forboth type I and type II fibres. Raman spectra of microcrystals ofstructurally similar graphite and BN21,22 and of BN nanotubes23
also revealed that the E2g band broadens and shifts to a higherfrequency as particle size decreases. Ab-initio calculations on BNsingle-walled nanotubes attribute the blue shift in the E2g mode (of5 cm−1) to a shortening of the sp2 bonds with respect to the bulk23.The additional bands observed at ca. 500 cm−1 and 650 cm−1 inboth bulk and nanoscale Li3N samples were assigned to theacoustic (A) and optical phonon (O) modes 2 TA (z, K), 2 TO(A)and 2 LA(A) (T= transverse, L= longitudinal) by direct compar-ison with the second-order Raman spectra of Li3N19,24. Bandscorresponding to the second-order phonon mode (2 LA (M, K))
a b
Fig. 1 SEM micrographs of typical Li3N nanofibres (type I) at differentmagnifications. Images are taken at: a ×500 and b ×5000. Scale barscorrespond to 50 μm (a) and 5 μm (b).
ARTICLE NATURE COMMUNICATIONS | https://doi.org/10.1038/s41467-020-17951-6
2 NATURE COMMUNICATIONS | (2020) 11:4492 | https://doi.org/10.1038/s41467-020-17951-6 | www.nature.com/naturecommunications
were also observed in the 250–460 cm−1 region. The presence ofthese modes is attributed to the resonant conditions establishedwhen using laser irradiation, i.e. at 2.33 eV25.
The layered crystal structure of Li3N (hexagonal P6/mmm)shares salient symmetry features with those of hexagonal graphiteand BN. [Li2N] layers contain Li atoms in trigonal planarcoordination to N, ostensibly by analogy to sp2 hybridised carbonin the graphene layers of graphite or to boron and nitrogen in BN(Fig. 3)1. Given the formation of anisotropic fibres (types I and II;Fig. 3) like layered chalcogenides, MX2 (M= early transition
metal; X= S, Se), it may be tempting to classify Li3N as anextension of this latter class of materials26. Importantly, however,what distinguishes Li3N from the above examples is the absenceof a van der Waals gap; although anisotropic, Li3N is connectedin the third dimension by Li atoms (forming infinite [-Li-N-Li-]chains).
Li+ and H+ transport properties. Given the exceptional Li+ fastionic conducting properties of bulk Li3N, we wished to under-stand how the ionic transport might vary as a consequence of
d
a b
c
Fig. 2 Transmission electron microscopic (TEM) images and selected area electron diffraction (SAED) patterns of type I and type II fibres. a High-magnification dark-field TEM image of a type I fibre (Li3N core and an LiOH outer layer) and b corresponding SAED pattern in the <1210> projectiondemonstrating the <1010> nanofibre growth direction; c bright-field TEM image of a type II fibre and d corresponding SAED pattern in the <0110>projection (with arcs due to an LiOH surface layer) showing the <0001> growth direction. Scale bars in a and c correspond to 500 nm.
Li(1)
Li(2)
b c
e
Li(1)
Li(2)
a
cb
d
Long axis of the fibre
Li[Li2N]
Type I
Li(2)
Li(1)
c
ab
Long axis of the fibre
Type II
[Li2N]Li
a
Fig. 3 Schematic diagrams illustrating the Li3N crystal structure and type I and type II nanofibres. a Li3N unit cell, showing Li(1) atoms (green spheres),Li(2) atoms (blue spheres) and N (grey spheres); polyhedral representations of Li3N showing Li(1) atoms and Li(2) atoms: b aligned in the ab direction andc perpendicular to the ab direction; corresponding depictions of d type I and e type II Li3N nanofibres, based on the orientation of the Li (green) and [Li2N]layers (blue) with respect to the long axis of the fibre.
NATURE COMMUNICATIONS | https://doi.org/10.1038/s41467-020-17951-6 ARTICLE
NATURE COMMUNICATIONS | (2020) 11:4492 | https://doi.org/10.1038/s41467-020-17951-6 | www.nature.com/naturecommunications 3

nanostructuring. Variable-temperature wideline 7Li solid-statenuclear magnetic resonance (NMR) measurements between 133and 373 K enabled the local structure of the type I and type IInanofibres to be probed and allowed the Li+ ion transportproperties of the Li3N nanofibres to be determined (Fig. 4, Sup-plementary Note 2 and Supplementary Figs. 7 and 8). The linenarrowing observed particularly for the Li(2) satellite linesbetween 133 and 293 K can be interpreted in terms of intra-layerLi+ diffusion, by analogy with the corresponding behaviourfor bulk Li3N27. Similarly, the broadening that occurs >293 Kand eventually causes both sets of satellites to disappear intothe baseline results from inter-layer diffusion via an exchangeof Li+ between the Li(1) and Li(2) sites. Assuming simpleArrhenius behaviour, the activation energy for the former intra-layer process can be measured from the temperature variation ofthe linewidth and was found to be 0.075 and 0.053 eV for type Iand II Li3N nanofibres, respectively, which should be comparedwith the value of 0.121 eV, previously obtained for bulk Li3N28
(Supplementary Table 3). Hence, Li+ ion hopping becomes more
facile within the Li-N planes as a result of nanofibre formation.Electrochemical impedance spectroscopic measurements wereattempted on these samples to corroborate the conductivityresults obtained by NMR. However, the high temperaturesrequired to sinter pellets pressed from the Li3N nanofibres (i.e. toreduce grain boundary resistances) compromised their nanos-tructured morphology, so although high values of conductivitycould be obtained (ca. 1 × 10⁻³ S cm−1), we could not treat thedata obtained as representative of the fibres.
High Li+ ion conductivity is a fundamental requirement forsolid electrolytes to compete against organic electrolytes inlithium-ion batteries. To date, only a few sulfide-type electrolyteshave shown comparable ionic conductivities to commercialorganic electrolytes29. Thus nanostructuring of solid electrolytesmight be a plausible approach to increase ionic conductivity. Thisfield is only at its infancy, with most of the work conducted onthe Li7La3Zr2O12 garnet solid electrolyte (as a sintered ceramic oras an inorganic filler component in solid composite polymerelectrolytes)30. Nevertheless, given the low decompositionpotential of Li3N (ca. 0.45 V vs. Li+/Li)31 and the enhancedelectronic conductivity expected in these nanostructured materi-als when compared to the bulk (see “DFT calculations” section),the use of Li3N as a solid electrolyte seems implausible from apractical point of view. On the other hand, in lithium-containinghydrogen storage materials, e.g. the lithium amide–lithium imidesystem, proton mobility has been intrinsically linked to Li+ iondiffusion32. Hence, we expected that the high Li+ ion mobilityobserved in these Li3N nanofibres may lead to improvedhydrogen absorption properties.
Preliminary volumetric experiments to determine the hydrogenuptake properties of the nanostructured Li3N material wereconducted by differential pressure analysis (DPA). As comparedto bulk samples of highly crystalline, single-phase Li3N, the initialH2 uptake for the nano-Li3N material was found to be lower (8.9vs. 10.5 wt%). The latter uptake is typical for pristine bulkmaterial and matches the theoretical capacity from a two-stepreaction mechanism (Eq. 2)6:
Li3Nþ 2H2 $ Li2NHþ LiHþH2 $ LiNH2 þ 2LiH: ð2ÞOne might postulate that the reduction in initial gravimetric
capacity in the nanofibres is a result of surface hydrolysis(passivation) on handling in air (as observed from transmissionelectron microscopy (TEM)/selected area electron diffractionexperiments; Supplementary Note 1 and Supplementary Fig. 9).Nevertheless, there is a greater than threefold increase in the rateof hydrogen sorption for nanocrystalline Li3N with respect to thebulk material in the first cycle, which dramatically improvesfurther in subsequent uptake cycles (Supplementary Fig. 10). Themicrostructure of the dehydrogenated nitride is retained throughcycling (from imide to amide and vice versa) and hence the (de)hydrogenation process is pseudomorphic and reversible (Supple-mentary Fig. 11). The enhanced hydrogen uptake behaviour ofthe nanofibres is broadly analogous to the uptake kineticsobserved when Li3N is impregnated in mesoporous carbon orused in carbon nanocomposites (also at a reduced sorptiontemperature of 200 °C and which exhibit a hydrogen desorptionenthalpy that is half that of the bulk material)33. Unlike thesecomposites, however, the nanofibres do not suffer from thegravimetric capacity penalty imposed by an inactive component.Computational studies have demonstrated that pseudo-molecular(Li3N)n (n= 1–7) clusters would bind H2 via coordinativelyunsaturated Li atoms with an adsorption energy approximatelyan order of magnitude smaller than that of the bulk material34. Byextension, earlier DFT calculations show that the most favourableadsorption sites for both H2 and dissociated H atoms are to Npositions on the (001) surface of Li3N35. Semi-quantitatively at
Type I Type II
4000 2000 0 –2000 –4000 4000 2000 0 –2000 –4000
133
173
213
253
293
333
373
T (K)
a
b
2 3 4 5 6 7 8 9
103 T–1 (K–1)
103
104
Li(2
) sa
telli
te li
new
idth
(kH
z)
�(7Li) (ppm) �(7Li) (ppm)
1 12 2
Fig. 4 7Li NMR characterisation at variable temperatures of type I and IIfibres. a Variable-temperature (VT) wideline 7Li NMR spectra recordedbetween 133 and 373 K for type I (left) and type II (right) Li3N nanofibres. 1and 2 denote satellite bands for the two-coordinate Li(1) site and three-coordinate Li(2) site, respectively; b temperature variation of the linewidthof the Li(2) satellites for type I (magenta) and II (blue) Li3N nanofibres andbulk Li3N (red)28 extracted from the VT NMR by fitting a simulated powderlineshape.
ARTICLE NATURE COMMUNICATIONS | https://doi.org/10.1038/s41467-020-17951-6
4 NATURE COMMUNICATIONS | (2020) 11:4492 | https://doi.org/10.1038/s41467-020-17951-6 | www.nature.com/naturecommunications
least, both prior studies would indicate that fabrication of narrownanofibres or thin nanosheets of Li3N should produce storagematerials with improved sorption kinetics. Thus the design andoptimisation of anisotropic Li-N(-H) nanomaterials could prove auseful strategy towards attaining a storage solution that meets thechallenging criteria required for implementing hydrogen as a fuelfor transport. Further studies should establish whether this isindeed the case.
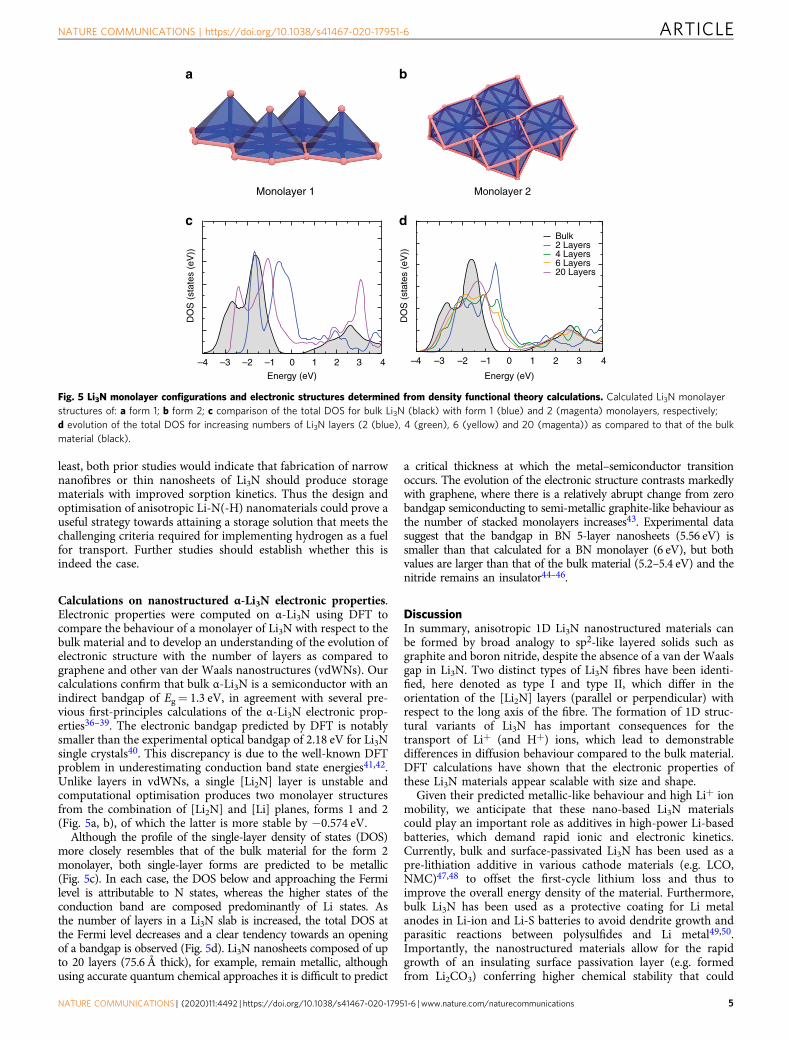
Calculations on nanostructured α-Li3N electronic properties.Electronic properties were computed on α-Li3N using DFT tocompare the behaviour of a monolayer of Li3N with respect to thebulk material and to develop an understanding of the evolution ofelectronic structure with the number of layers as compared tographene and other van der Waals nanostructures (vdWNs). Ourcalculations confirm that bulk α-Li3N is a semiconductor with anindirect bandgap of Eg= 1.3 eV, in agreement with several pre-vious first-principles calculations of the α-Li3N electronic prop-erties36–39. The electronic bandgap predicted by DFT is notablysmaller than the experimental optical bandgap of 2.18 eV for Li3Nsingle crystals40. This discrepancy is due to the well-known DFTproblem in underestimating conduction band state energies41,42.Unlike layers in vdWNs, a single [Li2N] layer is unstable andcomputational optimisation produces two monolayer structuresfrom the combination of [Li2N] and [Li] planes, forms 1 and 2(Fig. 5a, b), of which the latter is more stable by −0.574 eV.
Although the profile of the single-layer density of states (DOS)more closely resembles that of the bulk material for the form 2monolayer, both single-layer forms are predicted to be metallic(Fig. 5c). In each case, the DOS below and approaching the Fermilevel is attributable to N states, whereas the higher states of theconduction band are composed predominantly of Li states. Asthe number of layers in a Li3N slab is increased, the total DOS atthe Fermi level decreases and a clear tendency towards an openingof a bandgap is observed (Fig. 5d). Li3N nanosheets composed of upto 20 layers (75.6 Å thick), for example, remain metallic, althoughusing accurate quantum chemical approaches it is difficult to predict
a critical thickness at which the metal–semiconductor transitionoccurs. The evolution of the electronic structure contrasts markedlywith graphene, where there is a relatively abrupt change from zerobandgap semiconducting to semi-metallic graphite-like behaviour asthe number of stacked monolayers increases43. Experimental datasuggest that the bandgap in BN 5-layer nanosheets (5.56 eV) issmaller than that calculated for a BN monolayer (6 eV), but bothvalues are larger than that of the bulk material (5.2–5.4 eV) and thenitride remains an insulator44–46.
DiscussionIn summary, anisotropic 1D Li3N nanostructured materials canbe formed by broad analogy to sp2-like layered solids such asgraphite and boron nitride, despite the absence of a van der Waalsgap in Li3N. Two distinct types of Li3N fibres have been identi-fied, here denoted as type I and type II, which differ in theorientation of the [Li2N] layers (parallel or perpendicular) withrespect to the long axis of the fibre. The formation of 1D struc-tural variants of Li3N has important consequences for thetransport of Li+ (and H+) ions, which lead to demonstrabledifferences in diffusion behaviour compared to the bulk material.DFT calculations have shown that the electronic properties ofthese Li3N materials appear scalable with size and shape.
Given their predicted metallic-like behaviour and high Li+ ionmobility, we anticipate that these nano-based Li3N materialscould play an important role as additives in high-power Li-basedbatteries, which demand rapid ionic and electronic kinetics.Currently, bulk and surface-passivated Li3N has been used as apre-lithiation additive in various cathode materials (e.g. LCO,NMC)47,48 to offset the first-cycle lithium loss and thus toimprove the overall energy density of the material. Furthermore,bulk Li3N has been used as a protective coating for Li metalanodes in Li-ion and Li-S batteries to avoid dendrite growth andparasitic reactions between polysulfides and Li metal49,50.Importantly, the nanostructured materials allow for the rapidgrowth of an insulating surface passivation layer (e.g. formedfrom Li2CO3) conferring higher chemical stability that could
a b
c d
Monolayer 1 Monolayer 2
DO
S (
stat
es (
eV))
Energy (eV)
–4 –3 –2 –1 0 1 2 43
Bulk2 Layers4 Layers6 Layers20 Layers
DO
S (
stat
es (
eV))
Energy (eV)
–4 –3 –2 –1 0 1 2 43
Fig. 5 Li3N monolayer configurations and electronic structures determined from density functional theory calculations. Calculated Li3N monolayerstructures of: a form 1; b form 2; c comparison of the total DOS for bulk Li3N (black) with form 1 (blue) and 2 (magenta) monolayers, respectively;d evolution of the total DOS for increasing numbers of Li3N layers (2 (blue), 4 (green), 6 (yellow) and 20 (magenta)) as compared to that of the bulkmaterial (black).
NATURE COMMUNICATIONS | https://doi.org/10.1038/s41467-020-17951-6 ARTICLE
NATURE COMMUNICATIONS | (2020) 11:4492 | https://doi.org/10.1038/s41467-020-17951-6 | www.nature.com/naturecommunications 5

eliminate reactions at the electrolyte interface. From a differentperspective, the superior Li+ ion diffusion in the Li3N nanofibersleads to improved hydrogen absorption/desorption properties inthe Li–N–H system given the intrinsic relationship betweenproton and lithium-ion conduction in this system. Thus, byanalogy, it may be conceivable to revisit other materials related tothe Li–N–H family of compounds to explore the impact ofnanoscaling on hydrogen storage and generation more widely.
Our studies clearly demonstrate that combining an s-blockelement with nitrogen under the appropriate synthetic conditionscan lead to the formation of anisotropic nanomaterials. Nanos-tructuring has a palpable influence on many chemical and phy-sical properties in the Li–N system and there are likely to be otherexciting phenomena and behaviours to be discovered. We expectthat this work will stimulate further research on this system andthose containing other s-block elements.
MethodsSynthesis of type I Li3N nanofibres. α-Li3N (ca. 0.1 g) prepared from the nitri-dation of a sodium/lithium alloy28 was contained within an iron foil liner that wasplaced inside a stainless-steel crucible. The crucible was suspended by an iron wireinside a long, 3 cm internal diameter stainless-steel reaction vessel that was water-cooled at the upper end. The vessel was evacuated to a pressure of ca. 5 Pa (a rangeof 4–6.7 Pa), then sealed and heated to 1023–1073 K in a vertical furnace for 6 days.Finally, the furnace was cooled to room temperature. Supplementary Table 1provides detailed reaction conditions for each of the syntheses performed thatyielded type I Li3N nanofibres.
Synthesis of type II Li3N nanofibres. α-Li3N (ca. 0.1 g) prepared from thenitridation of a sodium/lithium alloy28 was contained within an iron foil liner thatwas placed inside a stainless-steel crucible. The crucible was suspended by an ironwire inside a long, 1.5 cm internal diameter stainless steel reaction vessel that waswater-cooled at the upper end. The vessel was evacuated to a pressure of ca. 10 Pa(a range of 9.3–10.7 Pa), then sealed and heated to 1023–1043 K in a verticalfurnace for 6 days. Finally, the furnace was cooled to room temperature. Supple-mentary Table 2 shows detailed reaction conditions for each of the synthesesperformed that yielded type II Li3N nanofibres.
The handling of the reactants and products took place in a nitrogen-filledglovebox (Saffron Scientific Ltd.; O2 < 5 ppm; H2O < 10 ppm) during the synthesesof both types of nanofibres. In both cases, on cooling, red/dark purple fibrousmaterial (10–40 mg) was found deposited on the Fe wire above the reactioncrucible. EDX spectra of all nanomaterials reveal peaks only from nitrogen (andoxygen from brief air exposure). Given that Li is not detectable by EDX and that nopeaks from lithium metal (or other Li-containing phases) are observed in solid-state NMR spectra, the results are consistent with the presence of single-phaseLi3N. The absence of metal impurity peaks corroborates a self-assisted growthmechanism.
Powder X-ray diffraction. PXD data were collected using a Philips X’Pert θ–2θdiffractometer with a PW3710 control unit using Cu Kα radiation (λ= 1.5418 Å),operating at 40 kV and 40 mA. Samples were run within a bespoke air-tight alu-minium holder with Mylar windows51. Data were collected in the range from 5 to80° 2θ in steps of 0.025° s−1. Sample preparation for analysis took place in an N2-filled glovebox. Lattice parameters were refined by least-squares fitting using theCELL software package52.
Scanning electron microscopy (SEM). A Philips XL30 ESEM-FEG instrumentwas used for SEM and EDX characterisation. Experiments were performed in highvacuum mode with an applied accelerating voltage of 15 kV. Samples were loadedonto aluminium stubs using adhesive carbon tabs and the transfer was performedunder a stream of flowing N2 gas.
Atomic force microscopy. AFM sample preparation consisted of dispersing thesamples in n-propyl acetate in an Ar-filled glove box. Then a droplet of the con-centrated Li3N solution was placed onto a silicon wafer for measurement. AFManalyses were carried out using a Keysight 5500 instrument in tapping mode toproduce topographical information of the samples.
Transmission electron microscopy. TEM analyses were performed using differ-ent instruments under varying operating conditions. Measurements performed at80 kV were conducted using a JEOL JEM-2200MCO FEGTE. Samples were loadedin an N2-filled glovebox onto a custom-made air-tight holder to minimise airexposure during transfer. Analyses performed at 200 kV were made using either aJEOL JEM-2000FX II TEM or an FEI Tecnai G2 20 TEM. TEM samples were
prepared by depositing the Li3N dry onto a 3-mm holey carbon film copper grid inan N2-filled glovebox. Each grid was placed within a sealed container and trans-ferred to the instrument under a stream of N2. In both cases, a small condenseraperture was used to reduce beam damage (the result of which is evident inSupplementary Fig. 12) and evaporation due to the instability of nanoscale Li3Nunder the beam.
7Li NMR spectroscopy. Wideline 7Li NMR spectra of Li3N nanomaterials wererecorded from 133 to 453 K at a Larmor frequency of 116.6 MHz on a VarianInfinityPlus Spectrometer equipped with a single-resonance broadband probe.Spectra were obtained using an EXORCYCLED solid-echo sequence with π/2pulses of 1.3 µs and an echo delay of 16.0 µs. Relaxation delays between 0.5 and 10 swere used depending on the temperature. Chemical shifts are referenced externallyto aqueous LiCl.
Raman spectroscopy. Raman spectra were collected using a Horiba-Yvon Lab-Ram HR spectrometer with a confocal microscope at room temperature using a532-nm laser with a 600 g mm−1 grating and a Synapse CCD detector. Sampleswere mounted in sealed glass capillaries in an N2-filled glovebox to avoid airexposure. A ten times reduced incident laser power (15 mW) was used togetherwith a 100-nm aperture to avoid damaging the material under the beam duringanalysis.
Hydrogen storage measurements. Volumetric hydrogen uptake measurementswere performed by loading ca. 0.2 g sample into a Swagelock tube in an N2-filledglovebox and sealed using parafilm. The tube was connected to the DPA appara-tus53 and the parafilm was seal-broken using a flow of helium gas. The sample wasevacuated before exposure to hydrogen and heated to the reaction temperature.H2(g) and He(g) were dried using a liquid nitrogen trap before use. Hydrogen uptakewas performed at 10 bar at 200 °C. After reaching equilibrium, the sample wasdesorbed at 200 °C before performing the next absorption cycle.
DFT calculations. Electronic properties of bulk and nano-sheets of α-Li3N werecalculated at the gradient-corrected DFT level by applying thePerdew–Burke–Ernzerhof54 exchange-correlation functional as implemented in theSIESTA program package55. Electronic states were expanded by a double-ζ pluspolarisation basis set with norm-conserving Troullier–Martins pseudopotentials56
for the description of core levels and a plane-wave representation of the chargedensity with a cut-off of 240 Ry. The reciprocal space was sampled by aMonkhorst–Pack grid57 of 16 × 16 × 32 k-points in the Brillouin zone (16 × 16 × 1k-points in the case of nanosheets). Models of nanosheets are composed of anincreasing number of unit cell replicas constructed in the direction perpendicularto the nano-sheet plane and a 15-Å-thick vacuum region. Geometries of all systemswere relaxed until a maximum gradient of 0.02 eV Å−1 on forces was reached. Inthe calculations of the total energies of type I and type II nanofibres, the modelstructures were built with an increasing number of replicas of the unit cell in thenon-periodic directions to achieve the convergence in terms of energy per numberof replicas (14 replicas were used for type I nanofibre and 8 × 8 for type IInanofibre). An MP k-points sampling with 16 k-points in the periodic directionshas been applied (two directions for type I nanofibre and one direction for type IInanofibre).
Data availabilityThe authors declare that the data supporting the findings of this study are availablewithin the paper and its supplementary information files.
Received: 14 November 2018; Accepted: 28 July 2020;
References1. Boukamp, B. A. & Huggins, R. A. Fast ionic conductivity in lithium nitride.
Mater. Res. Bull. 13, 23–32 (1978).2. Shodai, T., Okada, S., Tobishima, S. & Yamaki, J. Study of Li3-xMxN (M: Co,
Ni or Cu) system for use as anode material in lithium rechargeable cells. SolidState Ionics 86–88, 785–789 (1996).
3. Hu, Y. H. & Huo, Y. Fast and exothermic reaction of CO2 and Li3N into C-N-containing solid materials. J. Phys. Chem. A 115, 11678–11681 (2011).
4. Duan, L. et al. Thermally decomposable lithium nitride as an electroninjection material for highly efficient and stable OLEDs. J. Phys. Chem. C 113,13386–13390 (2009).
5. Baldwin, F. P., Blanchard, E. J. & Koenig, P. E. Metal nitrides in organicreactions. I. Reactions of lithium nitride with acid chlorides. Preparation of N,N-diacylamides. J. Org. Chem. 30, 671–673 (1965).
6. Chen, P., Xiong, Z., Luo, J., Lin, J. & Tan, K. L. Interaction of hydrogen withmetal nitrides and imides. Nature 420, 302–304 (2002).
ARTICLE NATURE COMMUNICATIONS | https://doi.org/10.1038/s41467-020-17951-6
6 NATURE COMMUNICATIONS | (2020) 11:4492 | https://doi.org/10.1038/s41467-020-17951-6 | www.nature.com/naturecommunications

7. Adams, P. F., Hubberstey & P. Pulham, R. J. Review of the solubility ofnonmetals in liquid lithium. J. Less-Common Met. 42, 1–11 (1975).
8. Kimura, H., Asano, M. & Kubo, K. Vaporization of solid lithium nitride. J.Nucl. Mater. 91, 200–204 (1980).
9. Stach, E. A. et al. Watching GaN nanowires grow. Nano Lett. 3, 867–869(2003).
10. Rodriguez, N. M., Chambers, A. & Baker, R. T. K. Catalytic engineering ofcarbon nanostructures. Langmuir 11, 3862–3866 (1995).
11. Che, G., Lakshmi, B. B., Martin, C. R. & Fisher, E. R. Chemical vapordeposition based synthesis of carbon nanotubes and nanofibres using atemplate method. Chem. Mater. 10, 260–267 (1998).
12. Fortuna, S. A. & Li, X. Metal-catalysed semiconductor nanowires: a reviewon the control of growth directions. Semicond. Sci. Technol. 25, 024005(2010).
13. Tang, D.-M., Liu, C. & Chen, H.-M. Controlled synthesis of quasi-one-dimensional boron nitride nanostructures. J. Mater. Res. 22, 2809–2816(2007).
14. Kuykendall, T. R., Altoe, M. V. P., Ogletree, F. & Aloni, S. Catalyst-directedcrystallographic orientation control of GaN nanowire growth. Nano Lett. 14,6767–6773 (2014).
15. Lugstein, A. et al. Pressure-induced orientation control of the growth ofepitaxial silicon nanowires. Nano Lett. 8, 2310–2314 (2008).
16. Madras, P., Dailey, E. & Drucker, J. Kinetically induced kinking of vapor-liquid-solid grown epitaxial Si nanowires. Nano Lett. 9, 3826–3830 (2009).
17. Liu, H. et al. Reactant-governing growth direction of indium nitridenanowires. Nanotechnology 21, 245601 (2010).
18. Shen, Y. et al. Size-induced switching of nanowire growth direction: a newapproach toward kinked nanostructures. Adv. Funct. Mater. 26, 3687–3695(2016).
19. Chandrasekhar, H. R., Bhattacharya, G., Migoni, R. & Bilz, H. Infrared andRaman spectra and lattice dynamics of the superionic conductor lithiumnitride (Li3N). Phys. Rev. B 17, 884–893 (1978).
20. Chandrasekhar, H. R., Bhattacharya, G., Migoni, R. & Bilz, H. Phonon spectraand lattice dynamics of lithium nitride. Solid State Commun. 22, 681–684(1977).
21. Nemanich, R. J. & Solin, S. A. First- and second-order Raman scattering fromfinite-size crystals of graphite. Phys. Rev. B 20, 392–401 (1979).
22. Nemanich, R. J., Solin, S. A. & Martin, R. M. Light scattering study of boronnitride microcrystals. Phys. Rev. B 23, 6348–6356 (1981).
23. Arenal, R. et al. Raman spectroscopy of single-wall boron nitride nanotubes.Nano Lett. 6, 1812–1816 (2006).
24. Kress, W., Grimm, H., Press, W. & Lefebvre, J. Lattice vibrations in lithiumnitride, Li3N. Phys. Rev. B 22, 4620–4625 (1980).
25. Nesheva, D. Raman scattering from semiconductor nanoparticles andsuperlattices. J. Optoelectron. Adv. Mater. 7, 185–192 (2005).
26. Tenne, R. Inorganic nanotubes and fullerene-like materials. Chem. Eur. J. 8,5296–5304 (2002).
27. Messer, R., Birli, H. & Differt, K. NMR study of diffusion in Li3N. J. Phys. CSolid State 14, 2731–2746 (1981).
28. Stoeva, Z., Gomez, R., Gregory, D. H., Hix, G. B. & Titman, J. J. Evolution ofstructure, transport properties and magnetism in ternary lithiumnitridometalates Li3-x-yMxN, M = Co, Ni, Cu. Dalton Trans. 3093–3097(2004).
29. Jiang, C., Li, H. & Wang, C. Recent progress in solid-state electrolytes foralkali-ion batteries. Sci. Bull. 62, 1473–1490 (2017).
30. Chan, C. K., Yang, T. J. & Weller, J. M. Nanostructured garnet-typeLi7La3Zr2O12: synthesis, properties and opportunities as electrolytes for Li-ionbatteries. Electrochim. Acta 253, 268–280 (2017).
31. Rabenau, A. Lithium nitride and related materials case study of the use ofmodern solid state research techniques. Solid State Ionics 6, 277–293 (1982).
32. David, W. I. F. et al. A mechanism for non-stoichiometry in the lithiumamide/lithium imide hydrogen storage reaction. J. Am. Chem. Soc. 129,1594–1601 (2007).
33. Demir-Cakan, R., Tang, W. S., Darwiche & Janot, A. R. Modification of thehydrogen storage properties of Li3N by confinement into mesoporouscarbons. Energy Environ. Sci. 4, 3625–3631 (2011).
34. Jiang, Z. P., Zhou, X., Sun, Q., Wang, Q. & Jena, P. Geometry, electronicproperties, and hydrogen adsorption properties of Li3N-based nanostructures.J. Phys. Chem. C 14, 19202–19205 (2010).
35. Jin, H. M., Luo, J. Z. & Wu, P. Adsorption and dissociation of hydrogenon Li3N surface: a first principles study. Appl. Phys. Lett. 90, 084101(2007).
36. Wu, S., Neo, S. S., Dong, Z., Boey, F. & Wu, P. Tunable ionic and electronicconduction of lithium nitride via phosphorus and arsenic substitution: a first-principles study. J. Phys. Chem. C 114, 16706–16709 (2010).
37. Zhao, Y., Tian, X., Xue, W. & Gao, T. The structure, dynamical andthermodynamic properties of α-Li3N: a first-principles study. Solid StateCommun. 149, 2130–2134 (2009).
38. Baumeier, B., Kruger, P., Pollmann, J. & Vajenine, G. V. Electronic structureof alkali-metal fluorides, oxides, and nitrides: density-functional calculationsincluding self-interaction corrections. Phys. Rev. B 78, 125111 (2008).
39. Dovesi, R., Pisani, C., Ricca, F., Roetti, C. & Suanders, V. R. Hartree-Fockstudy of crystalline lithium nitride. Phys. Rev. B 30, 972–979 (1984).
40. Brendecke, H. & Bludau, W. Photoluminescence properties of lithium nitride.Phys. Rev. B 21, 805–815 (1980).
41. Sham, L. J. & Schlüter, M. Density-functional theory of the band gap. Phys.Rev. B 32, 3883–3889 (1985).
42. Sham, L. J. & Schlüter, M. Density-functional theory of the energy gap. Phys.Rev. Lett. 51, 1888–1891 (1983).
43. Partoens, B. & Peeters, F. M. From graphene to graphite: electronic structurearound the K point. Phys. Rev. B 74, 075404 (2006).
44. Song, L. et al. Large scale growth and characterization of atomic hexagonalboron nitride layers. Nano Lett. 10, 3209–3215 (2010).
45. Blase, X. et al. Quasiparticle band structure of bulk hexagonal boron nitrideand related systems. Phys. Rev. B 51, 6868–6875 (1995).
46. Hoffman, D. M., Doll, G. L. & Eklund, P. C. Optical properties of pyrolyticboron nitride in the energy range 0.05—10 eV. Phys. Rev. B 30, 6051–6056(1984).
47. Sun, Y. et al. Stabilised Li3N for efficient battery cathode prelithiation. EnergyStorage Mater. 6, 119–124 (2017).
48. Bian, Z. et al. Dual roles of Li3N as an electrode additive for Li-excess layeredcathode materials: a Li-ion sacrificial salt and electrode-stabilizing agent.Chem. Eur. J. 24, 13815–13820 (2018).
49. Park, K. & Goodenough, J. B. Dendrite-suppressed lithium plating from aliquid electrolyte via wetting of Li3N. Adv. Energy Mater. 7, 1700732 (2017).
50. Baloch, M. et al. Variations on Li3N protective coating using ex-situ and in-situ techniques for Li° in sulphur batteries. Energy Storage Mater. 9, 141–149(2017).
51. Barker, M. G., Begley, M. J., Edwards, P. P., Gregory, D. H. & Smith, S. E.Synthesis and crystal structures of the new ternary nitrides Sr3CrN3 andBa3CrN3. J. Chem. Soc. Dalton Trans. 1–5 (1996).
52. Holland, T. J. B. & Redfern, S. A. T. Unit cell refinement from powderdiffraction data: the use of regression diagnostics. Mineral. Mag. 61, 65–77(1997).
53. Blackman, J. M., Patrick, J. W. & Snape, C. P. An accurate volumetricdifferential pressure method for the determination of hydrogen storagecapacity at high pressures in carbon materials. Carbon 44, 918–927 (2006).
54. Perdew, J., Burke, K. & Ernzerhof, M. Generalized gradient approximationmade simple. Phys. Rev. Lett. 77, 3865–3868 (1996).
55. Soler, J. M. et al. The SIESTA method for ab initio order-N materialssimulation. J. Phys. Condens. Matter 14, 2745 (2002).
56. Troullier, N. & Martins, J. L. Efficient pseudopotentials for plane-wavecalculations. Phys. Rev. B 43, 1993 (1991).
57. Monkhorst, H. J. & Pack, J. D. Special points for Brillouin-zone integrations.Phys. Rev. B 13, 5188–5192 (1976).
AcknowledgementsD.H.G. acknowledges the EPSRC for financial support under grants GR/S26965 and EP/E040071, the University of Nottingham for studentships to A.G.G. and H.K.E., theUniversity of Glasgow for a studentship to C.W.D. and ScotCHEM for a studentship toN.T.-R. E.B. acknowledges a New Directions for EPSRC Research Leaders Award (EP/G005060), the European Research Council under the European Union’s Seventh Fra-mework Programme (FP7)/ERC grant agreement No. 307755-FIN and a Royal SocietyWolfson Fellowship for financial support. M.B. and E.B. acknowledge the use of Athenaat HPC Midlands+, which was funded by the EPSRC on grant EP/P020232/1 as part ofthe HPC Midlands+ consortium.
Author contributionsN.T.-R., A.G.G., C.M.J. and C.W.D. developed the synthesis methods and characterisedmaterials by X-ray diffraction, spectroscopy and electron microscopy; H.K.E., P.D.B. andI.M. performed transmission electron microscopy and electron diffraction experimentsand analysed and interpreted these data; J.M.B., C.P.S., C.M.J. and N.T.-R. performedhydrogen uptake experiments, analysed and interpreted these data; M.B. and E.B. per-formed computational calculations, analysed, interpreted the data and prepared these forpublication; J.J.T. designed the solid-state NMR experiments and collected and inter-preted the NMR data; D.H.G. initiated and supervised the project and analysed andinterpreted the data. N.T.-R., J.J.T., E.B. and D.H.G. wrote the manuscript. All authorsdiscussed the results and commented on the paper.
Competing interestsThe authors declare no competing interests.
NATURE COMMUNICATIONS | https://doi.org/10.1038/s41467-020-17951-6 ARTICLE
NATURE COMMUNICATIONS | (2020) 11:4492 | https://doi.org/10.1038/s41467-020-17951-6 | www.nature.com/naturecommunications 7

Additional informationSupplementary information is available for this paper at https://doi.org/10.1038/s41467-020-17951-6.
Correspondence and requests for materials should be addressed to D.H.G.
Peer review information Nature Communications thanks Albert Davydov, MoneeshUpmanyu and the other anonymous reviewer(s) for their contribution to the peer reviewof this work.
Reprints and permission information is available at http://www.nature.com/reprints
Publisher’s note Springer Nature remains neutral with regard to jurisdictional claims inpublished maps and institutional affiliations.
Open Access This article is licensed under a Creative CommonsAttribution 4.0 International License, which permits use, sharing,
adaptation, distribution and reproduction in any medium or format, as long as you giveappropriate credit to the original author(s) and the source, provide a link to the CreativeCommons license, and indicate if changes were made. The images or other third partymaterial in this article are included in the article’s Creative Commons license, unlessindicated otherwise in a credit line to the material. If material is not included in thearticle’s Creative Commons license and your intended use is not permitted by statutoryregulation or exceeds the permitted use, you will need to obtain permission directly fromthe copyright holder. To view a copy of this license, visit http://creativecommons.org/licenses/by/4.0/.
© The Author(s) 2020
ARTICLE NATURE COMMUNICATIONS | https://doi.org/10.1038/s41467-020-17951-6
8 NATURE COMMUNICATIONS | (2020) 11:4492 | https://doi.org/10.1038/s41467-020-17951-6 | www.nature.com/naturecommunications