Louisiana Tourism Forecast - crt.state.la.us by travel and tourism activities in Louisiana. ... In...
45
Louisiana Tourism Forecast 2016-2019 Prepared for Louisiana Department of Culture, Recreation and Tourism By April 2016
Transcript of Louisiana Tourism Forecast - crt.state.la.us by travel and tourism activities in Louisiana. ... In...

Louisiana Tourism Forecast 2016-2019
Prepared for
Louisiana Department of Culture, Recreation and Tourism
By
April 2016
Louisiana Tourism Forecast 2016 - 2019
UNO Hospitality Research Center 2
Acknowledgments This report was prepared by Maria J. Ortiz, Project Manager in the Hospitality Research Center (HRC) at The University of New Orleans (UNO). Special recognition is given to Heidi Charters, Research Analyst, Karen Brakel, Project and Budget Coordinator, and Reese Templet, Student Research Assistant, for their collaboration. Gratitude goes to John A. Williams, Ph.D., Dean of the College of Business Administration, and Director of the Hospitality Research Center, for his valuable contribution to this project.
Thanks and appreciation also go to Lynne Coxwell, Research and Policy Analyst at Louisiana Department of Culture, Recreation and Tourism (CRT), who provided valuable information for this study.

Louisiana Tourism Forecast 2016 - 2019
UNO Hospitality Research Center 3
Table of Contents
EXECUTIVE SUMMARY ........................................................................................................... 6
INTRODUCTION ..................................................................................................................... 7
METHODOLOGY .................................................................................................................... 7
FORECAST RESULTS ............................................................................................................. 12
LOUISIANA ............................................................................................................................. 12
NEW ORLEANS ....................................................................................................................... 22
REST OF THE STATE ................................................................................................................ 27
INDIVIDUAL AREAS .............................................................................................................. 33
ALEXANDRIA .......................................................................................................................... 33
BATON ROUGE ....................................................................................................................... 34
LAFAYETTE ............................................................................................................................. 35
LAKE CHARLES ........................................................................................................................ 36
MONROE ................................................................................................................................ 37
SHREVEPORT .......................................................................................................................... 38
OTHER AREAS ......................................................................................................................... 39
APPENDIX A: FORECAST ACCURACY ..................................................................................... 40
APPENDIX B: SOURCES: ....................................................................................................... 42
APPENDIX C: DEFINITIONS OF KEY TERMS ............................................................................ 44
Louisiana Tourism Forecast 2016 - 2019
UNO Hospitality Research Center 4
List of Tables
Table 1: Louisiana Visitation and Spending (Domestic and Foreign) ........................................... 12
Table 2: Louisiana Tourism Indicators .......................................................................................... 14
Table 3: Tourism Employment Compared to Louisiana Employment by Segments (Top 10) ...... 17
Table 4: Tourism Value Added Compared to Louisiana GDP by Segments (Top 12).................... 18
Table 5: Louisiana State Taxes ...................................................................................................... 18
Table 6: Louisiana Visitation and Spending (Domestic) ................................................................ 20
Table 7: New Orleans Visitation and Spending (Domestic and Foreign) ...................................... 22
Table 8: New Orleans Tourism Indicators ..................................................................................... 23
Table 9: Louisiana State Taxes (Paid by New Orleans Visitors) .................................................... 24
Table 10: Rest of the State Visitation and Spending (Domestic and Foreign) .............................. 27
Table 11: Rest of the State Tourism Indicators ............................................................................. 28
Table 12: Louisiana State Taxes (Paid by Rest of the State Visitors) ............................................ 31
Table 13: Forecast Performance - Hotel Roomnights ................................................................... 40
Table 14: Forecast Performance - Airport Passengers ................................................................. 40
Table 15: Forecast Performance - Number of Visitors ................................................................. 41
Table 16: Forecast Performance - Visitor Spending ..................................................................... 41
Louisiana Tourism Forecast 2016 - 2019
UNO Hospitality Research Center 5
List of Figures
Figure 1: Louisiana Visitation and Spending ................................................................................. 12
Figure 2: Louisiana Visitor Type .................................................................................................... 13
Figure 3: Louisiana Spending Type ................................................................................................ 13
Figure 4: Louisiana Airport Passengers ......................................................................................... 14
Figure 5: Louisiana Hotel Roomnights .......................................................................................... 15
Figure 6: Louisiana Convention Roomnights ................................................................................ 15
Figure 7: Louisiana Tourism Employment (Direct and Indirect/Induced) .................................... 16
Figure 8: Louisiana Tourism Value Added (Direct and Indirect/Induced) .................................... 17
Figure 9: Louisiana Travel Indicators - Aggregates ....................................................................... 19
Figure 10: Louisiana Travel Indicators by Segments ..................................................................... 19
Figure 11: Louisiana Travel Decisions ........................................................................................... 20
Figure 12: Louisiana Travel Indicators .......................................................................................... 21
Figure 13: New Orleans Visitation and Spending ......................................................................... 22
Figure 14: New Orleans Airport Activity ....................................................................................... 23
Figure 15: New Orleans Hotel Roomnights - Primary Purpose .................................................... 24
Figure 16: New Orleans Visitors - Primary Purpose ...................................................................... 25
Figure 17: New Orleans Travel Indicators by Segments ............................................................... 25
Figure 18: New Orleans Travel Indicators ..................................................................................... 26
Figure 19: Rest of the State Visitation and Spending ................................................................... 27
Figure 20: Rest of the State Visitors - Primary Purpose ................................................................ 28
Figure 21: Rest of the State Airport Activity ................................................................................. 29
Figure 22: Rest of the State Airport Passengers by Region .......................................................... 30
Figure 23: Rest of the State Hotel Roomnights by Region ........................................................... 30
Figure 24: Rest of the State Travel Indicators by Segments ......................................................... 31
Figure 25: Rest of the State Travel Indicators ............................................................................... 32
Figure 26: Alexandria Travel Indicators ........................................................................................ 33
Figure 27: Baton Rouge Travel Indicators ..................................................................................... 34
Figure 28: Lafayette Travel Indicators .......................................................................................... 35
Figure 29: Lake Charles Travel Indicators ..................................................................................... 36
Figure 30: Monroe Travel Indicators ............................................................................................ 37
Figure 31: Shreveport Travel Indicators ....................................................................................... 38
Figure 32: Other Areas Travel Indicators ...................................................................................... 39
Louisiana Tourism Forecast 2016 - 2019
UNO Hospitality Research Center 6
Executive Summary
In 2015, the number of visitors to the state of Louisiana set a new record for the fourth consecutive year. A total of 28.9 million people visited the state, exceeding the 28.7 million visitors estimated during 2014. Total visitation increased by nearly 1% throughout 2015.
Visitor spending statewide reached $11.5 billion during 2015, representing an increase of 3% from 2014 estimates. Visitors who came to the state spent nearly $396 per person during their trip.
In 2015, a total of $844 million of state tax revenues, direct and indirect, were generated by travel and tourism activities in Louisiana.
Without taxes paid by visitors to the state, each household in Louisiana would have to pay $486 in additional taxes to maintain current state revenues.
An estimate of 171,000 direct jobs were attributable to visitor spending in the state of Louisiana during 2015. In the same year, direct tourism employment accounted for nearly 9% of non-agricultural employment in Louisiana.
If the 171,000 direct jobs created by tourism were eliminated, holding everything else equal in the economy, the annual state’s unemployment rate would increase from 6.2% to 14.2%.
During 2015, every $67,000 of visitor expenditures created one direct job in Louisiana.
In the same year, tourism contribution, or direct value added to GDP, accounted for about $6.6 billion. Direct tourism value added represented nearly 3% of the total GDP in the state.
By the end of the forecast period in 2019, the number of visitors to Louisiana is projected to reach 31.5 million. During the same year, spending is estimated to be at $13.3 billion.
In 2015, total visitation to the New Orleans area was 9.8 million, while spending was estimated at $7.1 billion. Areas in the Rest of Louisiana, including Alexandria, Baton Rouge, Lafayette, Lake Charles, Monroe, Shreveport, and Rural Areas of the southern and northern parts of the state received 19.2 million visitors, along with a $4.4 billion in spending.
Other indicators of tourism activity in Louisiana remained stable during 2015. Employment, hotel, airport, and casino activity reported substantial growth. Visitation to state parks and welcome centers is still lagging behind other indicators.

Louisiana Tourism Forecast 2016 - 2019
UNO Hospitality Research Center 7
Introduction
The Hospitality Research Center (HRC) at The University of New Orleans (UNO) has been conducting for many years an ongoing forecast study for the Louisiana Department of Culture, Recreation and Tourism (CRT). This forecast study provides historical and future tourism information comprising total visitation and spending, total number of hotel roomnights sold, including those for conventions, airport passengers, tourism employment, value added, and taxes paid to the state of Louisiana by visitors. This research study seeks to bring together current information on the tourism industry into a cohesive whole. It also aims to standardize the measures and data of tourism activity, and to produce a comprehensive document. The results from this study are expected to assist Louisiana representatives in measuring the real impact of tourism in the state, and in determining visitor characteristics for future advertising and marketing efforts.
Methodology
In order to determine estimates for visitation, spending, tourism indicators, and taxes, data available for the Louisiana region was explored to determine the relationships in current tourism activity. The data includes:
Airport passenger and capacity statistics
Casino revenue, admissions, and taxes
Convention hotel booking patterns
Economic indicators, including GDP, inflation, and multipliers
Employment statistics
External reports supported by the Louisiana Office of Tourism
Hotel activity including occupancy rate, room rate, room inventory, revenue, and taxes
Hotel and visitor survey data files
International visitation indicators
Louisiana Welcome Centers, State Historic Sites, and State Parks visitation statistics
Past relationships between visitor measurements and spending
Past reports containing visitation and spending estimates
Population estimates and characteristics
Other external information available to HRC
Louisiana Tourism Forecast 2016 - 2019
UNO Hospitality Research Center 8
This report provides information for visitation, spending, tourism indicators, and taxes by segments divided into New Orleans and the Rest of the State. Before 2005, the tourism market in the New Orleans area had roughly the same volume as the aggregated areas in the Rest of Louisiana. Because of the severity of the damage on tourism activity after the Hurricanes, the analysis is now reviewed separately. Areas in the Rest of the State are analyzed as a whole since the number of observations from TNS data does not allow for an analysis of individual markets. For these smaller markets, other indicators of tourism and economic activity are included.
It is important to note that all projections presented in this analysis include both domestic and international visitation. When available, comparisons are offered with results from the same period in prior years. Throughout the report, totals in some tables may not add up due to rounding.
Visitation
Current visitation is estimated using data from visitor survey files available to HRC, TNS survey data panel, travel statistics, and historical data. While TNS includes domestic visitation only, the HRC makes an effort to correct for foreign visitation. The values for both sectors, New Orleans and Rest of the State, are added together to determine total visitation to the state of Louisiana. Total visitation is estimated based on visitor type. The four types of visitor defined in this study include hotels stayers, visitors who stayed with friends or relatives (VFR’s), visitors who stayed in other accommodations, and people who only came for the day (daytrippers). Other accommodations include lodging arrangements such as timeshares, apartments, bed and breakfast, campgrounds, private home rentals, and others. To estimate the number of visitors who chose to stay in hotels, the HRC determined the number of hotel rooms and occupancy rates using Smith Travel Research (STR) data. An adjustment, estimated from the hotel survey, was made to exclude residents who decided to vacation in the city and stayed in hotels. The adjustment also includes local residents who stayed at hotels due to major hurricanes in the region. The proportions of overnight visitors who stayed with friends or relatives, in other accommodations, and daytrippers were obtained from visitor survey results, travel statistics, and historical data.
For future visitation, the HRC developed a model that projects visitation trends using the indicators and factors mentioned earlier. The forecast period included in this analysis comprises data from 2016 through 2019. This forecast is based on the assumption that upward trends in tourism for New Orleans will continue, while the Rest of the State will remain at the higher levels reached after the storms. It is also assumed that some displacement of economic and tourism activity will remain in the Rest of the State. Further, it is expected that the visitor mix and lengths of stay will gradually move in the direction of figures seen prior to the Hurricanes in 2005.

Louisiana Tourism Forecast 2016 - 2019
UNO Hospitality Research Center 9
Visitation estimates from 2003 through 2005 were done by TIA (U.S. Travel Association) in combination with CRT using a different methodology. Though visitation is not from the same source or methods, the two series were concatenated to provide comparison with past estimates. Since TIA only measured domestic visitation, an effort was made to estimate foreign visitation and thus correct the series.
Spending
Total visitor spending was then determined using the average individual expenditures of travelers to the state of Louisiana. Similar to visitation, New Orleans spending was estimated using data from HRC visitor survey files, along with historical and future measurements. TNS survey data was used to provide visitor spending for regions in the Rest of the State. These figures were multiplied by the number of visitors, estimated from the previously defined methodological steps, to determine total visitor spending. It is important to note that all spending figures presented throughout the report are not adjusted for inflation. Although the growth in visitor spending can be credited to visitors staying longer and spending more money, the increment can also be partially attributed to higher costs. Spending numbers at the state level between 2003 and 2005 are from TIA (U.S. Travel Association), in combination with TSA (Tourism Satellite Account). The main difference in the TSA methodology is that investment and government spending are included. A major difference in TIA’s methodology is that it includes spending numbers for transportation purchased outside Louisiana such as airfare, as well as costs associated with owning a vehicle. TNS, which is HRC’s main data source for spending numbers in areas outside New Orleans, includes only money spent inside Louisiana. As a result, pre-storms dollar values for the state are higher, including calculations for jobs created and taxes. It is also important to note that TIA does not measure spending by foreign travelers to Louisiana. Similar to visitation, an attempt was made to correct for spending by foreign travelers between 2003 and 2005.
Tourism Indicators
Main tourism indicators included in this analysis comprise total number of hotel roomnights sold, including those for conventions, airport passengers, tourism employment, and value added. Estimates of hotel roomnights, convention roomnights, and airport passengers are based on historical data and future measurements. Unlike total visitation and spending, tourism indicators for hotel and airport activity are available for each major market in the state of Louisiana. It is important to note that hotel rooms sold used to estimate visitation and spending exclude residents. However, at the request of the Louisiana Office of Tourism, the values presented throughout the report for hotel rooms have been adjusted to be consistent with STR hotel room demand. In addition, hotel rooms sold, as measured by STR, do not include casino hotels. Therefore, there is more hotel activity in the state than presented in this analysis
Louisiana Tourism Forecast 2016 - 2019
UNO Hospitality Research Center 10
The economic impact associated with visitor spending, measured by employment and value added, was estimated using total direct and secondary spending due to visitors who came to the state of Louisiana. Secondary spending, or the ripple effect, is based on the direct spending. For every new dollar of direct spending, additional dollars of secondary spending are generated in the economy. Secondary spending, employment, and value added in 2012 were estimated using multipliers from the Regional Input-Output Modeling System (RIMS II) provided by the United States Department of Commerce, Bureau of Economic Analysis (BEA). Starting in 2013, the analysis of secondary activity was done using IMPLAN multipliers. Indicators of employment and value added since 2012 are estimated using a different methodology from that of previous years. Data for employment and value added between 2003 and 2011 was prepared by TSA, which includes government and investment spending. Tourism employment before 2012, matches the TSA definition of tourism jobs, which includes those for infrastructure spending (i.e. the building and repair of highways and hotels). Immediately following the Hurricanes, there was a surge in hotel construction in the northern part of the state along with many repairs to bridges and other travel infrastructure projects in the south. This type of activity continued to decrease in the years following the Hurricanes as projects were being completed, and therefore, was removed from the methodology in 2012. Additional analysis was performed by HRC to ensure that the figures for employment and value added remained comparable over the years. Government statistics used to provide a comparison of employment and value added are preliminary figures. Official data from the Louisiana Workforce Commission and Bureau of Economic Analysis is released approximately seven months after the end of the calendar year.
Other tourism indicators analyzed throughout this report include total employment, airport and hotel capacity, and state parks, state historic sites, and welcome centers visitation. When considering measures of activity at casinos, state parks, state historic sites, and welcome centers, all sites were included, despite their availability during the timeframe of the analysis. New facilities, and those closed, are analyzed since an opening or closure is considered a measurement of tourism activity.
All tourism measures, except for spending, visitation, and taxes, are also analyzed in ratios to present a comparison among all indicators. This methodology allows for an evaluation between several statistics that are defined by different measurement units. This analysis is available for all areas and for the state as a whole. The growth of each indicator is estimated as a ratio of current estimates over monthly figures recorded during the same month from January through December 2009. Each graph contains the annual average of each indicator’s ratio presented by area.
Louisiana Tourism Forecast 2016 - 2019
UNO Hospitality Research Center 11
Taxes
Tax revenues are generated for federal, state, and local governments as a result of spending and employment in the state of Louisiana created by visitors. Tax revenue estimates presented in this study measure only the state taxes. Local and federal taxes are not part of the analysis. There are two types of tax revenues estimated in this report. The first is direct revenue comprising the tax revenue that visitors pay to the state government directly. Examples include hotel/motel taxes paid on hotel rooms, and sales taxes paid on retail purchases, including food and drinks. The direct taxes included in this study comprise hotel, sales, and gambling taxes. Indirect taxes are the taxes paid on the income generated by direct spending. On that income, the recipient pays state income taxes. In addition, the local taxpayer buys goods and services and pays taxes that apply to those goods and services. The assumption used to estimate the revenue from these indirect taxes is that the recipient of newly created income is no different from the average Louisiana consumer. Therefore, the proportion of secondary income that is paid in these various taxes is equal to average values for the state as a whole. This study includes only indirect general sales taxes, excluding hotels.
New Information and External Factors
Tourism measurements presented in this report, including visitation, spending, tourism indicators, and taxes are estimated based on the best data available. Estimates continue to be refined as new information is released (e.g., new hotel information, flights indicators, fluctuations in employment, etc.). The estimates also change based on new, exogenous factors including perceptions and changes in legislation. Therefore the data and methodology used in this study are continually revised. Since additional data relating to travel becomes available subsequent to the study, the HRC reserves the right to annually revise the estimates included in this analysis.

Louisiana Tourism Forecast 2016 - 2019
UNO Hospitality Research Center 12
Forecast Results
LOUISIANA
Table 1 contains current estimates for total visitation and spending between 2005 and 2015. In addition, it includes a four-year window forecast for the same indicators between 2016 and 2019.
Travel, measured by visitation and spending, has continuously grown throughout the state over the last six years. In 2015, the number of visitors statewide grew slightly over 2014 estimates. Even though visitation had a modest growth, it reached a new record in 2015. During that year, 28.9 million people visited the state, exceeding the 28.7 million visitors who came in 2014, and the 27.6 million who visited in 2013. Visitation grew by nearly 1% throughout 2015, and it is expected to have a moderate growth of 2% during the upcoming years. By 2019, the number of visitors statewide is projected to reach 31.5 million, representing a growth of 9% over 2015 estimates.
Visitor spending statewide reached $11.5 billion during 2015, an increase of 3% compared to 2014. Total spending recorded last year also represented the highest figure since 2003. People who visited the state spent approximately $396 during their trip, an increase of 2% compared to $389 in 2014. In the upcoming years, visitor spending is expected to increase by approximately 4% annually reaching $13.3 billion in 2019. It is important to note that spending figures are not adjusted for inflation (Figure 1).
Table 1: Louisiana Visitation and Spending (Domestic and Foreign)
2005 2006 2007 2008 2009 2010 2011 2012 2013 2014 2015 2016 2017 2018 2019
Visitors (Millions)1
19.6 18.2 23.8 24.4 24.0 25.1 25.5 26.3 27.6 28.7 28.9 29.7 30.4 31.2 31.5
Total Spending (Billions)2
$8.2 $6.6 $9.0 $9.5 $8.8 $9.5 $10.0 $10.6 $10.8 $11.2 $11.5 $11.7 $12.2 $13.0 $13.3
1Source: 2005 TIA and CRT. 2Source: 2005 TIA and TSA.
Figure 1: Louisiana Visitation and Spending
$0
$4
$8
$12
$16
0
8
16
24
32
20
03
20
04
20
05
20
06
20
07
20
08
20
09
20
10
20
11
20
12
20
13
20
14
20
15
20
16
20
17
20
18
20
19
Visitation
(Bill
ion
s)
(Mill
ion
s)
Spending

Louisiana Tourism Forecast 2016 - 2019
UNO Hospitality Research Center 13
Figure 2: Louisiana Visitor Type
Source: See Appendix B.
Figure 2 includes the four visitor types that determine total visitation. In 2015, approximately 54% of all visitors to the state of Louisiana stayed in hotels. Another 18% stayed with friends or relatives, while 5% stayed in other accommodations. Nearly 22% of all visitors decided to stay only for the day. The distribution among visitor to the state have remained virtually unchanged during the last three years. Major spending categories are presented in Figure 3. The highest visitor expenditures statewide during 2015 correspond to restaurants and bars (30%), followed by lodging (24%). Overall, the proportion among expenditure categories has remained comparable over the last three years. Local transportation is the only category that presented a decrease since 2013.
Figure 3: Louisiana Spending Type
Source: See Appendix B.
55%
20%
5%
20%
56%
18%
5%
21%
54%
18%
5%
22%
0%
10%
20%
30%
40%
50%
60%
Hotel Friends orrelatives
Otheraccommodations
Daytrippers
2013 2014 2015
23%
29%
14%
19%
13%
0%
24%
30%
12%
20%
14%
0%
24%
30%
10%
21%
14%
1%
0%
5%
10%
15%
20%
25%
30%
35%
Lodging Restaurantsand bars
Tranportation Entertainmentaand recreation
General retail Other
2013 2014 2015
Louisiana Tourism Forecast 2016 - 2019
UNO Hospitality Research Center 14
Table 2: Louisiana Tourism Indicators
2005 2006 2007 2008 2009 2010 2011 2012 2013 2014 2015 2016 2017 2018 2019
Tourism Employment (Thousands)3
122 108 143 145 131 143 147 153 155 160 171 171 179 190 194
Airport Passengers (Millions)
5.2 4.5 5.1 5.2 5.0 5.3 5.5 5.6 5.9 6.2 6.6 7.0 7.4 7.9 8.2
Hotel Roomnights (Millions)4
18.9 17.2 16.9 18.2 16.9 18.7 18.6 20.0 20.0 21.1 21.3 22.0 22.7 23.5 23.5
Convention Roomnights (Millions)
2.1 1.2 1.9 2.0 2.1 2.2 2.3 2.6 2.8 2.8 3.0 3.1 3.4 3.7 3.6
3Direct employment. 4In 2005, 2006, and 2008, many hotel rooms were attributable to local residents due to Hurricane activity. Source: See Appendix B.
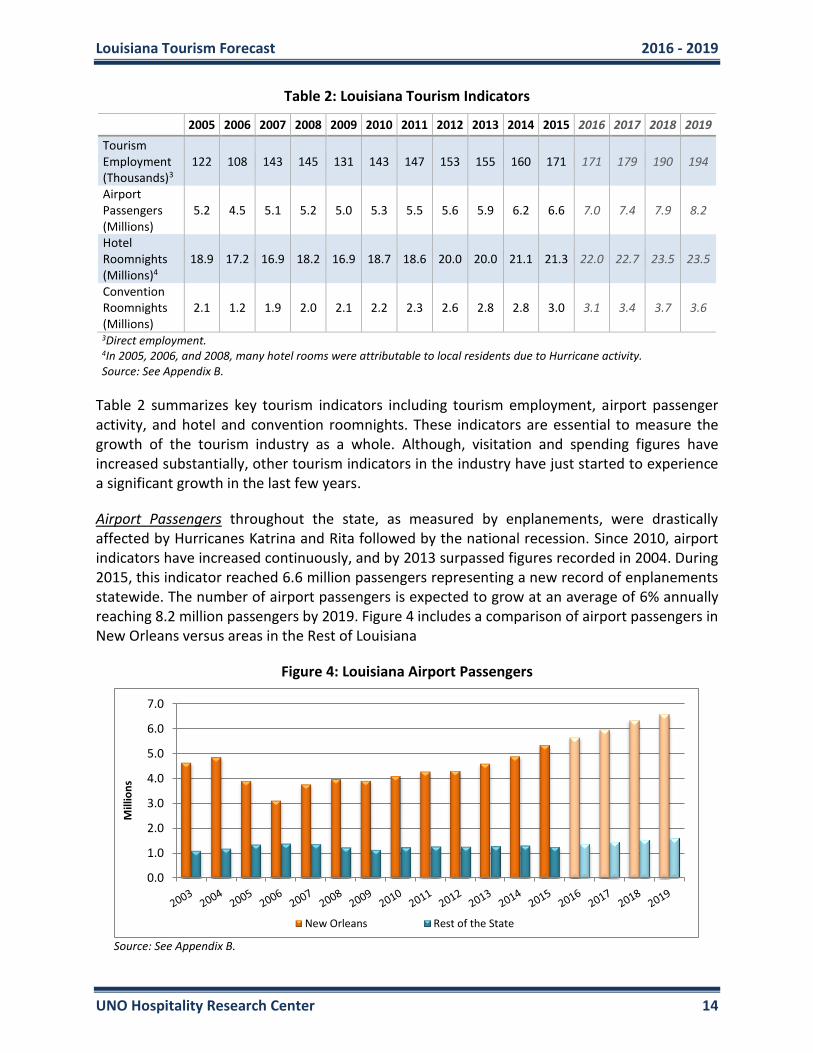
Table 2 summarizes key tourism indicators including tourism employment, airport passenger activity, and hotel and convention roomnights. These indicators are essential to measure the growth of the tourism industry as a whole. Although, visitation and spending figures have increased substantially, other tourism indicators in the industry have just started to experience a significant growth in the last few years.
Airport Passengers throughout the state, as measured by enplanements, were drastically affected by Hurricanes Katrina and Rita followed by the national recession. Since 2010, airport indicators have increased continuously, and by 2013 surpassed figures recorded in 2004. During 2015, this indicator reached 6.6 million passengers representing a new record of enplanements statewide. The number of airport passengers is expected to grow at an average of 6% annually reaching 8.2 million passengers by 2019. Figure 4 includes a comparison of airport passengers in New Orleans versus areas in the Rest of Louisiana
Figure 4: Louisiana Airport Passengers
Source: See Appendix B.
0.0
1.0
2.0
3.0
4.0
5.0
6.0
7.0
Mill
ion
s
New Orleans Rest of the State
Louisiana Tourism Forecast 2016 - 2019
UNO Hospitality Research Center 15
Figure 5: Louisiana Hotel Roomnights
Source: See Appendix B.
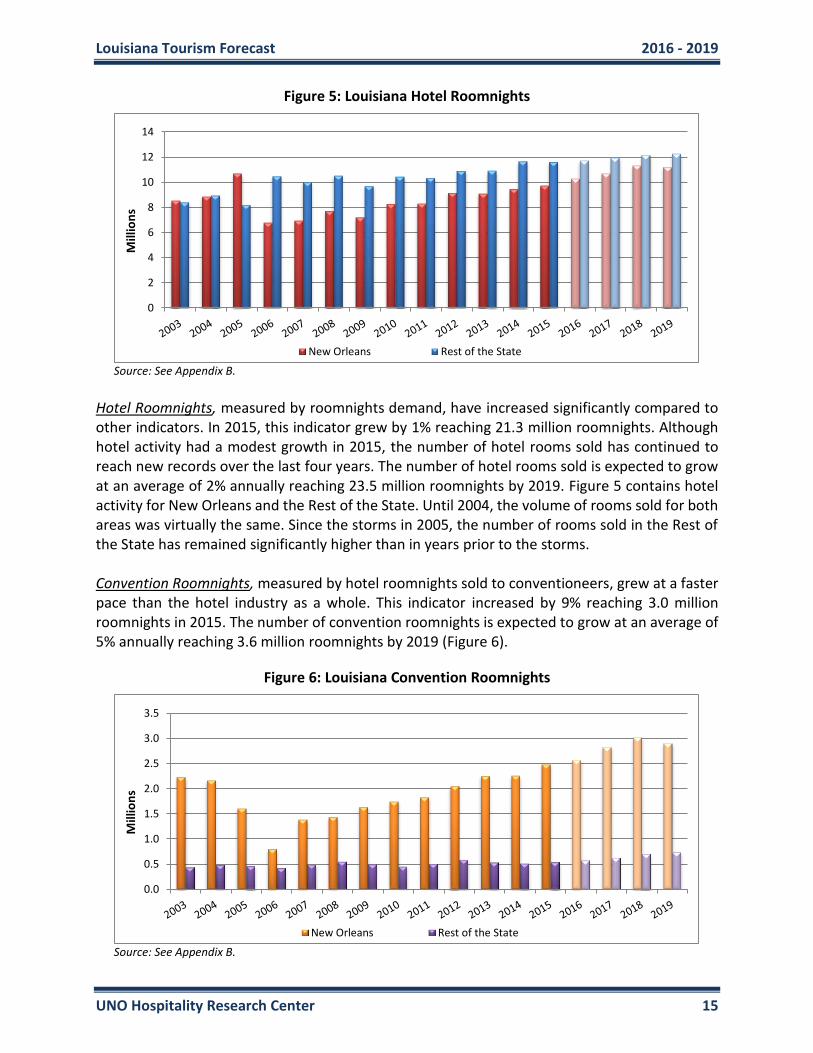
Hotel Roomnights, measured by roomnights demand, have increased significantly compared to other indicators. In 2015, this indicator grew by 1% reaching 21.3 million roomnights. Although hotel activity had a modest growth in 2015, the number of hotel rooms sold has continued to reach new records over the last four years. The number of hotel rooms sold is expected to grow at an average of 2% annually reaching 23.5 million roomnights by 2019. Figure 5 contains hotel activity for New Orleans and the Rest of the State. Until 2004, the volume of rooms sold for both areas was virtually the same. Since the storms in 2005, the number of rooms sold in the Rest of the State has remained significantly higher than in years prior to the storms. Convention Roomnights, measured by hotel roomnights sold to conventioneers, grew at a faster pace than the hotel industry as a whole. This indicator increased by 9% reaching 3.0 million roomnights in 2015. The number of convention roomnights is expected to grow at an average of 5% annually reaching 3.6 million roomnights by 2019 (Figure 6).
Figure 6: Louisiana Convention Roomnights
Source: See Appendix B.
0
2
4
6
8
10
12
14M
illio
ns
New Orleans Rest of the State
0.0
0.5
1.0
1.5
2.0
2.5
3.0
3.5
Mill
ion
s
New Orleans Rest of the State
Louisiana Tourism Forecast 2016 - 2019
UNO Hospitality Research Center 16
Figure 7: Louisiana Tourism Employment (Direct and Indirect/Induced)
*Estimates. Source: See Appendix B.
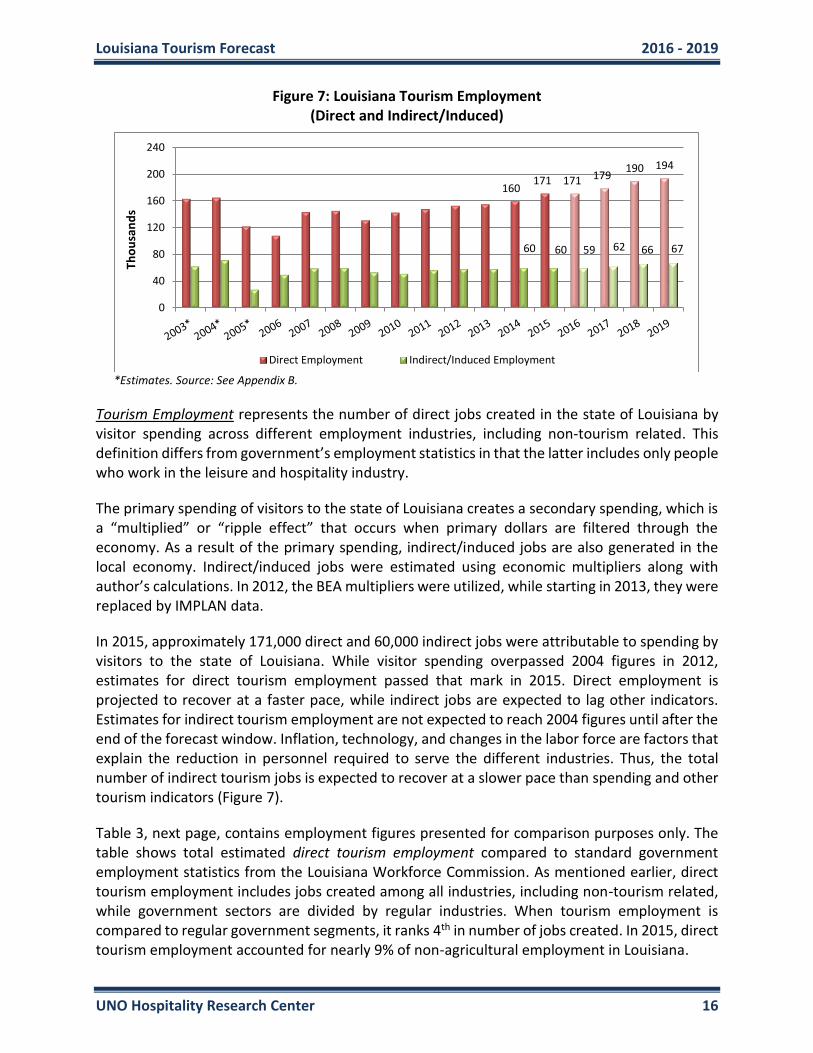
Tourism Employment represents the number of direct jobs created in the state of Louisiana by visitor spending across different employment industries, including non-tourism related. This definition differs from government’s employment statistics in that the latter includes only people who work in the leisure and hospitality industry.
The primary spending of visitors to the state of Louisiana creates a secondary spending, which is a “multiplied” or “ripple effect” that occurs when primary dollars are filtered through the economy. As a result of the primary spending, indirect/induced jobs are also generated in the local economy. Indirect/induced jobs were estimated using economic multipliers along with author’s calculations. In 2012, the BEA multipliers were utilized, while starting in 2013, they were replaced by IMPLAN data.
In 2015, approximately 171,000 direct and 60,000 indirect jobs were attributable to spending by visitors to the state of Louisiana. While visitor spending overpassed 2004 figures in 2012, estimates for direct tourism employment passed that mark in 2015. Direct employment is projected to recover at a faster pace, while indirect jobs are expected to lag other indicators. Estimates for indirect tourism employment are not expected to reach 2004 figures until after the end of the forecast window. Inflation, technology, and changes in the labor force are factors that explain the reduction in personnel required to serve the different industries. Thus, the total number of indirect tourism jobs is expected to recover at a slower pace than spending and other tourism indicators (Figure 7).
Table 3, next page, contains employment figures presented for comparison purposes only. The table shows total estimated direct tourism employment compared to standard government employment statistics from the Louisiana Workforce Commission. As mentioned earlier, direct tourism employment includes jobs created among all industries, including non-tourism related, while government sectors are divided by regular industries. When tourism employment is compared to regular government segments, it ranks 4th in number of jobs created. In 2015, direct tourism employment accounted for nearly 9% of non-agricultural employment in Louisiana.
160171 171 179
190 194
60 60 59 62 66 67
0
40
80
120
160
200
240
Tho
usa
nd
s
Direct Employment Indirect/Induced Employment

Louisiana Tourism Forecast 2016 - 2019
UNO Hospitality Research Center 17
Table 3: Tourism Employment Compared to Louisiana Employment by Segments (Top 10)
Segments (Thousands) 2015*
Health Care and Social Assistance 294 Retail Trade 232 Accommodation and Food Services 198 Tourism Employment (Direct)** 171 Educational Services 164 Construction 147 Manufacturing 145 Administrative and Waste Services 103 Public Administration 97 Professional and Technical Services 92 Transportation and Warehousing 84 Other 371
Total LA Employment 1,926 *Preliminary estimates. Source: See Appendix B.
**Tourism employment is not part of the standard government statistics obtained from the LA Workforce Commission.
Tourism Value Added is defined as the contribution of a private industry or government sector to the overall GDP. Direct and indirect value added, or contribution to GDP created by visitor spending in the state of Louisiana, were estimated using similar methodologies to those of employment. As a result of primary visitor spending, indirect/induced value added is generated in the local economy. During 2015, direct and indirect tourism contribution accounted for approximately $6.6 billion and $4.5 billion, respectively. By the end of the forecast window in 2019, direct and indirect tourism value added are expected to account for $7.7 billion and $5.2 billion, respectively. The value added figures estimated are nominal and are not adjusted for inflation (Figure 8).
Figure 8: Louisiana Tourism Value Added (Direct and Indirect/Induced)
*Estimates. Source: See Appendix B.
6.5 6.6 6.8 7.1 7.5 7.7
4.3 4.5 4.6 4.85.0 5.2
$0
$2
$4
$6
$8
$10
Bill
ion
s
Direct Value Added Indirect Value Added

Louisiana Tourism Forecast 2016 - 2019
UNO Hospitality Research Center 18
Table 4: Tourism Value Added Compared to Louisiana GDP by Segments (Top 12)
Segments (Billions of Current Dollars) 2015*
Manufacturing $56.3 Finance, Insurance, Real Estate, Rental, and Leasing $35.9 Government $25.8 Mining $20.2 Professional and Business Services $20.5 Educational Services, Health Care, and Social Assist. $18.7 Retail Trade $14.8 Construction $15.4 Wholesale Trade $12.5 Transportation and Warehousing $12.0 Arts, Entertainment, Recreation, Accommodation, and Food Services
$10.3
Tourism Value Added (Direct)** $6.6 Information $4.9 Other $11.2
Total LA GDP $258.5 *Preliminary estimates. Source: See Appendix B.
**Tourism value added is not part of the GDP statistics obtained from the Bureau of Economic Analysis.
Table 4 includes a comparison of direct tourism value added and Louisiana GDP statistics obtained from the Bureau of Economic Analysis (BEA). Similar to employment, direct value added includes the contribution by visitor spending to GDP among all industries, including non-tourism related, while BEA sectors are divided by industries regardless of contribution origin. When the estimated tourism value added is compared to regular government segments, it ranks 12th in contribution to the GDP. In 2015, direct tourism value added represented nearly 3% of the state’s total GDP.
Table 5 includes the amount of direct and indirect taxes paid by visitors to the state of Louisiana. Local and federal taxes are not part of the analysis. Since 2011, tax collection estimates have gone up continuously and are expected to continue that trend over the upcoming years. In 2015, taxes for hotel and other spending reached $844 million. Without taxes paid by visitors to the state, each household in Louisiana would have to pay $486 in additional taxes to maintain current state revenues. By the end of the forecast window, total taxes are expected to reach $963 million. Similar to other spending estimates, figures presented in Table 5 are not adjusted for inflation.
Table 5: Louisiana State Taxes
2006 2007 2008 2009 2010 2011 2012 2013 2014 2015 2016 2017 2018 2019
Hotel Sales Taxes (Millions)
$59 $68 $73 $66 $75 $77 $88 $91 $96 $98 $99 $102 $108 $110
Non-hotel Taxes (Millions)
$478 $640 $654 $595 $593 $625 $647 $656 $676 $695 $705 $732 $772 $793
Louisiana Superdome and Exposition Tax (Millions)5
$25 $27 $30 $28 $31 $34 $40 $43 $49 $50 $52 $53 $58 $60
5 Source: See Appendix B.

Louisiana Tourism Forecast 2016 - 2019
UNO Hospitality Research Center 19
Figure 9: Louisiana Travel Indicators - Aggregates
Source: See Appendix B.
Figure 9 illustrates a comparison of other travel indicators categorized by area and analyzed as a whole. The growth of each indicator is estimated as a ratio of monthly figures recorded during the calendar year 2009. Over the last six years, tourism indicators for both areas have grown continuously, while the gap between areas has decreased substantially. In 2015, travel indicators in New Orleans reached 115%, while the Rest of Louisiana grew to 110%.
Figure 10 includes the growth of the same travel indicators present in Figure 9 categorized by area and segment. Travel Infrastructure is defined by capacity available at airports, hotels, and leisure labor force. Travel Activity is comprised by airport passengers and hotel roomnights. Leisure Activity includes admissions and spending at casinos, and visitation to state parks, state historic sites, and welcome centers. Convention Activity includes number of hotel roomnights sold to visitors whose primary purpose was to attend a convention. Overall, the trends for all segments in both areas have remained comparable in the last three years, except for leisure activity. New Orleans shows a decrease, while the Rest of Louisiana has grown.
Figure 10: Louisiana Travel Indicators by Segments
Source: See Appendix B.
0%
20%
40%
60%
80%
100%
120%
2010 2011 2012 2013 2014 2015
New Orleans Rest of Louisiana
0%
20%
40%
60%
80%
100%
120%
140%
N.O. Rest of LA N.O. Rest of LA N.O. Rest of LA N.O. Rest of LA
Travel Infrastructure Travel Activity Leisure Activity Convention Activity
2013 2014 2015
Louisiana Tourism Forecast 2016 - 2019
UNO Hospitality Research Center 20
Figure 11: Louisiana Travel Decisions
Source: See Appendix B.
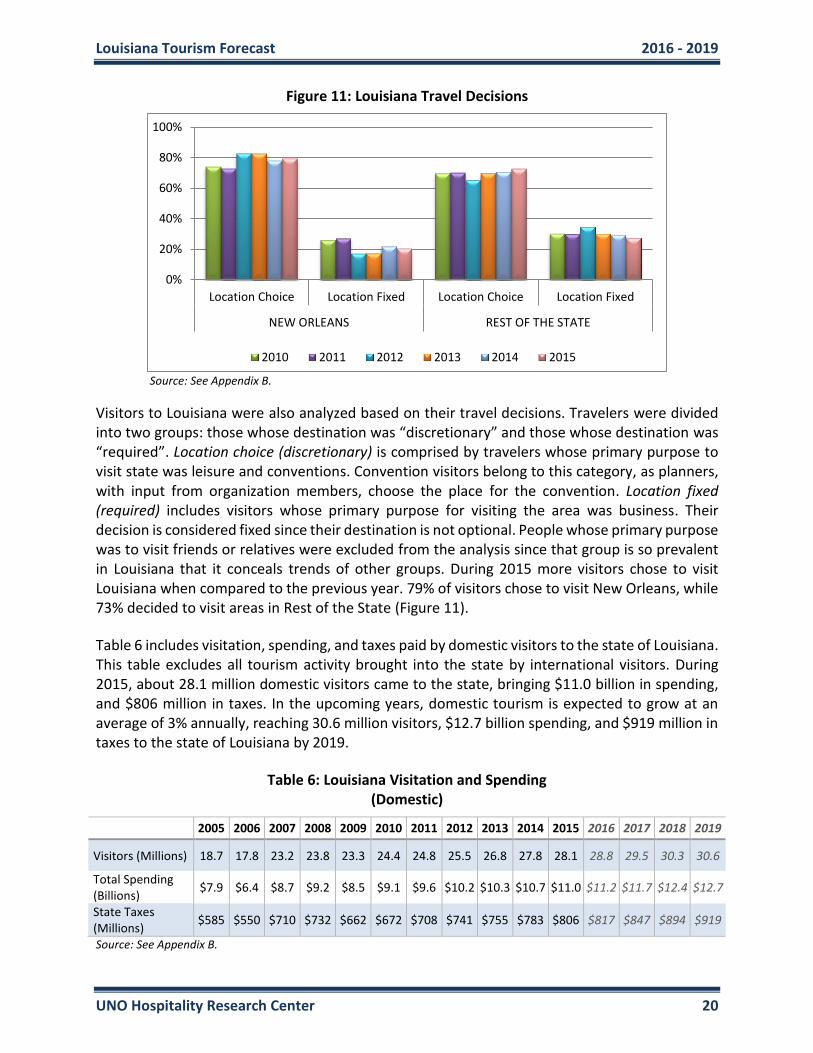
Visitors to Louisiana were also analyzed based on their travel decisions. Travelers were divided into two groups: those whose destination was “discretionary” and those whose destination was “required”. Location choice (discretionary) is comprised by travelers whose primary purpose to visit state was leisure and conventions. Convention visitors belong to this category, as planners, with input from organization members, choose the place for the convention. Location fixed (required) includes visitors whose primary purpose for visiting the area was business. Their decision is considered fixed since their destination is not optional. People whose primary purpose was to visit friends or relatives were excluded from the analysis since that group is so prevalent in Louisiana that it conceals trends of other groups. During 2015 more visitors chose to visit Louisiana when compared to the previous year. 79% of visitors chose to visit New Orleans, while 73% decided to visit areas in Rest of the State (Figure 11).
Table 6 includes visitation, spending, and taxes paid by domestic visitors to the state of Louisiana. This table excludes all tourism activity brought into the state by international visitors. During 2015, about 28.1 million domestic visitors came to the state, bringing $11.0 billion in spending, and $806 million in taxes. In the upcoming years, domestic tourism is expected to grow at an average of 3% annually, reaching 30.6 million visitors, $12.7 billion spending, and $919 million in taxes to the state of Louisiana by 2019.
Table 6: Louisiana Visitation and Spending (Domestic)
2005 2006 2007 2008 2009 2010 2011 2012 2013 2014 2015 2016 2017 2018 2019
Visitors (Millions) 18.7 17.8 23.2 23.8 23.3 24.4 24.8 25.5 26.8 27.8 28.1 28.8 29.5 30.3 30.6
Total Spending (Billions)
$7.9 $6.4 $8.7 $9.2 $8.5 $9.1 $9.6 $10.2 $10.3 $10.7 $11.0 $11.2 $11.7 $12.4 $12.7
State Taxes (Millions)
$585 $550 $710 $732 $662 $672 $708 $741 $755 $783 $806 $817 $847 $894 $919
Source: See Appendix B.
0%
20%
40%
60%
80%
100%
Location Choice Location Fixed Location Choice Location Fixed
NEW ORLEANS REST OF THE STATE
2010 2011 2012 2013 2014 2015
Louisiana Tourism Forecast 2016 - 2019
UNO Hospitality Research Center 21
Figure 12: Louisiana Travel Indicators
Source: See Appendix B.
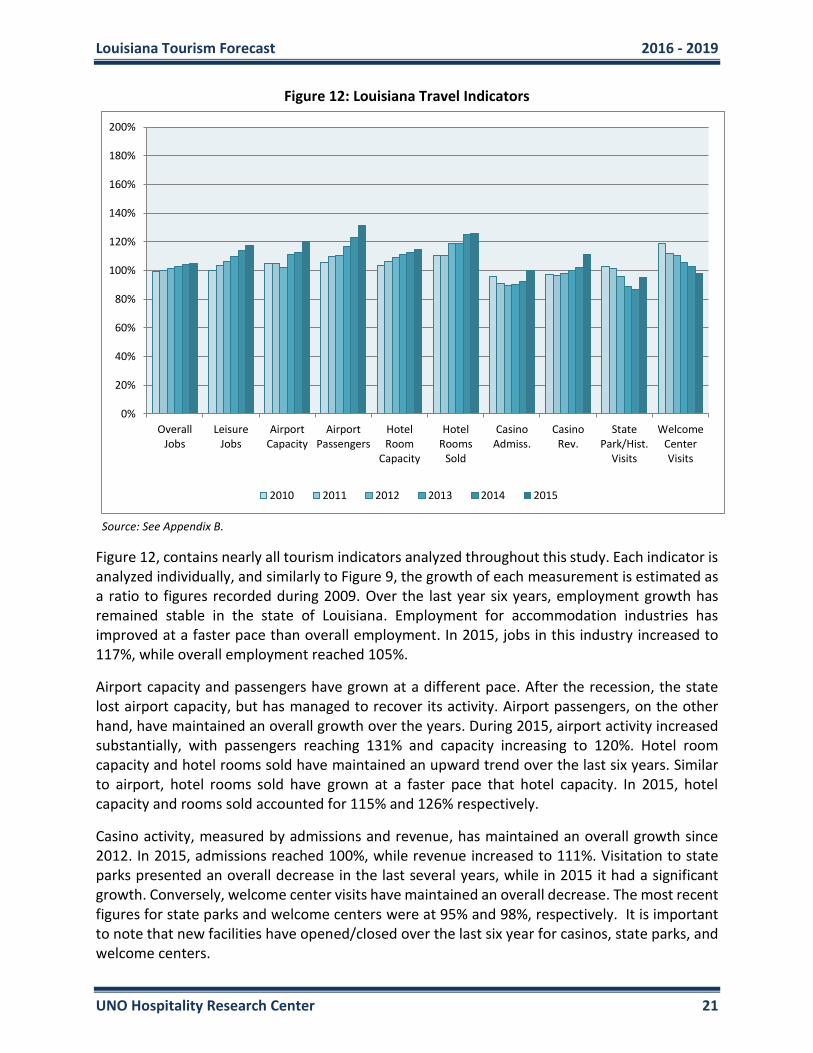
Figure 12, contains nearly all tourism indicators analyzed throughout this study. Each indicator is analyzed individually, and similarly to Figure 9, the growth of each measurement is estimated as a ratio to figures recorded during 2009. Over the last year six years, employment growth has remained stable in the state of Louisiana. Employment for accommodation industries has improved at a faster pace than overall employment. In 2015, jobs in this industry increased to 117%, while overall employment reached 105%.
Airport capacity and passengers have grown at a different pace. After the recession, the state lost airport capacity, but has managed to recover its activity. Airport passengers, on the other hand, have maintained an overall growth over the years. During 2015, airport activity increased substantially, with passengers reaching 131% and capacity increasing to 120%. Hotel room capacity and hotel rooms sold have maintained an upward trend over the last six years. Similar to airport, hotel rooms sold have grown at a faster pace that hotel capacity. In 2015, hotel capacity and rooms sold accounted for 115% and 126% respectively.
Casino activity, measured by admissions and revenue, has maintained an overall growth since 2012. In 2015, admissions reached 100%, while revenue increased to 111%. Visitation to state parks presented an overall decrease in the last several years, while in 2015 it had a significant growth. Conversely, welcome center visits have maintained an overall decrease. The most recent figures for state parks and welcome centers were at 95% and 98%, respectively. It is important to note that new facilities have opened/closed over the last six year for casinos, state parks, and welcome centers.
0%
20%
40%
60%
80%
100%
120%
140%
160%
180%
200%
OverallJobs
LeisureJobs
AirportCapacity
AirportPassengers
HotelRoom
Capacity
HotelRooms
Sold
CasinoAdmiss.
CasinoRev.
StatePark/Hist.
Visits
WelcomeCenterVisits
2010 2011 2012 2013 2014 2015
Louisiana Tourism Forecast 2016 - 2019
UNO Hospitality Research Center 22
NEW ORLEANS
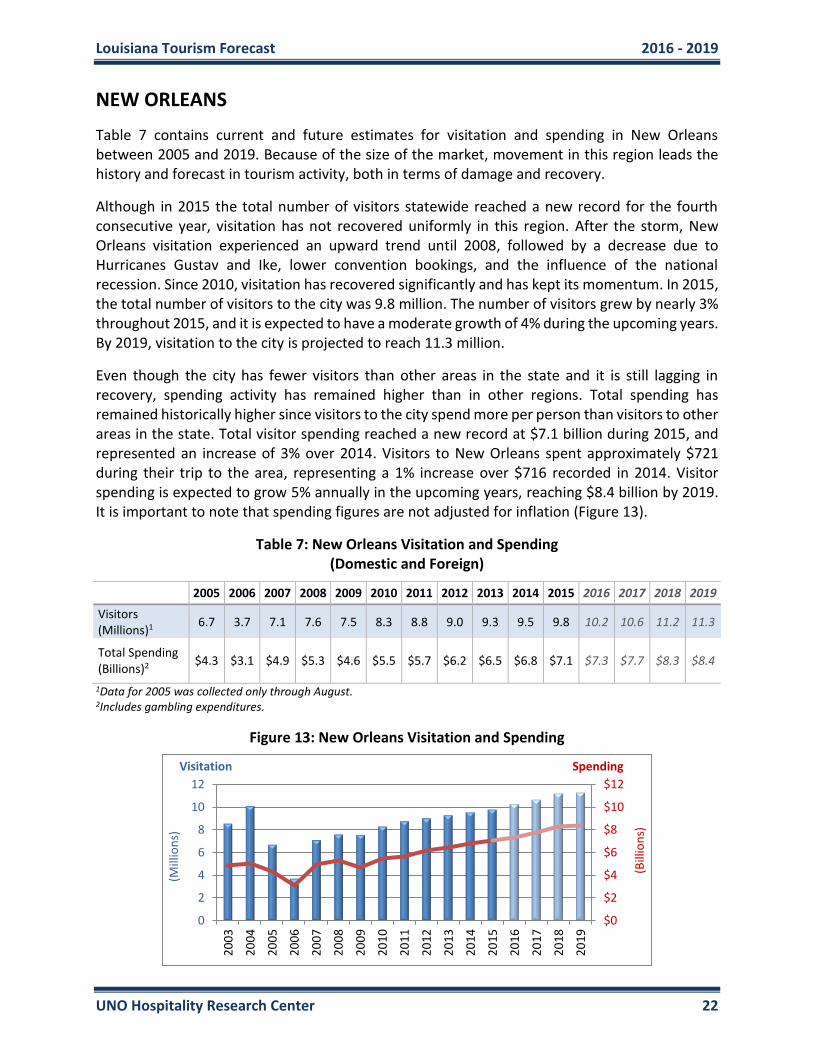
Table 7 contains current and future estimates for visitation and spending in New Orleans between 2005 and 2019. Because of the size of the market, movement in this region leads the history and forecast in tourism activity, both in terms of damage and recovery.
Although in 2015 the total number of visitors statewide reached a new record for the fourth consecutive year, visitation has not recovered uniformly in this region. After the storm, New Orleans visitation experienced an upward trend until 2008, followed by a decrease due to Hurricanes Gustav and Ike, lower convention bookings, and the influence of the national recession. Since 2010, visitation has recovered significantly and has kept its momentum. In 2015, the total number of visitors to the city was 9.8 million. The number of visitors grew by nearly 3% throughout 2015, and it is expected to have a moderate growth of 4% during the upcoming years. By 2019, visitation to the city is projected to reach 11.3 million.
Even though the city has fewer visitors than other areas in the state and it is still lagging in recovery, spending activity has remained higher than in other regions. Total spending has remained historically higher since visitors to the city spend more per person than visitors to other areas in the state. Total visitor spending reached a new record at $7.1 billion during 2015, and represented an increase of 3% over 2014. Visitors to New Orleans spent approximately $721 during their trip to the area, representing a 1% increase over $716 recorded in 2014. Visitor spending is expected to grow 5% annually in the upcoming years, reaching $8.4 billion by 2019. It is important to note that spending figures are not adjusted for inflation (Figure 13).
Table 7: New Orleans Visitation and Spending (Domestic and Foreign)
2005 2006 2007 2008 2009 2010 2011 2012 2013 2014 2015 2016 2017 2018 2019
Visitors (Millions)1
6.7 3.7 7.1 7.6 7.5 8.3 8.8 9.0 9.3 9.5 9.8 10.2 10.6 11.2 11.3
Total Spending (Billions)2
$4.3 $3.1 $4.9 $5.3 $4.6 $5.5 $5.7 $6.2 $6.5 $6.8 $7.1 $7.3 $7.7 $8.3 $8.4
1Data for 2005 was collected only through August. 2Includes gambling expenditures.
Figure 13: New Orleans Visitation and Spending
$0
$2
$4
$6
$8
$10
$12
0
2
4
6
8
10
12
20
03
20
04
20
05
20
06
20
07
20
08
20
09
20
10
20
11
20
12
20
13
20
14
20
15
20
16
20
17
20
18
20
19
Visitation
(Bill
ion
s)
(Mill
ion
s)
Spending

Louisiana Tourism Forecast 2016 - 2019
UNO Hospitality Research Center 23
Table 8: New Orleans Tourism Indicators
2005 2006 2007 2008 2009 2010 2011 2012 2013 2014 2015 2016 2017 2018 2019
Tourism Employment (Thousands)3
69 44 74 81 69 82 84 89 93 97 105 107 113 122 123
Airport Passengers (Millions)
3.9 3.1 3.8 4.0 3.9 4.1 4.3 4.3 4.6 4.9 5.3 5.7 6.0 6.3 6.6
Hotel Roomnights (Millions)4
8.2 6.8 6.9 7.7 7.2 8.3 8.3 9.1 9.1 9.5 9.7 10.3 10.7 11.3 11.2
3Direct employment. 4In 2005, 2006, and 2008, many hotel rooms were attributable to local residents due to Hurricane activity. Source: See Appendix B.
Tourism Employment, as defined in Figure 7, increased by 8% reaching nearly 105,000 jobs in 2015. Similar to the state as a whole, this indicator is not expected to grow at the same pace as visitor spending. In the upcoming years, tourism employment is estimated to grow at a rate of 4% annually, reaching approximately 123,000 jobs by 2019 (Table 8).
Airport activity, measured by airport passengers (annual enplanements) and airport capacity (annual airplane seats available), has increased substantially over the last three years. During that timeframe, both capacity and enplanements have grown at an average of 7% annually. In 2015, New Orleans had a total of 5.3 million passengers and 6.5 million seats (Table 8). During the same year, 82% of the seats were being filled by passengers, compared to 77% in 2010 and 74% in 2004. This means that airplanes are flying with fewer empty seats than in prior years. This increase in load factor is part of a national trend in the airline industry. The current gap between enplanements and capacity is expected to remain virtually unchanged in the upcoming years. By 2019, enplanements are expected to reach 6.6 million, while seats available will increase to 7.6 million (Figure 14).
Figure 14: New Orleans Airport Activity
Source: See Appendix B.
0.0
1.0
2.0
3.0
4.0
5.0
6.0
7.0
8.0
Mill
ion
s
Airport Passengers Airport Capacity
Louisiana Tourism Forecast 2016 - 2019
UNO Hospitality Research Center 24
Figure 15: New Orleans Hotel Roomnights - Primary Purpose
Source: See Appendix B.
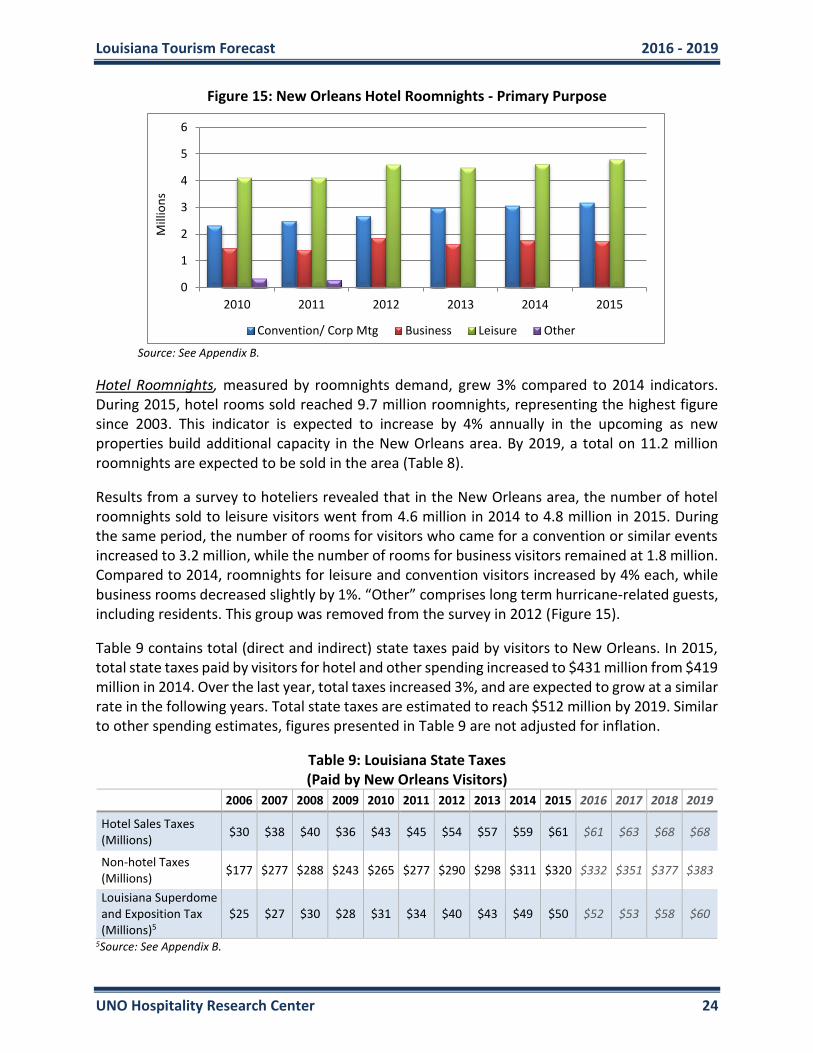
Hotel Roomnights, measured by roomnights demand, grew 3% compared to 2014 indicators. During 2015, hotel rooms sold reached 9.7 million roomnights, representing the highest figure since 2003. This indicator is expected to increase by 4% annually in the upcoming as new properties build additional capacity in the New Orleans area. By 2019, a total on 11.2 million roomnights are expected to be sold in the area (Table 8).
Results from a survey to hoteliers revealed that in the New Orleans area, the number of hotel roomnights sold to leisure visitors went from 4.6 million in 2014 to 4.8 million in 2015. During the same period, the number of rooms for visitors who came for a convention or similar events increased to 3.2 million, while the number of rooms for business visitors remained at 1.8 million. Compared to 2014, roomnights for leisure and convention visitors increased by 4% each, while business rooms decreased slightly by 1%. “Other” comprises long term hurricane-related guests, including residents. This group was removed from the survey in 2012 (Figure 15).
Table 9 contains total (direct and indirect) state taxes paid by visitors to New Orleans. In 2015, total state taxes paid by visitors for hotel and other spending increased to $431 million from $419 million in 2014. Over the last year, total taxes increased 3%, and are expected to grow at a similar rate in the following years. Total state taxes are estimated to reach $512 million by 2019. Similar to other spending estimates, figures presented in Table 9 are not adjusted for inflation.
Table 9: Louisiana State Taxes (Paid by New Orleans Visitors)
2006 2007 2008 2009 2010 2011 2012 2013 2014 2015 2016 2017 2018 2019
Hotel Sales Taxes (Millions)
$30 $38 $40 $36 $43 $45 $54 $57 $59 $61 $61 $63 $68 $68
Non-hotel Taxes (Millions)
$177 $277 $288 $243 $265 $277 $290 $298 $311 $320 $332 $351 $377 $383
Louisiana Superdome and Exposition Tax (Millions)5
$25 $27 $30 $28 $31 $34 $40 $43 $49 $50 $52 $53 $58 $60
5Source: See Appendix B.
0
1
2
3
4
5
6
2010 2011 2012 2013 2014 2015
Mill
ion
s
Convention/ Corp Mtg Business Leisure Other
Louisiana Tourism Forecast 2016 - 2019
UNO Hospitality Research Center 25
Figure 16: New Orleans Visitors - Primary Purpose
Source: See Appendix B.
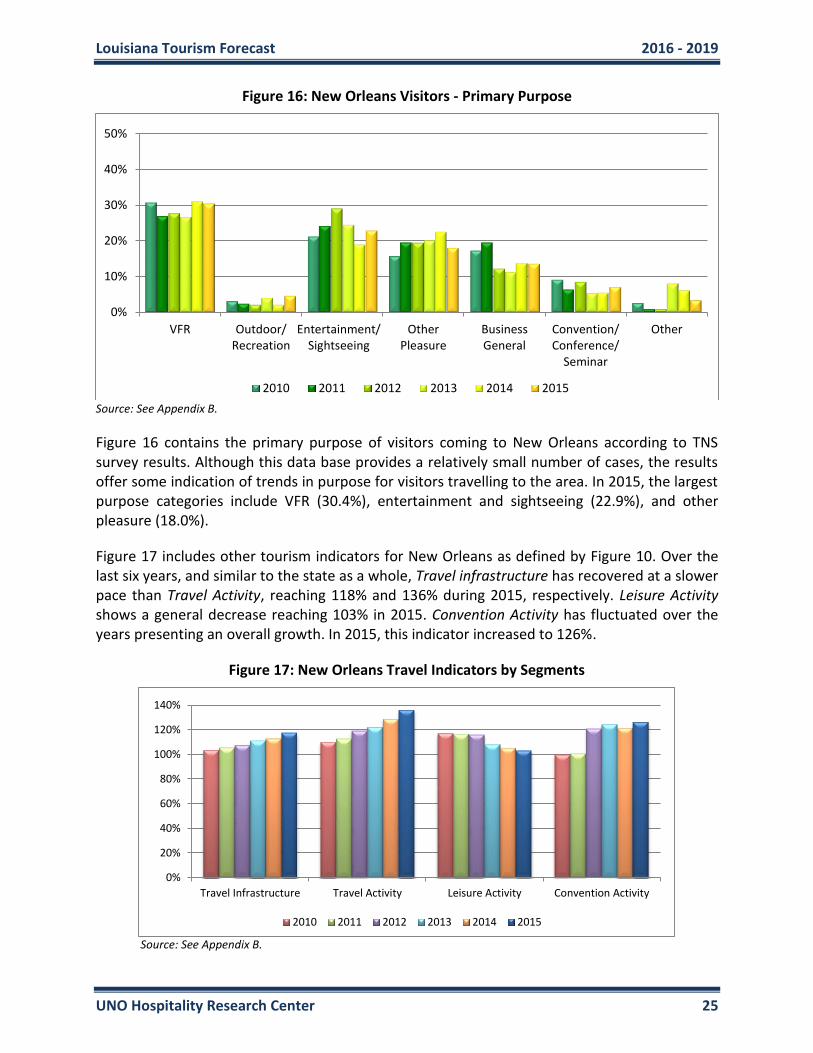
Figure 16 contains the primary purpose of visitors coming to New Orleans according to TNS survey results. Although this data base provides a relatively small number of cases, the results offer some indication of trends in purpose for visitors travelling to the area. In 2015, the largest purpose categories include VFR (30.4%), entertainment and sightseeing (22.9%), and other pleasure (18.0%).
Figure 17 includes other tourism indicators for New Orleans as defined by Figure 10. Over the last six years, and similar to the state as a whole, Travel infrastructure has recovered at a slower pace than Travel Activity, reaching 118% and 136% during 2015, respectively. Leisure Activity shows a general decrease reaching 103% in 2015. Convention Activity has fluctuated over the years presenting an overall growth. In 2015, this indicator increased to 126%.
Figure 17: New Orleans Travel Indicators by Segments
Source: See Appendix B.
0%
10%
20%
30%
40%
50%
VFR Outdoor/Recreation
Entertainment/Sightseeing
OtherPleasure
BusinessGeneral
Convention/Conference/
Seminar
Other
2010 2011 2012 2013 2014 2015
0%
20%
40%
60%
80%
100%
120%
140%
Travel Infrastructure Travel Activity Leisure Activity Convention Activity
2010 2011 2012 2013 2014 2015
Louisiana Tourism Forecast 2016 - 2019
UNO Hospitality Research Center 26
Figure 18: New Orleans Travel Indicators
Source: See Appendix B.
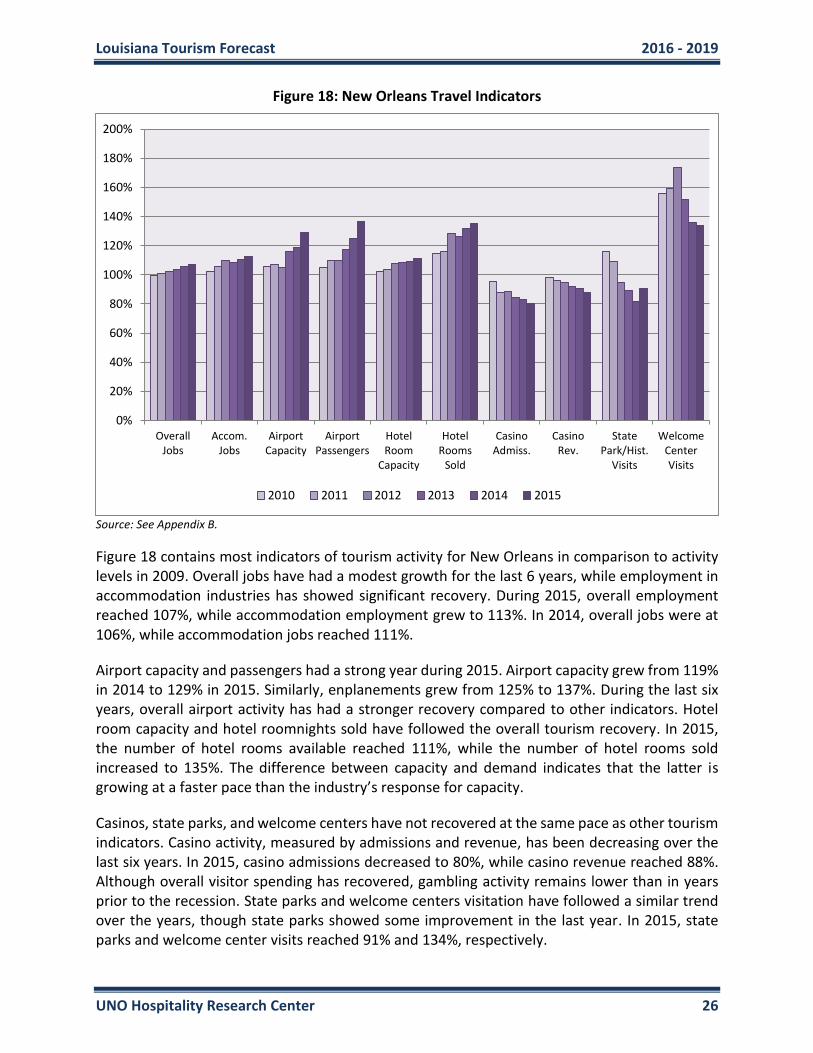
Figure 18 contains most indicators of tourism activity for New Orleans in comparison to activity levels in 2009. Overall jobs have had a modest growth for the last 6 years, while employment in accommodation industries has showed significant recovery. During 2015, overall employment reached 107%, while accommodation employment grew to 113%. In 2014, overall jobs were at 106%, while accommodation jobs reached 111%.
Airport capacity and passengers had a strong year during 2015. Airport capacity grew from 119% in 2014 to 129% in 2015. Similarly, enplanements grew from 125% to 137%. During the last six years, overall airport activity has had a stronger recovery compared to other indicators. Hotel room capacity and hotel roomnights sold have followed the overall tourism recovery. In 2015, the number of hotel rooms available reached 111%, while the number of hotel rooms sold increased to 135%. The difference between capacity and demand indicates that the latter is growing at a faster pace than the industry’s response for capacity.
Casinos, state parks, and welcome centers have not recovered at the same pace as other tourism indicators. Casino activity, measured by admissions and revenue, has been decreasing over the last six years. In 2015, casino admissions decreased to 80%, while casino revenue reached 88%. Although overall visitor spending has recovered, gambling activity remains lower than in years prior to the recession. State parks and welcome centers visitation have followed a similar trend over the years, though state parks showed some improvement in the last year. In 2015, state parks and welcome center visits reached 91% and 134%, respectively.
0%
20%
40%
60%
80%
100%
120%
140%
160%
180%
200%
OverallJobs
Accom.Jobs
AirportCapacity
AirportPassengers
HotelRoom
Capacity
HotelRooms
Sold
CasinoAdmiss.
CasinoRev.
StatePark/Hist.
Visits
WelcomeCenterVisits
2010 2011 2012 2013 2014 2015

Louisiana Tourism Forecast 2016 - 2019
UNO Hospitality Research Center 27
REST OF THE STATE
Table 10 contains estimates for visitation and spending in the Rest of Louisiana. Because of the limited visitor survey data available, along with severity of the damage on tourism activity after the Hurricanes, regions in Louisiana, excluding New Orleans, are analyzed as a whole. Areas comprised in the Rest of Louisiana include Alexandria, Baton Rouge, Lafayette, Lake Charles, Monroe, Shreveport, and Rural Areas of the southern and northern parts of the state.
Visitation to the Rest of the State represents about 66% of the total number of visitors in the state. Until 2008, the number of visitors showed an upward trend, followed by a drop in 2009 due to the recession. During 2010 and 2011, the BP oil spill brought non-traditional visitors, and by 2012 traditional travelers returned to the area. During 2015, total visitation remained unchanged at 19.2 million. The total number of visitors reached last year represented the highest figure since the beginning of the study. By 2019, visitation is estimated to be approximately 20.3 million visitors; that is an increase of approximately of 1% annually.
Although areas in the Rest of the State have more visitors, its economic activity is smaller. In 2015 visitor spending reached $4.4 billion. Although visitation remained unchanged, total spending increased by 2%. Longer stays, combined with non-traditional expenditures, caused spending to grow at a faster pace. Visitors spent approximately $231 during their trip, an increase of 2% from $227 in 2014. By 2019, spending is expected to grow by 2% annually reaching $4.8 billion. Spending figures presented in this analysis are not adjusted for inflation (Figure 19).
Table 10: Rest of the State Visitation and Spending (Domestic and Foreign)
2005 2006 2007 2008 2009 2010 2011 2012 2013 2014 2015 2016 2017 2018 2019
Visitors (Millions)1
12.9 14.5 16.7 16.8 16.4 16.8 16.8 17.3 18.3 19.2 19.2 19.4 19.8 20.0 20.3
Total Spending (Billions)2
$3.9 $3.5 $4.1 $4.2 $4.1 $4.0 $4.3 $4.4 $4.3 $4.3 $4.4 $4.4 $4.5 $4.7 $4.8
12005 TIA, CRT, and UNO Hospitality Research Center. 22005 TIA, TSA, and UNO Hospitality Research Center.
Figure 19: Rest of the State Visitation and Spending
$0
$2
$4
$6
$8
0
5
10
15
20
25
20
03
20
04
20
05
20
06
20
07
20
08
20
09
20
10
20
11
20
12
20
13
20
14
20
15
20
16
20
17
20
18
20
19
Visitation
(Bill
ion
s)
(Mill
ion
s)
Spending
Louisiana Tourism Forecast 2016 - 2019
UNO Hospitality Research Center 28
Figure 20: Rest of the State Visitors - Primary Purpose
Source: See Appendix B.
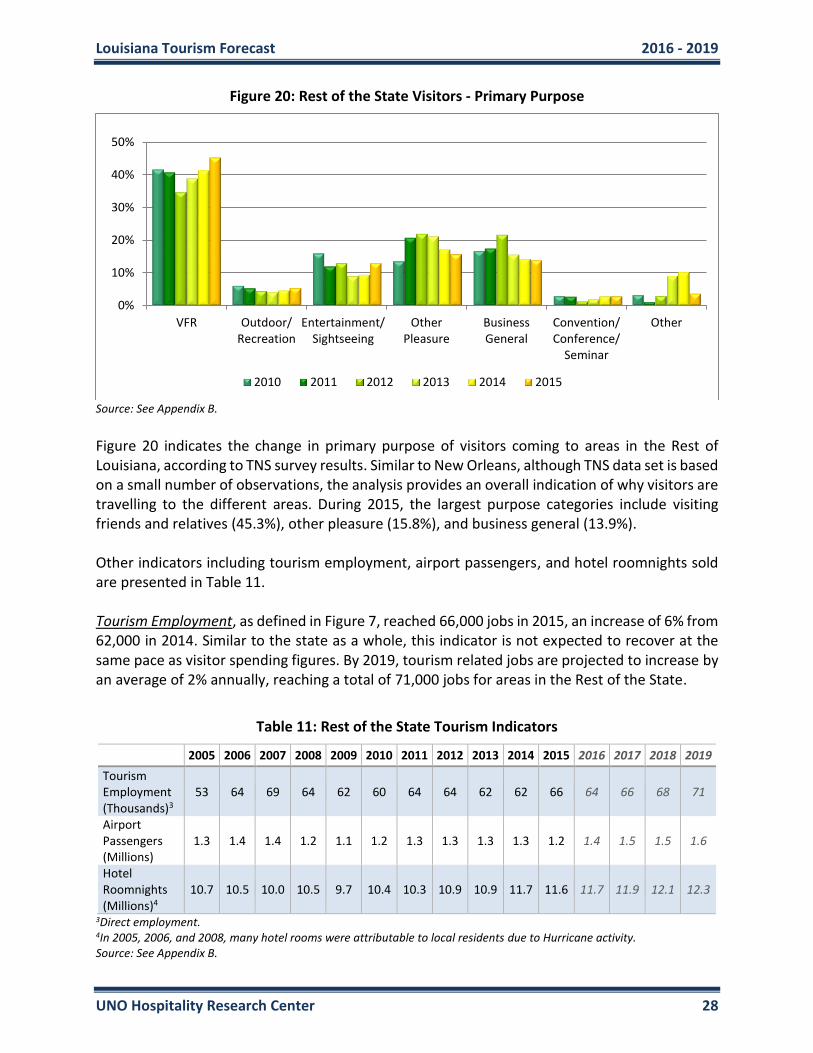
Figure 20 indicates the change in primary purpose of visitors coming to areas in the Rest of Louisiana, according to TNS survey results. Similar to New Orleans, although TNS data set is based on a small number of observations, the analysis provides an overall indication of why visitors are travelling to the different areas. During 2015, the largest purpose categories include visiting friends and relatives (45.3%), other pleasure (15.8%), and business general (13.9%). Other indicators including tourism employment, airport passengers, and hotel roomnights sold are presented in Table 11. Tourism Employment, as defined in Figure 7, reached 66,000 jobs in 2015, an increase of 6% from 62,000 in 2014. Similar to the state as a whole, this indicator is not expected to recover at the same pace as visitor spending figures. By 2019, tourism related jobs are projected to increase by an average of 2% annually, reaching a total of 71,000 jobs for areas in the Rest of the State.
Table 11: Rest of the State Tourism Indicators
2005 2006 2007 2008 2009 2010 2011 2012 2013 2014 2015 2016 2017 2018 2019
Tourism Employment (Thousands)3
53 64 69 64 62 60 64 64 62 62 66 64 66 68 71
Airport Passengers (Millions)
1.3 1.4 1.4 1.2 1.1 1.2 1.3 1.3 1.3 1.3 1.2 1.4 1.5 1.5 1.6
Hotel Roomnights (Millions)4
10.7 10.5 10.0 10.5 9.7 10.4 10.3 10.9 10.9 11.7 11.6 11.7 11.9 12.1 12.3
3Direct employment. 4In 2005, 2006, and 2008, many hotel rooms were attributable to local residents due to Hurricane activity. Source: See Appendix B.
0%
10%
20%
30%
40%
50%
VFR Outdoor/Recreation
Entertainment/Sightseeing
OtherPleasure
BusinessGeneral
Convention/Conference/
Seminar
Other
2010 2011 2012 2013 2014 2015
Louisiana Tourism Forecast 2016 - 2019
UNO Hospitality Research Center 29
Figure 21: Rest of the State Airport Activity
Source: See Appendix B.
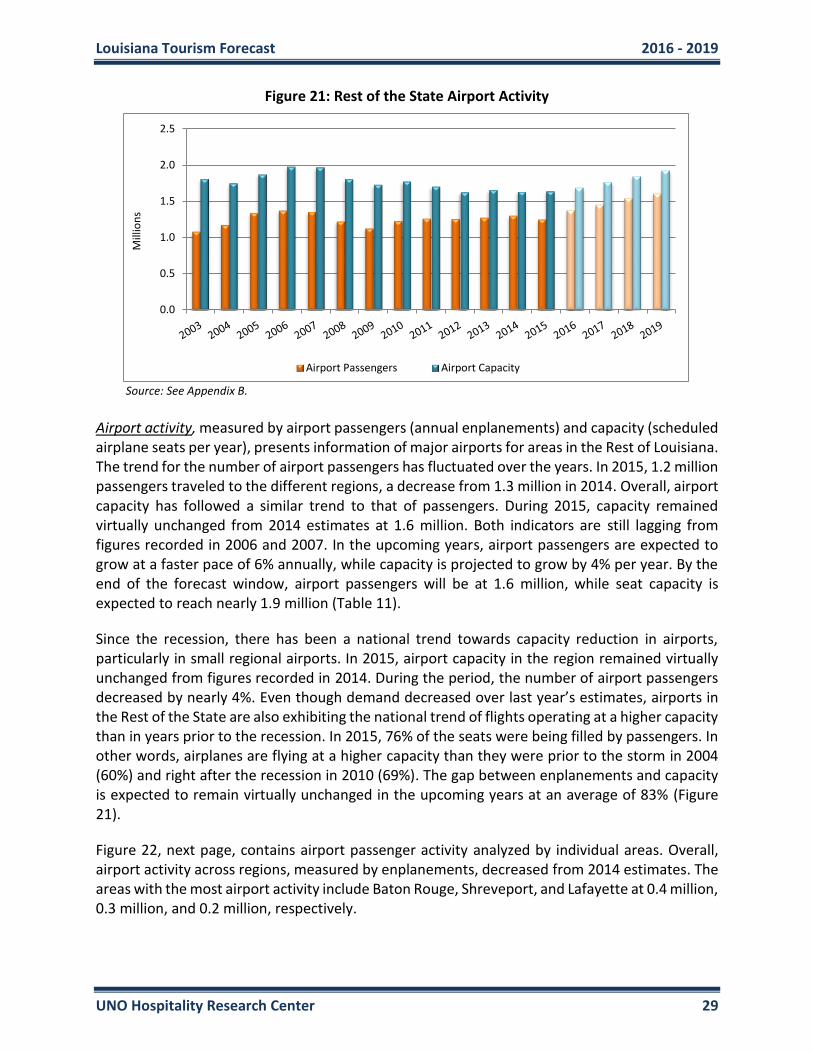
Airport activity, measured by airport passengers (annual enplanements) and capacity (scheduled airplane seats per year), presents information of major airports for areas in the Rest of Louisiana. The trend for the number of airport passengers has fluctuated over the years. In 2015, 1.2 million passengers traveled to the different regions, a decrease from 1.3 million in 2014. Overall, airport capacity has followed a similar trend to that of passengers. During 2015, capacity remained virtually unchanged from 2014 estimates at 1.6 million. Both indicators are still lagging from figures recorded in 2006 and 2007. In the upcoming years, airport passengers are expected to grow at a faster pace of 6% annually, while capacity is projected to grow by 4% per year. By the end of the forecast window, airport passengers will be at 1.6 million, while seat capacity is expected to reach nearly 1.9 million (Table 11).
Since the recession, there has been a national trend towards capacity reduction in airports, particularly in small regional airports. In 2015, airport capacity in the region remained virtually unchanged from figures recorded in 2014. During the period, the number of airport passengers decreased by nearly 4%. Even though demand decreased over last year’s estimates, airports in the Rest of the State are also exhibiting the national trend of flights operating at a higher capacity than in years prior to the recession. In 2015, 76% of the seats were being filled by passengers. In other words, airplanes are flying at a higher capacity than they were prior to the storm in 2004 (60%) and right after the recession in 2010 (69%). The gap between enplanements and capacity is expected to remain virtually unchanged in the upcoming years at an average of 83% (Figure 21).
Figure 22, next page, contains airport passenger activity analyzed by individual areas. Overall, airport activity across regions, measured by enplanements, decreased from 2014 estimates. The areas with the most airport activity include Baton Rouge, Shreveport, and Lafayette at 0.4 million, 0.3 million, and 0.2 million, respectively.
0.0
0.5
1.0
1.5
2.0
2.5M
illio
ns
Airport Passengers Airport Capacity

Louisiana Tourism Forecast 2016 - 2019
UNO Hospitality Research Center 30
Figure 22: Rest of the State Airport Passengers by Region
Source: See Appendix B.
Hotel Roomnights, measured by roomnights demand, decreased by 1% over 2014 indicators. During 2015, hotel rooms sold reached 11.6 million roomnights, compared to 11.7 million in the previous year. While this indicator decreased in the last period, it is expected to recover in the upcoming years. Rooms sold are projected to grow by 1% annually as new properties build more capacity in the different regions across the state. By 2019, a total on 12.3 million roomnights are expected to be sold across the different areas in the Rest of the State (Table 11).
Figure 23 contains the relative size of individual markets within the state as represented by annual hotel roomnights sales. In 2015, only three out of the seven areas presented an increase in rooms sold. Baton Rouge increased by 4%, Lake Charles increased by 12%, and the Rural North grew by 2%. Baton Rouge, Shreveport, and Rural South contain the largest number of rooms at 2.7 million, 2.3 million, and 1.8 million, respectively.
Figure 23: Rest of the State Hotel Roomnights by Region
Source: See Appendix B.
0
100,000
200,000
300,000
400,000
500,000
Alexandria Baton Rouge Lafayette Lake Charles Monroe Shreveport
2012 2013 2014 2015
0.0
0.5
1.0
1.5
2.0
2.5
3.0
Alexandria Baton Rouge Lafayette Lake Charles Monroe Shreveport Rural North Rural South
Mill
ion
s
2012 2013 2014 2015

Louisiana Tourism Forecast 2016 - 2019
UNO Hospitality Research Center 31
Table 12: Louisiana State Taxes (Paid by Rest of the State Visitors)
2006 2007 2008 2009 2010 2011 2012 2013 2014 2015 2016 2017 2018 2019
Hotel Sales Taxes (Millions)
$29 $30 $33 $30 $32 $32 $34 $34 $37 $37 $38 $39 $40 $42
Non-hotel Taxes (Millions)
$301 $363 $366 $352 $328 $348 $357 $359 $364 $375 $373 $381 $395 $410
Table 12 includes total (direct and indirect) state taxes paid by visitors to areas in the Rest of the State. The direct revenue measured in this analysis includes hotel, sales, and gambling taxes. During 2015, total taxes increased by 3% from 2014 estimates. Taxes collected in hotels grew by 1%, while sales and gambling taxes increased 3%. Overall, taxes collected from visitors in the Rest of the State increased to $413 million in 2015 from $401 million in 2014. Total taxes are expected to increase by 2% annually in the upcoming years, reaching $451 million in 2019. During the same period, sales and gambling taxes are projected to be at $410 million, while hotel taxes will reach $42 million. Similar to other spending estimates, figures presented in Table 12 are not adjusted for inflation.
Figure 24 contains other tourism indicators grouped into four segments. See the definition of each segment in Figure 10. Contrary to the trend in New Orleans, Travel Infrastructure in the Rest of the State has grown continuously and at a similar pace as Travel Activity. In 2015, infrastructure reached 115% from 108% during 2014, while travel activity decreased slightly to 116% from 118%. Traditional leisure sightseers, represented by Leisure Activity, have also followed a different trend to that of New Orleans. In 2015, leisure visitors increased to 106% from 100% in 2014. Convention Activity in areas in the Rest of the State has remained strong. Although this indicator is volatile, it shows a general upward trend as more cities have managed to expand their market to smaller meetings. In 2015, convention activity increase to 108% from 103% recorded during 2014.
Figure 24: Rest of the State Travel Indicators by Segments
Source: See Appendix B.
0%
20%
40%
60%
80%
100%
120%
140%
Travel Infrastructure Travel Activity Leisure Activity Convention Activity
2010 2011 2012 2013 2014 2015
Louisiana Tourism Forecast 2016 - 2019
UNO Hospitality Research Center 32
Figure 25: Rest of the State Travel Indicators
Source: See Appendix B.
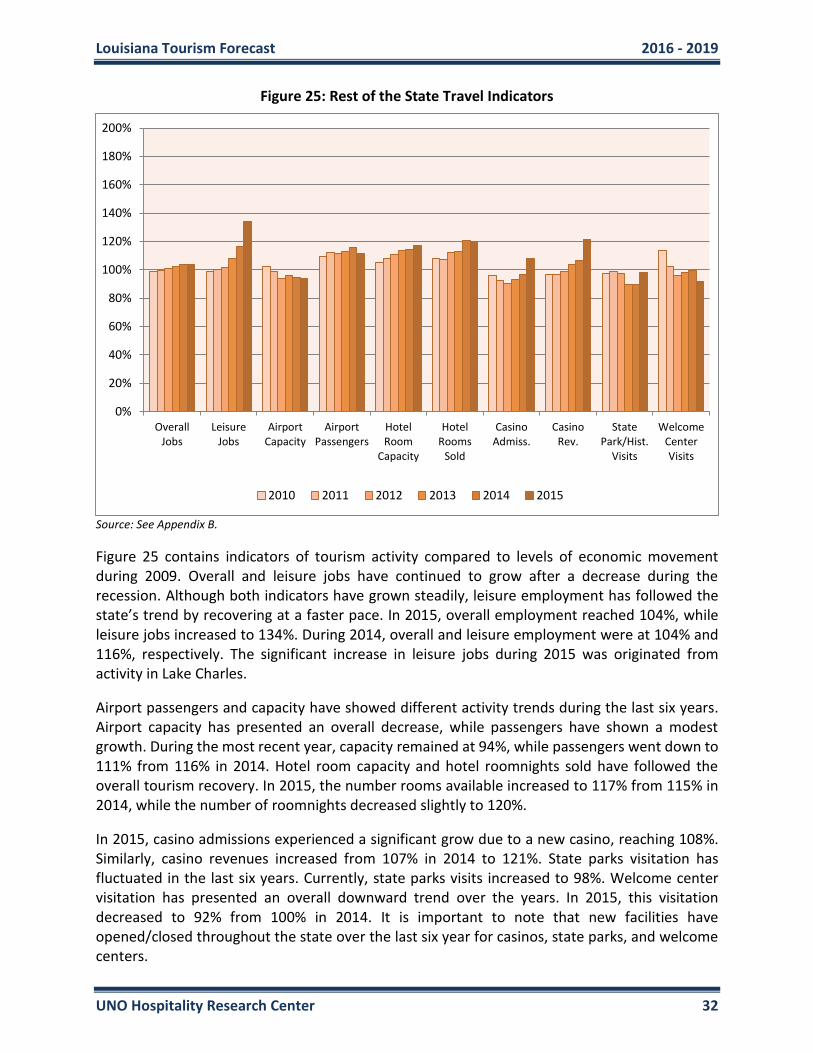
Figure 25 contains indicators of tourism activity compared to levels of economic movement during 2009. Overall and leisure jobs have continued to grow after a decrease during the recession. Although both indicators have grown steadily, leisure employment has followed the state’s trend by recovering at a faster pace. In 2015, overall employment reached 104%, while leisure jobs increased to 134%. During 2014, overall and leisure employment were at 104% and 116%, respectively. The significant increase in leisure jobs during 2015 was originated from activity in Lake Charles.
Airport passengers and capacity have showed different activity trends during the last six years. Airport capacity has presented an overall decrease, while passengers have shown a modest growth. During the most recent year, capacity remained at 94%, while passengers went down to 111% from 116% in 2014. Hotel room capacity and hotel roomnights sold have followed the overall tourism recovery. In 2015, the number rooms available increased to 117% from 115% in 2014, while the number of roomnights decreased slightly to 120%.
In 2015, casino admissions experienced a significant grow due to a new casino, reaching 108%. Similarly, casino revenues increased from 107% in 2014 to 121%. State parks visitation has fluctuated in the last six years. Currently, state parks visits increased to 98%. Welcome center visitation has presented an overall downward trend over the years. In 2015, this visitation decreased to 92% from 100% in 2014. It is important to note that new facilities have opened/closed throughout the state over the last six year for casinos, state parks, and welcome centers.
0%
20%
40%
60%
80%
100%
120%
140%
160%
180%
200%
OverallJobs
LeisureJobs
AirportCapacity
AirportPassengers
HotelRoom
Capacity
HotelRooms
Sold
CasinoAdmiss.
CasinoRev.
StatePark/Hist.
Visits
WelcomeCenterVisits
2010 2011 2012 2013 2014 2015
Louisiana Tourism Forecast 2016 - 2019
UNO Hospitality Research Center 33
Individual Areas
ALEXANDRIA
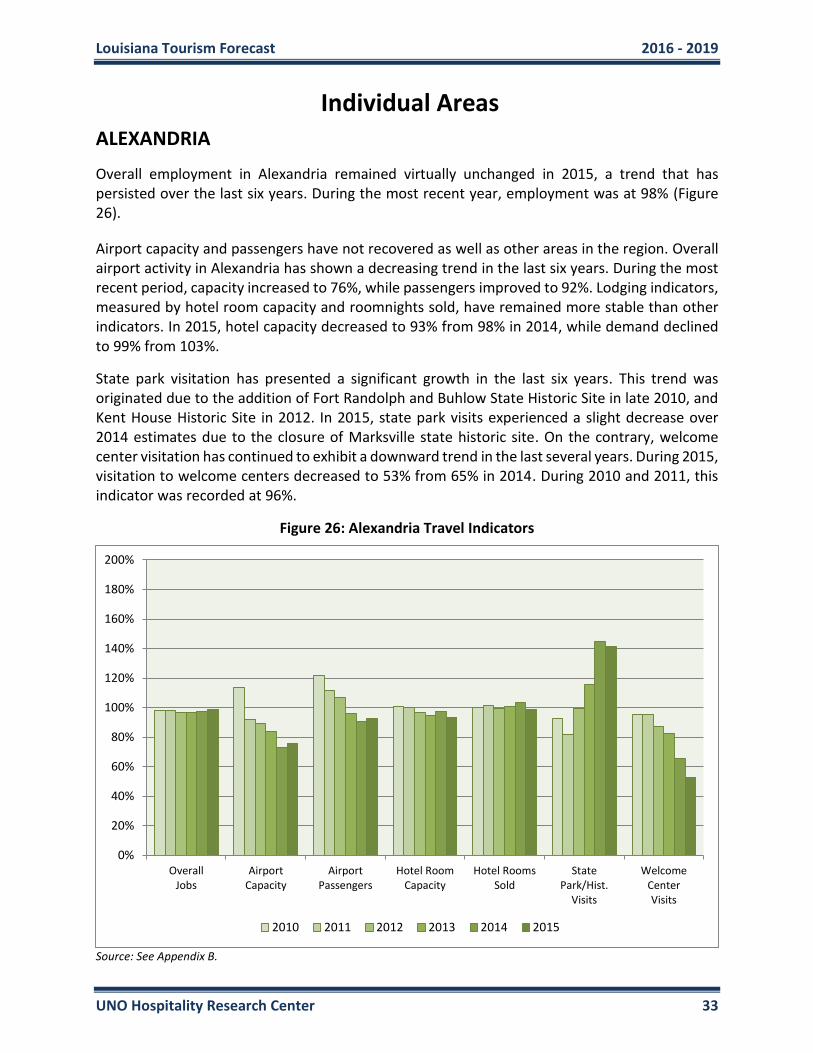
Overall employment in Alexandria remained virtually unchanged in 2015, a trend that has persisted over the last six years. During the most recent year, employment was at 98% (Figure 26).
Airport capacity and passengers have not recovered as well as other areas in the region. Overall airport activity in Alexandria has shown a decreasing trend in the last six years. During the most recent period, capacity increased to 76%, while passengers improved to 92%. Lodging indicators, measured by hotel room capacity and roomnights sold, have remained more stable than other indicators. In 2015, hotel capacity decreased to 93% from 98% in 2014, while demand declined to 99% from 103%.
State park visitation has presented a significant growth in the last six years. This trend was originated due to the addition of Fort Randolph and Buhlow State Historic Site in late 2010, and Kent House Historic Site in 2012. In 2015, state park visits experienced a slight decrease over 2014 estimates due to the closure of Marksville state historic site. On the contrary, welcome center visitation has continued to exhibit a downward trend in the last several years. During 2015, visitation to welcome centers decreased to 53% from 65% in 2014. During 2010 and 2011, this indicator was recorded at 96%.
Figure 26: Alexandria Travel Indicators
Source: See Appendix B.
0%
20%
40%
60%
80%
100%
120%
140%
160%
180%
200%
OverallJobs
AirportCapacity
AirportPassengers
Hotel RoomCapacity
Hotel RoomsSold
StatePark/Hist.
Visits
WelcomeCenterVisits
2010 2011 2012 2013 2014 2015
Louisiana Tourism Forecast 2016 - 2019
UNO Hospitality Research Center 34
BATON ROUGE
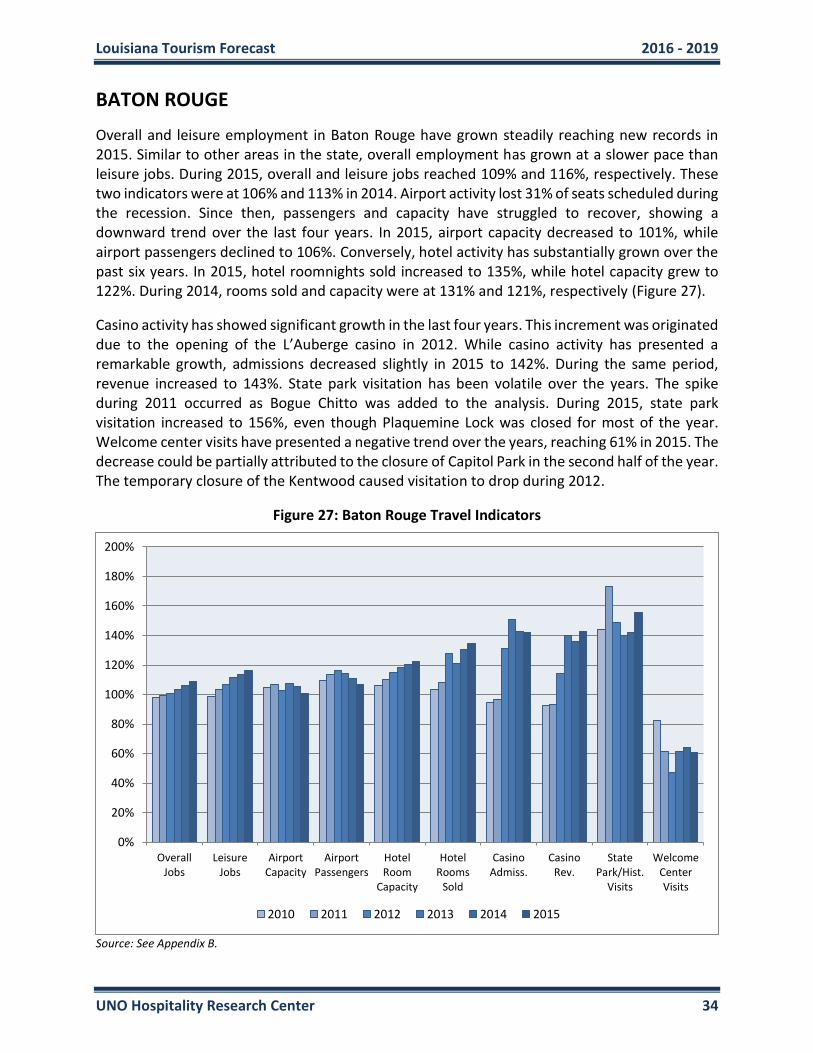
Overall and leisure employment in Baton Rouge have grown steadily reaching new records in 2015. Similar to other areas in the state, overall employment has grown at a slower pace than leisure jobs. During 2015, overall and leisure jobs reached 109% and 116%, respectively. These two indicators were at 106% and 113% in 2014. Airport activity lost 31% of seats scheduled during the recession. Since then, passengers and capacity have struggled to recover, showing a downward trend over the last four years. In 2015, airport capacity decreased to 101%, while airport passengers declined to 106%. Conversely, hotel activity has substantially grown over the past six years. In 2015, hotel roomnights sold increased to 135%, while hotel capacity grew to 122%. During 2014, rooms sold and capacity were at 131% and 121%, respectively (Figure 27).
Casino activity has showed significant growth in the last four years. This increment was originated due to the opening of the L’Auberge casino in 2012. While casino activity has presented a remarkable growth, admissions decreased slightly in 2015 to 142%. During the same period, revenue increased to 143%. State park visitation has been volatile over the years. The spike during 2011 occurred as Bogue Chitto was added to the analysis. During 2015, state park visitation increased to 156%, even though Plaquemine Lock was closed for most of the year. Welcome center visits have presented a negative trend over the years, reaching 61% in 2015. The decrease could be partially attributed to the closure of Capitol Park in the second half of the year. The temporary closure of the Kentwood caused visitation to drop during 2012.
Figure 27: Baton Rouge Travel Indicators
Source: See Appendix B.
0%
20%
40%
60%
80%
100%
120%
140%
160%
180%
200%
OverallJobs
LeisureJobs
AirportCapacity
AirportPassengers
HotelRoom
Capacity
HotelRooms
Sold
CasinoAdmiss.
CasinoRev.
StatePark/Hist.
Visits
WelcomeCenterVisits
2010 2011 2012 2013 2014 2015
Louisiana Tourism Forecast 2016 - 2019
UNO Hospitality Research Center 35
LAFAYETTE
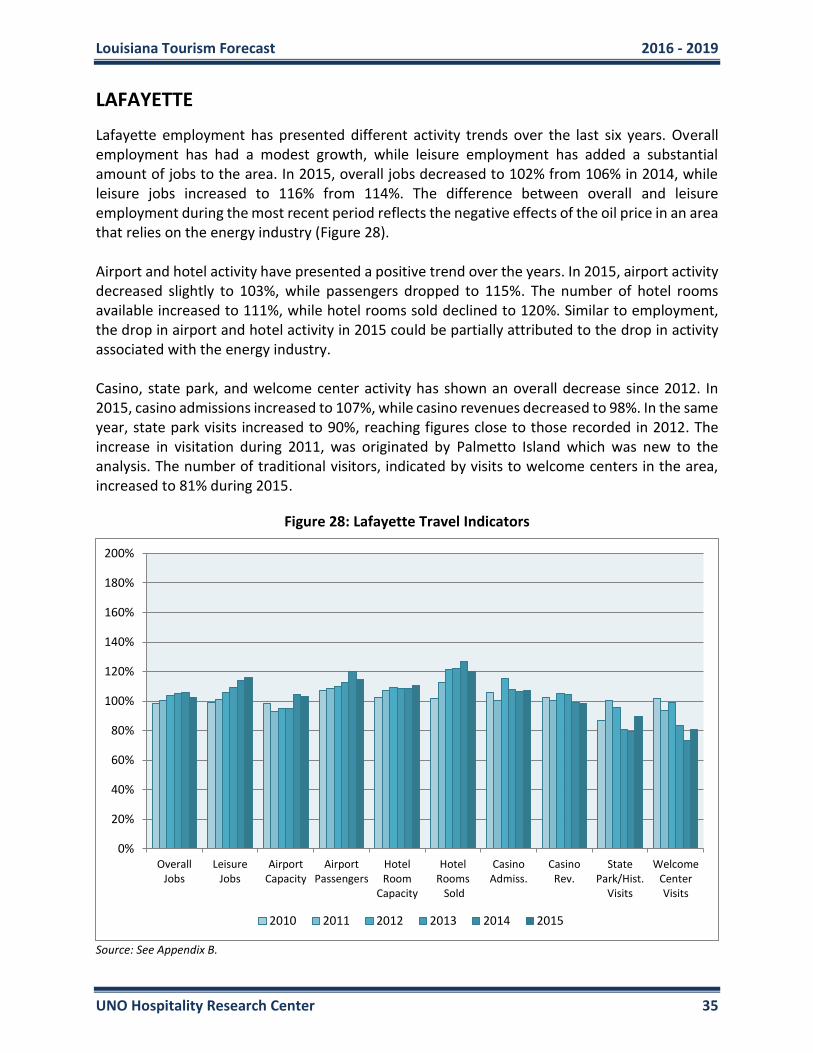
Lafayette employment has presented different activity trends over the last six years. Overall employment has had a modest growth, while leisure employment has added a substantial amount of jobs to the area. In 2015, overall jobs decreased to 102% from 106% in 2014, while leisure jobs increased to 116% from 114%. The difference between overall and leisure employment during the most recent period reflects the negative effects of the oil price in an area that relies on the energy industry (Figure 28). Airport and hotel activity have presented a positive trend over the years. In 2015, airport activity decreased slightly to 103%, while passengers dropped to 115%. The number of hotel rooms available increased to 111%, while hotel rooms sold declined to 120%. Similar to employment, the drop in airport and hotel activity in 2015 could be partially attributed to the drop in activity associated with the energy industry. Casino, state park, and welcome center activity has shown an overall decrease since 2012. In 2015, casino admissions increased to 107%, while casino revenues decreased to 98%. In the same year, state park visits increased to 90%, reaching figures close to those recorded in 2012. The increase in visitation during 2011, was originated by Palmetto Island which was new to the analysis. The number of traditional visitors, indicated by visits to welcome centers in the area, increased to 81% during 2015.
Figure 28: Lafayette Travel Indicators
Source: See Appendix B.
0%
20%
40%
60%
80%
100%
120%
140%
160%
180%
200%
OverallJobs
LeisureJobs
AirportCapacity
AirportPassengers
HotelRoom
Capacity
HotelRooms Sold
CasinoAdmiss.
CasinoRev.
StatePark/Hist.
Visits
WelcomeCenterVisits
2010 2011 2012 2013 2014 2015

Louisiana Tourism Forecast 2016 - 2019
UNO Hospitality Research Center 36
LAKE CHARLES
Lake Charles employment has maintained the highest levels of growth compared to other areas in the state. In 2015, overall employment increased to 113%, while leisure jobs increased substantially to 127%. Unlike Lafayette, Lake Charles has managed to increase overall employment associated with other non-energy related industries, including manufacturing and construction (Figure 29).
Like other areas in the state, airport capacity and passengers have followed different trends over the last several years. Airport capacity has remained volatile, increasing to 98% during 2015. Airport demand has maintained a positive trend, reaching 134% in the most recent year. Hotel activity has also presented an upward trend, and by 2015, it experienced a significant growth. Room capacity grew to 146%, while rooms sold went up to 177%. Hotel capacity and demand were recorded at 129% and 160% during 2014, respectively.
In 2015, casino activity showed an enormous growth due to the opening of Golden Nugget casino. The increase in leisure employment could be partially attributed to the new casino. A similar trend in casino activity and employment occurred during 2010 due to L’Auberge du Lac casino. State park visitation has been decreasing over the years. In 2015, this indicator declined to 88%. Conversely, welcome center visits have shown an overall growth. The unexpected drop in visitation during 2009 and 2015 was caused due to a temporary closure of Vinton welcome center for renovations.
Figure 29: Lake Charles Travel Indicators
Source: See Appendix B.
0%
20%
40%
60%
80%
100%
120%
140%
160%
180%
200%
OverallJobs
LeisureJobs
AirportCapacity
AirportPassengers
HotelRoom
Capacity
HotelRooms
Sold
CasinoAdmiss.
CasinoRev.
StatePark/Hist.
Visits
WelcomeCenterVisits
2010 2011 2012 2013 2014 2015
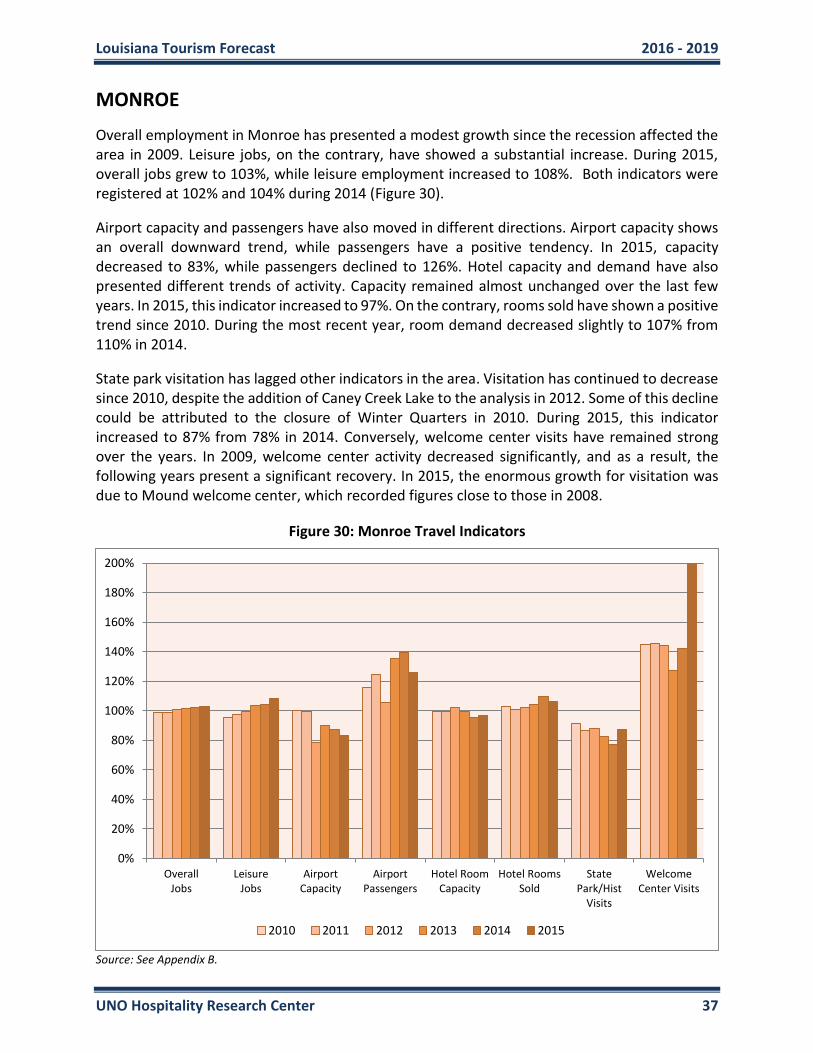
Louisiana Tourism Forecast 2016 - 2019
UNO Hospitality Research Center 37
MONROE
Overall employment in Monroe has presented a modest growth since the recession affected the area in 2009. Leisure jobs, on the contrary, have showed a substantial increase. During 2015, overall jobs grew to 103%, while leisure employment increased to 108%. Both indicators were registered at 102% and 104% during 2014 (Figure 30).
Airport capacity and passengers have also moved in different directions. Airport capacity shows an overall downward trend, while passengers have a positive tendency. In 2015, capacity decreased to 83%, while passengers declined to 126%. Hotel capacity and demand have also presented different trends of activity. Capacity remained almost unchanged over the last few years. In 2015, this indicator increased to 97%. On the contrary, rooms sold have shown a positive trend since 2010. During the most recent year, room demand decreased slightly to 107% from 110% in 2014.
State park visitation has lagged other indicators in the area. Visitation has continued to decrease since 2010, despite the addition of Caney Creek Lake to the analysis in 2012. Some of this decline could be attributed to the closure of Winter Quarters in 2010. During 2015, this indicator increased to 87% from 78% in 2014. Conversely, welcome center visits have remained strong over the years. In 2009, welcome center activity decreased significantly, and as a result, the following years present a significant recovery. In 2015, the enormous growth for visitation was due to Mound welcome center, which recorded figures close to those in 2008.
Figure 30: Monroe Travel Indicators
Source: See Appendix B.
0%
20%
40%
60%
80%
100%
120%
140%
160%
180%
200%
OverallJobs
LeisureJobs
AirportCapacity
AirportPassengers
Hotel RoomCapacity
Hotel RoomsSold
StatePark/Hist
Visits
WelcomeCenter Visits
2010 2011 2012 2013 2014 2015
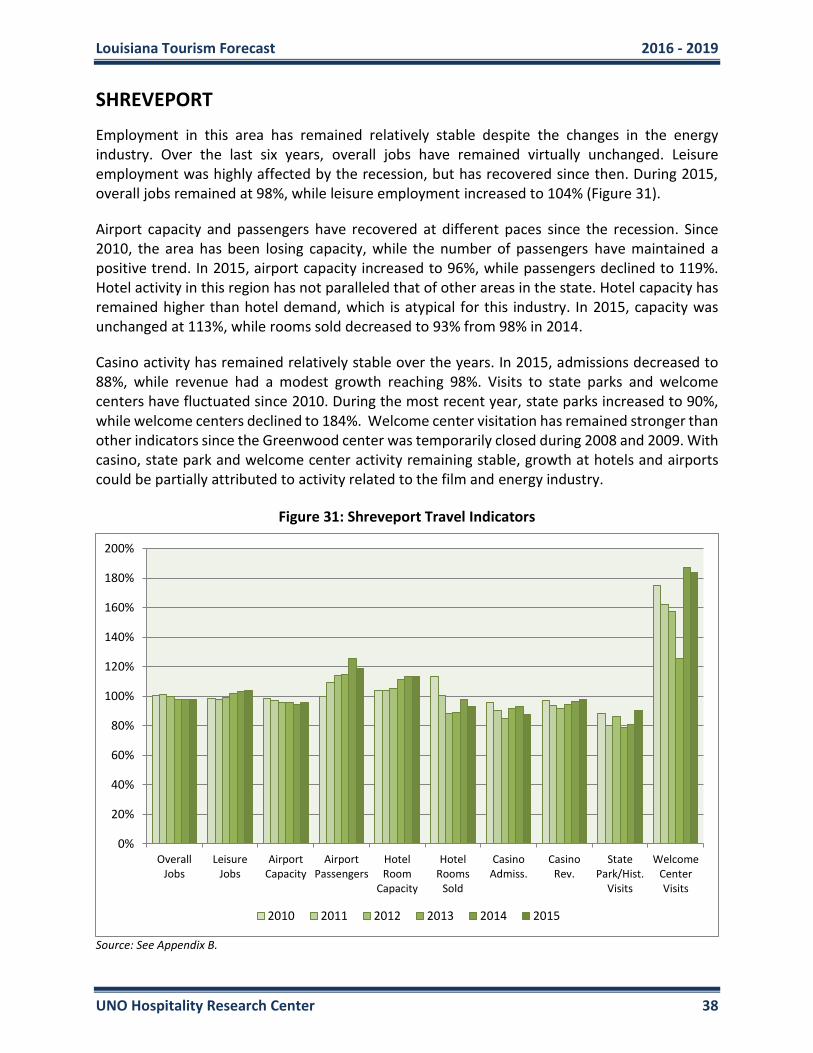
Louisiana Tourism Forecast 2016 - 2019
UNO Hospitality Research Center 38
SHREVEPORT
Employment in this area has remained relatively stable despite the changes in the energy industry. Over the last six years, overall jobs have remained virtually unchanged. Leisure employment was highly affected by the recession, but has recovered since then. During 2015, overall jobs remained at 98%, while leisure employment increased to 104% (Figure 31).
Airport capacity and passengers have recovered at different paces since the recession. Since 2010, the area has been losing capacity, while the number of passengers have maintained a positive trend. In 2015, airport capacity increased to 96%, while passengers declined to 119%. Hotel activity in this region has not paralleled that of other areas in the state. Hotel capacity has remained higher than hotel demand, which is atypical for this industry. In 2015, capacity was unchanged at 113%, while rooms sold decreased to 93% from 98% in 2014.
Casino activity has remained relatively stable over the years. In 2015, admissions decreased to 88%, while revenue had a modest growth reaching 98%. Visits to state parks and welcome centers have fluctuated since 2010. During the most recent year, state parks increased to 90%, while welcome centers declined to 184%. Welcome center visitation has remained stronger than other indicators since the Greenwood center was temporarily closed during 2008 and 2009. With casino, state park and welcome center activity remaining stable, growth at hotels and airports could be partially attributed to activity related to the film and energy industry.
Figure 31: Shreveport Travel Indicators
Source: See Appendix B.
0%
20%
40%
60%
80%
100%
120%
140%
160%
180%
200%
OverallJobs
LeisureJobs
AirportCapacity
AirportPassengers
HotelRoom
Capacity
HotelRooms
Sold
CasinoAdmiss.
CasinoRev.
StatePark/Hist.
Visits
WelcomeCenterVisits
2010 2011 2012 2013 2014 2015

Louisiana Tourism Forecast 2016 - 2019
UNO Hospitality Research Center 39
OTHER AREAS
Overall jobs for non-metropolitan areas in the north of Louisiana have remained virtually unchanged over the last six periods. Currently this indicator is at 100%. Conversely, hotel room activity has substantially grown. In the rural northern part of the state, new hotels have been built, and rooms are being filled. Activity related to the natural gas shale in northwestern Louisiana has been contributing to strong hotel sales. In 2015, room capacity remained at 111%, while roomnights sold increased to 116%. The oil industry existent in Houma represents a strong driver of economic activity in the area. Even though the area lost jobs during 2015, employment had a positive trend until recently. Jobs in this area decreased from 109% in 2014 to 104% in 2015. Hotels around the area have also added capacity to match local needs from the oil industry. In 2015, hotel capacity increased to 123%, while rooms sold declined to 131%. Capacity and demand were recorded at 119% and 137% during 2014, respectively.
Figure 32: Other Areas Travel Indicators
Source: See Appendix B.
0%
20%
40%
60%
80%
100%
120%
140%
160%
180%
200%
Overall Jobs -Rural Louisiana
Hotel RoomCapacity - Rural
North
Hotel Rooms Sold -Rural North
Overall Jobs -Houma
Hotel RoomCapacity - Rural
South
Hotel Rooms Sold -Rural South
2010 2011 2012 2013 2014 2015

Louisiana Tourism Forecast 2016 - 2019
UNO Hospitality Research Center 40
Appendix A Forecast Accuracy
This section contains an evaluation of the forecast accuracy for hotel roomnights sold, airport passengers, number of visitors, and spending in the state of Louisiana. Hotel rooms, measured by roomnights demand (Table 13), and airport passengers, measured by enplanements (Table 14), are examined first since their values are reported by external sources and can be easily checked. Passenger statistics are provided by individual airports, while hotel roomnights sold figures originate from Smith Travel Research. It is important to note that hotel rooms sold used to estimate visitation and spending exclude residents. However, the values presented throughout the report for hotel rooms have been adjusted to be consistent with STR hotel room demand.
Methodologies for forecasting hotel rooms and air passengers have remained relatively unchanged since the start of this project. External factors, such as Hurricanes Gustav and Ike in 2008, the national recession in 2009, or the BP oil spill in 2010, resulted in trend changes in the forecast. Since 2012, recovery has moved at a faster pace resulting in a higher forecast for future years. Although many factors are involved and reality does not match estimates perfectly, predictions have been very consistent over the years.
Table 13: Forecast Performance - Hotel Roomnights
Millions 2011 2012 2013 2014 2015 2016 2017 2018 2019
Forecast 2012 18.7 19.3 19.6 19.8 20.1 Forecast 2013 18.6 20.0 20.2 20.2 20.5 20.6 Forecast 2014 20.0 19.9 20.1 20.1 20.2 Forecast 2015 21.2 21.4 21.6 21.8 22.3 Forecast 2016 18.6 20.0 20.0 21.1 21.3 22.0 22.7 23.5 23.5
Change from 2015 - - - -0.3% -0.4% 2.0% 3.9% 5.4% -
Table 14: Forecast Performance - Airport Passengers
Millions 2011 2012 2013 2014 2015 2016 2017 2018 2019
Forecast 2012 5.6 5.6 5.7 5.7 5.9 Forecast 2013 5.5 5.6 5.7 5.7 5.9 6.0 Forecast 2014 5.9 5.9 6.0 6.1 6.2 Forecast 2015 6.2 6.4 6.4 6.6 6.8 Forecast 2016 5.5 5.6 5.9 6.2 6.6 7.0 7.4 7.9 8.2
Change from 2015 - - - 0.0% 3.7% 9.6% 12.1% 15.1% -

Louisiana Tourism Forecast 2016 - 2019
UNO Hospitality Research Center 41
Table 15: Forecast Performance - Number of Visitors
Millions 2011 2012 2013 2014 2015 2016 2017 2018 2019
Forecast 2012 25.5 26.1 26.8 27.0 27.5 Forecast 2013 26.3 26.8 27.2 27.6 28.0 Forecast 2014 27.3 27.5 27.7 28.0 28.2 Forecast 2015 27.4 28.7 29.2 29.5 30.1 30.6 Forecast 2016 25.5 26.3 27.6 28.7 28.9 29.7 30.4 31.2 31.5
Change from 2015 - - - -0.1% -0.9% 0.4% 1.2% 2.1% -
Visitation, presented in Table 15, is tougher to verify. It is an estimate which evolves over time, and cannot be checked directly against an external source, except for other estimates. Data for part of Louisiana is limited in scope, as visitor surveys from TNS have a relatively small number of observations to cover such a large area. Therefore, the forecast methodology has been revised over the years to include additional information available to the center. Changes in visitor type, and characteristics, especially for non-hotel visitor, along with external factors, like the recessionary effects, have been given a greater weight on the forecast for future years. During the most recent forecast, estimates were revised lower to reflect a slight decline in visitation for the last two years. The new estimates between 2016 and 2018 were also revised to illustrate a better than initially projected visitation. While visitation and its methodology continues to be revised, projections have remained reliable over the years. Spending is the most difficult calculation, since it is contingent upon the accuracy in the number of visitors to the state. Due to a small TNS sample size for visitor spending, the methodology has also been continually revised over the years of this project. For instance, methods to determine transportation spending for New Orleans visitors as they move through the Rest of the State have been estimated and then revised in later forecast cycles. In addition, spending per person, particularly in New Orleans, has been higher than expected. Changes in spending, not only reflect visitors choosing to spend more, but also illustrate the effects of inflation. In the most recent forecast, spending estimates were also revised higher/lower based on new information available to the center. Similar to visitation, the new estimates for spending have remained comparable to those made in previous years (Table 16).
Table 16: Forecast Performance - Visitor Spending
$Billions 2011 2012 2013 2014 2015 2016 2017 2018 2019
Forecast 2012 10.0 10.4 10.9 11.1 11.5 Forecast 2013 10.7 11.1 11.3 11.6 11.7 Forecast 2014 10.8 10.9 11.2 11.5 11.7 Forecast 2015 11.2 11.5 11.8 12.0 12.5 Forecast 2016 10.0 10.6 10.8 11.2 11.5 11.7 12.2 13.0 13.3
Change from 2015 - - - 0.1% -0.4% -0.7% 1.4% 3.6% -
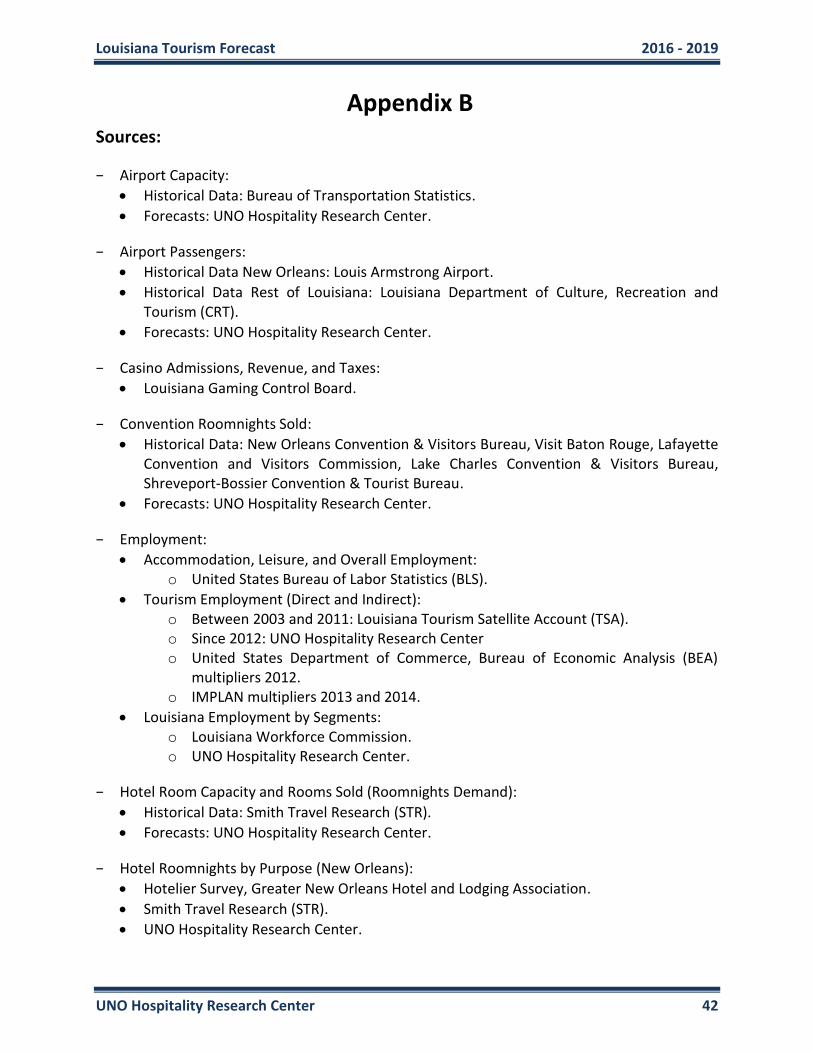
Louisiana Tourism Forecast 2016 - 2019
UNO Hospitality Research Center 42
Appendix B Sources:
− Airport Capacity:
Historical Data: Bureau of Transportation Statistics.
Forecasts: UNO Hospitality Research Center.
− Airport Passengers:
Historical Data New Orleans: Louis Armstrong Airport.
Historical Data Rest of Louisiana: Louisiana Department of Culture, Recreation and Tourism (CRT).
Forecasts: UNO Hospitality Research Center.
− Casino Admissions, Revenue, and Taxes:
Louisiana Gaming Control Board.
− Convention Roomnights Sold:
Historical Data: New Orleans Convention & Visitors Bureau, Visit Baton Rouge, Lafayette Convention and Visitors Commission, Lake Charles Convention & Visitors Bureau, Shreveport-Bossier Convention & Tourist Bureau.
Forecasts: UNO Hospitality Research Center.
− Employment:
Accommodation, Leisure, and Overall Employment: o United States Bureau of Labor Statistics (BLS).
Tourism Employment (Direct and Indirect): o Between 2003 and 2011: Louisiana Tourism Satellite Account (TSA). o Since 2012: UNO Hospitality Research Center o United States Department of Commerce, Bureau of Economic Analysis (BEA)
multipliers 2012. o IMPLAN multipliers 2013 and 2014.
Louisiana Employment by Segments: o Louisiana Workforce Commission. o UNO Hospitality Research Center.
− Hotel Room Capacity and Rooms Sold (Roomnights Demand):
Historical Data: Smith Travel Research (STR).
Forecasts: UNO Hospitality Research Center.
− Hotel Roomnights by Purpose (New Orleans):
Hotelier Survey, Greater New Orleans Hotel and Lodging Association.
Smith Travel Research (STR).
UNO Hospitality Research Center.

Louisiana Tourism Forecast 2016 - 2019
UNO Hospitality Research Center 43
− International Visitors:
TIA (U.S. Travel Association) for visitation between 2003 and 2005.
Tourism Satellite Account (TSA) spending between 2003 and 2011.
Louisiana Department of Culture, Recreation and Tourism (CRT).
Hotelier Survey, Greater New Orleans Hotel and Lodging Association.
UNO Hospitality Research Center.
− Louisiana GDP by Segments:
Bureau of Economic Analysis, Industry detail based on the 2007 North American Industry Classification System (NAICS), in current dollars.
UNO Hospitality Research Center.
− Population Estimates and Characteristics:
Historical Data: United States Census Bureau.
Forecasts: UNO Hospitality Research Center.
− Taxes:
Hotel and Non-Hotel Taxes, current and forecast: UNO Hospitality Research Center.
Louisiana Department of Revenue, Orleans and Jefferson parishes, 2004-2015. In 2006, only $19.8 million are attributed to visitors. In 2008, only $27.2 million are attributed to visitors.
− Value Added (Direct and Indirect):
Between 2003 and 2011: Louisiana Tourism Satellite Account (TSA).
Since 2012: UNO Hospitality Research Center
United States Department of Commerce, Bureau of Economic Analysis (BEA) multipliers 2012.
IMPLAN multipliers 2013 and 2014.
− Visitation to State Historic Sites, State Parks, and Welcome Centers:
Louisiana Department of Culture, Recreation and Tourism (CRT).
National Park Services.
− Visitor Type, Travel Decisions, and Primary Purpose:
TNS survey data files.
UNO Hospitality Research Center.
− Visitor Spending Type:
TNS survey data files.
UNO Hospitality Research Center.
Louisiana Tourism Forecast 2016 - 2019
UNO Hospitality Research Center 44
Appendix C
Definitions of Key Terms
Visitors: Tourist or Visitor: Any person who comes temporarily to a specific area in the state of Louisiana and who lives outside the travel destination. The term traveler is also used as synonym. Using the word “tourist” may be confusing to people who are unaware that business travelers or meeting attendees are tourists as much as leisure travelers.
Domestic Visitor: A resident of the U.S. who travels within the country and visits places outside his/her usual environment.
Foreign Visitor: A resident of a foreign country who travels to the U.S.
Overnight Visitor: Any visitor who spends at least one night in Louisiana.
Daytripper: Any visitor who does not stay overnight in Louisiana.
Short Term Visitor: Any visitor who stays in Louisiana for up to 14 days.
Long Term Visitor: Any visitor who stays in Louisiana for 15 or more days.
Association, Convention, Trade Show, and Corporate Meeting Visitors: All visitors who indicate that their primary purpose of visit is to attend a gathering such as a convention, trade show, exposition, or corporate meeting. Business Visitors: All visitors who indicate that their primary purpose of visit is to conduct business in the state of Louisiana.
Leisure Visitors: All visitors who indicate that their primary purpose of visit is to vacation, visit friends and relatives, attend a special event, go to a sporting event, to shop, to dine out, to gamble, or for entertainment. Visitors who pass through are also categorized as leisure visitors.
Analysis:
Roomnights Demand: Number of hotel rooms sold or rented per night.
Enplanements: Total number of passengers boarding an aircraft.

Louisiana Tourism Forecast 2016 - 2019
UNO Hospitality Research Center 45
Statistical Terms:
Median: The median is the number that lies at the midpoint of a distribution. It divides the distribution of scores ranked from lowest to highest into two equal halves. For example, if the scores are 2, 3, 5, 7 and 8, the median would be 5, where 5 is the midpoint with two scores above and two scores below. Mean: The arithmetic mean is the sum of all scores divided by the number of scores. This measure is often called average. For example, if the scores are 1, 3, 4, 6 and 9, the mean would be 4.6. The mean and the median are measures of central tendency. In other words, they indicate the most representative score in the group. The median is helpful when the mean does not make sense (e.g., “average party size” or “average number of kids per family” of 2.5), or when the mean is affected by extreme scores (i.e., outliers). In certain cases, some high spenders may pull the mean expenditure up. In such situation, the median will report a measure that is a more appropriate representation of the distribution.