Look-Ahead Technology for Horizontal Directional Drilling
24
R E P O R T GTI Project No. 15220 Look-Ahead Technology for Horizontal Directional Drilling – Phase 2 Principal Author: Christopher J. Ziolkowski 1700 S. Mt. Prospect Road Des Plaines, Illinois 60018 Final Technical Report Project 2967 Jointly Sponsored by: Water Research Foundation 6666 West Quincy Avenue, Denver, CO 80235-3098 and Gas Technology Institute 1700 S. Mt. Prospect Road Des Plaines, Illinois 60018 Submitted By: Published By: ©2009 Water Research Foundation and Gas Technology Institute. ALL RIGHTS RESERVED
Transcript of Look-Ahead Technology for Horizontal Directional Drilling

R E P O R T
GTI Project No. 15220
Look-Ahead Technology for Horizontal Directional Drilling – Phase 2
Principal Author: Christopher J. Ziolkowski
1700 S. Mt. Prospect Road Des Plaines, Illinois 60018
Final Technical Report Project 2967
Jointly Sponsored by: Water Research Foundation
6666 West Quincy Avenue, Denver, CO 80235-3098
and
Gas Technology Institute 1700 S. Mt. Prospect Road Des Plaines, Illinois 60018
Submitted By:
Published By:
©2009 Water Research Foundation and Gas Technology Institute. ALL RIGHTS RESERVED

Page ii
DISCLAIMER "This information was prepared by Gas Technology Institute (“GTI”) for the Water Research Foundation. Neither GTI, the members of GTI, the Sponsor(s), nor any person acting on behalf of any of them: a. Makes any warranty or representation, express or implied with respect to the accuracy, completeness, or usefulness of the information contained in this report, or that the use of any information, apparatus, method, or process disclosed in this report may not infringe privately-owned rights. Inasmuch as this project is experimental in nature, the technical information, results, or conclusions cannot be predicted. Conclusions and analysis of results by GTI represent GTI's opinion based on inferences from measurements and empirical relationships, which inferences and assumptions are not infallible, and with respect to which competent specialists may differ. b. Assumes any liability with respect to the use of, or for any and all damages resulting from the use of, any information, apparatus, method, or process disclosed in this report; any other use of, or reliance on, this report by any third party is at the third party's sole risk.
c. The results within this report relate only to the items tested."
Copyright © 2009 by Water Research Foundation and Gas Technology Institute
ALL RIGHTS RESERVED.
No part of this publication may be copied, reproduced or otherwise utilized without permission.
©2009 Water Research Foundation and Gas Technology Institute. ALL RIGHTS RESERVED

Page iii
FOREWORD
The Water Research Foundation (formerly AwwaRF) is a nonprofit corporation that is dedicated to the implementation of a research effort to help utilities respond to regulatory requirements and traditional high-priority concerns of the industry. The research agenda is developed through a process of consultation with subscribers and drinking water professionals. Under the umbrella of a Strategic Research Plan, the Research Advisory Council prioritizes the suggested projects based upon current and future needs, applicability, and past work; the recommendations are forwarded to the Board of Trustees for final selection. The foundation also sponsors research projects through the unsolicited proposal process; the Collaborative Research, Research Applications, and Tailored Collaboration programs; and various joint research efforts with organizations such as the U.S. Environmental Protection Agency, the U.S. Bureau of Reclamation, and the Association of California Water Agencies.
This publication is a result of one of these sponsored studies, and it is hoped that its findings will be applied in communities throughout the world. The following report serves not only as a means of communicating the results of the water industry’s centralized research program but also as a tool to enlist the further support of the nonmember utilities and individuals.
Projects are managed closely from their inception to the final report by the foundation’s staff and large cadre of volunteers who willingly contribute their time and expertise. The foundation serves a planning and management function and awards contracts to other institutions such as water utilities, universities, and engineering firms. The funding for this research effort comes primarily from the Subscription Program, through which water utilities subscribe to the research program and make an annual payment proportionate to the volume of water they deliver and consultants and manufacturers subscribe based on their annual billings. The program offers a cost-effective and fair method for funding research in the public interest.
A broad spectrum of water supply issues is addressed by the foundation’s research agenda: resources, treatment and operations, distribution and storage, water quality and analysis, toxicology, economics, and management. The ultimate purpose of the coordinated effort is to assist water suppliers to provide the highest possible quality of water economically and reliably. The true benefits are realized when the results are implemented at the utility level. The foundation’s trustees are pleased to offer this publication as a contribution toward that end.
David E. Rager Robert C. Renner, P.E. Chair, Board of Trustees Executive Director Water Research Foundation Water Research Foundation
©2009 Water Research Foundation and Gas Technology Institute. ALL RIGHTS RESERVED
Page iv
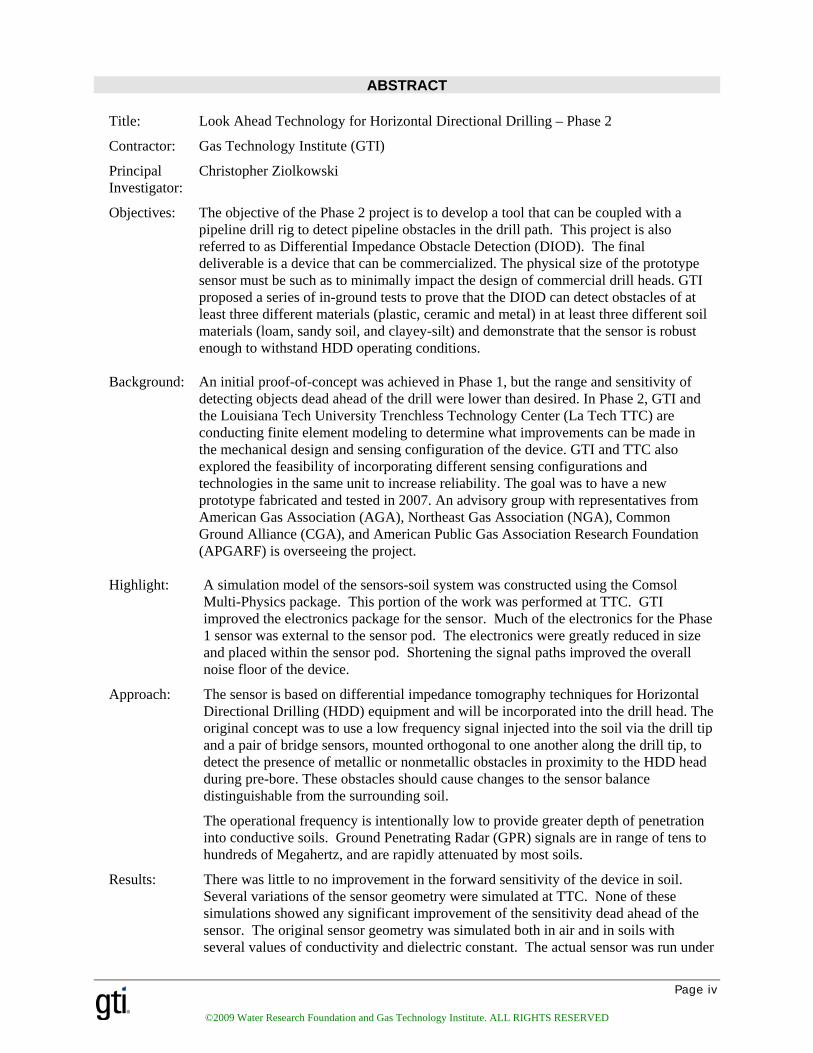
ABSTRACT
Title: Look Ahead Technology for Horizontal Directional Drilling – Phase 2
Contractor:
Principal Investigator:
Gas Technology Institute (GTI)
Christopher Ziolkowski
Objectives: The objective of the Phase 2 project is to develop a tool that can be coupled with a pipeline drill rig to detect pipeline obstacles in the drill path. This project is also referred to as Differential Impedance Obstacle Detection (DIOD). The final deliverable is a device that can be commercialized. The physical size of the prototype sensor must be such as to minimally impact the design of commercial drill heads. GTI proposed a series of in-ground tests to prove that the DIOD can detect obstacles of at least three different materials (plastic, ceramic and metal) in at least three different soil materials (loam, sandy soil, and clayey-silt) and demonstrate that the sensor is robust enough to withstand HDD operating conditions.
Background: An initial proof-of-concept was achieved in Phase 1, but the range and sensitivity of detecting objects dead ahead of the drill were lower than desired. In Phase 2, GTI and the Louisiana Tech University Trenchless Technology Center (La Tech TTC) are conducting finite element modeling to determine what improvements can be made in the mechanical design and sensing configuration of the device. GTI and TTC also explored the feasibility of incorporating different sensing configurations and technologies in the same unit to increase reliability. The goal was to have a new prototype fabricated and tested in 2007. An advisory group with representatives from American Gas Association (AGA), Northeast Gas Association (NGA), Common Ground Alliance (CGA), and American Public Gas Association Research Foundation (APGARF) is overseeing the project.
Highlight: A simulation model of the sensors-soil system was constructed using the Comsol Multi-Physics package. This portion of the work was performed at TTC. GTI improved the electronics package for the sensor. Much of the electronics for the Phase 1 sensor was external to the sensor pod. The electronics were greatly reduced in size and placed within the sensor pod. Shortening the signal paths improved the overall noise floor of the device.
Approach: The sensor is based on differential impedance tomography techniques for Horizontal Directional Drilling (HDD) equipment and will be incorporated into the drill head. The original concept was to use a low frequency signal injected into the soil via the drill tip and a pair of bridge sensors, mounted orthogonal to one another along the drill tip, to detect the presence of metallic or nonmetallic obstacles in proximity to the HDD head during pre-bore. These obstacles should cause changes to the sensor balance distinguishable from the surrounding soil.
The operational frequency is intentionally low to provide greater depth of penetration into conductive soils. Ground Penetrating Radar (GPR) signals are in range of tens to hundreds of Megahertz, and are rapidly attenuated by most soils.
Results: There was little to no improvement in the forward sensitivity of the device in soil. Several variations of the sensor geometry were simulated at TTC. None of these simulations showed any significant improvement of the sensitivity dead ahead of the sensor. The original sensor geometry was simulated both in air and in soils with several values of conductivity and dielectric constant. The actual sensor was run under
©2009 Water Research Foundation and Gas Technology Institute. ALL RIGHTS RESERVED

Page v
analogous conditions to verify the model. There was reasonable agreement between the simulations and experimental results for most cases. The exceptions are discussed in the body of the final report. Given that no configuration was found that improved the forward sensitivity, no full-scale prototype was constructed. All the experiments were performed with the breadboard sensor in an indoor soils lab at GTI.
Impact: The DIOD technology will not move forward to commercialization. It is not expected to have great impact in the immediate future.
©2009 Water Research Foundation and Gas Technology Institute. ALL RIGHTS RESERVED

Page vi
TABLE OF CONTENTS PAGE
DISCLAIMER .............................................................................................................................................. ii
FOREWORD ............................................................................................................................................... iii
ABSTRACT ................................................................................................................................................. iv
TABLE OF CONTENTS ............................................................................................................................. vi
TABLE OF FIGURES ................................................................................................................................ vii
INTRODUCTION ........................................................................................................................................ 1
EXECUTIVE SUMMARY ........................................................................................................................... 4
EXPERIMENTAL ........................................................................................................................................ 5
Previous Work ...................................................................................................................................... 5
Simulations of the DIOD Sensor .......................................................................................................... 6
Testing the DIOD Sensor Hardware ..................................................................................................... 9
RESULTS AND DISCUSSION ................................................................................................................. 11
General Results................................................................................................................................... 11
Comparing Simulation and Experimental Results.............................................................................. 11
Environmental Effects on the Sensor ................................................................................................. 12
CONCLUSIONS ......................................................................................................................................... 15
LIST OF ACRONYMS .............................................................................................................................. 16
BIBLIOGRAPHY ....................................................................................................................................... 17
©2009 Water Research Foundation and Gas Technology Institute. ALL RIGHTS RESERVED
Page vii
TABLE OF FIGURES PAGE
Figure 1 - DIOD Concept Drawing ............................................................................................................... 2 Figure 2 - Prototype from Phase 1 on Bench ................................................................................................ 5 Figure 3 - Simulated Field Lines around Sensor ........................................................................................... 6 Figure 4 – Proposed DIOD Modifications .................................................................................................... 7 Figure 5 – Field Lines for Water (L) and Gas (R) Filled PE Pipe ................................................................ 7 Figure 6 – Simulated Null Target Conditions for the Symmetric Axis ........................................................ 9 Figure 7 –Testing the DIOD Sensor in Air ................................................................................................. 10 Figure 8 – Testing the DIOD Sensor in Soil ............................................................................................... 10 Figure 9 – Experimental Data Taken in Air ................................................................................................ 11 Figure 10 – PE Target Pipe in Soil with Ambient Moisture ....................................................................... 12 Figure 11 – PE Target Pipe in Soil with Added Water ............................................................................... 13 Figure 12 – Sensor Data for Damp Soil with No Target Present ................................................................ 14
©2009 Water Research Foundation and Gas Technology Institute. ALL RIGHTS RESERVED
Page 1
INTRODUCTION The objective of the GTI Differential Impedance Obstacle Detection (DIOD) project was to
develop a sensor that can be integrated into the head of a horizontal directional drill (HDD) to detect obstacles in the drill path. The physical size of the prototype sensor must be such as to minimally impact the design of commercial drill heads. GTI proposed a series of in-ground tests to prove that the DIOD can detect obstacles of at least three different materials (plastic, ceramic and metal) in at least three different soil materials (loam, sandy soil, and clayey-silt). It was also proposed to demonstrate the sensor is robust enough to withstand HDD operating conditions.
The proposed objectives were to develop and commercialize a sensor that:
1) Has the ability to detect both metallic and non-metallic obstacles at a larger range and in a greater variety of soil mediums and moisture contents than ground penetrating radar (GPR) and other systems
2) Is more cost-effective than other systems
3) Has dimensions that match those of standard drill heads so it causes little change to standard installation practices.
4) Has been field-tested under HDD operating conditions
The proposed sensor uses Differential Impedance Tomography at frequencies of 25kHz to 200 kHz to detect disturbances in the surrounding medium. It has been demonstrated that inclusions in the soil cause detectable impedance changes compared with plain soil.
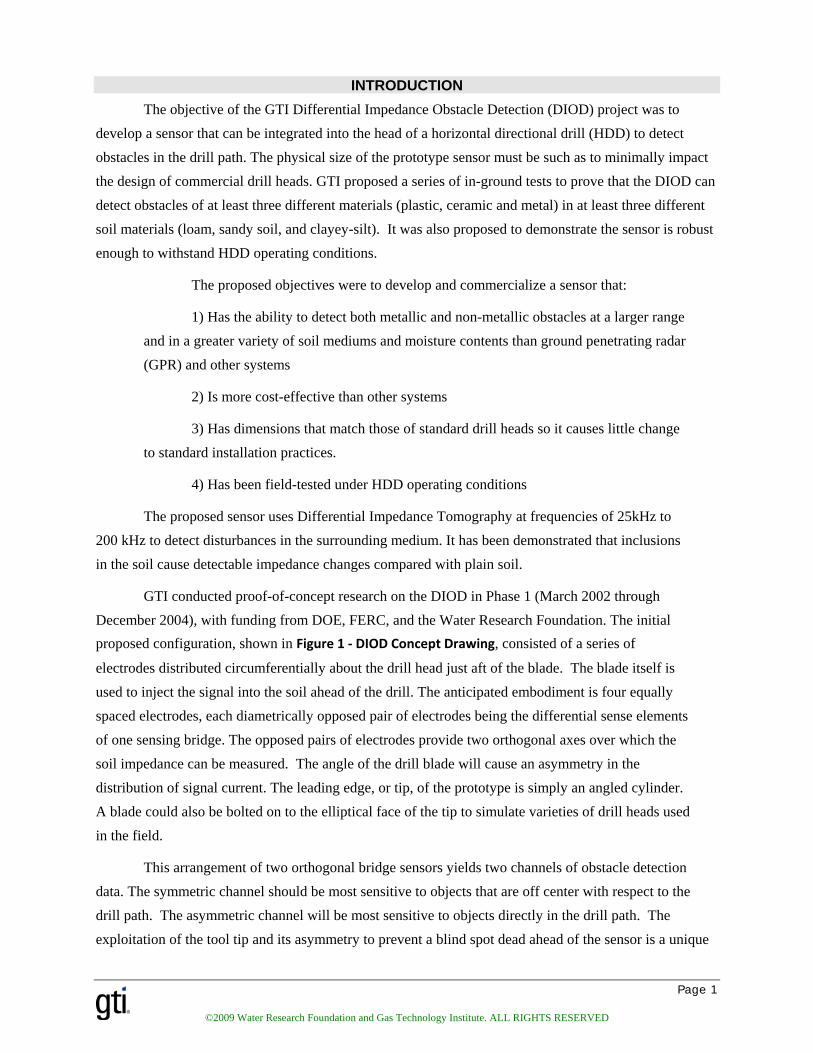
GTI conducted proof-of-concept research on the DIOD in Phase 1 (March 2002 through December 2004), with funding from DOE, FERC, and the Water Research Foundation. The initial proposed configuration, shown in Figure 1 ‐ DIOD Concept Drawing, consisted of a series of
electrodes distributed circumferentially about the drill head just aft of the blade. The blade itself is used to inject the signal into the soil ahead of the drill. The anticipated embodiment is four equally spaced electrodes, each diametrically opposed pair of electrodes being the differential sense elements of one sensing bridge. The opposed pairs of electrodes provide two orthogonal axes over which the soil impedance can be measured. The angle of the drill blade will cause an asymmetry in the distribution of signal current. The leading edge, or tip, of the prototype is simply an angled cylinder. A blade could also be bolted on to the elliptical face of the tip to simulate varieties of drill heads used in the field.
This arrangement of two orthogonal bridge sensors yields two channels of obstacle detection data. The symmetric channel should be most sensitive to objects that are off center with respect to the drill path. The asymmetric channel will be most sensitive to objects directly in the drill path. The exploitation of the tool tip and its asymmetry to prevent a blind spot dead ahead of the sensor is a unique
©2009 Water Research Foundation and Gas Technology Institute. ALL RIGHTS RESERVED

Page 2
feature of this technology. With other sensor technologies, such as GPR, the metallic mass of the tool tip is a substantial obstacle to forward sensing.
The data fusion of these two channels can be used to sense extended objects such as pipes in the drill path. In order to use the normal drill rotation to scan the vicinity of the drill head a third channel of orientation data is necessary. A tilt sensor will be required on the drill head to provide the instantaneous angle between sensing electrodes and the “down” direction.
Figure 1 - DIOD Concept Drawing
Very early in the execution of the Phase 2 project, an advisory group was formed to provide feedback on the goals and direction of the project. The members of this committee were drawn from the American Gas Association, gas distribution companies, and municipal utility companies. A meeting of the sponsors, advisors, and the research team was held to gather consensus on the project activities. A number of important attributes were identified and at least partially quantified as a result of this meeting.
©2009 Water Research Foundation and Gas Technology Institute. ALL RIGHTS RESERVED
Page 3
The range and resolution of the sensor are obviously important. These parameters need to be sufficient to allow the operator to have time to react, either stopping the HDD or steering around the obstacle. The rate at which the HDD advances is dependant on the soil type but averages to about 1 inch per second. It was agreed by the group that a range of 3 feet would be adequate. It was also agreed that the sensor would need adequate resolution to distinguish a distributed target, like a pipe, from a discrete target, like a rock. This resolution was deemed adequate by the advisors.
The robustness and reliability of the device are also important to the stakeholders. The HDD environment is harsh. Modifications to the drill to accommodate the sensors must not impair its mechanical strength. The design of the DIOD sensor leaves the basic design of the drill tip untouched, unlike some other systems that placed most of the electronics at the tip.
Cost for the obstacle detection system must be on the order of 10% of the cost of the entire Horizontal Directional Drill. Consumables must be carefully considered. A drill tip now costs roughly $200 and lasts for 4000 to 5000 feet for drilling. Modifications that make this component more expensive to accommodate sensors may not be acceptable. Standard drill pipe is inexpensive but has no provision for running data cables. A wireless means of data transfer would add to the cost effectiveness of an obstacle detection system.
Other aspects of what constitutes an acceptable obstacle detection system for HDD were also discussed. The obstacle detection system should be self-contained within the drill head if at all possible. A “walker”, or hand-held device that is carried along the drill path as the HDD advances is not desirable. The walker is tolerable if there is positive benefit in terms of the value of the information. The same is true of surface sensors: they are difficult to use in traffic or river crossing situations. The extent to which surface sensors improve the data needs to balance the difficulty. Finally, all the advisors agreed that the user interface is critical to the acceptance of any device. The user interface must be clear and straightforward to use.
©2009 Water Research Foundation and Gas Technology Institute. ALL RIGHTS RESERVED

Page 4
EXECUTIVE SUMMARY Horizontal Directional Drilling (HDD) is the fastest growing segment in the underground utility
industry. In 1997, 6,000 HDD rigs installed 60 million linear feet of pipe. Since HDD requires no excavation, damage to other lines during installation can go unnoticed. Utility maps are frequently inaccurate. Also, current surface-based sensors are not sensitive to plastic pipe, especially those used for gas. As a result, a horizontal drill is effectively “blind” to many types of obstacles, especially when drilling under a road, railroad, or a river where surface-based sensing tools cannot be used. The challenge is to develop a sensor that can be easily integrated into a drill string to reliably alert the operator to obstacles (either metallic or non-metallic) ahead of a drill.
Potential consequences of a drill-through event include damage to the utility, injury or death, financial loss, damage to roadways and structures, and environmental damage. The Underground Focus website revealed 34 incidents between 2000 and 2003, involving natural gas, power lines, water mains, and fiber optic lines. For example, in March 2000, an HDD crew installing a fiber optic cable in Old Metairie, LA, struck a 4-inch, high-pressure gas line, forcing evacuation of a nearby school and 50 homes. A technology is needed to sense obstructions and avoid drill-through events.
A Phase 1 project produced a working prototype that demonstrated sensitivity to plastic pipe embedded in soil. The sensor was also directional: objects to the sides of the sensor could be assigned an angle with respect to the sensor axis. The weakness of the prototype sensor was that it had very little sensitivity for objects dead ahead of the sensor. This aspect needed improvement to maximize the usefulness of the sensor in HDD applications.
The Phase 2 effort had two aspects. The interaction between the sensor and the soil was simulated using the Comsol Multiphysics package. The results of these simulations, performed by the Trenchless Technology Center of Louisiana Tech University, were to guide modifications to the sensor geometry. The Gas Technology Insitute performed modifications to the sensor and the circuitry. Initial tests were carried out in air and in a soil pit lab at GTI. Further soil tests were planned for the labs at TTC and under field conditions but did not take place.
Numerous simulations were carried out by TTC, testing modifications of the sensor geometry. None of these simulations indicated any drastic improvement to the forward sensitivity. GTI made improvements to the electronic circuitry supporting the sensor. The size of the sensor electronics was decreased sufficiently to fit within the simulated drill head. Placing the electronics adjacent to the sensor electrodes improved the noise floor by eliminating much external cabling. The upgraded sensor was tested both in air and in soil at GTI. These experiments essentially duplicated the results of Phase 1: the sensitivity is much greater to the sides of the sensor than dead ahead.
©2009 Water Research Foundation and Gas Technology Institute. ALL RIGHTS RESERVED

Page 5
EXPERIMENTAL As stated earlier, the Phase 1 efforts had produced a prototype sensor that could detect inclusions
in the soil to the sides of the sensor. The prototype is shown in Figure 2 - Prototype from Phase 1 on Bench. The following research and experimental activities were carried out in an effort to enhance the forward sensitivity of the prototype.
Previous Work
The first activity of the project was to conduct a thorough literature review to determine what obstacle detection systems existed in the Horizontal Directional Drilling (HDD) market space. These findings also needed to be compared with the requirements set forth by the advisors group. This review was conducted by TTC.
Figure 2 - Prototype from Phase 1 on Bench The literature review identified several competing technologies at various stages of development.
The strengths and limitations of each of these technologies were identified. It was also determined that no “see ahead” technology is currently commercially available in North America. Furthermore, based on the available information, only one technology developed by Osaka Gas in Japan that utilizes a UWB sensor was successfully tested under controlled field tests in a real HDD operating environment. A review of the US patents database revealed six relevant standing patents. A careful review of these patents suggests the DIOD system presents may have novel aspects that are potentially patentable.
©2009 Water Research Foundation and Gas Technology Institute. ALL RIGHTS RESERVED

Page 6
Simulations of the DIOD Sensor
TTC undertook multiple simulations of the DIOD sensor with the goal of determining how to focus the current projected into the soil forward of the drill tip. The assumption was that this would also maximize the sensitivity to forward obstacles. Figure 3 - Simulated Field Lines around Sensor shows the electric field streamlines around the sensor tip. The streamline graphical output gives a qualitative picture of where the current density is greatest. This simulation was produced using the Comsol Multiphysics package. Earlier versions of this software package were known as FEMLAB.
Figure 3 - Simulated Field Lines around Sensor
The physical sensor that is being modeled in Figure 3 - Simulated Field Lines around Sensor is
slightly modified from the one shown in Figure 2 - Prototype from Phase 1 on Bench. More of the surface area is insulated from the soil in the modeled version. An examination of Figure 2 shows the copper sensor elements are located under an insulating sleeve just behind the drill tip. The sensor being modeled has only parts of the metallic blade in contact with the soil. This was done to counter the tendency of the current to return to the exposed drill pipe, aft of the sensor plates.
These proposed modifications to the sensor, shown in Figure 4 – Proposed DIOD Modifications, produced a slight gain to the potentials seen at the sensing plates. The conductive areas that contact the soil are shown in red, the insulated sensing plates in yellow. The drill tip must be substantially modified to accommodate these proposed changes. It was decided that the actual sensitivity gain was too small to warrant the complexity of the modification. This design was not pursued any further.
©2009 Water Research Foundation and Gas Technology Institute. ALL RIGHTS RESERVED

Page 7
Figure 4 – Proposed DIOD Modifications
Numerous additional Multiphysics simulations were performed by TTC based on the sensor prototype that had already been fabricated. The variations in these simulations were in the distance and orientation with respect to the target. Metal and plastic target pipes were simulated. The background media for the simulations was varied over a range of conductivities and dielectric constants. The Fifth and Sixth Quarterly Technical Reports deal with these simulations in detail; only the high points will be covered in this report.
The TTC Fifth Quarterly Report covers simulations of three target types: metal pipe, water-filled plastic pipe, and gas-filled plastic pipe. The simulations confirm what one would expect intuitively: the metallic pipe gives the largest signal. The greater the conductivity, the more easily the target is detected. The water-filled plastic pipe provided a larger signal than the gas-filled. Figure 5 – Field Lines for Water (L) and Gas (R) Filled PE Pipe shows that the greater conductivity of water, on the left, tends to concentrate the field lines more so than gas. In all three cases the sensitivity dead ahead of the simulated sensor was poorer than to the sides.
Figure 5 – Field Lines for Water (L) and Gas (R) Filled PE Pipe
The Fifth Quarterly also simulated some other, predictable, dependencies. The potential at the sensing plates is improved by increasing the drive voltage from the tip to the tail of the drill. Stated another way, the signal to noise ratio (SNR) can be improved by increasing the signal available above a
©2009 Water Research Foundation and Gas Technology Institute. ALL RIGHTS RESERVED

Page 8
constant background noise. Moving the sensing elements as far forward as possible also improved the potential seen by the sensors. The sense elements on the physical prototype in Figure 2 - Prototype from Phase 1 on Bench are the copper colored plates under the clear insulting sleeve just aft of the tip. These have been placed as far forward as possible without massive re-engineering of the tip.
Simulations were performed both in air and soil of modest conductivity. The soil simulations were also carried out with a layer of drilling fluid immediately around the sensor. The drilling fluid was assigned a higher conductivity than the surrounding soil. The fluid did improve the potentials slightly, probably by normalizing the transition between the metal and the surrounding soil. In real world operations, it would be very difficult to obtain a uniform sheath of drilling fluid around the HDD when it is in operation.
The TTC Sixth Quarterly Technical Report covered multiple simulations of the sensor being rotated about its longitudinal axis with respect to a target pipe. The target materials were metal and PE. The distance from the target plane (Z-axis) and the offset (R-axis) from the target centerline were both varied over an extensive range. The null case, no target present, was also simulated. The Sixth Quarterly contains an extensive set of graphs that capture these results; only a few will be reproduced here.
The simulations from the Sixth Quarterly show a number of interesting features. As the sensor is rotate with respect to the target, there is a cyclic variation in the sensor output. The output returns to its starting point after a full revolution as expected. The pattern of the simulations does not follow what has been seen experimentally up to this point. The experimental data generally has one maximum and one minimum per revolution. This is true of some of the simulations but many have two maxima and two minima per revolution. The other problematic issue is the null target simulations; these often show quite large signal variations over the rotation of the sensor. This is shown in Figure 6 – Simulated Null Target Conditions for the Symmetric Axis. Given the variance from the experimental data in hand, TTC was asked to carefully examine the model and its boundary conditions to determine if there were artifacts that could be causing these problems.
©2009 Water Research Foundation and Gas Technology Institute. ALL RIGHTS RESERVED

Page 9
Figure 6 – Simulated Null Target Conditions for the Symmetric Axis
Testing the DIOD Sensor Hardware
The tests in the GTI Pit Lab attempted to reproduce some of the simulations. The extreme cases of distances and of water filled PE pipe were not possible to reproduce at the facility. The Sixth and Seventh PHMSA Quarterly Technical reports go into these experiments in detail. The main results will be reported here.
As stated earlier, much of the electronic hardware had been external to the sensor pod at the end of Phase 1. The exposed cabling connecting the sensors to the signal processing hardware was eliminated. This reduces the chance for noise pick up. The signal source and power amplifier that drive the current into the soil were also moved within the sensor pod. It must be noted that one effect of compacting the hardware was that all subsequent experiments were performed using 50 kHz excitation. The signal source and amp would need to be physically removed to change the signal frequency. The filtering for the preamplifiers was optimized for this frequency also.
The experiments were primarily carried out in the facility shown in Figure 7 –Testing the DIOD Sensor in Air. The area in which the sensor pod can be seen is a soil pit that extends 8 feet below floor level. The soil is a clay-sand mixture of roughly equal proportions and contains several buried plastic pipes. In the figure, the sensor is pointed upward at a plastic target pipe suspended in air. The sensor was tested for various longitudinal distances (Z) and various lateral offset (R) from the target. Raising and lowering the pipe using the ropes could vary the Z value. A metal target was substituted for some of the tests. The sensor was rotated in 45-degree increments for a full 360 degrees. A set of 5 readings was taken at every increment and averaged.
©2009 Water Research Foundation and Gas Technology Institute. ALL RIGHTS RESERVED

Page 10
Figure 7 –Testing the DIOD Sensor in Air
For in soil experiments, postholes were dug in the vicinity of buried targets and the sensor
inserted point down. This is shown in Figure 8 – Testing the DIOD Sensor in Soil. The soil was then backfilled around the probe and compacted by hand. In many of the test runs, water was added to the posthole during backfill. The large wrench in the picture was used to rotate the sensor. The disc attached to the top gives a visual indication of the position of the drill tip with respect to the starting point. In many of the experiments, the soil was compacted again and water added after each 45-degree increment.
Figure 8 – Testing the DIOD Sensor in Soil
©2009 Water Research Foundation and Gas Technology Institute. ALL RIGHTS RESERVED

Page 11
RESULTS AND DISCUSSION General Results
Many of the original project technical objectives were not addressed. The forward sensitivity of the DIOD was not greatly improved either in practice or in simulation. Because of these results, live drill experiments were not attempted, nor were manufacturers contacted.
Comparing Simulation and Experimental Results
The single biggest discrepancy between the simulated and experimental results is that of the null target cases. The simulations show in excess of 8 volts peak to peak variation as the sensor is rotated with no target present. The experimental data taken with no target present shows little change as the sensor is rotated.
Figure 9 – Experimental Data Taken in Air
There are several data presented together in Figure 9 – Experimental Data Taken in Air. Two of the traces are null target cases: one was taken indoors and one out. The “Out” data was taken to see if the room boundaries were affecting the data. This data is at odds with the large swing in the simulated null data of Figure 6 – Simulated Null Target Conditions for the Symmetric Axis. In both null target experiments the variation was smaller than the null target simulations by two orders of magnitude. As stated earlier, TTC carefully examined the model for artifacts or boundary conditions that could be causing the variation but nothing conclusive was found.
©2009 Water Research Foundation and Gas Technology Institute. ALL RIGHTS RESERVED

Page 12
The other two traces in Figure 9 – Experimental Data Taken in Air show data taken on a metallic target pipe dead ahead (R=0) of the sensor at distances 7 and 19 inches above the sensor. First note that the signal variation is on the order of 1 volt peak to peak at best. The other observation is that the signal strength decreases, as the target moves closer. This at first seems counter-intuitive until one considers that this is a metallic target in air. The conductive pipe will “sink” more of the electric field lines as this distance decreases. This in turn leaves less electric field flux available to excite the sensing plates.
The other discrepancy between model and experiment was the general shape of the signal. The majority of experimental data has one maximum and one minimum. Physically these correspond to the points in the rotation at which one of the sensing plates is aligned with the target. The max and min are typically 180-degrees apart as are the physical sense plates on the senor. Many of the simulations show several maxima and minima per revolution. The physical motivation for this is not clear. Environmental Effects on the Sensor
The data gathered with the sensor in soil showed high dependency on the soil contact pressures and soil moisture. The experimental runs were carried out on a 4-inch diameter PE pipe containing air that is buried in the soil pit. The probe was inserted into the soil to a depth of 24 inches, leaving 6 inches of soil intervening. The data is shown in Figure 10 – PE Target Pipe in Soil with Ambient Moisture. The sensor was rotated in 45 degree increments and an average of 5 readings taken at each position. There are large voltage swings but the max-min pattern that indicates direction to target is missing. It was noted in Phase 1 that the sensor could develop air gaps with the soil that caused anomalous readings.
Figure 10 – PE Target Pipe in Soil with Ambient Moisture
©2009 Water Research Foundation and Gas Technology Institute. ALL RIGHTS RESERVED

Page 13
The experimental run was repeated but with added water in the posthole at the time the sensor
was inserted and after rotations. The thinking was to replicate the environment of the HDD where drilling fluid would be present. This did restore the min-max distribution to a more reasonable from. This is shown in Figure 11 – PE Target Pipe in Soil with Added Water. There are still issues with the sensor performance in soil. The data should be cyclic; returning to approximately the same value every 360 degrees. Clearly this is not the case even with the water added to normalize the contact.
Figure 11 – PE Target Pipe in Soil with Added Water
Finally, the null target case was tested in soil. This is shown in Figure 12 – Sensor Data for
Damp Soil with No Target Present. Clearly there is a rotational variation of the data in spite of adding water and applying pressure to the sensor after every increment. This drift is on the order of the variation in the endpoints of target data. Stated another way, the amount by which the sensor does not return to its starting point seems to be roughly the same order of magnitude. The mechanism that causes this would need to be accounted for before we could be confident eliminating false positives in the data.
These figures represent the best data from multiple runs in the soil lab. No additional runs were performed after the end of 2007 due to the end of project funding.
©2009 Water Research Foundation and Gas Technology Institute. ALL RIGHTS RESERVED

Page 14
Figure 12 – Sensor Data for Damp Soil with No Target Present
©2009 Water Research Foundation and Gas Technology Institute. ALL RIGHTS RESERVED

Page 15
CONCLUSIONS
• The forward sensitivity of the DIOD sensor showed only slight improvements.
• Most of this improvement can be attributed to improvements in the noise floor brought about by moving the electronics to the interior of the sensor pod.
• The contact impedance between the sensor and the soil greatly affects the sensitivity.
• Factors such as soil moisture and contact pressure determine the contact impedance.
• Simulations indicate that extensive modifications of the drill head could bring about a slight increase in the sensitivity dead ahead.
©2009 Water Research Foundation and Gas Technology Institute. ALL RIGHTS RESERVED

Page 16
LIST OF ACRONYMS AC Alternating Current AGA American Gas Association APGARF American Public Gas Association Research Foundation CGA Common Ground Alliance CP Cathodic Protection DC Direct Current DIOD Differential Impedance Obstacle Detection FEMLAB Finite Element Modeling Laboratory GTI Gas Technology Insitute HDD Horizontal Directional Drilling Hz Hertz – Cycles per Second kHz kilohertz – Thousands of Cycles per Second NGA Northeast Gas Association PE Polyethylene RF Radio Frequency
©2009 Water Research Foundation and Gas Technology Institute. ALL RIGHTS RESERVED

Page 17
BIBLIOGRAPHY
J.N. Shah, BE, 2008 “3-D Modeling of Differential Impedance Obstacle Detection Sensor for Horizontal Direction Drilling” Thesis presented in partial fulfillment of M.S. degree requirement College of Engineering and Science, Louisiana Tech University CEC, 1999. Trenchless Burial Equipment, Public Interest Energy Research (PIER) Program Final Report, P600-00-032, 50p, California Energy Commission (CEC), http://cacx.org//pier/index.html Hirsch, V., 2000. “Drill-Mounted Radar for Horizontal Directional Drilling,” Federal Laboratories Consortium Workshop, Arlington, VA, Dec 7, 2000. PowerPoint presentation, 16 slides. Icerman, L., 2005. “Development of Radar Navigation and Radio Data Transmission for Microhole Coiled Tubing Bottom Hole Assemblies,” Microhole Integration Meeting, Houston, TX, Nov 16, 2005, PowerPoint presentation, 25 slides. Kothari, K.M., G.T. Pittard, and R. Cribbs, 2003. “Obstacle Detection Systems for Utility Construction Operations,” 22nd World Gas Conference, Tokyo, Japan, June 1-5, 2003, 8p. Nakauchi, T., I. Arai, and H. Hayakawa, 2000. “Small Prospecting Radar System,” Eight International Conference on Ground Penetrating Radar (GPR 2000), Gold Coast, Queensland, Australia, May 23-26, 2000, pp.548-551 Nakauchi, T., H. Hayakawa, and I. Arai, 2006. “A Small GPR for Horizontal Directional Drilling System,” The 10th International Symposium on Recent Advances in Exploration Geophysics (RAEG 2006), Kigam, Korea, March 30-31, 4p. Romero, C., 2002. “Micro-Power Impulse Radar (MIR) Demonstration for Pipe/Facilities Locator,” Natural Gas Infrastructure Reliability Industry Forums, West Virginia University, Morgantown, WV, Sept 16-17, 2002, PowerPoint presentation, 24 slides. Internet Sites SafeNav™ Obstacle-Detection System: www.maurertechnology.com SoniPulse: http://www.sonipulse.com/td.htm Micropower Impulse Radar (MIR): http://www.netl.doe.gov/publications/proceedings/02/naturalgas/romero NETL.pdf Drill-String Radar: http://www.ece.nmsu.edu/ecea/stolarcz.htmlhttp://www.microtech.thepttc.org/ - DOE Microhole Program / Round 1 Projects / Stolar Research
©2009 Water Research Foundation and Gas Technology Institute. ALL RIGHTS RESERVED