Identification and ranking risks of horizontal directional drilling … · 2020-03-04 ·...
15
46 Identification and ranking risks of horizontal directional drilling for oil & gas wells by using fuzzy analytic network process: A case study for Gachsaran oil field wells Abbas Sheikh Aboumasoudi 1* , Omid Behvandi 1 1 Department of Industrial Engineering, Najafabad Branch, Islamic Azad University, Najafabad, Iran [email protected], [email protected] Abstract Risk ranking of Horizontal Directional Drilling (HDD) for gas and oil wells is a key criterion in the project feasibility, pricing and for introducing a risk management strategy that aims to reduce the number of failures in the installation phase and its negative consequences. HDD is currently widely used in drilling wells in Iran, but research in the area of identification and risks ranking of these projects have not been done so far. Therefore, this research will identify and ranks the HDD risks in the field of Gachsaran as the case study, by helping literature review and drilling experts and using statistical techniques and Multi-Criteria Decision Making (MCDM) methods. The method of the network analysis process is a powerful tool in deciding uncertain topics for ranking the risks. The offered approach allows decision-makers to involve in the ranking process and use linguistic assessment in the ranking of HDD risks. Keywords: Horizontal Directional Drilling (HDD), Analytic Network Process (ANP), fuzzy set theory. 1- Introduction Horizontal Directional Drilling (HDD) technology is used to install water, gas, heating, drain, sewers pipes and cables under obstacles such as rivers, busy streets, highways, airport runways, areas congested with buildings or underground utilities, and environmentally sensitive areas (Gierczak, 2014 (1)). It is an ideal technology because it does not require large excavation pits nor does it greatly interfere with traffic. When drilling the initial borehole, the drill can be easily tracked and its path altered unlike other trenchless technologies such as jack and bore. HDD is also versatile as it can be used for large diameter pipelines and pipelines spanning a large distance (Hashash and Javier, 2011). Many contractors who install underground utilities applying HDD technology are not able to carry out risk assessment in the project planning phase, as they do not have any mathematical model which allows doing it for various sizes of HDD installations (Gierczak, 2014 (2)). Risk dimensionality and severity is generally greater in the case of HDD because the equipment, labor and material that is used in the process are all selected to match the predicted soil condition, ground water table, and location of other utilities, which are all determined from limited sampling done during the pre-planning phase of the projects (Skogdalen and Vinnem, 2012). The experts emphasize the necessity of risk assessment before starting the realization of the investment, as the estimation of the risk level is the starting point to analyze the project feasibility and cost estimation. *Corresponding author ISSN: 1735-8272, Copyright c 2019 JISE. All rights reserved Journal of Industrial and Systems Engineering Vol. 12, No. 2, pp. 46-60 Spring (April) 2019
Transcript of Identification and ranking risks of horizontal directional drilling … · 2020-03-04 ·...
46
Identification and ranking risks of horizontal directional drilling for
oil & gas wells by using fuzzy analytic network process: A case
study for Gachsaran oil field wells
Abbas Sheikh Aboumasoudi1*, Omid Behvandi1
1Department of Industrial Engineering, Najafabad Branch, Islamic Azad University, Najafabad, Iran
[email protected], [email protected]
Abstract Risk ranking of Horizontal Directional Drilling (HDD) for gas and oil wells is a key
criterion in the project feasibility, pricing and for introducing a risk management
strategy that aims to reduce the number of failures in the installation phase and its
negative consequences. HDD is currently widely used in drilling wells in Iran, but
research in the area of identification and risks ranking of these projects have not
been done so far. Therefore, this research will identify and ranks the HDD risks in
the field of Gachsaran as the case study, by helping literature review and drilling
experts and using statistical techniques and Multi-Criteria Decision Making
(MCDM) methods. The method of the network analysis process is a powerful tool in
deciding uncertain topics for ranking the risks. The offered approach allows
decision-makers to involve in the ranking process and use linguistic assessment in
the ranking of HDD risks.
Keywords: Horizontal Directional Drilling (HDD), Analytic Network Process
(ANP), fuzzy set theory.
1- Introduction Horizontal Directional Drilling (HDD) technology is used to install water, gas, heating, drain, sewers
pipes and cables under obstacles such as rivers, busy streets, highways, airport runways, areas congested
with buildings or underground utilities, and environmentally sensitive areas (Gierczak, 2014 (1)). It is an
ideal technology because it does not require large excavation pits nor does it greatly interfere with traffic.
When drilling the initial borehole, the drill can be easily tracked and its path altered unlike other
trenchless technologies such as jack and bore. HDD is also versatile as it can be used for large diameter
pipelines and pipelines spanning a large distance (Hashash and Javier, 2011). Many contractors who
install underground utilities applying HDD technology are not able to carry out risk assessment in the
project planning phase, as they do not have any mathematical model which allows doing it for various
sizes of HDD installations (Gierczak, 2014 (2)). Risk dimensionality and severity is generally greater in
the case of HDD because the equipment, labor and material that is used in the process are all selected to
match the predicted soil condition, ground water table, and location of other utilities, which are all
determined from limited sampling done during the pre-planning phase of the projects (Skogdalen and
Vinnem, 2012).
The experts emphasize the necessity of risk assessment before starting the realization of the investment,
as the estimation of the risk level is the starting point to analyze the project feasibility and cost estimation.
*Corresponding author
ISSN: 1735-8272, Copyright c 2019 JISE. All rights reserved
Journal of Industrial and Systems Engineering
Vol. 12, No. 2, pp. 46-60
Spring (April) 2019
47
Thanks to carrying out a risk assessment, a lot of serious economic and legal consequences connected
with HDD failure e.g. the damage of other existing underground utilities, the damage of expensive HDD
down-hole equipment, the damage to the installed pipeline, etc. can be avoided.
Currently, there is also no risk management strategy available, which could be an effective tool to
reduce the risk level (Moganti, 2016).
Any deviation from the predicted project parameters will escalate the risk leading to possible accidents.
Many accidents have occurred on HDD projects due to various factors that include but not limited to
uncertain soil conditions, inappropriate drilling practices, inaccurate locating of existing utilities,
inappropriate worker apparel, and lack of effective communication among crew members on the jobsite.
Some of these accidents have resulted in severe injuries and even deaths of workers (Ma et al., 2010).
These consequences present a need for evaluating the safety risk on HDD projects through investigating
the current practices in the industry (KarimiAzari et al., 2011).
This study attempts to identify and rank the Horizontal Directional Drilling (HDD) in the field of
Gachsaran using of the linguistic preferences. The presented approach, inclusive thirteen risk in four
categories of grand, environment, machine and management which are identified by expert opinions and
One-Sample T-Test and their relative ranks are calculated by using Fuzzy Analytical Network Process
(FANP) with considering the interdependency between them. Meanwhile, in order to remove the waste
calculation in FANP method, the relationships of criteria are specified by expert opinions and Pareto
principle. The rest of the paper is organized as follows: in section 2 the literature review would be
presented. The methodology of research would present in sections 3 and a numerical application of the
proposed approach will present in section 4 and finally conclusion and future works would be presented
in section 5.
2- Literature review Digging the ground to reach the desired target is called drilling. Drilling can be done to reach oil, water,
gas, etc. The drilling operations are carried out at a great speed, since using a drill rig for a long time is
very costly. Drilling operations are very dangerous and always used by the most experienced people to do
(Carlin, 2014). The oil well is a cylindrical hole that is created on the ground for exploration, operation,
etc. of oil resources, and may be vertical or oblique. Wang et al. (2012) and Zhang et al. (2011) describe
the methods used for drilling as follows: vertical drilling, horizontal drilling, horizontal directional
drilling, multilateral drilling and under balance drilling.
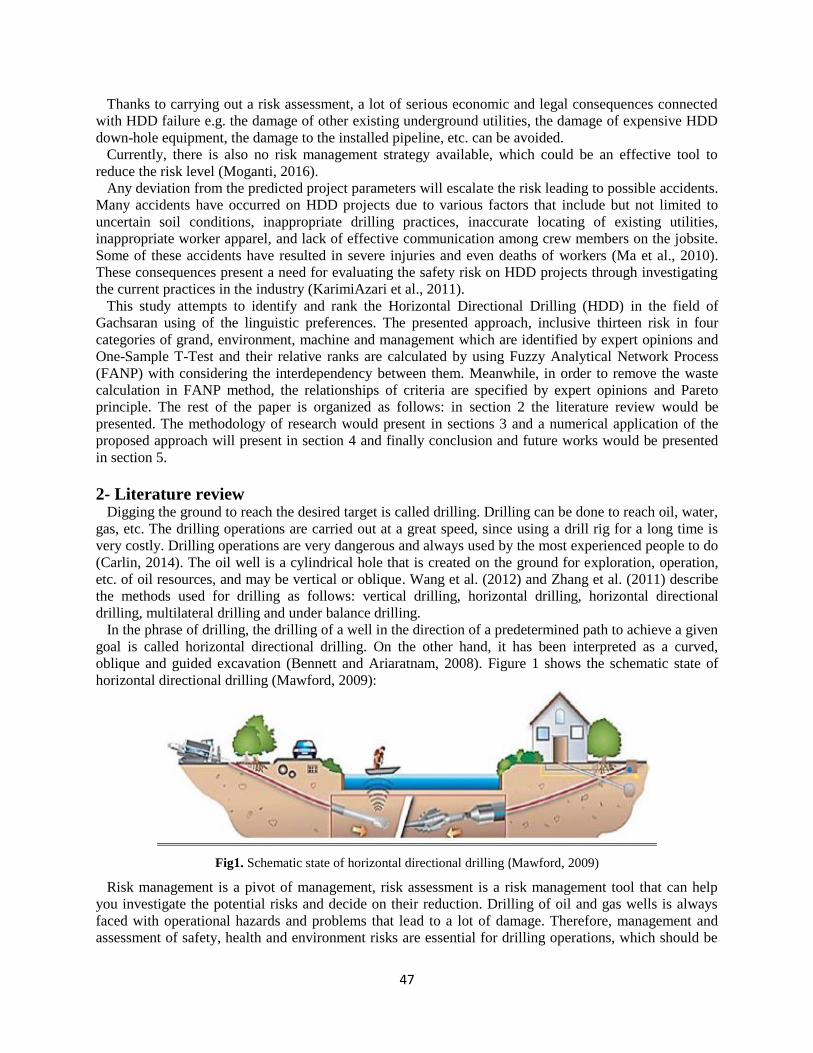
In the phrase of drilling, the drilling of a well in the direction of a predetermined path to achieve a given
goal is called horizontal directional drilling. On the other hand, it has been interpreted as a curved,
oblique and guided excavation (Bennett and Ariaratnam, 2008). Figure 1 shows the schematic state of
horizontal directional drilling (Mawford, 2009):
Fig1. Schematic state of horizontal directional drilling (Mawford, 2009)
Risk management is a pivot of management, risk assessment is a risk management tool that can help
you investigate the potential risks and decide on their reduction. Drilling of oil and gas wells is always
faced with operational hazards and problems that lead to a lot of damage. Therefore, management and
assessment of safety, health and environment risks are essential for drilling operations, which should be
48
considered more in the drilling industry (must be selected). In the literature no risk assessment model for
HDD technology was found, which takes into account the risk management strategy. It indicates the need
to develop a new mathematical model for the risk assessment in HDD technology, taking into
consideration the important risk factors (Abdelgawad et al., 2010).
Van Staveren (2007) states that there are four main types of risk that they should be recognized: pure
and potential risk, predicted and unpredicted risk, information and interpretation risk, direct and indirect
risk. Pure risk relates to unwanted hazards or events that always lead to unwanted occurrences. It is
advisable to eliminate this type of risk as quickly as possible. Risk is defined as the possibility of loss.
Risk cannot be eliminated on an HDD installation. It must be managed. To be managed, HDD risk must
be understood. Categorizing risk aids in understanding risk.
Several decision-making approaches to rank have been introduced in the past three to four decades,
including the matrix method, Analytical Hierarchical Process (AHP), Artificial Neural Networks (ANN),
TOPSIS, Case Based Reasoning (CBR), fuzzy set theory, data envelopment analysis (DEA), the Genetic
Algorithm (GA), Mathematical Programming (MP), Simple Multi-Attribute Rating Technique (SMART),
GRA, and their hybrids (Hashemi et al., 2015). Nieto-Morote et al. (2010) presented a new method for
risk analysis for a construction project that addresses the complexity of dealing with risk in which
information is either incomplete or unacceptable for risk assessment. Kang et al. (2005) presented a
model to evaluate by using a multivariate dynamic programming approach. The researchers solved the
proposed model through a duplicate algorithm. Zheng et al. (2007), using the modified hierarchy analysis
process, have presented a structure for the risks of construction projects.
3- Material and methods 3-1- One-Sample T-Test One-Sample T-Test introduced as a statistical tools, which used to examine the mean difference
between the sample (n<30) and the known value of the population mean. In One-Sample t-test, the
population mean was known. A random sample is selected from the population, and then the mean of
sample is compared to the average of the population, and statistical decision is made about whether or not
the sample mean is different with the population mean. [19].
The statistical hypothesis for One-Sample T-Test is: {𝐻∙: 𝜇 = 𝑎𝐻1: 𝜇 ≠ 𝑎
(1)
Where, “a” is a numerical value. The examination statistic equal to: 𝑡 =�̅�−𝜇
𝑠
√𝑛
(2)
Hypothesis testing: In hypothesis testing, statistical decisions are made to decide whether or not the
population mean and the sample mean are different. Here, the calculated values are compared to the value
of the table. If the calculated value is greater than the table value, then the hypothesis is rejected and the
alternative hypothesis is accepted (Winter, 2013).
3-2- Pareto principle A principle, named after economist Vilfredo Pareto that specifies an unequal relationships between
inputs and outputs. The principle states that, for many phenomena, 20% of invested input is responsible
for 80% of the results obtained. Put another way, 80% of consequences stem from 20% of the causes (Bi
et al., 2012).
3-3- Fuzzy Analytic Network Process (FANP) ANP is a general form of the Analytical Hierarchy Process (AHP) which was proposed by Saaty (1996)
for extending the AHP to address restrictions of the hierarchical structure where criteria are independent
from each other. In FANP, pair-wise comparison matrices are formed between various attributes of each
level with the help of triangular fuzzy numbers. The FANP can easily accommodate the interrelationships
existing among the functional activities (Önüt et al., 2009).
Önüt et al. (2009) proposed the following four main steps of FANP as follows:
49
Step 1: Model problem structuring: The problem should be clearly defined and decomposed into a logical
system like a network.
Step 2: Pair wise comparison matrices and priority vectors: the geometric mean is used to aggregate the
expert opinions and to obtain eigenvectors of each pair wise tables, the logarithmic least squares method
can be used as follows:
�̃�𝑘 = (𝑤𝑘𝑙 , 𝑤𝑘
𝑚, 𝑤𝑘𝑛) 𝑘 = 1,2,3, … , 𝑛 (3)
Where:
𝑤𝑘𝑠=
(∏ 𝑎𝑘𝑗𝑠𝑛
𝑗=1 )1
𝑛⁄
∑ (∏ 𝑎𝑖𝑗𝑚𝑛
𝑗=1 )1
𝑛⁄𝑛𝑗=1
𝑠 ∈ {𝑙, 𝑚, 𝑛} (4)
Step 3: Forming the super-matrix (wij): these matrixes include the eigenvectors which obtained from step
2.
Step 4: calculating final weighs of levels: final weights of elements for each level (𝑤𝑖∗) is calculated using
equation 4:
𝑤𝑖∗ = 𝑤𝑖𝑖 × 𝑤𝑖(𝑖−1) × 𝑤𝑖−1
∗ (5)
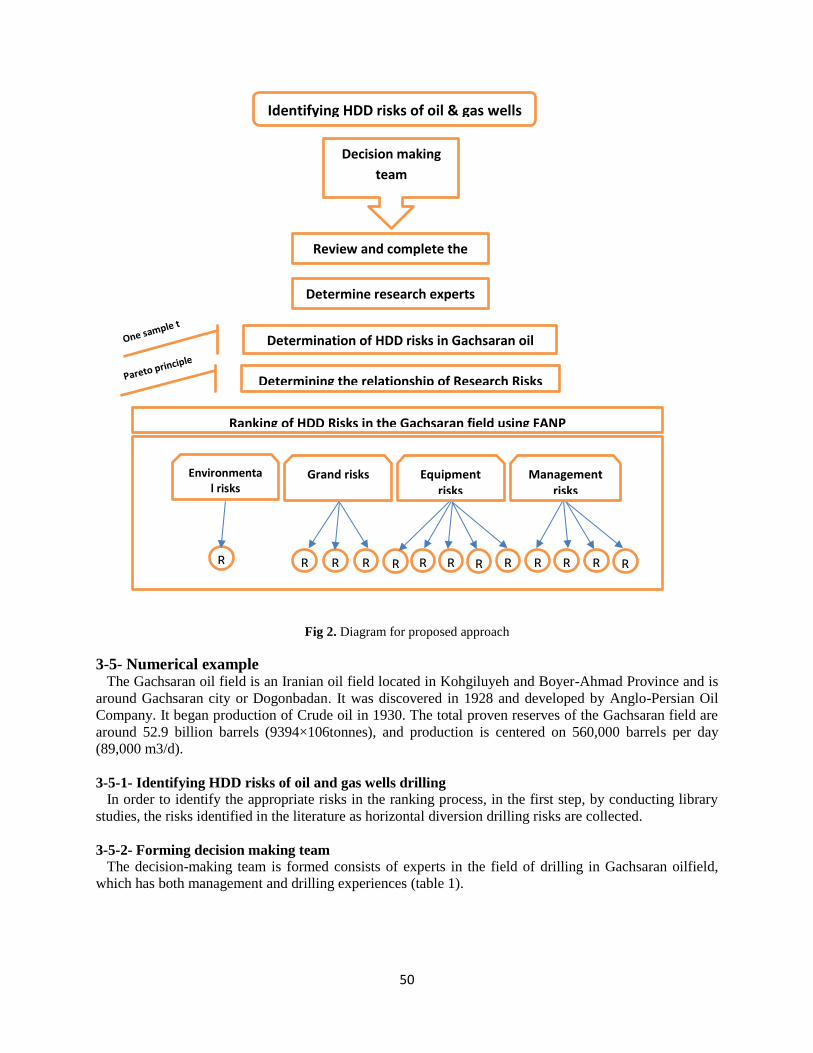
3-4- Methodology The proposed combined approach to identify and rank the Horizontal Directional Drilling (HDD) in the
field of Gachsaran consists of seven steps, as shown in figure 2. In the first step, HDD risks are specified
by reviewing the literature. In the second step, a decision making team (DMT) is organized. In the third
step, the identified risks of first step are investigated in Brainstorming meetings and are finalized. Experts
of study are determined by DMT in the fourth step. In the fifth step, a structured questionnaire which its
validity confirmed by drilling experts and its Reliability is equal to 0.752 according to Cronbach's Alpha
method, is used to select the relevant HDD risks based upon those suggested in third step. In the sixth
step, the experts are asked to provide their opinions in linguistic terms on whether a risk was relevant or
not to rank the Horizontal Directional Drilling (HDD). Next, the relevant risks are selected by one-sample
t-test and using SPSS Software. In the seventh step, the experts are asked in a structured questionnaire
which its validity confirmed by drilling experts and its Reliability is equal to 0.802 according to the
Cronbach's Alpha method, to determine the relationship between the risks. After receipt of the filled out
questionnaire, number 1 will be inserted in case there is a relationship between two selected risks and 0 if
no relationship is assumed, then the related Pareto chart is drawn. Relations between the pair of risks that
are covered by 80 percent of the expert opinions frequency are accepted and elected as the relationships
among the risks. Finally, using pairwise comparisons in order to determine the relative importance of the
risks, ranks of the HDD risks using a super-matrix which is part of the FANP are calculated.
50
Fig 2. Diagram for proposed approach
3-5- Numerical example The Gachsaran oil field is an Iranian oil field located in Kohgiluyeh and Boyer-Ahmad Province and is
around Gachsaran city or Dogonbadan. It was discovered in 1928 and developed by Anglo-Persian Oil
Company. It began production of Crude oil in 1930. The total proven reserves of the Gachsaran field are
around 52.9 billion barrels (9394×106tonnes), and production is centered on 560,000 barrels per day
(89,000 m3/d).
3-5-1- Identifying HDD risks of oil and gas wells drilling
In order to identify the appropriate risks in the ranking process, in the first step, by conducting library
studies, the risks identified in the literature as horizontal diversion drilling risks are collected.
3-5-2- Forming decision making team
The decision-making team is formed consists of experts in the field of drilling in Gachsaran oilfield,
which has both management and drilling experiences (table 1).
R R R R R R R R R R R R R
Management risks
Equipment risks
Grand risks Environmental risks
Determination of HDD risks in Gachsaran oil
field
Identifying HDD risks of oil & gas wells
Decision making
team
Determining the relationship of Research Risks
Ranking of HDD Risks in the Gachsaran field using FANP
Review and complete the
risk
Determine research experts
51
Table 1. Decision making team
Item Position Experience
(year)
1 Area Chief 30
2 Head of drilling operations 27
3 Owner representative and Supervisor of drilling operations 27
4 Senior expert of drilling directional 20
5 Senior expert of operations and researcher drilling 20
3-5-3- Review and complete the identified risks
The decision-making team, through the formation of brain storm meetings, takes action on examining
the risks identified in the literature review and eventually finalizing the research risks list (table 2). Bent
Ariatanam (2008) and Gierezacca (2014), have used management, ground, equipment and environmental
risk grouping to categorize drilling risks, the same are also used in current research.
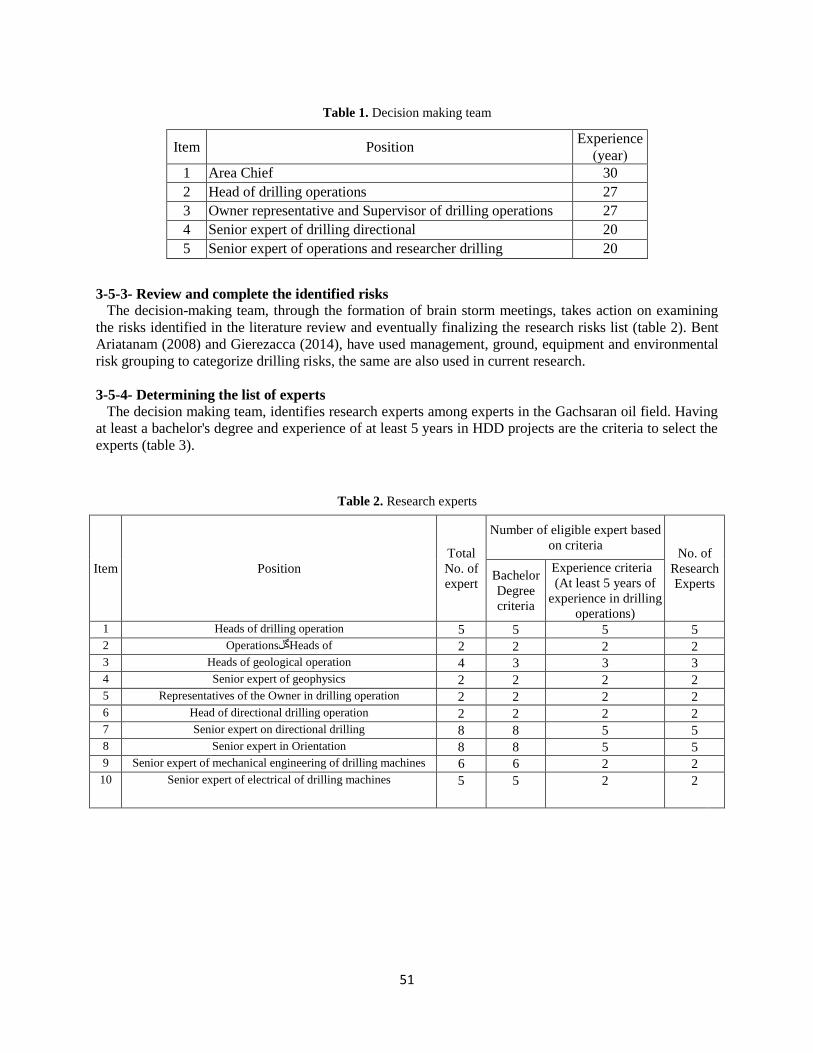
3-5-4- Determining the list of experts
The decision making team, identifies research experts among experts in the Gachsaran oil field. Having
at least a bachelor's degree and experience of at least 5 years in HDD projects are the criteria to select the
experts (table 3).
Table 2. Research experts
Item Position
Total
No. of
expert
Number of eligible expert based
on criteria No. of
Research
Experts Bachelor
Degree
criteria
Experience criteria
(At least 5 years of
experience in drilling
operations) 1 Heads of drilling operation 5 5 5 5
2 Heads of گل Operations 2 2 2 2
3 Heads of geological operation 4 3 3 3
4 Senior expert of geophysics 2 2 2 2
5 Representatives of the Owner in drilling operation 2 2 2 2
6 Head of directional drilling operation 2 2 2 2
7 Senior expert on directional drilling 8 8 5 5
8 Senior expert in Orientation 8 8 5 5
9 Senior expert of mechanical engineering of drilling machines 6 6 2 2
10 Senior expert of electrical of drilling machines 5 5 2 2
52
item
risk
Cod
e
item
risk
Cod
e
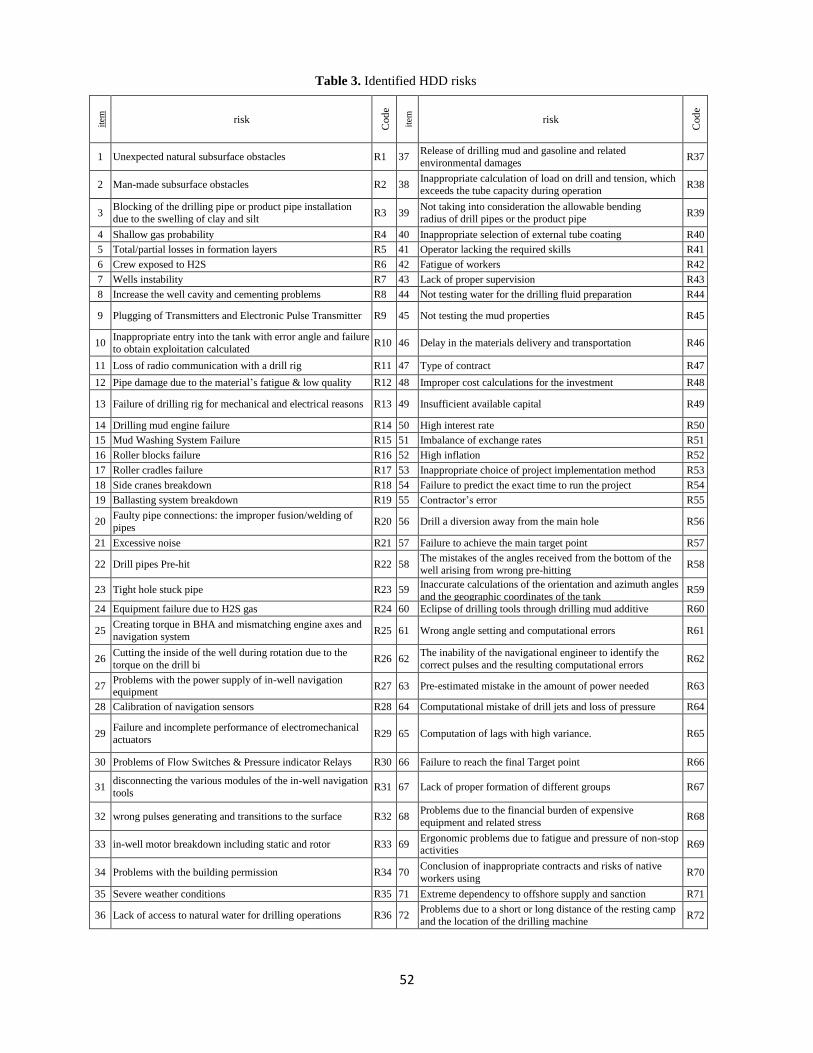
1 Unexpected natural subsurface obstacles R1 37 Release of drilling mud and gasoline and related
environmental damages R37
2 Man-made subsurface obstacles R2 38 Inappropriate calculation of load on drill and tension, which
exceeds the tube capacity during operation R38
3 Blocking of the drilling pipe or product pipe installation
due to the swelling of clay and silt R3 39
Not taking into consideration the allowable bending
radius of drill pipes or the product pipe R39
4 Shallow gas probability R4 40 Inappropriate selection of external tube coating R40
5 Total/partial losses in formation layers R5 41 Operator lacking the required skills R41
6 Crew exposed to H2S R6 42 Fatigue of workers R42
7 Wells instability R7 43 Lack of proper supervision R43
8 Increase the well cavity and cementing problems R8 44 Not testing water for the drilling fluid preparation R44
9 Plugging of Transmitters and Electronic Pulse Transmitter R9 45 Not testing the mud properties R45
10 Inappropriate entry into the tank with error angle and failure
to obtain exploitation calculated R10 46 Delay in the materials delivery and transportation R46
11 Loss of radio communication with a drill rig R11 47 Type of contract R47
12 Pipe damage due to the material’s fatigue & low quality R12 48 Improper cost calculations for the investment R48
13 Failure of drilling rig for mechanical and electrical reasons R13 49 Insufficient available capital R49
14 Drilling mud engine failure R14 50 High interest rate R50
15 Mud Washing System Failure R15 51 Imbalance of exchange rates R51
16 Roller blocks failure R16 52 High inflation R52
17 Roller cradles failure R17 53 Inappropriate choice of project implementation method R53
18 Side cranes breakdown R18 54 Failure to predict the exact time to run the project R54
19 Ballasting system breakdown R19 55 Contractor’s error R55
20 Faulty pipe connections: the improper fusion/welding of
pipes R20 56 Drill a diversion away from the main hole R56
21 Excessive noise R21 57 Failure to achieve the main target point R57
22 Drill pipes Pre-hit R22 58 The mistakes of the angles received from the bottom of the
well arising from wrong pre-hitting R58
23 Tight hole stuck pipe R23 59 Inaccurate calculations of the orientation and azimuth angles
and the geographic coordinates of the tank R59
24 Equipment failure due to H2S gas R24 60 Eclipse of drilling tools through drilling mud additive R60
25 Creating torque in BHA and mismatching engine axes and
navigation system R25 61 Wrong angle setting and computational errors R61
26 Cutting the inside of the well during rotation due to the
torque on the drill bi R26 62
The inability of the navigational engineer to identify the
correct pulses and the resulting computational errors R62
27 Problems with the power supply of in-well navigation equipment
R27 63 Pre-estimated mistake in the amount of power needed R63
28 Calibration of navigation sensors R28 64 Computational mistake of drill jets and loss of pressure R64
29 Failure and incomplete performance of electromechanical
actuators R29 65 Computation of lags with high variance. R65
30 Problems of Flow Switches & Pressure indicator Relays R30 66 Failure to reach the final Target point R66
31 disconnecting the various modules of the in-well navigation
tools R31 67 Lack of proper formation of different groups R67
32 wrong pulses generating and transitions to the surface R32 68 Problems due to the financial burden of expensive
equipment and related stress R68
33 in-well motor breakdown including static and rotor R33 69 Ergonomic problems due to fatigue and pressure of non-stop activities
R69
34 Problems with the building permission R34 70 Conclusion of inappropriate contracts and risks of native
workers using R70
35 Severe weather conditions R35 71 Extreme dependency to offshore supply and sanction R71
36 Lack of access to natural water for drilling operations R36 72 Problems due to a short or long distance of the resting camp
and the location of the drilling machine R72
Table 3. Identified HDD risks
53
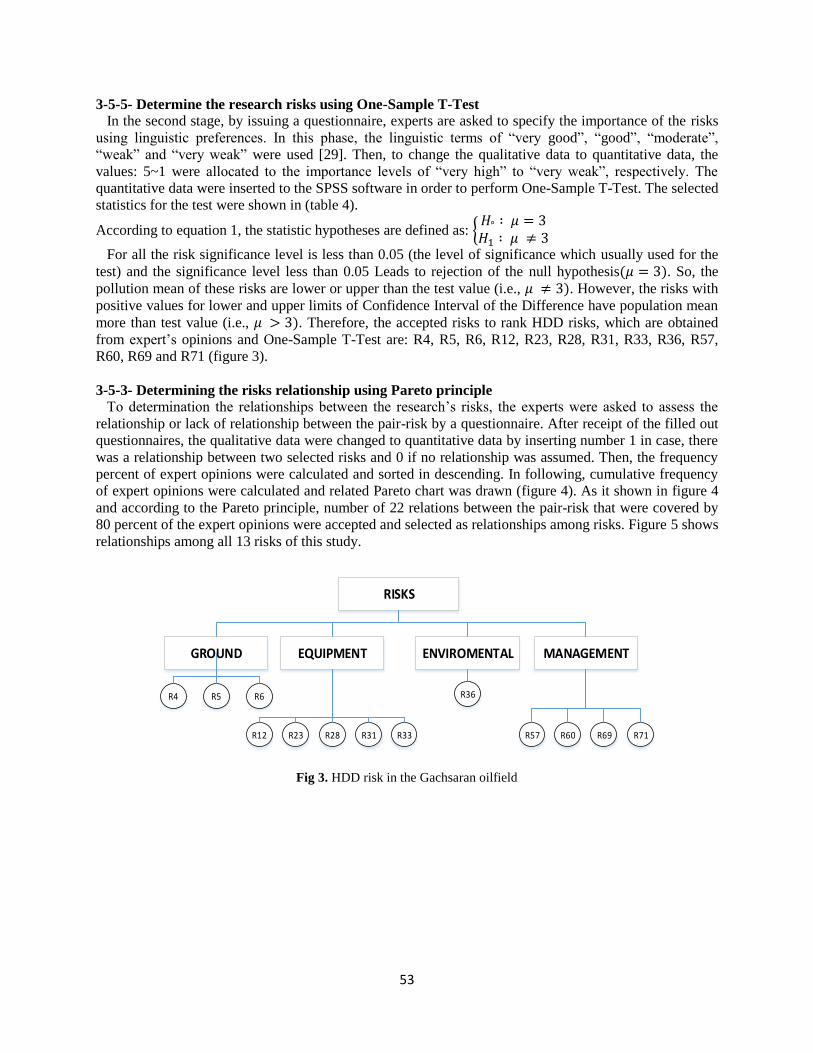
3-5-5- Determine the research risks using One-Sample T-Test
In the second stage, by issuing a questionnaire, experts are asked to specify the importance of the risks
using linguistic preferences. In this phase, the linguistic terms of “very good”, “good”, “moderate”,
“weak” and “very weak” were used [29]. Then, to change the qualitative data to quantitative data, the
values: 5~1 were allocated to the importance levels of “very high” to “very weak”, respectively. The
quantitative data were inserted to the SPSS software in order to perform One-Sample T-Test. The selected
statistics for the test were shown in (table 4).
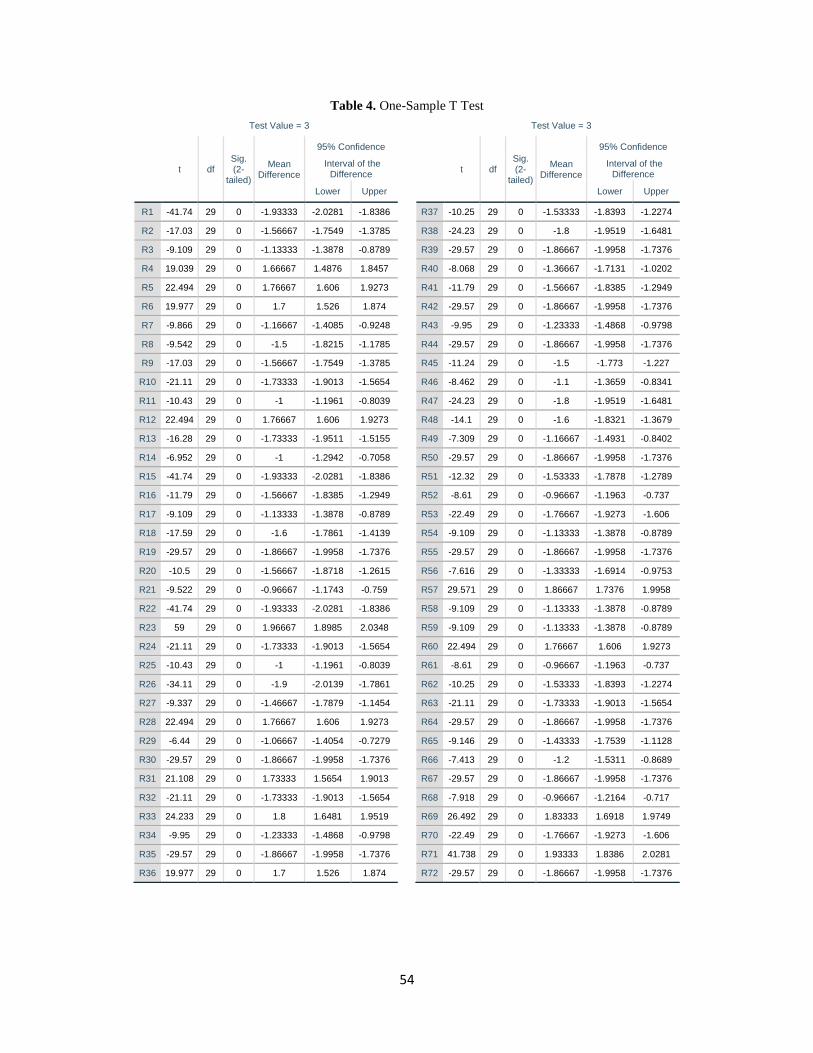
According to equation 1, the statistic hypotheses are defined as: {𝐻° ∶ 𝜇 = 3𝐻1 ∶ 𝜇 ≠ 3
For all the risk significance level is less than 0.05 (the level of significance which usually used for the
test) and the significance level less than 0.05 Leads to rejection of the null hypothesis(𝜇 = 3). So, the
pollution mean of these risks are lower or upper than the test value (i.e., 𝜇 ≠ 3). However, the risks with
positive values for lower and upper limits of Confidence Interval of the Difference have population mean
more than test value (i.e., 𝜇 > 3). Therefore, the accepted risks to rank HDD risks, which are obtained
from expert’s opinions and One-Sample T-Test are: R4, R5, R6, R12, R23, R28, R31, R33, R36, R57,
R60, R69 and R71 (figure 3).
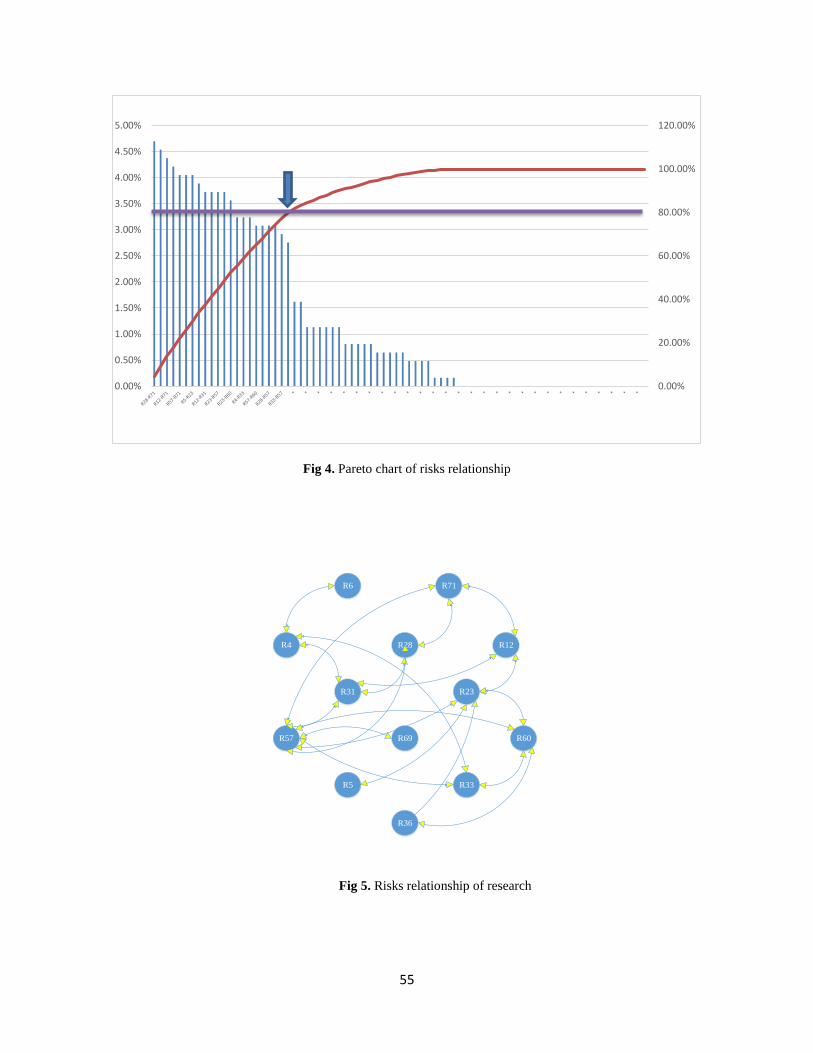
3-5-3- Determining the risks relationship using Pareto principle
To determination the relationships between the research’s risks, the experts were asked to assess the
relationship or lack of relationship between the pair-risk by a questionnaire. After receipt of the filled out
questionnaires, the qualitative data were changed to quantitative data by inserting number 1 in case, there
was a relationship between two selected risks and 0 if no relationship was assumed. Then, the frequency
percent of expert opinions were calculated and sorted in descending. In following, cumulative frequency
of expert opinions were calculated and related Pareto chart was drawn (figure 4). As it shown in figure 4
and according to the Pareto principle, number of 22 relations between the pair-risk that were covered by
80 percent of the expert opinions were accepted and selected as relationships among risks. Figure 5 shows
relationships among all 13 risks of this study.
Fig 3. HDD risk in the Gachsaran oilfield
RISKS
GROUND EQUIPMENT ENVIROMENTAL MANAGEMENT
R4 R5 R6 R36
R12 R23 R28 R31 R33 R57 R60 R69 R71
54
Table 4. One-Sample T Test
Test Value = 3
Test Value = 3
t df Sig. (2-
tailed)
Mean Difference
95% Confidence
t df
Sig. (2-
tailed)
Mean Difference
95% Confidence
Interval of the Difference
Interval of the Difference
Lower Upper
Lower Upper
R1 -41.74 29 0 -1.93333 -2.0281 -1.8386
R37 -10.25 29 0 -1.53333 -1.8393 -1.2274
R2 -17.03 29 0 -1.56667 -1.7549 -1.3785
R38 -24.23 29 0 -1.8 -1.9519 -1.6481
R3 -9.109 29 0 -1.13333 -1.3878 -0.8789
R39 -29.57 29 0 -1.86667 -1.9958 -1.7376
R4 19.039 29 0 1.66667 1.4876 1.8457
R40 -8.068 29 0 -1.36667 -1.7131 -1.0202
R5 22.494 29 0 1.76667 1.606 1.9273
R41 -11.79 29 0 -1.56667 -1.8385 -1.2949
R6 19.977 29 0 1.7 1.526 1.874
R42 -29.57 29 0 -1.86667 -1.9958 -1.7376
R7 -9.866 29 0 -1.16667 -1.4085 -0.9248
R43 -9.95 29 0 -1.23333 -1.4868 -0.9798
R8 -9.542 29 0 -1.5 -1.8215 -1.1785
R44 -29.57 29 0 -1.86667 -1.9958 -1.7376
R9 -17.03 29 0 -1.56667 -1.7549 -1.3785
R45 -11.24 29 0 -1.5 -1.773 -1.227
R10 -21.11 29 0 -1.73333 -1.9013 -1.5654
R46 -8.462 29 0 -1.1 -1.3659 -0.8341
R11 -10.43 29 0 -1 -1.1961 -0.8039
R47 -24.23 29 0 -1.8 -1.9519 -1.6481
R12 22.494 29 0 1.76667 1.606 1.9273
R48 -14.1 29 0 -1.6 -1.8321 -1.3679
R13 -16.28 29 0 -1.73333 -1.9511 -1.5155
R49 -7.309 29 0 -1.16667 -1.4931 -0.8402
R14 -6.952 29 0 -1 -1.2942 -0.7058
R50 -29.57 29 0 -1.86667 -1.9958 -1.7376
R15 -41.74 29 0 -1.93333 -2.0281 -1.8386
R51 -12.32 29 0 -1.53333 -1.7878 -1.2789
R16 -11.79 29 0 -1.56667 -1.8385 -1.2949
R52 -8.61 29 0 -0.96667 -1.1963 -0.737
R17 -9.109 29 0 -1.13333 -1.3878 -0.8789
R53 -22.49 29 0 -1.76667 -1.9273 -1.606
R18 -17.59 29 0 -1.6 -1.7861 -1.4139
R54 -9.109 29 0 -1.13333 -1.3878 -0.8789
R19 -29.57 29 0 -1.86667 -1.9958 -1.7376
R55 -29.57 29 0 -1.86667 -1.9958 -1.7376
R20 -10.5 29 0 -1.56667 -1.8718 -1.2615
R56 -7.616 29 0 -1.33333 -1.6914 -0.9753
R21 -9.522 29 0 -0.96667 -1.1743 -0.759
R57 29.571 29 0 1.86667 1.7376 1.9958
R22 -41.74 29 0 -1.93333 -2.0281 -1.8386
R58 -9.109 29 0 -1.13333 -1.3878 -0.8789
R23 59 29 0 1.96667 1.8985 2.0348
R59 -9.109 29 0 -1.13333 -1.3878 -0.8789
R24 -21.11 29 0 -1.73333 -1.9013 -1.5654
R60 22.494 29 0 1.76667 1.606 1.9273
R25 -10.43 29 0 -1 -1.1961 -0.8039
R61 -8.61 29 0 -0.96667 -1.1963 -0.737
R26 -34.11 29 0 -1.9 -2.0139 -1.7861
R62 -10.25 29 0 -1.53333 -1.8393 -1.2274
R27 -9.337 29 0 -1.46667 -1.7879 -1.1454
R63 -21.11 29 0 -1.73333 -1.9013 -1.5654
R28 22.494 29 0 1.76667 1.606 1.9273
R64 -29.57 29 0 -1.86667 -1.9958 -1.7376
R29 -6.44 29 0 -1.06667 -1.4054 -0.7279
R65 -9.146 29 0 -1.43333 -1.7539 -1.1128
R30 -29.57 29 0 -1.86667 -1.9958 -1.7376
R66 -7.413 29 0 -1.2 -1.5311 -0.8689
R31 21.108 29 0 1.73333 1.5654 1.9013
R67 -29.57 29 0 -1.86667 -1.9958 -1.7376
R32 -21.11 29 0 -1.73333 -1.9013 -1.5654
R68 -7.918 29 0 -0.96667 -1.2164 -0.717
R33 24.233 29 0 1.8 1.6481 1.9519
R69 26.492 29 0 1.83333 1.6918 1.9749
R34 -9.95 29 0 -1.23333 -1.4868 -0.9798
R70 -22.49 29 0 -1.76667 -1.9273 -1.606
R35 -29.57 29 0 -1.86667 -1.9958 -1.7376
R71 41.738 29 0 1.93333 1.8386 2.0281
R36 19.977 29 0 1.7 1.526 1.874
R72 -29.57 29 0 -1.86667 -1.9958 -1.7376
55
Fig 4. Pareto chart of risks relationship
Fig 5. Risks relationship of research
0.00%
20.00%
40.00%
60.00%
80.00%
100.00%
120.00%
0.00%
0.50%
1.00%
1.50%
2.00%
2.50%
3.00%
3.50%
4.00%
4.50%
5.00%
R4
R6
R5
R12
R23
R28
R31
R33
R36
R57 R60R69
R71
56
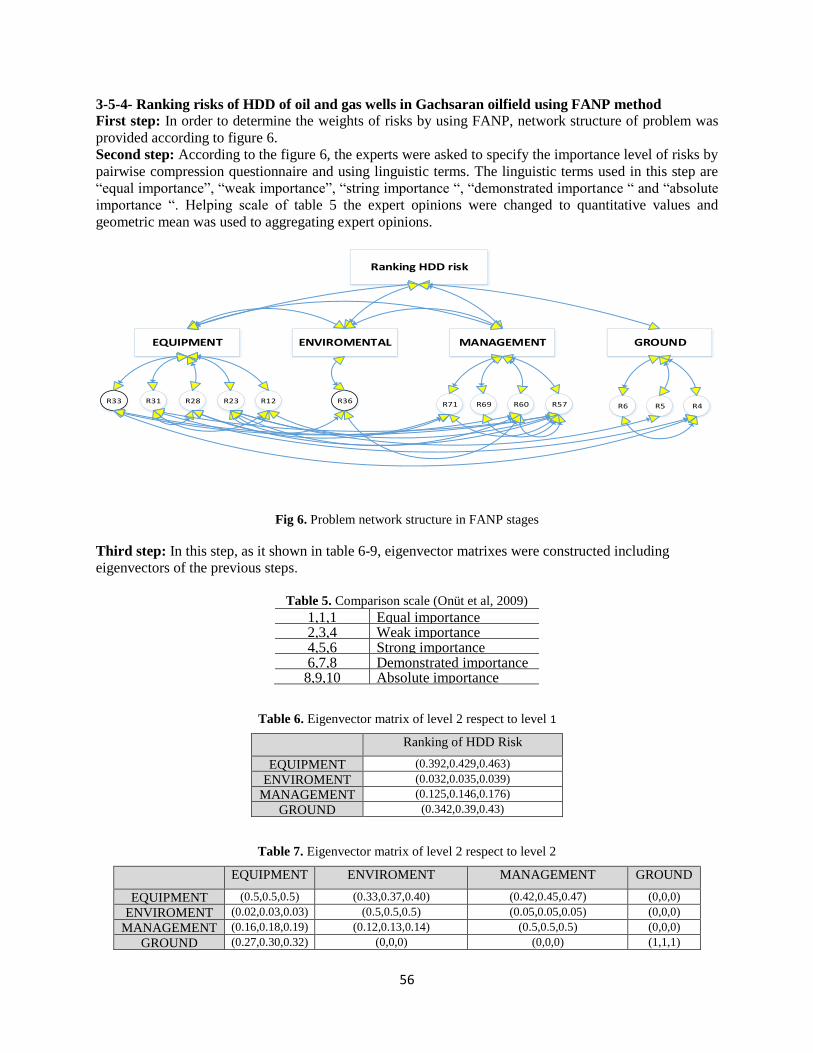
3-5-4- Ranking risks of HDD of oil and gas wells in Gachsaran oilfield using FANP method
First step: In order to determine the weights of risks by using FANP, network structure of problem was
provided according to figure 6.
Second step: According to the figure 6, the experts were asked to specify the importance level of risks by
pairwise compression questionnaire and using linguistic terms. The linguistic terms used in this step are
“equal importance”, “weak importance”, “string importance “, “demonstrated importance “ and “absolute
importance “. Helping scale of table 5 the expert opinions were changed to quantitative values and
geometric mean was used to aggregating expert opinions.
Fig 6. Problem network structure in FANP stages
Third step: In this step, as it shown in table 6-9, eigenvector matrixes were constructed including
eigenvectors of the previous steps.
Table 5. Comparison scale (Onüt et al, 2009)
1,1,1 Equal importance 2,3,4 Weak importance 4,5,6 Strong importance 6,7,8 Demonstrated importance 8,9,10 Absolute importance
Table 6. Eigenvector matrix of level 2 respect to level 1
Ranking of HDD Risk
EQUIPMENT (0.392,0.429,0.463)
ENVIROMENT (0.032,0.035,0.039)
MANAGEMENT (0.125,0.146,0.176)
GROUND (0.342,0.39,0.43)
Table 7. Eigenvector matrix of level 2 respect to level 2
EQUIPMENT ENVIROMENT MANAGEMENT GROUND
EQUIPMENT (0.5,0.5,0.5) (0.33,0.37,0.40) (0.42,0.45,0.47) (0,0,0)
ENVIROMENT (0.02,0.03,0.03) (0.5,0.5,0.5) (0.05,0.05,0.05) (0,0,0)
MANAGEMENT (0.16,0.18,0.19) (0.12,0.13,0.14) (0.5,0.5,0.5) (0,0,0)
GROUND (0.27,0.30,0.32) (0,0,0) (0,0,0) (1,1,1)
Ranking HDD risk
EQUIPMENT ENVIROMENTAL MANAGEMENT GROUND
R31 R28 R23 R12 R69 R60 R57R71 R6 R5 R4R33 R36
57
Table 8. Eigenvector matrix of level 3 respect to level 2
EQUIPMENT ENVIROMENT MANAGEMENT GROUND
R33 (0.05,0.05,0.06) (0,0,0) (0,0,0) (0,0,0)
R31 (0.17,0.21,0.25) (0,0,0) (0,0,0) (0,0,0)
R28 (0.12,0.15,0.18) (0,0,0) (0,0,0) (0,0,0)
R23 (0.06,0.07,0.09) (0,0,0) (0,0,0) (0,0,0)
R12 (0.42,0.51,0.60) (0,0,0) (0,0,0) (0,0,0)
R36 (0,0,0) (1,1,1) (0,0,0) (0,0,0)
R71 (0,0,0) (0,0,0) (0.08,0.09,0.11) (0,0,0)
R69 (0,0,0) (0,0,0) (0.03,0.037,0.04) (0,0,0)
R60 (0,0,0) (0,0,0) (0.27,0.3,0.34) (0,0,0)
R57 (0,0,0) (0,0,0) (0.50,0.57,0.62) (0,0,0)
R6 (0,0,0) (0,0,0) (0,0,0) (0.06,0.06,0.07)
R5 (0,0,0) (0,0,0) (0,0,0) (0.69,0.76,0.83)
R4 (0,0,0) (0,0,0) (0,0,0) (0.15,0.17,0.20)
Table 9. Eigenvector matrix of level 3 respect to level 3
R33 R31 R28 R23 R12 R36 R71 R69 R60 R57 R6 R5 R4
R33 (0.5,0.5,0.5) (0,0,0) (0,0,0) (0,0,0) (0,0,0) (0,0,0) (0,0,0) (0,0,0) (0.11,0.13,0.15) (0.10,0.12,0.15) (0,0,0) (0.39,0.42,0.46) (0.28,0.33,0.37)
R31 (0,0,0) (0.5,0.5,0.5) (0.13,0.14,0.17) (0,0,0) (0.3,0.35,0.39) (0,0,0) (0,0,0) (0,0,0) (0,0,0) (0.14,0.18,0.212) (0,0,0) (0,0,0) (0.13,0.14,0.17)
R28 (0,0,0) (0.05,0.06,0.07) (0.5,0.5,0.5) (0,0,0) (0,0,0) (0,0,0) (0.04,0.047,0.06) (0.08,0.09,0.10) (0,0,0) (0.04,0.05,0.06) (0,0,0) (0,0,0) (0,0,0)
R23 (0,0,0) (0,0,0) (0,0,0) (0.5,0.5,0.5) (0.11,0.12,0.14) (0.07,0.07,0.08) (0,0,0) (0,0,0) (0.05,0.056,0.07) (0.02,0.03,0.03) (0,0,0) (0.07,0.08,0.09) (0,0,0)
R12 (0,0,0) (0.11,0.13,0.15) (0,0,0) (0.1,0.12,0.15) (0.5,0.5,0.5) (0,0,0) (0.10,0.12,0.15) (0,0,0) (0,0,0) (0,0,0) (0,0,0) (0,0,0) (0,0,0)
R36 (0,0,0) (0,0,0) (0,0,0) (0.02,0.02,0.02) (0,0,0) (0.5,0.5,0.5) (0,0,0) (0,0,0) (0.02,0.02,0.03) (0,0,0) (0,0,0) (0,0,0) (0,0,0)
R71 (0,0,0) (0,0,0) (0.04,0.04,0.05) (0,0,0) (0.03,0.03,0.03) (0,0,0) (0.5,0.5,0.5) (0,0,0) (0,0,0) (0.01,0.01,0.02) (0,0,0) (0,0,0) (0,0,0)
R69 (0,0,0) (0,0,0) (0.02,0.02,0.02) (0,0,0) (0,0,0) (0,0,0) (0,0,0) (0.5,0.5,0.5) (0,0,0) (0.01,0.01,0.01) (0,0,0) (0,0,0) (0,0,0)
R60 (0.13,0.14,0.17) (0,0,0) (0,0,0) (0.07,0.08,0.1) (0,0,0) (0.39,0.43,0.46) (0,0,0) (0,0,0) (0.5,0.5,0.5) (0.08,0.09,0.11) (0,0,0) (0,0,0) (0,0,0)
R57 (0.23,0.28,0.32) (0.25,0.29,0.33) (0.25,0.29,0.33) (0.18,0.23,0.28) (0,0,0) (0,0,0) (0.27,0.33,0.38) (0.36,0.41,0.46) (0.25,0.29,0.33) (0.5,0.5,0.5) (0,0,0) (0,0,0) (0,0,0)
R6 (0,0,0) (0,0,0) (0,0,0) (0,0,0) (0,0,0) (0,0,0) (0,0,0) (0,0,0) (0,0,0) (0,0,0) (1,1,1) (0,0,0) (0.03,0.03,0.03)
R5 (0.05,0.05,0.06) (0,0,0) (0,0,0) (0.03,0.04,0.05) (0,0,0) (0,0,0) (0,0,0) (0,0,0) (0,0,0) (0,0,0) (0,0,0) (0.5,0.5,0.5) (0,0,0)
R4 (0.09,0.02,0.02) (0.02,0.02,0.02) (0,0,0) (0,0,0) (0,0,0) (0,0,0) (0,0,0) (0,0,0) (0,0,0) (0,0,0) (0,0,0) (0,0,0) (0.5,0.5,0.5)
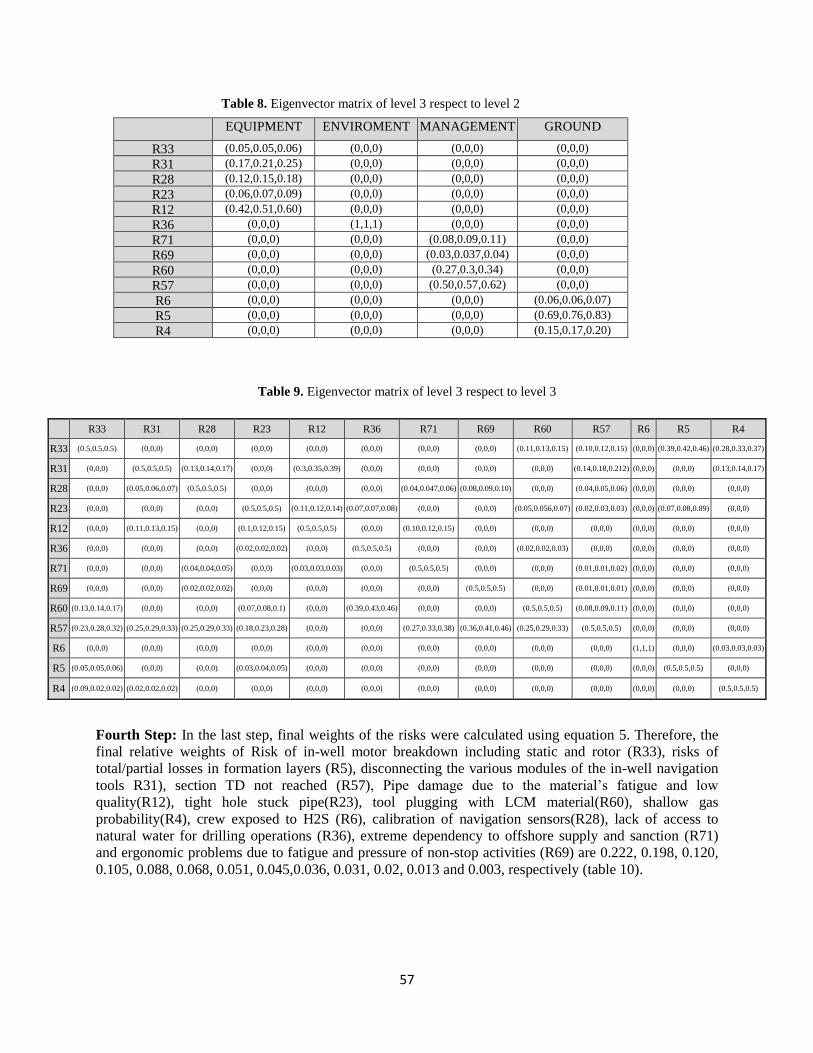
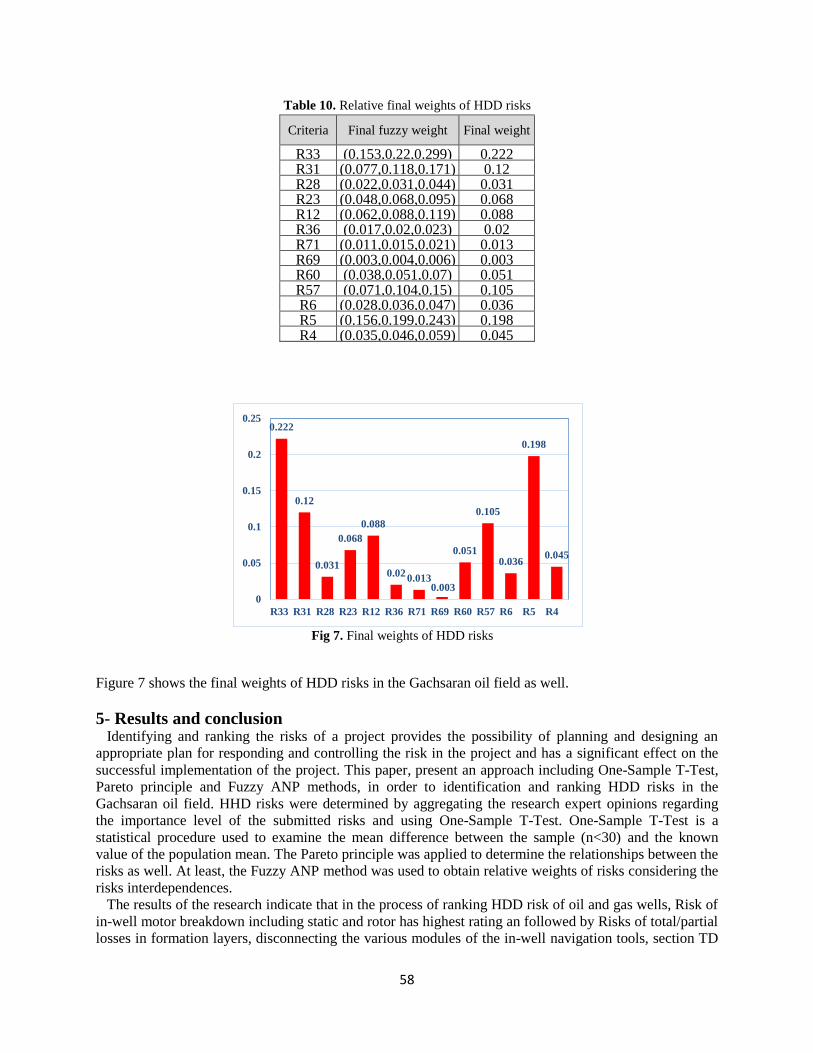
Fourth Step: In the last step, final weights of the risks were calculated using equation 5. Therefore, the
final relative weights of Risk of in-well motor breakdown including static and rotor (R33), risks of
total/partial losses in formation layers (R5), disconnecting the various modules of the in-well navigation
tools R31), section TD not reached (R57), Pipe damage due to the material’s fatigue and low
quality(R12), tight hole stuck pipe(R23), tool plugging with LCM material(R60), shallow gas
probability(R4), crew exposed to H2S (R6), calibration of navigation sensors(R28), lack of access to
natural water for drilling operations (R36), extreme dependency to offshore supply and sanction (R71)
and ergonomic problems due to fatigue and pressure of non-stop activities (R69) are 0.222, 0.198, 0.120,
0.105, 0.088, 0.068, 0.051, 0.045,0.036, 0.031, 0.02, 0.013 and 0.003, respectively (table 10).
58
0.222
0.12
0.031
0.068
0.088
0.020.013
0.003
0.051
0.105
0.036
0.198
0.045
R33 R31 R28 R23 R12 R36 R71 R69 R60 R57 R6 R5 R4
0
0.05
0.1
0.15
0.2
0.25
Table 10. Relative final weights of HDD risks
Final weight Final fuzzy weight Criteria
0.222 (0.153,0.22,0.299) R33 0.12 (0.077,0.118,0.171) R31
0.031 (0.022,0.031,0.044) R28 0.068 (0.048,0.068,0.095) R23 0.088 (0.062,0.088,0.119) R12 0.02 (0.017,0.02,0.023) R36
0.013 (0.011,0.015,0.021) R71 0.003 (0.003,0.004,0.006) R69 0.051 (0.038,0.051,0.07) R60 0.105 (0.071,0.104,0.15) R57 0.036 (0.028,0.036,0.047) R6 0.198 (0.156,0.199,0.243) R5 0.045 (0.035,0.046,0.059) R4
Fig 7. Final weights of HDD risks
Figure 7 shows the final weights of HDD risks in the Gachsaran oil field as well.
5- Results and conclusion Identifying and ranking the risks of a project provides the possibility of planning and designing an
appropriate plan for responding and controlling the risk in the project and has a significant effect on the
successful implementation of the project. This paper, present an approach including One-Sample T-Test,
Pareto principle and Fuzzy ANP methods, in order to identification and ranking HDD risks in the
Gachsaran oil field. HHD risks were determined by aggregating the research expert opinions regarding
the importance level of the submitted risks and using One-Sample T-Test. One-Sample T-Test is a
statistical procedure used to examine the mean difference between the sample (n<30) and the known
value of the population mean. The Pareto principle was applied to determine the relationships between the
risks as well. At least, the Fuzzy ANP method was used to obtain relative weights of risks considering the
risks interdependences.
The results of the research indicate that in the process of ranking HDD risk of oil and gas wells, Risk of
in-well motor breakdown including static and rotor has highest rating an followed by Risks of total/partial
losses in formation layers, disconnecting the various modules of the in-well navigation tools, section TD
59
not reached, Pipe damage due to the material’s fatigue and low quality, tight hole stuck pipe, tool
plugging with LCM material, shallow gas probability, crew exposed to H2S, calibration of navigation
sensors, lack of access to natural water for drilling operations, extreme dependency to offshore supply and
sanction, ergonomic problems due to fatigue and pressure of non-stop activities, respectively. One of the
advantages of the presented approach is using of the One-Sample T-Test to determine the HDD risks in
Gachsaran oil field, the others are: determination of relationships between risks Led to the removal of
waste calculations in Fuzzy ANP stages, considering the interdependences between risks in determination
of risks relative weights using fuzzy ANP method.
In the end, (i) Ranking the HDD risks of oil and gas wells using other methods, except the multi-
attribute decision making methods in order to reduce the impact of expert opinions on the decision-
making process; (ii) Developing the scope of research and ranking the HDD risks for all oilfields of the
country, are suggested for future studies.
References
Abdelgawad A.M., Watanabe K, Mohammed M and Takeuchi, S 2010. Estimating groundwater residence
time using multiple regression model based on fluoride dissolution: an exploration of possibilities,
Environmental Earth Sciences 60(3), 449-462.
Bennett, R.D., and Ariaratnam, S.T., 2008. Horizontal Directional Drilling Good Practices Guidelines
(3rd ed.). Virginia: HDD Consortium, Arlington.
Bi, G., Feng, C., Ding, J., Khan, K. R. 2012. Estimating relative efficiency of DMU: Pareto Principle and
Monte Carlo oriented DEA approach. Infor, 50(1), 44-57.
Carlin, M. C. 2014. A Comparative Analysis of Horizontal Directional Drilling Construction Methods in
Mainland China. A Dissertation Presented in Partial Fulfillment of the Requirements for the Degree
Doctor of Philosophy.
Gierczak, M, 2014 (1). The quantitative risk assessment of MINI, MIDI and MAXI Horizontal
Directional Drilling Projects applying Fuzzy Fault Tree Analysis. Tunnelling and Underground Space
Technology 43 67–77.
Gierczak, M, 2014 (2). The qualitative risk assessment of MINI, MIDI and MAXI horizontal directional
drilling projects. Tunnelling and Underground Space Technology. 44 148–156.
Hashash, Y. M. A., & Javier, J. 2011. Evaluation of horizontal directional drilling (HDD). Urbana, Ill:
Illinois Center for Transportation.
Hashemi, S.H., Karimi, A, Tavana, M. 2015. An integrated green supplier selection approach with
analytic network process and improved Grey relational analysis, Int. J. Production Economics, 159, 178-
191.
Kang, C.C., Feng, C.M. and Khan, H.A., 2005. Risk assessment for build-operate-transfer projects: A
dynamic multi-objective programming approach. Computer and Operations Research, 32, 1633-1654.
KarimiAzari, A.R, Mousavi, N, Mousavi, S.F, Hosseini, S.B. 2011. Risk assessment model selection in
construction industry. Expert Systems with Applications (38), 9105–9111.
Ma, B., Najafi, M., Shen, H., and Wu, L. 2010. Risk Evaluation for Maxi Horizontal Directional Drilling
Crossing Projects. Journal of Pipeline Systems Engineering and Practice, 1(2), 91-97.
60
Mawford, N, 2009. Avoid Wellbore Stability Problems with Casing Drilling. E&P Journal, 18.
Moganti, P.Y., 2016. Safety Risk Investigation of Horizontal Directional Drilling Projects, Clemson
University.
Nitro-Morote, A, Ruz-Vila, F. 2011. A fuzzy approach to construction project risk assessment.
International Journal of Project Management, 220-231.
Önüt, S, Kara, S. S., Isik, E. 2009. Long term supplier selection using a combined fuzzy MCDM
approach: A case study for a telecommunication company. Expert System with Applications, 36, 3887-
3895.
Saaty, T. L. (1996). Decision making with dependence and feedback: The analytic network process (Vol.
4922). RWS Publication.
Skogdalen, J.S, Vinnem, J.E, 2012. Quantitative risk analysis of oil and gas drilling, using Deepwater
Horizon as case study, Reliability Engineering and System Safety, 100 58–66.
Van Staveren, M. 2007. Uncertainty and ground conditions. A risk management approach. Burlington,
Butterworth-Heinemann.
Wang F, Ren T, Tu S, Hungerford F, Aziz N, 2012. Implementation of underground long-hole directional
drilling technology for greenhouse gas mitigation in Chinese coal mines. 11, 78-96.
Winter, J.C.F., 2013. Using the student’s t-test with extremely small sample sizes, Practical Assessment,
Research & Evaluation, 18(10).
Zhang, P, Luo, P, Wu, Y, and Huang, Y, 2011. The Status, Development, and Key Technologies of
Pipeline Directional Drill Project. Proceedings of the International Conference on Pipelines and
Trenchless Technologies (pp. 2338-2349). Beijjing: American Society of Civil Engineers.
Zheng, J., An, M., and Smith, N.J., 2007. Application of a fuzzy based decision making methodology to
construct project risk assessment. International Journal of Project Management, 25, 589-600.