Longitudinal Dynamic Network Analysis -...
25
Longitudinal Dynamic Network Analysis Using the Over Time Viewer Feature in ORA Ian McCulloh & Kathleen Carley March 9, 2009 CMU-ISR-09-118 Institute for Software Research School of Computer Science Carnegie Mellon University Pittsburgh, PA 15213 Center for the Computational Analysis of Social and Organizational Systems CASOS technical report. This work was supported, in part, by the Army Research Institute for the Behavioral and Social Sciences, Army Project No. 611102B74F, the Army Research Lab ADA CTA - DAAD19-01-2-0009, the National Science Foundation (NSF) Integrative Graduate Education and Research Traineeship (IGERT) program [IGERT - DGE-9972762], and the Office of Naval Research [ONR MURI - N000140811186; ONR MMV - N00014-06-1-0104; ONR SORASCS - N000140811223]. This work is part of the Dynamics Networks project at the center for Computational Analysis of Social and Organizational Systems (CASOS) http://www.casos.cs.cmu.edu ) in the School of Computer Science (SCS) at Carnegie Mellon University (CMU). The views and conclusions contained in this document are those of the authors and should not be interpreted as representing the official policies, either expressed or implied, of the Army Research Institute, the Army Research Lab, the National Science Foundation, the Office of Naval Research or the U.S. government
Transcript of Longitudinal Dynamic Network Analysis -...

Longitudinal Dynamic Network Analysis Using the Over Time Viewer Feature in ORA
Ian McCulloh amp Kathleen Carley
March 9 2009 CMU-ISR-09-118
Institute for Software Research School of Computer Science Carnegie Mellon University
Pittsburgh PA 15213
Center for the Computational Analysis of Social and Organizational Systems CASOS technical report
This work was supported in part by the Army Research Institute for the Behavioral and Social Sciences Army Project No 611102B74F the Army Research Lab ADA CTA - DAAD19-01-2-0009 the National Science Foundation (NSF) Integrative Graduate Education and Research Traineeship (IGERT) program [IGERT - DGE-9972762] and the Office of Naval Research [ONR MURI - N000140811186 ONR MMV - N00014-06-1-0104 ONR SORASCS - N000140811223] This work is part of the Dynamics Networks project at the center for Computational Analysis of Social and Organizational Systems (CASOS) httpwwwcasoscscmuedu) in the School of Computer Science (SCS) at Carnegie Mellon University (CMU) The views and conclusions contained in this document are those of the authors and should not be interpreted as representing the official policies either expressed or implied of the Army Research Institute the Army Research Lab the National Science Foundation the Office of Naval Research or the US government
ii
Keywords networks change detection network evolution longitudinal network analysis dynamic network analysis
iii
Abstract
Analyzing network over time has become increasingly popular as longitudinal network data becomes more available Longitudinal networks are studied by sociologists to understand network evolution belief formation friendship formation diffusion of innovations the spread of deviant behavior and more Organizations are interested in studying longitudinal network in order to get inside the decision cycle of major events Prior to important events occurring in an organization there is likely to exist an earlier change in network dynamics Being able to identify that a change in network dynamics has occurred can enable managers to respond to the change in network behavior prior to the event occurring and shape a favorable outcome
The Over Time Viewer is a software tool hosted by the CASOS software suite
that enables the analysis of longitudinal dynamic network data This report introduces the Over Time Viewer and provides instruction on how to effectively use its features We provide step-by-step instructions and illustrations as well as a description of the technology underlying the tool
iv
v
Table of Contents 1 Introduction 1
11 Importance of Change in Longitudinal Social Networks 2
12 Application 5
2 Using the Over Time Viewer 7
21 STEP 1 Launching the Over Time Viewer 7
22 STEP 2 Over Time Dependence 9
23 STEP 3 Network Change Detection 15
3 Future Work 16
4 References 17
vi
1
1 Introduction Terrorists from al-Qaeda attacked America on 11 September 2001 Some suggest
that these terrorists began to plan and resource this attack as early as 1997 If social network analysts could monitor the social email or phone networks of these terrorists and detect organizational changes quickly they may enable military leaders to respond prior to the successful completion of their attack Social network change detection (SNCD) is a novel approach to this problem It combines the area of statistical process control and social network analysis The combination of these two disciplines is likely to produce significant insight into organizational behavior and social dynamics
Statistical process control is a statistical approach for detecting anomalies in the
behavior of a stochastic process over time This approach is widely used in manufacturing as a means for quality control Manufacturing systems experience similar issues of high correlation dependence and non-ergodicity that is common in relational network data I posit that applying statistical process control to graph-level network measures is effective at rapidly detecting changes in longitudinal network data
It is important to note that I am not predicting change but rather detecting that a
change occurred quickly and making some inference about the actual time of change For example before a terrorist commits an attack there will be a change in the social network as the organization plans and resources the attack SNCD may allow an analyst to detect the change in the social network prior to the successful completion of the attack In a similar fashion corporate managers may wish to detect changes in the organizational behavior of their companies to capitalize on innovation or prevent problems For example the CEO of Dupont became aware of the US recession in late 2008 in time to enact a crisis management plan averting financial disaster for the company In this example the economic change had already occurred Dupontrsquos success was not in predicting a recession but rather detecting that it had occurred quickly in time to respond
SNCD may offer executives and military analysts a tool to operate inside the normal
decision cycle Figure 1 represents some measure of interest over time It could be the revenue of a company the combat power of an enemy or for our purposes a measure of interest from a social network When do we conclude from this measure that a change may have occurred Let us assume that by conventional methods we can detect a change in organizational behavior as of ldquotodayrdquo the vertical line in Figure 1 This time point might be too late to take and preventative or mitigating action In other words this could be the point of inevitable bankruptcy for the company or the successful culmination of a terrorist attack Identifying that a change occurred by time period E might allow the analyst to respond to the change before it is too late get inside the decision cycle
Change detection is more challenging than it may seem at first We can see a sudden
change in the measure between time D and time E however this may look very similar to the peak at time A Furthermore if we assert that a change in fact occurs at time A
2
there may exist a large amount of time periods to investigate for the cause of any change If we can identify more likely points in time where change may have occurred we can reduce the costs in terms of time and resources to search for the potential causes of change Identifying the likely time that a change may have occurred is called change point identification
Another problem that we face is detecting the change as quickly as possible after the
change occurred Can we improve the ability to get inside the decision cycle by detecting the change at time D or even better at time B This is called change detection This thesis is a first attempt to investigate this challenging problem in longitudinal network analysis
Figure 1 Example of Change Detection
11 Importance of Change in Longitudinal Social Networks
This thesis addresses a new area of research that is a national need Research agencies throughout the Department of Defense (DoD) and the US Government have demonstrated recent interest in pursuing research in the area of social network analysis Particular interest is in stochastic and predictive modeling of these networks The National Research Council (NRC) (2005) in a recent report on Network Science identified a lack of understanding in the stochastic behavior of networks They further stated that there existed a great need for this understanding in order to develop effective predictive models Twenty percent of the research tasks in the Office of Naval Researchrsquos (ONR) recent broad agency announcement 07-036 were in the area of social networks One of the research tasks were for ldquoreal time methods for the analysis of networksrdquo Another task was to develop ldquometrics extracted in real time to diagnose effective or ineffective collaboration or negotiationrdquo and for creating ldquounobtrusive data collection methodologiesrdquo for social networks The US Army Research Institute for the
A
B C
D
E
today
3
Behavioral and Social Sciences (ARI) has requested research in social networks to ldquoinvestigate individual unit and organizational behavior within the context of complex networked environmentsrdquo in their fiscal year 2008 BAA The US Army Research Office has already budgeted over $1 Million per year for faculty and cadets at the US Military Academy to study the stochastic behavior of networks The National Academies identified the need for research in this area as early as 2003 in the Dynamic Social Network Modeling and Analysis workshop in Washington DC
While this research will not predict network behavior it will provide an approach
for more accurately detecting that a change occurred and when that change likely occurred This is an important first step for any predictive analysis If a social scientist can accurately detect change and the time change occurred only then can he investigate the cause of change with any real success Therefore I posit that this approach will contribute to longitudinal network analysis in general enabling future researchers to address the problem of prediction
Much research has been focused in the area of longitudinal social networks
(Sampson 1969 Newcomb 1961 Sanil Banks and Carley 1995 Snijders 1990 2007 Frank 1991 Huisman and Snijders 2003 Johnson et al 2003 McCulloh et al 2007a 2007b) Wasserman et al (2007) state that ldquoThe analysis of social networks over time has long been recognized as something of a Holy Grail for network researchersrdquo Doreian and Stokman (1997) produced a seminal text on the evolution of social networks In their book they identified as a minimum 47 articles published in Social Networks that included some use of time as of 1994 They also noted several articles that used over time data but discarded the temporal component presumably because the authors lacked the methods to properly analyze such data An excellent example of this is the Newcomb (1961) fraternity data which has been widely used throughout the social network literature More recently this data has been analyzed with itsrsquo temporal component (Doreian et al 1997 Krackhardt 1998)
Methods for the analysis of over time network data has actually been present in
the social sciences literature for quite some time (Katz and Proctor 1959 Holland and Leinhardt 1977 Wasserman 1977 Wasserman and Iacobuccci 1988 Frank 1991) The dominant methods of longitudinal social network analysis include Markov chain models multi-agent simulation models and statistical models Continuous time Markov chains for modeling longitudinal networks were proposed as early as 1977 by Holland and Leinhardt and by Wasserman Their early work has been significantly improved upon (Wasserman 1979 1980 Leenders 1995 Snijders and van Duijn 1997 Snijders 2001 Robins and Pattison 2001) and Markovian methods of longitudinal analysis have even been automated in a popular social network analysis software package SIENA A related body of research focuses on the evolution of social networks (Dorien 1983 Carley 1991 Carley 1995 Dorien and Stokman 1997) to include three special issues in the Journal of Mathematical Sociology (JMS Vol 21 1-2 JMS Vol 25 1 JMS Vol 27 1) Evolutionary models often use multi-agent simulation Others have focused on statistical models of network change (Feld 1997 Sanil Banks and Carley 1995 Snijders 1990 1996 Van de Bunt et al 1999 Snijders and Van Duijn 1997) Robins and Pattison
4
(2001 2007) have used dependence graphs to account for dependence in over-time network evolution We can clearly see that the development of longitudinal network analysis methods is a well established problem in the field of social networks Table 1 provides a comparison of the dominant methods for longitudinal network analysis
The literature shows that there exist four network dynamic states in longitudinal
social networks A network can exhibit stability This occurs when the underlying relationships in a group remain the same over time Observations of the network can vary between time periods due to observation error survey error or normal fluctuations in communication A network can evolve This occurs when interactions between agents in the network cause the relationships to change over time A network can experience shock This type of change is exogenous to the social group Finally a network can experience a mutation This occurs when an exogenous change initiates evolutionary behavior
Much of the research in longitudinal social networks has focused on evolutionary
change Markov methods and multi-agent simulation are effective at helping social scientists understand evolutionary change However a careful review of the literature did not reveal any research in detecting shock or mutations in the network
SNCD provides a statistical approach for detecting changes in a network over
time In addition to change detection change point identification is also possible Identifying changes and change points in empirical data will allow social scientists to better isolate factors affecting network evolution as well as the relatively new concept of shock Moreover knowing when a network change occurs provides an analyst insight in how to bifurcate longitudinal network data for analysis
A complete review of methods for longitudinal social network analysis is beyond
the scope of this thesis The reader is referred to Wasserman and Faust (1994) Dorien and Stokman (1997) and Carrington Scott and Wasserman (2007) Essentially methods for longitudinal social network analysis have been focused on modeling and testing for the significance of social theories in empirical data These methods have not been designed to detect change over time This thesis is focused on detecting change in a social network over time
5
Markov Chain Multi-Agent Statistical SNCD Problem Addressed
1 Network evolution based on Markovian assumptions 2 Determine how underlying social theories affect group dynamics
1 Network evolution based on node-level behavior 2 Evaluate the impact of social intervention on group dynamics
1 Compare the properties of networks at different points in time
1 Detect change (shock evolution or mutation) over time in empirical networks
Key Assumptions
1 Future behavior of network is independent of the past 2 There is no exogenous change in the network
1 Node level behavior can drive group behavior 2 Underlying social theories affecting group dynamics are known
Assumptions vary but include such things as dyadic independence dependence over-time independence one node class
Group behavior can be inferred from longitudinal social networks
Limitations for change detection
1 Does not account for exogenous change 2 Markov assumption
1 Used to model both exogenous and evolutionary change but not to detect change 2 Underlying social theories must be known
1 Does not handle over-time dependence 2 Not a longitudinal approach
1 Ergodicity and dependence is not fully addressed
Strengths Determining significant social theories affecting group dynamics
Simulating group dynamics in a social network
Comparing social networks
Detecting changes in empirical social networks over time
12 Applicat ion
This thesis will provide insight into the stochastic behavior of social networks In addition algorithms will be proposed that detect subtle changes in a social network Imagine Joe Analyst working in an intelligence center trying to understand the dynamics of global terrorism He currently has wide array of tools to assist him He can piece together social networks from news papers and broadcasts intercepted voice communication and intelligence gathered from field agents He can model this
6
information with social networks and use various measures to identify individuals who are well connected influential or connect otherwise disconnect terrorist cells In other words he can tell you who was likely responsible for an attack in the past and who was influential in the organization But what about today Have influential members become less important Are other members of the organization assuming more influential positions in the social network Can we detect a change in the social network of a terrorist organization as they increase their communication before they are able to execute their planned terrorist attack These are the questions that this research will help answer
Applications are not limited to the military Consider a civilian company whose
managers can identify major leadership challenges before they affect the productivity of the company The introduction of e-mail and cell phones into the workplace has significantly changes the dynamics of communication In the past workers had limited peers available that they could ask about problems before they had to seek guidance from senior management Today the available peers to consult are limited only by a personrsquos social network With growing on-line communities of practice this network is becoming larger and larger While this is good that workers are able to resolve problems at a lower level senior managers are unable to influence decisions with their senior judgment and experience This research will provide those managers with a tool to detect potential problems in their organization by detecting subtle changes in the social network of employees
7
2 Using the Over Time Viewer This section provides step-by-step instructions on how to use the Over Time Viewer
in ORA to conduct longitudinal network analysis This procedure is illustrated with a longitudinal network data set constructed from email activity The data set is part of McCullohrsquos IkeNet 3 (McCulloh 2009) The IkeNet data set consists of longitudinal network data constructed from email traffic on a group of officers and cadets at the US Military Academy The participants agreed to allow the researchers to monitor their email activity in exchange for the use of a blackberry Daily networks were created where the nodes were the participants and their email messages There were directed links from a node sending an email to the email message that they sent and from the email message to the recipients of the message creating a bipartite network For this report we conducted a relational algebra in ORA to multiply the (agent x email) network by the (email x agent) network to create a social network where individuals were related with a weight corresponding to the number of email messages sent between individuals
21 STEP 1 Launching the Over Time Viewer
To analyze networks over time several features have been created in ORA Before attempting to use the Over Time Viewer the analyst must first load the meta-networks corresponding to different time periods into ORA The meta-networks can be time stamped in ORA otherwise they must be loaded in the order of the correct time sequencing Once the networks are loaded into ORA the longitudinal analysis features can be found in the Over-Time Viewer which can be accessed from the pull down menu
A pop-up window will appear asking the user how to conform the networks When you have multiple networks over time some nodes may appear in certain time periods and be absent from others The user must therefore decide whether to
a) include nodes as isolates in time periods where they are not observed (union)
b) exclude nodes that are not in all time periods (intersection) c) calculate graph level measures on the networks as they are (do nothing)
8
ORA will spend a bit of time calculating measures and then the following screen will appear
The data used in this example comes from IkeNet 3 The networks analyzed are daily snapshots of the network
In the upper left the user can make some choices about the aggregation level In other words if you have daily networks do you want to aggregate over 7 time periods to have weekly networks Or perhaps you would prefer every 3 days
Below this are some options to restrict the time periods that the analyst wants to
look at This is particularly useful when there are many more than about 30 time periods This can also be used even if the dates are not recorded for the networks If no dates are recorded integer time periods are assigned to the networks beginning with time 1 An example of networks with no dates recorded is shown in the screen capture above
In the upper right of the Over Time Viewer the analyst will choose the particular measures that they want to analyze So far we have only explored network level measures Theoretically there is no reason why this will not work for any node level or meta network measure Therefore this capability is included in ORA We provide this disclaimer that analysis of agent level measures has not been proven as of the date of this publication
9
22 STEP 2 Over Time Dependence
One major obstacle to the study of network dynamics is periodicity or over-time dependence in longitudinal network data For example if we define a social network link as an agent sending an email to another we have continuous time stamped data Intuitively we can imagine that individuals are more likely to email each other at certain times of the day days of the week etc If the individuals in the network are students then their email traffic might follow the schoolrsquos academic calendar Seasonal trends in data are common in a variety of other applications as well When these periodic changes occur in the relationships that define social network links social network change detection methods are more likely to signal a false positive A false positive occurs when the social network change detection method indicates that a change in the network may have occurred when in fact there has been no change To illustrate assume that we are monitoring the density of the network for change in hourly intervals The density of the network measured for the interval between 3 AM and 4 AM might be significantly less than the network measured from 3 PM to 4 PM because most of the people in the network are asleep and not communicating between 3 AM and 4 AM This behavior is to be expected however and it is not desireable for the change detection algorithm to signal a potential change at this point Rather it would be ideal to control for this phenomenon by accounting for the time periodicity in the density measure Only then can real change be identified quickly in a background of noise
Periodicity can occur in many kinds of longitudinal data Organizations may
experience periodicity as a result of scheduled events such as a weekly meeting or monthly social event Social networks collected on college students are likely to have periodicity driven by both the semester schedule and academic year Even the weather may introduce periodicity in social network data as people are more or less likely to email or interact face-to-face At the US Military Academy people tend to run outside in warm weather in small groups of two or three During the winter people go to the gym where they are likely to see many people This causes an increase in face-to-face interaction as people stay inside In a similar fashion during the Spring and Fall many people participate in inter-unit sporting events such as soccer or Frisbee football This can also affect peoplersquo face-to-face interaction and thus the social network data collected on them
Spectral analysis provides a framework to understand periodicity Spectral
analysis is mathematical tool used to analyze functions or signals in the frequency domain as opposed to the time domain If we look at some measure of a social group over time we are conducting analysis in the time domain The frequency domain allows us to investigate how much of the given measure lies within each frequency band over a range of frequencies For example Figure 11 shows a notional measure on some made-up group in the time domain It can be seen that the measure is larger at points B and D corresponding to the middle of the week The measure is smaller at points A C and E
10
Figure 2 Notional Measure in Time Domain
If the signal in Figure 11 is converted to the frequency domain as shown in Figure
12 we can see how much of the measure lies within certain frequency bands The negative spike in Figure 12 corresponds to 7 days which is the weekly periodicity in the notional signal The actual frequency signal only runs to a value of 8 on the x-axis in Figure 12 The frequency domain signal after a value of 8 is a mirror image or harmonic of the actual frequency signal
Figure 3 Notional Measure in Frequency Domain
The frequency domain representation of a signal also includes the phase shift that
must be applied to a summation of sine functions to reconstruct the original over-time signal In other words we can combine daily weekly monthly semester and annual periodicity to recover the expected signal over-time due to periodicity For example Figures 13-15 represent monthly weekly and sub-weekly periodicities If these signals are added together meaning that the observed social network exhibits all three of these periodic behaviors the resulting signal is shown in Figure 16
2 4 6 8 10 12 14
5
10
15
20
2 4 6 8 10 12 14
15
10
5
5
10
15
A
B
C E
D
11
Figure 4 Monthly Period Figure 5 Weekly Period Figure 6 Sub-weekly Period
Figure 7 Sum of the Signal in Figures 13-15
If the periodicity in the signal shown in Figure 16 is not accounted for it appears that there may be a change in behavior around time period 20 where the signal is negatively spiked In reality this behavior is caused by periodicity If we transform the signal to the frequency domain as shown in Figure 17 we can see the weekly periodicity at point B and the sub-weekly periodicity at point A
Figure 8 Transformation of Figure 16 to the Frequency Domain
5 10 15 20 25 30
4
2
2
4
5 10 15 20 25 30
4
2
2
4
5 10 15 20 25 30
4
2
2
4
5 10 15 20 25 30
10
5
5
10
5 10 15 20 25 30
10
5
5
10
A
B
12
I propose that spectral analysis applied to social network measures over time will identify periodicity in the network I will transform an over time network measure from the time domain to the frequency domain using a Fourier transform I will then identify significant periodicity in the over-time network and present two methods for handling the periodicity The over time dependence analysis is accessed by selecting the Fast Fourier Transform tab in the Over Time Viewer as shown below This displays the frequency plot of the data
The analyst can use the Over Time Viewer to help determine which frequencies are significant Selecting Dominant Frequencies on the radio button to the lower left displays only the statistically significant frequencies The Fourier Transform uses the normal distribution in order to transform data from the time domain to the frequency domain Therefore the normal distribution is an appropriate distribution to fit to the frequencies plotted in the frequency plot All frequencies that are within two standard deviations of the mean are then set equal to zero for the dominant frequency plot revealing only the dominant frequencies A dominant frequency is a potential source of periodicity as opposed to random noise in the over time signal
13
The analyst will often want to transform the statistically significant frequencies from the frequency domain back into the time domain so that heshe can make better sense of them To do this the analyst must select the radio button on the lower left called Period Plot
The period plot shows the analyst the expected periodicity in the over-time data In the example you can see weekly periodicity The peaks and valleys in the period plot occur approximately every 7 days At this point the analyst may wish to merge the daily data into weekly networks This would average out the effects of weekends and evenings that are likely to affect the properties of daily networks Another approach is to simply look at the networks departure from what is expected
14
The Filtered Plot radio button will create an over-time plot of how the measure deviates from what is expected based on the periodicity of the measure You can also plot the filtered measure with the original measure to see the difference as shown below
15
23 STEP 3 Network Change Detect ion
The user may also wish to detect statistically significant change in the network over time The user can select the Change Detection tab shown in the screen capture below There are three different control chart procedures that can be applied to the signal We are applying the Cumulative Sum or CUSUM in this example The user must enter the number of ldquoIn-controlrdquo networks This is the number of networks that you must assume to be typical The procedure actually detects networks that are significantly different from the networks that are ldquoin the first however many networks are selected as in-controlrdquo For the CUSUM the analyst can select a standardized magnitude of change to optimize the procedure for A novice user should just use the default value of 1 Finally the user must determine the procedurersquos sensitivity to false alarms The user can select a decision interval or specify the false positive risk or specify the expected number of observations until a false positive is reached For this example we use a false positive risk of 001 which corresponds to a decision interval of 35 and 100 expected observations until a false positive
The maroon horizontal line is the decision interval of the change detection procedure When a plot of the CUSUM crosses the decision interval the analyst may conclude that a change in network behavior may have occurred The red line in the plot is the CUSUM statistic for detecting a decrease in the Betweenness Network Centralization The blue line in the plot is the CUSUM statistic for detecting an increase in the Betweenness Network Centralization The example above indicates that there may have been a statistically significant change in the network over time We detect a change in the network on 18 September 2008 (time period 18) when the blue line crosses the
16
decision interval This signals an increase in the Betweenness Network Centralization The most likely time the change actually occurred was the last time the statistic was 0 which was 14 September 2008
The cadet regimental chain of command assumed duties on 18 August Part of
the IkeNet3 experiment was to introduce blackberries to the chain of command and observe the impact The blackberries were scheduled to be issued to the cadet chain of command on 18 September They were notified at their weekly meeting on 14 September All of the cadets were not issued their blackberries until 22 September but the first blackberry was issued on 18 September Therefore dynamic network change detection is successful at detecting this significant event in the organizational behavior of one of three subpopulations monitored In other words the behavior only changed for 24 out of 68 individuals in the network This demonstrates the ability of dynamic network change detection to detect small persistent change in network behavior in a background of noise
The Over Time Viewer can be used to investigate multiple different network
measures different risks for false positives and different aggregation levels The analyst must simply make their selections and then hit the ldquoComputerdquo button in the Change Detection tab Different aggregation levels can also be investigated by selecting the aggregation level in the upper right of the interface hitting ldquoRecomputerdquo then hitting the ldquoComputerdquo button in the Change Detection tab
3 Future Work
Additional features in the Over Time Viewer will include additional change detection procedures Currently the software tool contains three procedures the Shewhart (1927) x-bar chart the CUSUM (Page 1951) and the Exponentially Weighted Moving Average (Roberts 1959) While these have been demonstrated to be an effective approach for network change detection (McCulloh 2009) other approaches exist
There are many factors that contribute to an analystrsquos choice of change detection
procedure Additional work is still required on the performance of network change detection to determine which of these factors are appropriate for network applications of statistical process control The Over Time Viewer will continue to incorporate additional change detection procedures to allow users to investigate change detection using the CASOS software suite An early example is the incorporation of agent level measures for change detection Although unproven these features are already present in the Over Time Viewer
Change detection in longitudinal networks is a relatively new field of active and
ongoing research No doubt new approaches and concerns will be raised as scientists explore network change As new methods are developed we intend to incorporate them in future versions of the Over Time Viewer
17
4 References Carley KM (1991) A theory of group stability American Sociology Review
56(3)331ndash354 Carley KM (1995) Communication Technologies and Their Effect on Cultural
Homogeneity Consensus and the Diffusion of New Ideas Sociological Perspectives 38(4) 547-571
Carley KM Diesner J Reminga J Tsvetovat M (2004) Interoperability of Dynamic Network Analysis Software
Carley K M (2007) ORA Organizational Risk Analyzer v178 [Network Analysis Software] Pittsburgh Carnegie Mellon University
Carrington PJ Scott J and Wasserman S (2007) Models and Methods in Social Network Analysis Cambridge University Press
Doreian P (1983) On the evolution of group and network structures II Structures within structure Social Networks 8 33-64
Doreian P and Stokman FN (Eds) (1997) Evolution of Social Networks Amsterdam Gordon and Breach
Feld S (1997) Structural embeddedness and stability of interpersonal relations Social Networks 19 91-95
Frank O (1991) Statistical analysis of change in networks Statistica Neerlandica 45 (1991) 283ndash293
Holland P and Leinhardt S (1977) A dynamic model for social networks Journal of Mathematical Sociology 5 5-20
Holland PW Leinhardt S (1981) An exponential family of probability distributions for directed graphs (with discussion) Journal of the American Statistical Association 76 33ndash65
Huisman M and Snijders TAB (2003) Statistical analysis of longitudinal network data with changing composition Sociological Methods and Research 32 253-287
Johnson JC Boster JS and Palinkas LA (2003) Social roles and the evolution of networks in extreme and isolated environments Journal of Mathematical Sociology 27 89-121
Katz L and Proctor CH (1959) The configuration of interpersonal relations in a group as a time-dependent stochastic process Psychometrika 24 317-327
Krackhardt D (1998) Simmelian ties Super strong and sticky In Power and Influence in Organizations (eds R Kramer M Neale) pp 21-38 Sage Thousand Oaks CA
Leenders R (1995) Models for network dynamics a Markovian framework Journal of Mathematical Sociology 20 1-21
McCulloh I (2009) Detecting Changes in a Dynamic Social Network PhD Thesis Carnegie Mellon University Pittsburgh PA
McCulloh I amp Carley K M (2008) Social Network Change Detection Carnegie Mellon University School of Computer Science Institute for Software Research Technical Report CMU-ISR-08-116
McCulloh I Garcia G Tardieu K MacGibon J Dye H Moores K Graham J M amp Horn D B (2007a) IkeNet Social network analysis of e-mail traffic in the Eisenhower Leadership Development Program (Technical Report No 1218)
18
Arlington VA US Army Research Institute for the Behavioral and Social Sciences
McCulloh I Lospinoso J and Carley KM (2007b) Social Network Probability Mechanics Proceedings of the World Scientific Engineering Academy and Society 12th International Conference on Applied Mathematics Cairo Egypt 29-31 December 2007
McCulloh I Ring B Frantz TL and Carley KM (2008) Unobtrusive Social Network Data from Email In Proceedings of the 26th Army Science Conference Orlando FL US Army
Newcomb TN (1961) The Acquaintance Process Holt Rinehart and Winston New York
Page ES (1961) Cumulative Sum Control Charts Technometrics 3 1-9 Roberts SV (1959) Control chart tests based on geometric moving averages
Technometrics 1 239-250 Robins G and Pattison P (2007) Interdependencies and Social Processes Dependence
Graphs and Generalized Dependence Structures In P Carrington J Scott and S Wasserman Editors Models and Methods in Social Network Analysis Cambridge University Press New York 192-214
Robins G and Pattison P (2001) Random graph models for temporal processes in social networks Journal of Mathematical Sociology 25 5-41
Sampson SF (1969) Crisis in a cloister PhD Thesis Cornell University Ithaca Sanil A Banks D and Carley KM (1995) Models for evolving fixed node networks
Model fitting and model testing Social Networks 17 1995 Shewhart WA (1927) Quality Control Bell Systems Technical Journal Snijders TAB (2007) Models for longitudinal network data In P Carrington J Scott
and S Wasserman Editors Models and Methods in Social Network Analysis Cambridge University Press New York 148ndash161
Snijders TAB (1990) Testing for change in a digraph at two time points Social Networks 12 539-573
Snijders T A B Van Duijn MAJ (1997) Simulation for Statistical Inference in Dynamic Network Models In Simulating Social Phenomena (Ed R Conte R Hegselmann and P Tera) Berlin Springer pp 493-512
Snijders TAB (2001) The statistical evaluation of social network dynamics In Sobel ME and Becker MP (Eds) Sociological Methodology 361-395 Boston Basil Blackwell
Wasserman S (1980) Analyzing social networks as stochastic processes Journal of American Statistical Association 75 280-294
Wasserman S (1977) Stochastic Models for Directed Graphs PhD dissertation Harvard University Department of Statistics Cambridge MA
Wasserman S (1979) A stochastic model for directed graphs with transition rates determined by reciprocity In Sociological Methodology 1980 (Ed Schuessler KF) San Francisco Jossey-Bass 392-412
Wasserman S amp Faust K (1994) Social Network Analysis Methods and Applications New York Cambridge University Press
Wasserman S Iacobucci D (1988) Sequential Social Network Data Psychometrika 53261-82
19
Van de Bunt GG Van Duijin MAJ and Snijders TAB (1999) Friendship networks through time An actor-oriented statistical network model Computational and Mathematical Organization Theory 5 167-192
- 1 Introduction
-
- 11 Importance of Change in Longitudinal Social Networks
- 12 Application
-
- 2 Using the Over Time Viewer
-
- 21 STEP 1 Launching the Over Time Viewer
- 22 STEP 2 Over Time Dependence
- 23 STEP 3 Network Change Detection
-
- 3 Future Work
- 4 References
-
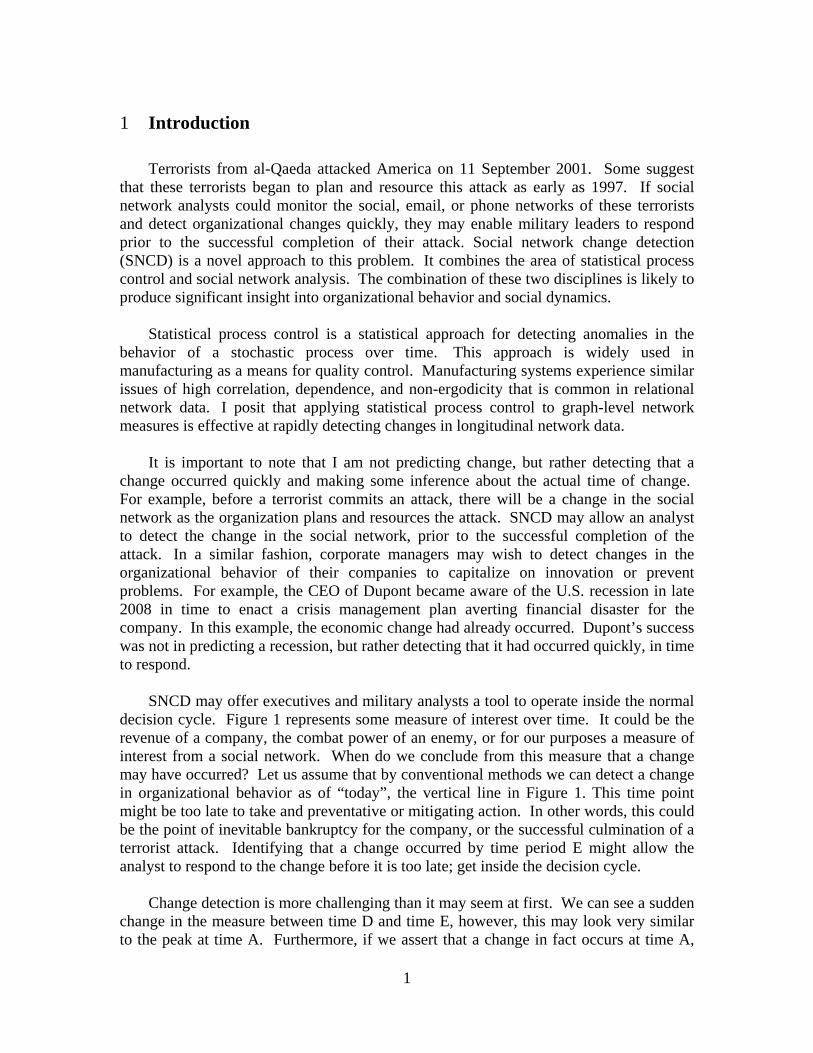
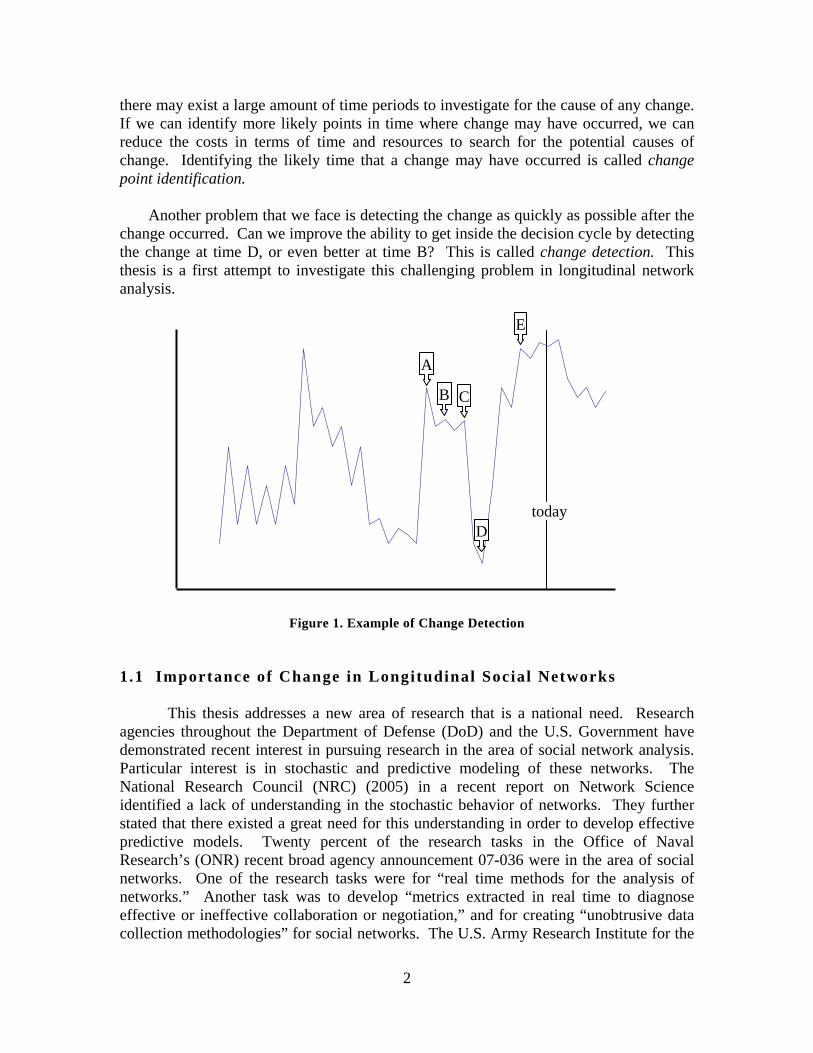
2
there may exist a large amount of time periods to investigate for the cause of any change If we can identify more likely points in time where change may have occurred we can reduce the costs in terms of time and resources to search for the potential causes of change Identifying the likely time that a change may have occurred is called change point identification
Another problem that we face is detecting the change as quickly as possible after the
change occurred Can we improve the ability to get inside the decision cycle by detecting the change at time D or even better at time B This is called change detection This thesis is a first attempt to investigate this challenging problem in longitudinal network analysis
Figure 1 Example of Change Detection
11 Importance of Change in Longitudinal Social Networks
This thesis addresses a new area of research that is a national need Research agencies throughout the Department of Defense (DoD) and the US Government have demonstrated recent interest in pursuing research in the area of social network analysis Particular interest is in stochastic and predictive modeling of these networks The National Research Council (NRC) (2005) in a recent report on Network Science identified a lack of understanding in the stochastic behavior of networks They further stated that there existed a great need for this understanding in order to develop effective predictive models Twenty percent of the research tasks in the Office of Naval Researchrsquos (ONR) recent broad agency announcement 07-036 were in the area of social networks One of the research tasks were for ldquoreal time methods for the analysis of networksrdquo Another task was to develop ldquometrics extracted in real time to diagnose effective or ineffective collaboration or negotiationrdquo and for creating ldquounobtrusive data collection methodologiesrdquo for social networks The US Army Research Institute for the
A
B C
D
E
today
3
Behavioral and Social Sciences (ARI) has requested research in social networks to ldquoinvestigate individual unit and organizational behavior within the context of complex networked environmentsrdquo in their fiscal year 2008 BAA The US Army Research Office has already budgeted over $1 Million per year for faculty and cadets at the US Military Academy to study the stochastic behavior of networks The National Academies identified the need for research in this area as early as 2003 in the Dynamic Social Network Modeling and Analysis workshop in Washington DC
While this research will not predict network behavior it will provide an approach
for more accurately detecting that a change occurred and when that change likely occurred This is an important first step for any predictive analysis If a social scientist can accurately detect change and the time change occurred only then can he investigate the cause of change with any real success Therefore I posit that this approach will contribute to longitudinal network analysis in general enabling future researchers to address the problem of prediction
Much research has been focused in the area of longitudinal social networks
(Sampson 1969 Newcomb 1961 Sanil Banks and Carley 1995 Snijders 1990 2007 Frank 1991 Huisman and Snijders 2003 Johnson et al 2003 McCulloh et al 2007a 2007b) Wasserman et al (2007) state that ldquoThe analysis of social networks over time has long been recognized as something of a Holy Grail for network researchersrdquo Doreian and Stokman (1997) produced a seminal text on the evolution of social networks In their book they identified as a minimum 47 articles published in Social Networks that included some use of time as of 1994 They also noted several articles that used over time data but discarded the temporal component presumably because the authors lacked the methods to properly analyze such data An excellent example of this is the Newcomb (1961) fraternity data which has been widely used throughout the social network literature More recently this data has been analyzed with itsrsquo temporal component (Doreian et al 1997 Krackhardt 1998)
Methods for the analysis of over time network data has actually been present in
the social sciences literature for quite some time (Katz and Proctor 1959 Holland and Leinhardt 1977 Wasserman 1977 Wasserman and Iacobuccci 1988 Frank 1991) The dominant methods of longitudinal social network analysis include Markov chain models multi-agent simulation models and statistical models Continuous time Markov chains for modeling longitudinal networks were proposed as early as 1977 by Holland and Leinhardt and by Wasserman Their early work has been significantly improved upon (Wasserman 1979 1980 Leenders 1995 Snijders and van Duijn 1997 Snijders 2001 Robins and Pattison 2001) and Markovian methods of longitudinal analysis have even been automated in a popular social network analysis software package SIENA A related body of research focuses on the evolution of social networks (Dorien 1983 Carley 1991 Carley 1995 Dorien and Stokman 1997) to include three special issues in the Journal of Mathematical Sociology (JMS Vol 21 1-2 JMS Vol 25 1 JMS Vol 27 1) Evolutionary models often use multi-agent simulation Others have focused on statistical models of network change (Feld 1997 Sanil Banks and Carley 1995 Snijders 1990 1996 Van de Bunt et al 1999 Snijders and Van Duijn 1997) Robins and Pattison
4
(2001 2007) have used dependence graphs to account for dependence in over-time network evolution We can clearly see that the development of longitudinal network analysis methods is a well established problem in the field of social networks Table 1 provides a comparison of the dominant methods for longitudinal network analysis
The literature shows that there exist four network dynamic states in longitudinal
social networks A network can exhibit stability This occurs when the underlying relationships in a group remain the same over time Observations of the network can vary between time periods due to observation error survey error or normal fluctuations in communication A network can evolve This occurs when interactions between agents in the network cause the relationships to change over time A network can experience shock This type of change is exogenous to the social group Finally a network can experience a mutation This occurs when an exogenous change initiates evolutionary behavior
Much of the research in longitudinal social networks has focused on evolutionary
change Markov methods and multi-agent simulation are effective at helping social scientists understand evolutionary change However a careful review of the literature did not reveal any research in detecting shock or mutations in the network
SNCD provides a statistical approach for detecting changes in a network over
time In addition to change detection change point identification is also possible Identifying changes and change points in empirical data will allow social scientists to better isolate factors affecting network evolution as well as the relatively new concept of shock Moreover knowing when a network change occurs provides an analyst insight in how to bifurcate longitudinal network data for analysis
A complete review of methods for longitudinal social network analysis is beyond
the scope of this thesis The reader is referred to Wasserman and Faust (1994) Dorien and Stokman (1997) and Carrington Scott and Wasserman (2007) Essentially methods for longitudinal social network analysis have been focused on modeling and testing for the significance of social theories in empirical data These methods have not been designed to detect change over time This thesis is focused on detecting change in a social network over time
5
Markov Chain Multi-Agent Statistical SNCD Problem Addressed
1 Network evolution based on Markovian assumptions 2 Determine how underlying social theories affect group dynamics
1 Network evolution based on node-level behavior 2 Evaluate the impact of social intervention on group dynamics
1 Compare the properties of networks at different points in time
1 Detect change (shock evolution or mutation) over time in empirical networks
Key Assumptions
1 Future behavior of network is independent of the past 2 There is no exogenous change in the network
1 Node level behavior can drive group behavior 2 Underlying social theories affecting group dynamics are known
Assumptions vary but include such things as dyadic independence dependence over-time independence one node class
Group behavior can be inferred from longitudinal social networks
Limitations for change detection
1 Does not account for exogenous change 2 Markov assumption
1 Used to model both exogenous and evolutionary change but not to detect change 2 Underlying social theories must be known
1 Does not handle over-time dependence 2 Not a longitudinal approach
1 Ergodicity and dependence is not fully addressed
Strengths Determining significant social theories affecting group dynamics
Simulating group dynamics in a social network
Comparing social networks
Detecting changes in empirical social networks over time
12 Applicat ion
This thesis will provide insight into the stochastic behavior of social networks In addition algorithms will be proposed that detect subtle changes in a social network Imagine Joe Analyst working in an intelligence center trying to understand the dynamics of global terrorism He currently has wide array of tools to assist him He can piece together social networks from news papers and broadcasts intercepted voice communication and intelligence gathered from field agents He can model this
6
information with social networks and use various measures to identify individuals who are well connected influential or connect otherwise disconnect terrorist cells In other words he can tell you who was likely responsible for an attack in the past and who was influential in the organization But what about today Have influential members become less important Are other members of the organization assuming more influential positions in the social network Can we detect a change in the social network of a terrorist organization as they increase their communication before they are able to execute their planned terrorist attack These are the questions that this research will help answer
Applications are not limited to the military Consider a civilian company whose
managers can identify major leadership challenges before they affect the productivity of the company The introduction of e-mail and cell phones into the workplace has significantly changes the dynamics of communication In the past workers had limited peers available that they could ask about problems before they had to seek guidance from senior management Today the available peers to consult are limited only by a personrsquos social network With growing on-line communities of practice this network is becoming larger and larger While this is good that workers are able to resolve problems at a lower level senior managers are unable to influence decisions with their senior judgment and experience This research will provide those managers with a tool to detect potential problems in their organization by detecting subtle changes in the social network of employees
7
2 Using the Over Time Viewer This section provides step-by-step instructions on how to use the Over Time Viewer
in ORA to conduct longitudinal network analysis This procedure is illustrated with a longitudinal network data set constructed from email activity The data set is part of McCullohrsquos IkeNet 3 (McCulloh 2009) The IkeNet data set consists of longitudinal network data constructed from email traffic on a group of officers and cadets at the US Military Academy The participants agreed to allow the researchers to monitor their email activity in exchange for the use of a blackberry Daily networks were created where the nodes were the participants and their email messages There were directed links from a node sending an email to the email message that they sent and from the email message to the recipients of the message creating a bipartite network For this report we conducted a relational algebra in ORA to multiply the (agent x email) network by the (email x agent) network to create a social network where individuals were related with a weight corresponding to the number of email messages sent between individuals
21 STEP 1 Launching the Over Time Viewer
To analyze networks over time several features have been created in ORA Before attempting to use the Over Time Viewer the analyst must first load the meta-networks corresponding to different time periods into ORA The meta-networks can be time stamped in ORA otherwise they must be loaded in the order of the correct time sequencing Once the networks are loaded into ORA the longitudinal analysis features can be found in the Over-Time Viewer which can be accessed from the pull down menu
A pop-up window will appear asking the user how to conform the networks When you have multiple networks over time some nodes may appear in certain time periods and be absent from others The user must therefore decide whether to
a) include nodes as isolates in time periods where they are not observed (union)
b) exclude nodes that are not in all time periods (intersection) c) calculate graph level measures on the networks as they are (do nothing)
8
ORA will spend a bit of time calculating measures and then the following screen will appear
The data used in this example comes from IkeNet 3 The networks analyzed are daily snapshots of the network
In the upper left the user can make some choices about the aggregation level In other words if you have daily networks do you want to aggregate over 7 time periods to have weekly networks Or perhaps you would prefer every 3 days
Below this are some options to restrict the time periods that the analyst wants to
look at This is particularly useful when there are many more than about 30 time periods This can also be used even if the dates are not recorded for the networks If no dates are recorded integer time periods are assigned to the networks beginning with time 1 An example of networks with no dates recorded is shown in the screen capture above
In the upper right of the Over Time Viewer the analyst will choose the particular measures that they want to analyze So far we have only explored network level measures Theoretically there is no reason why this will not work for any node level or meta network measure Therefore this capability is included in ORA We provide this disclaimer that analysis of agent level measures has not been proven as of the date of this publication
9
22 STEP 2 Over Time Dependence
One major obstacle to the study of network dynamics is periodicity or over-time dependence in longitudinal network data For example if we define a social network link as an agent sending an email to another we have continuous time stamped data Intuitively we can imagine that individuals are more likely to email each other at certain times of the day days of the week etc If the individuals in the network are students then their email traffic might follow the schoolrsquos academic calendar Seasonal trends in data are common in a variety of other applications as well When these periodic changes occur in the relationships that define social network links social network change detection methods are more likely to signal a false positive A false positive occurs when the social network change detection method indicates that a change in the network may have occurred when in fact there has been no change To illustrate assume that we are monitoring the density of the network for change in hourly intervals The density of the network measured for the interval between 3 AM and 4 AM might be significantly less than the network measured from 3 PM to 4 PM because most of the people in the network are asleep and not communicating between 3 AM and 4 AM This behavior is to be expected however and it is not desireable for the change detection algorithm to signal a potential change at this point Rather it would be ideal to control for this phenomenon by accounting for the time periodicity in the density measure Only then can real change be identified quickly in a background of noise
Periodicity can occur in many kinds of longitudinal data Organizations may
experience periodicity as a result of scheduled events such as a weekly meeting or monthly social event Social networks collected on college students are likely to have periodicity driven by both the semester schedule and academic year Even the weather may introduce periodicity in social network data as people are more or less likely to email or interact face-to-face At the US Military Academy people tend to run outside in warm weather in small groups of two or three During the winter people go to the gym where they are likely to see many people This causes an increase in face-to-face interaction as people stay inside In a similar fashion during the Spring and Fall many people participate in inter-unit sporting events such as soccer or Frisbee football This can also affect peoplersquo face-to-face interaction and thus the social network data collected on them
Spectral analysis provides a framework to understand periodicity Spectral
analysis is mathematical tool used to analyze functions or signals in the frequency domain as opposed to the time domain If we look at some measure of a social group over time we are conducting analysis in the time domain The frequency domain allows us to investigate how much of the given measure lies within each frequency band over a range of frequencies For example Figure 11 shows a notional measure on some made-up group in the time domain It can be seen that the measure is larger at points B and D corresponding to the middle of the week The measure is smaller at points A C and E
10
Figure 2 Notional Measure in Time Domain
If the signal in Figure 11 is converted to the frequency domain as shown in Figure
12 we can see how much of the measure lies within certain frequency bands The negative spike in Figure 12 corresponds to 7 days which is the weekly periodicity in the notional signal The actual frequency signal only runs to a value of 8 on the x-axis in Figure 12 The frequency domain signal after a value of 8 is a mirror image or harmonic of the actual frequency signal
Figure 3 Notional Measure in Frequency Domain
The frequency domain representation of a signal also includes the phase shift that
must be applied to a summation of sine functions to reconstruct the original over-time signal In other words we can combine daily weekly monthly semester and annual periodicity to recover the expected signal over-time due to periodicity For example Figures 13-15 represent monthly weekly and sub-weekly periodicities If these signals are added together meaning that the observed social network exhibits all three of these periodic behaviors the resulting signal is shown in Figure 16
2 4 6 8 10 12 14
5
10
15
20
2 4 6 8 10 12 14
15
10
5
5
10
15
A
B
C E
D
11
Figure 4 Monthly Period Figure 5 Weekly Period Figure 6 Sub-weekly Period
Figure 7 Sum of the Signal in Figures 13-15
If the periodicity in the signal shown in Figure 16 is not accounted for it appears that there may be a change in behavior around time period 20 where the signal is negatively spiked In reality this behavior is caused by periodicity If we transform the signal to the frequency domain as shown in Figure 17 we can see the weekly periodicity at point B and the sub-weekly periodicity at point A
Figure 8 Transformation of Figure 16 to the Frequency Domain
5 10 15 20 25 30
4
2
2
4
5 10 15 20 25 30
4
2
2
4
5 10 15 20 25 30
4
2
2
4
5 10 15 20 25 30
10
5
5
10
5 10 15 20 25 30
10
5
5
10
A
B
12
I propose that spectral analysis applied to social network measures over time will identify periodicity in the network I will transform an over time network measure from the time domain to the frequency domain using a Fourier transform I will then identify significant periodicity in the over-time network and present two methods for handling the periodicity The over time dependence analysis is accessed by selecting the Fast Fourier Transform tab in the Over Time Viewer as shown below This displays the frequency plot of the data
The analyst can use the Over Time Viewer to help determine which frequencies are significant Selecting Dominant Frequencies on the radio button to the lower left displays only the statistically significant frequencies The Fourier Transform uses the normal distribution in order to transform data from the time domain to the frequency domain Therefore the normal distribution is an appropriate distribution to fit to the frequencies plotted in the frequency plot All frequencies that are within two standard deviations of the mean are then set equal to zero for the dominant frequency plot revealing only the dominant frequencies A dominant frequency is a potential source of periodicity as opposed to random noise in the over time signal
13
The analyst will often want to transform the statistically significant frequencies from the frequency domain back into the time domain so that heshe can make better sense of them To do this the analyst must select the radio button on the lower left called Period Plot
The period plot shows the analyst the expected periodicity in the over-time data In the example you can see weekly periodicity The peaks and valleys in the period plot occur approximately every 7 days At this point the analyst may wish to merge the daily data into weekly networks This would average out the effects of weekends and evenings that are likely to affect the properties of daily networks Another approach is to simply look at the networks departure from what is expected
14
The Filtered Plot radio button will create an over-time plot of how the measure deviates from what is expected based on the periodicity of the measure You can also plot the filtered measure with the original measure to see the difference as shown below
15
23 STEP 3 Network Change Detect ion
The user may also wish to detect statistically significant change in the network over time The user can select the Change Detection tab shown in the screen capture below There are three different control chart procedures that can be applied to the signal We are applying the Cumulative Sum or CUSUM in this example The user must enter the number of ldquoIn-controlrdquo networks This is the number of networks that you must assume to be typical The procedure actually detects networks that are significantly different from the networks that are ldquoin the first however many networks are selected as in-controlrdquo For the CUSUM the analyst can select a standardized magnitude of change to optimize the procedure for A novice user should just use the default value of 1 Finally the user must determine the procedurersquos sensitivity to false alarms The user can select a decision interval or specify the false positive risk or specify the expected number of observations until a false positive is reached For this example we use a false positive risk of 001 which corresponds to a decision interval of 35 and 100 expected observations until a false positive
The maroon horizontal line is the decision interval of the change detection procedure When a plot of the CUSUM crosses the decision interval the analyst may conclude that a change in network behavior may have occurred The red line in the plot is the CUSUM statistic for detecting a decrease in the Betweenness Network Centralization The blue line in the plot is the CUSUM statistic for detecting an increase in the Betweenness Network Centralization The example above indicates that there may have been a statistically significant change in the network over time We detect a change in the network on 18 September 2008 (time period 18) when the blue line crosses the
16
decision interval This signals an increase in the Betweenness Network Centralization The most likely time the change actually occurred was the last time the statistic was 0 which was 14 September 2008
The cadet regimental chain of command assumed duties on 18 August Part of
the IkeNet3 experiment was to introduce blackberries to the chain of command and observe the impact The blackberries were scheduled to be issued to the cadet chain of command on 18 September They were notified at their weekly meeting on 14 September All of the cadets were not issued their blackberries until 22 September but the first blackberry was issued on 18 September Therefore dynamic network change detection is successful at detecting this significant event in the organizational behavior of one of three subpopulations monitored In other words the behavior only changed for 24 out of 68 individuals in the network This demonstrates the ability of dynamic network change detection to detect small persistent change in network behavior in a background of noise
The Over Time Viewer can be used to investigate multiple different network
measures different risks for false positives and different aggregation levels The analyst must simply make their selections and then hit the ldquoComputerdquo button in the Change Detection tab Different aggregation levels can also be investigated by selecting the aggregation level in the upper right of the interface hitting ldquoRecomputerdquo then hitting the ldquoComputerdquo button in the Change Detection tab
3 Future Work
Additional features in the Over Time Viewer will include additional change detection procedures Currently the software tool contains three procedures the Shewhart (1927) x-bar chart the CUSUM (Page 1951) and the Exponentially Weighted Moving Average (Roberts 1959) While these have been demonstrated to be an effective approach for network change detection (McCulloh 2009) other approaches exist
There are many factors that contribute to an analystrsquos choice of change detection
procedure Additional work is still required on the performance of network change detection to determine which of these factors are appropriate for network applications of statistical process control The Over Time Viewer will continue to incorporate additional change detection procedures to allow users to investigate change detection using the CASOS software suite An early example is the incorporation of agent level measures for change detection Although unproven these features are already present in the Over Time Viewer
Change detection in longitudinal networks is a relatively new field of active and
ongoing research No doubt new approaches and concerns will be raised as scientists explore network change As new methods are developed we intend to incorporate them in future versions of the Over Time Viewer
17
4 References Carley KM (1991) A theory of group stability American Sociology Review
56(3)331ndash354 Carley KM (1995) Communication Technologies and Their Effect on Cultural
Homogeneity Consensus and the Diffusion of New Ideas Sociological Perspectives 38(4) 547-571
Carley KM Diesner J Reminga J Tsvetovat M (2004) Interoperability of Dynamic Network Analysis Software
Carley K M (2007) ORA Organizational Risk Analyzer v178 [Network Analysis Software] Pittsburgh Carnegie Mellon University
Carrington PJ Scott J and Wasserman S (2007) Models and Methods in Social Network Analysis Cambridge University Press
Doreian P (1983) On the evolution of group and network structures II Structures within structure Social Networks 8 33-64
Doreian P and Stokman FN (Eds) (1997) Evolution of Social Networks Amsterdam Gordon and Breach
Feld S (1997) Structural embeddedness and stability of interpersonal relations Social Networks 19 91-95
Frank O (1991) Statistical analysis of change in networks Statistica Neerlandica 45 (1991) 283ndash293
Holland P and Leinhardt S (1977) A dynamic model for social networks Journal of Mathematical Sociology 5 5-20
Holland PW Leinhardt S (1981) An exponential family of probability distributions for directed graphs (with discussion) Journal of the American Statistical Association 76 33ndash65
Huisman M and Snijders TAB (2003) Statistical analysis of longitudinal network data with changing composition Sociological Methods and Research 32 253-287
Johnson JC Boster JS and Palinkas LA (2003) Social roles and the evolution of networks in extreme and isolated environments Journal of Mathematical Sociology 27 89-121
Katz L and Proctor CH (1959) The configuration of interpersonal relations in a group as a time-dependent stochastic process Psychometrika 24 317-327
Krackhardt D (1998) Simmelian ties Super strong and sticky In Power and Influence in Organizations (eds R Kramer M Neale) pp 21-38 Sage Thousand Oaks CA
Leenders R (1995) Models for network dynamics a Markovian framework Journal of Mathematical Sociology 20 1-21
McCulloh I (2009) Detecting Changes in a Dynamic Social Network PhD Thesis Carnegie Mellon University Pittsburgh PA
McCulloh I amp Carley K M (2008) Social Network Change Detection Carnegie Mellon University School of Computer Science Institute for Software Research Technical Report CMU-ISR-08-116
McCulloh I Garcia G Tardieu K MacGibon J Dye H Moores K Graham J M amp Horn D B (2007a) IkeNet Social network analysis of e-mail traffic in the Eisenhower Leadership Development Program (Technical Report No 1218)
18
Arlington VA US Army Research Institute for the Behavioral and Social Sciences
McCulloh I Lospinoso J and Carley KM (2007b) Social Network Probability Mechanics Proceedings of the World Scientific Engineering Academy and Society 12th International Conference on Applied Mathematics Cairo Egypt 29-31 December 2007
McCulloh I Ring B Frantz TL and Carley KM (2008) Unobtrusive Social Network Data from Email In Proceedings of the 26th Army Science Conference Orlando FL US Army
Newcomb TN (1961) The Acquaintance Process Holt Rinehart and Winston New York
Page ES (1961) Cumulative Sum Control Charts Technometrics 3 1-9 Roberts SV (1959) Control chart tests based on geometric moving averages
Technometrics 1 239-250 Robins G and Pattison P (2007) Interdependencies and Social Processes Dependence
Graphs and Generalized Dependence Structures In P Carrington J Scott and S Wasserman Editors Models and Methods in Social Network Analysis Cambridge University Press New York 192-214
Robins G and Pattison P (2001) Random graph models for temporal processes in social networks Journal of Mathematical Sociology 25 5-41
Sampson SF (1969) Crisis in a cloister PhD Thesis Cornell University Ithaca Sanil A Banks D and Carley KM (1995) Models for evolving fixed node networks
Model fitting and model testing Social Networks 17 1995 Shewhart WA (1927) Quality Control Bell Systems Technical Journal Snijders TAB (2007) Models for longitudinal network data In P Carrington J Scott
and S Wasserman Editors Models and Methods in Social Network Analysis Cambridge University Press New York 148ndash161
Snijders TAB (1990) Testing for change in a digraph at two time points Social Networks 12 539-573
Snijders T A B Van Duijn MAJ (1997) Simulation for Statistical Inference in Dynamic Network Models In Simulating Social Phenomena (Ed R Conte R Hegselmann and P Tera) Berlin Springer pp 493-512
Snijders TAB (2001) The statistical evaluation of social network dynamics In Sobel ME and Becker MP (Eds) Sociological Methodology 361-395 Boston Basil Blackwell
Wasserman S (1980) Analyzing social networks as stochastic processes Journal of American Statistical Association 75 280-294
Wasserman S (1977) Stochastic Models for Directed Graphs PhD dissertation Harvard University Department of Statistics Cambridge MA
Wasserman S (1979) A stochastic model for directed graphs with transition rates determined by reciprocity In Sociological Methodology 1980 (Ed Schuessler KF) San Francisco Jossey-Bass 392-412
Wasserman S amp Faust K (1994) Social Network Analysis Methods and Applications New York Cambridge University Press
Wasserman S Iacobucci D (1988) Sequential Social Network Data Psychometrika 53261-82
19
Van de Bunt GG Van Duijin MAJ and Snijders TAB (1999) Friendship networks through time An actor-oriented statistical network model Computational and Mathematical Organization Theory 5 167-192
- 1 Introduction
-
- 11 Importance of Change in Longitudinal Social Networks
- 12 Application
-
- 2 Using the Over Time Viewer
-
- 21 STEP 1 Launching the Over Time Viewer
- 22 STEP 2 Over Time Dependence
- 23 STEP 3 Network Change Detection
-
- 3 Future Work
- 4 References
-

4
(2001 2007) have used dependence graphs to account for dependence in over-time network evolution We can clearly see that the development of longitudinal network analysis methods is a well established problem in the field of social networks Table 1 provides a comparison of the dominant methods for longitudinal network analysis
The literature shows that there exist four network dynamic states in longitudinal
social networks A network can exhibit stability This occurs when the underlying relationships in a group remain the same over time Observations of the network can vary between time periods due to observation error survey error or normal fluctuations in communication A network can evolve This occurs when interactions between agents in the network cause the relationships to change over time A network can experience shock This type of change is exogenous to the social group Finally a network can experience a mutation This occurs when an exogenous change initiates evolutionary behavior
Much of the research in longitudinal social networks has focused on evolutionary
change Markov methods and multi-agent simulation are effective at helping social scientists understand evolutionary change However a careful review of the literature did not reveal any research in detecting shock or mutations in the network
SNCD provides a statistical approach for detecting changes in a network over
time In addition to change detection change point identification is also possible Identifying changes and change points in empirical data will allow social scientists to better isolate factors affecting network evolution as well as the relatively new concept of shock Moreover knowing when a network change occurs provides an analyst insight in how to bifurcate longitudinal network data for analysis
A complete review of methods for longitudinal social network analysis is beyond
the scope of this thesis The reader is referred to Wasserman and Faust (1994) Dorien and Stokman (1997) and Carrington Scott and Wasserman (2007) Essentially methods for longitudinal social network analysis have been focused on modeling and testing for the significance of social theories in empirical data These methods have not been designed to detect change over time This thesis is focused on detecting change in a social network over time
5
Markov Chain Multi-Agent Statistical SNCD Problem Addressed
1 Network evolution based on Markovian assumptions 2 Determine how underlying social theories affect group dynamics
1 Network evolution based on node-level behavior 2 Evaluate the impact of social intervention on group dynamics
1 Compare the properties of networks at different points in time
1 Detect change (shock evolution or mutation) over time in empirical networks
Key Assumptions
1 Future behavior of network is independent of the past 2 There is no exogenous change in the network
1 Node level behavior can drive group behavior 2 Underlying social theories affecting group dynamics are known
Assumptions vary but include such things as dyadic independence dependence over-time independence one node class
Group behavior can be inferred from longitudinal social networks
Limitations for change detection
1 Does not account for exogenous change 2 Markov assumption
1 Used to model both exogenous and evolutionary change but not to detect change 2 Underlying social theories must be known
1 Does not handle over-time dependence 2 Not a longitudinal approach
1 Ergodicity and dependence is not fully addressed
Strengths Determining significant social theories affecting group dynamics
Simulating group dynamics in a social network
Comparing social networks
Detecting changes in empirical social networks over time
12 Applicat ion
This thesis will provide insight into the stochastic behavior of social networks In addition algorithms will be proposed that detect subtle changes in a social network Imagine Joe Analyst working in an intelligence center trying to understand the dynamics of global terrorism He currently has wide array of tools to assist him He can piece together social networks from news papers and broadcasts intercepted voice communication and intelligence gathered from field agents He can model this
6
information with social networks and use various measures to identify individuals who are well connected influential or connect otherwise disconnect terrorist cells In other words he can tell you who was likely responsible for an attack in the past and who was influential in the organization But what about today Have influential members become less important Are other members of the organization assuming more influential positions in the social network Can we detect a change in the social network of a terrorist organization as they increase their communication before they are able to execute their planned terrorist attack These are the questions that this research will help answer
Applications are not limited to the military Consider a civilian company whose
managers can identify major leadership challenges before they affect the productivity of the company The introduction of e-mail and cell phones into the workplace has significantly changes the dynamics of communication In the past workers had limited peers available that they could ask about problems before they had to seek guidance from senior management Today the available peers to consult are limited only by a personrsquos social network With growing on-line communities of practice this network is becoming larger and larger While this is good that workers are able to resolve problems at a lower level senior managers are unable to influence decisions with their senior judgment and experience This research will provide those managers with a tool to detect potential problems in their organization by detecting subtle changes in the social network of employees
7
2 Using the Over Time Viewer This section provides step-by-step instructions on how to use the Over Time Viewer
in ORA to conduct longitudinal network analysis This procedure is illustrated with a longitudinal network data set constructed from email activity The data set is part of McCullohrsquos IkeNet 3 (McCulloh 2009) The IkeNet data set consists of longitudinal network data constructed from email traffic on a group of officers and cadets at the US Military Academy The participants agreed to allow the researchers to monitor their email activity in exchange for the use of a blackberry Daily networks were created where the nodes were the participants and their email messages There were directed links from a node sending an email to the email message that they sent and from the email message to the recipients of the message creating a bipartite network For this report we conducted a relational algebra in ORA to multiply the (agent x email) network by the (email x agent) network to create a social network where individuals were related with a weight corresponding to the number of email messages sent between individuals
21 STEP 1 Launching the Over Time Viewer
To analyze networks over time several features have been created in ORA Before attempting to use the Over Time Viewer the analyst must first load the meta-networks corresponding to different time periods into ORA The meta-networks can be time stamped in ORA otherwise they must be loaded in the order of the correct time sequencing Once the networks are loaded into ORA the longitudinal analysis features can be found in the Over-Time Viewer which can be accessed from the pull down menu
A pop-up window will appear asking the user how to conform the networks When you have multiple networks over time some nodes may appear in certain time periods and be absent from others The user must therefore decide whether to
a) include nodes as isolates in time periods where they are not observed (union)
b) exclude nodes that are not in all time periods (intersection) c) calculate graph level measures on the networks as they are (do nothing)
8
ORA will spend a bit of time calculating measures and then the following screen will appear
The data used in this example comes from IkeNet 3 The networks analyzed are daily snapshots of the network
In the upper left the user can make some choices about the aggregation level In other words if you have daily networks do you want to aggregate over 7 time periods to have weekly networks Or perhaps you would prefer every 3 days
Below this are some options to restrict the time periods that the analyst wants to
look at This is particularly useful when there are many more than about 30 time periods This can also be used even if the dates are not recorded for the networks If no dates are recorded integer time periods are assigned to the networks beginning with time 1 An example of networks with no dates recorded is shown in the screen capture above
In the upper right of the Over Time Viewer the analyst will choose the particular measures that they want to analyze So far we have only explored network level measures Theoretically there is no reason why this will not work for any node level or meta network measure Therefore this capability is included in ORA We provide this disclaimer that analysis of agent level measures has not been proven as of the date of this publication
9
22 STEP 2 Over Time Dependence
One major obstacle to the study of network dynamics is periodicity or over-time dependence in longitudinal network data For example if we define a social network link as an agent sending an email to another we have continuous time stamped data Intuitively we can imagine that individuals are more likely to email each other at certain times of the day days of the week etc If the individuals in the network are students then their email traffic might follow the schoolrsquos academic calendar Seasonal trends in data are common in a variety of other applications as well When these periodic changes occur in the relationships that define social network links social network change detection methods are more likely to signal a false positive A false positive occurs when the social network change detection method indicates that a change in the network may have occurred when in fact there has been no change To illustrate assume that we are monitoring the density of the network for change in hourly intervals The density of the network measured for the interval between 3 AM and 4 AM might be significantly less than the network measured from 3 PM to 4 PM because most of the people in the network are asleep and not communicating between 3 AM and 4 AM This behavior is to be expected however and it is not desireable for the change detection algorithm to signal a potential change at this point Rather it would be ideal to control for this phenomenon by accounting for the time periodicity in the density measure Only then can real change be identified quickly in a background of noise
Periodicity can occur in many kinds of longitudinal data Organizations may
experience periodicity as a result of scheduled events such as a weekly meeting or monthly social event Social networks collected on college students are likely to have periodicity driven by both the semester schedule and academic year Even the weather may introduce periodicity in social network data as people are more or less likely to email or interact face-to-face At the US Military Academy people tend to run outside in warm weather in small groups of two or three During the winter people go to the gym where they are likely to see many people This causes an increase in face-to-face interaction as people stay inside In a similar fashion during the Spring and Fall many people participate in inter-unit sporting events such as soccer or Frisbee football This can also affect peoplersquo face-to-face interaction and thus the social network data collected on them
Spectral analysis provides a framework to understand periodicity Spectral
analysis is mathematical tool used to analyze functions or signals in the frequency domain as opposed to the time domain If we look at some measure of a social group over time we are conducting analysis in the time domain The frequency domain allows us to investigate how much of the given measure lies within each frequency band over a range of frequencies For example Figure 11 shows a notional measure on some made-up group in the time domain It can be seen that the measure is larger at points B and D corresponding to the middle of the week The measure is smaller at points A C and E
10
Figure 2 Notional Measure in Time Domain
If the signal in Figure 11 is converted to the frequency domain as shown in Figure
12 we can see how much of the measure lies within certain frequency bands The negative spike in Figure 12 corresponds to 7 days which is the weekly periodicity in the notional signal The actual frequency signal only runs to a value of 8 on the x-axis in Figure 12 The frequency domain signal after a value of 8 is a mirror image or harmonic of the actual frequency signal
Figure 3 Notional Measure in Frequency Domain
The frequency domain representation of a signal also includes the phase shift that
must be applied to a summation of sine functions to reconstruct the original over-time signal In other words we can combine daily weekly monthly semester and annual periodicity to recover the expected signal over-time due to periodicity For example Figures 13-15 represent monthly weekly and sub-weekly periodicities If these signals are added together meaning that the observed social network exhibits all three of these periodic behaviors the resulting signal is shown in Figure 16
2 4 6 8 10 12 14
5
10
15
20
2 4 6 8 10 12 14
15
10
5
5
10
15
A
B
C E
D
11
Figure 4 Monthly Period Figure 5 Weekly Period Figure 6 Sub-weekly Period
Figure 7 Sum of the Signal in Figures 13-15
If the periodicity in the signal shown in Figure 16 is not accounted for it appears that there may be a change in behavior around time period 20 where the signal is negatively spiked In reality this behavior is caused by periodicity If we transform the signal to the frequency domain as shown in Figure 17 we can see the weekly periodicity at point B and the sub-weekly periodicity at point A
Figure 8 Transformation of Figure 16 to the Frequency Domain
5 10 15 20 25 30
4
2
2
4
5 10 15 20 25 30
4
2
2
4
5 10 15 20 25 30
4
2
2
4
5 10 15 20 25 30
10
5
5
10
5 10 15 20 25 30
10
5
5
10
A
B
12
I propose that spectral analysis applied to social network measures over time will identify periodicity in the network I will transform an over time network measure from the time domain to the frequency domain using a Fourier transform I will then identify significant periodicity in the over-time network and present two methods for handling the periodicity The over time dependence analysis is accessed by selecting the Fast Fourier Transform tab in the Over Time Viewer as shown below This displays the frequency plot of the data
The analyst can use the Over Time Viewer to help determine which frequencies are significant Selecting Dominant Frequencies on the radio button to the lower left displays only the statistically significant frequencies The Fourier Transform uses the normal distribution in order to transform data from the time domain to the frequency domain Therefore the normal distribution is an appropriate distribution to fit to the frequencies plotted in the frequency plot All frequencies that are within two standard deviations of the mean are then set equal to zero for the dominant frequency plot revealing only the dominant frequencies A dominant frequency is a potential source of periodicity as opposed to random noise in the over time signal
13
The analyst will often want to transform the statistically significant frequencies from the frequency domain back into the time domain so that heshe can make better sense of them To do this the analyst must select the radio button on the lower left called Period Plot
The period plot shows the analyst the expected periodicity in the over-time data In the example you can see weekly periodicity The peaks and valleys in the period plot occur approximately every 7 days At this point the analyst may wish to merge the daily data into weekly networks This would average out the effects of weekends and evenings that are likely to affect the properties of daily networks Another approach is to simply look at the networks departure from what is expected
14
The Filtered Plot radio button will create an over-time plot of how the measure deviates from what is expected based on the periodicity of the measure You can also plot the filtered measure with the original measure to see the difference as shown below
15
23 STEP 3 Network Change Detect ion
The user may also wish to detect statistically significant change in the network over time The user can select the Change Detection tab shown in the screen capture below There are three different control chart procedures that can be applied to the signal We are applying the Cumulative Sum or CUSUM in this example The user must enter the number of ldquoIn-controlrdquo networks This is the number of networks that you must assume to be typical The procedure actually detects networks that are significantly different from the networks that are ldquoin the first however many networks are selected as in-controlrdquo For the CUSUM the analyst can select a standardized magnitude of change to optimize the procedure for A novice user should just use the default value of 1 Finally the user must determine the procedurersquos sensitivity to false alarms The user can select a decision interval or specify the false positive risk or specify the expected number of observations until a false positive is reached For this example we use a false positive risk of 001 which corresponds to a decision interval of 35 and 100 expected observations until a false positive
The maroon horizontal line is the decision interval of the change detection procedure When a plot of the CUSUM crosses the decision interval the analyst may conclude that a change in network behavior may have occurred The red line in the plot is the CUSUM statistic for detecting a decrease in the Betweenness Network Centralization The blue line in the plot is the CUSUM statistic for detecting an increase in the Betweenness Network Centralization The example above indicates that there may have been a statistically significant change in the network over time We detect a change in the network on 18 September 2008 (time period 18) when the blue line crosses the
16
decision interval This signals an increase in the Betweenness Network Centralization The most likely time the change actually occurred was the last time the statistic was 0 which was 14 September 2008
The cadet regimental chain of command assumed duties on 18 August Part of
the IkeNet3 experiment was to introduce blackberries to the chain of command and observe the impact The blackberries were scheduled to be issued to the cadet chain of command on 18 September They were notified at their weekly meeting on 14 September All of the cadets were not issued their blackberries until 22 September but the first blackberry was issued on 18 September Therefore dynamic network change detection is successful at detecting this significant event in the organizational behavior of one of three subpopulations monitored In other words the behavior only changed for 24 out of 68 individuals in the network This demonstrates the ability of dynamic network change detection to detect small persistent change in network behavior in a background of noise
The Over Time Viewer can be used to investigate multiple different network
measures different risks for false positives and different aggregation levels The analyst must simply make their selections and then hit the ldquoComputerdquo button in the Change Detection tab Different aggregation levels can also be investigated by selecting the aggregation level in the upper right of the interface hitting ldquoRecomputerdquo then hitting the ldquoComputerdquo button in the Change Detection tab
3 Future Work
Additional features in the Over Time Viewer will include additional change detection procedures Currently the software tool contains three procedures the Shewhart (1927) x-bar chart the CUSUM (Page 1951) and the Exponentially Weighted Moving Average (Roberts 1959) While these have been demonstrated to be an effective approach for network change detection (McCulloh 2009) other approaches exist
There are many factors that contribute to an analystrsquos choice of change detection
procedure Additional work is still required on the performance of network change detection to determine which of these factors are appropriate for network applications of statistical process control The Over Time Viewer will continue to incorporate additional change detection procedures to allow users to investigate change detection using the CASOS software suite An early example is the incorporation of agent level measures for change detection Although unproven these features are already present in the Over Time Viewer
Change detection in longitudinal networks is a relatively new field of active and
ongoing research No doubt new approaches and concerns will be raised as scientists explore network change As new methods are developed we intend to incorporate them in future versions of the Over Time Viewer
17
4 References Carley KM (1991) A theory of group stability American Sociology Review
56(3)331ndash354 Carley KM (1995) Communication Technologies and Their Effect on Cultural
Homogeneity Consensus and the Diffusion of New Ideas Sociological Perspectives 38(4) 547-571
Carley KM Diesner J Reminga J Tsvetovat M (2004) Interoperability of Dynamic Network Analysis Software
Carley K M (2007) ORA Organizational Risk Analyzer v178 [Network Analysis Software] Pittsburgh Carnegie Mellon University
Carrington PJ Scott J and Wasserman S (2007) Models and Methods in Social Network Analysis Cambridge University Press
Doreian P (1983) On the evolution of group and network structures II Structures within structure Social Networks 8 33-64
Doreian P and Stokman FN (Eds) (1997) Evolution of Social Networks Amsterdam Gordon and Breach
Feld S (1997) Structural embeddedness and stability of interpersonal relations Social Networks 19 91-95
Frank O (1991) Statistical analysis of change in networks Statistica Neerlandica 45 (1991) 283ndash293
Holland P and Leinhardt S (1977) A dynamic model for social networks Journal of Mathematical Sociology 5 5-20
Holland PW Leinhardt S (1981) An exponential family of probability distributions for directed graphs (with discussion) Journal of the American Statistical Association 76 33ndash65
Huisman M and Snijders TAB (2003) Statistical analysis of longitudinal network data with changing composition Sociological Methods and Research 32 253-287
Johnson JC Boster JS and Palinkas LA (2003) Social roles and the evolution of networks in extreme and isolated environments Journal of Mathematical Sociology 27 89-121
Katz L and Proctor CH (1959) The configuration of interpersonal relations in a group as a time-dependent stochastic process Psychometrika 24 317-327
Krackhardt D (1998) Simmelian ties Super strong and sticky In Power and Influence in Organizations (eds R Kramer M Neale) pp 21-38 Sage Thousand Oaks CA
Leenders R (1995) Models for network dynamics a Markovian framework Journal of Mathematical Sociology 20 1-21
McCulloh I (2009) Detecting Changes in a Dynamic Social Network PhD Thesis Carnegie Mellon University Pittsburgh PA
McCulloh I amp Carley K M (2008) Social Network Change Detection Carnegie Mellon University School of Computer Science Institute for Software Research Technical Report CMU-ISR-08-116
McCulloh I Garcia G Tardieu K MacGibon J Dye H Moores K Graham J M amp Horn D B (2007a) IkeNet Social network analysis of e-mail traffic in the Eisenhower Leadership Development Program (Technical Report No 1218)
18
Arlington VA US Army Research Institute for the Behavioral and Social Sciences
McCulloh I Lospinoso J and Carley KM (2007b) Social Network Probability Mechanics Proceedings of the World Scientific Engineering Academy and Society 12th International Conference on Applied Mathematics Cairo Egypt 29-31 December 2007
McCulloh I Ring B Frantz TL and Carley KM (2008) Unobtrusive Social Network Data from Email In Proceedings of the 26th Army Science Conference Orlando FL US Army
Newcomb TN (1961) The Acquaintance Process Holt Rinehart and Winston New York
Page ES (1961) Cumulative Sum Control Charts Technometrics 3 1-9 Roberts SV (1959) Control chart tests based on geometric moving averages
Technometrics 1 239-250 Robins G and Pattison P (2007) Interdependencies and Social Processes Dependence
Graphs and Generalized Dependence Structures In P Carrington J Scott and S Wasserman Editors Models and Methods in Social Network Analysis Cambridge University Press New York 192-214
Robins G and Pattison P (2001) Random graph models for temporal processes in social networks Journal of Mathematical Sociology 25 5-41
Sampson SF (1969) Crisis in a cloister PhD Thesis Cornell University Ithaca Sanil A Banks D and Carley KM (1995) Models for evolving fixed node networks
Model fitting and model testing Social Networks 17 1995 Shewhart WA (1927) Quality Control Bell Systems Technical Journal Snijders TAB (2007) Models for longitudinal network data In P Carrington J Scott
and S Wasserman Editors Models and Methods in Social Network Analysis Cambridge University Press New York 148ndash161
Snijders TAB (1990) Testing for change in a digraph at two time points Social Networks 12 539-573
Snijders T A B Van Duijn MAJ (1997) Simulation for Statistical Inference in Dynamic Network Models In Simulating Social Phenomena (Ed R Conte R Hegselmann and P Tera) Berlin Springer pp 493-512
Snijders TAB (2001) The statistical evaluation of social network dynamics In Sobel ME and Becker MP (Eds) Sociological Methodology 361-395 Boston Basil Blackwell
Wasserman S (1980) Analyzing social networks as stochastic processes Journal of American Statistical Association 75 280-294
Wasserman S (1977) Stochastic Models for Directed Graphs PhD dissertation Harvard University Department of Statistics Cambridge MA
Wasserman S (1979) A stochastic model for directed graphs with transition rates determined by reciprocity In Sociological Methodology 1980 (Ed Schuessler KF) San Francisco Jossey-Bass 392-412
Wasserman S amp Faust K (1994) Social Network Analysis Methods and Applications New York Cambridge University Press
Wasserman S Iacobucci D (1988) Sequential Social Network Data Psychometrika 53261-82
19
Van de Bunt GG Van Duijin MAJ and Snijders TAB (1999) Friendship networks through time An actor-oriented statistical network model Computational and Mathematical Organization Theory 5 167-192
- 1 Introduction
-
- 11 Importance of Change in Longitudinal Social Networks
- 12 Application
-
- 2 Using the Over Time Viewer
-
- 21 STEP 1 Launching the Over Time Viewer
- 22 STEP 2 Over Time Dependence
- 23 STEP 3 Network Change Detection
-
- 3 Future Work
- 4 References
-

5
Markov Chain Multi-Agent Statistical SNCD Problem Addressed
1 Network evolution based on Markovian assumptions 2 Determine how underlying social theories affect group dynamics
1 Network evolution based on node-level behavior 2 Evaluate the impact of social intervention on group dynamics
1 Compare the properties of networks at different points in time
1 Detect change (shock evolution or mutation) over time in empirical networks
Key Assumptions
1 Future behavior of network is independent of the past 2 There is no exogenous change in the network
1 Node level behavior can drive group behavior 2 Underlying social theories affecting group dynamics are known
Assumptions vary but include such things as dyadic independence dependence over-time independence one node class
Group behavior can be inferred from longitudinal social networks
Limitations for change detection
1 Does not account for exogenous change 2 Markov assumption
1 Used to model both exogenous and evolutionary change but not to detect change 2 Underlying social theories must be known
1 Does not handle over-time dependence 2 Not a longitudinal approach
1 Ergodicity and dependence is not fully addressed
Strengths Determining significant social theories affecting group dynamics
Simulating group dynamics in a social network
Comparing social networks
Detecting changes in empirical social networks over time
12 Applicat ion
This thesis will provide insight into the stochastic behavior of social networks In addition algorithms will be proposed that detect subtle changes in a social network Imagine Joe Analyst working in an intelligence center trying to understand the dynamics of global terrorism He currently has wide array of tools to assist him He can piece together social networks from news papers and broadcasts intercepted voice communication and intelligence gathered from field agents He can model this
6
information with social networks and use various measures to identify individuals who are well connected influential or connect otherwise disconnect terrorist cells In other words he can tell you who was likely responsible for an attack in the past and who was influential in the organization But what about today Have influential members become less important Are other members of the organization assuming more influential positions in the social network Can we detect a change in the social network of a terrorist organization as they increase their communication before they are able to execute their planned terrorist attack These are the questions that this research will help answer
Applications are not limited to the military Consider a civilian company whose
managers can identify major leadership challenges before they affect the productivity of the company The introduction of e-mail and cell phones into the workplace has significantly changes the dynamics of communication In the past workers had limited peers available that they could ask about problems before they had to seek guidance from senior management Today the available peers to consult are limited only by a personrsquos social network With growing on-line communities of practice this network is becoming larger and larger While this is good that workers are able to resolve problems at a lower level senior managers are unable to influence decisions with their senior judgment and experience This research will provide those managers with a tool to detect potential problems in their organization by detecting subtle changes in the social network of employees
7
2 Using the Over Time Viewer This section provides step-by-step instructions on how to use the Over Time Viewer
in ORA to conduct longitudinal network analysis This procedure is illustrated with a longitudinal network data set constructed from email activity The data set is part of McCullohrsquos IkeNet 3 (McCulloh 2009) The IkeNet data set consists of longitudinal network data constructed from email traffic on a group of officers and cadets at the US Military Academy The participants agreed to allow the researchers to monitor their email activity in exchange for the use of a blackberry Daily networks were created where the nodes were the participants and their email messages There were directed links from a node sending an email to the email message that they sent and from the email message to the recipients of the message creating a bipartite network For this report we conducted a relational algebra in ORA to multiply the (agent x email) network by the (email x agent) network to create a social network where individuals were related with a weight corresponding to the number of email messages sent between individuals
21 STEP 1 Launching the Over Time Viewer
To analyze networks over time several features have been created in ORA Before attempting to use the Over Time Viewer the analyst must first load the meta-networks corresponding to different time periods into ORA The meta-networks can be time stamped in ORA otherwise they must be loaded in the order of the correct time sequencing Once the networks are loaded into ORA the longitudinal analysis features can be found in the Over-Time Viewer which can be accessed from the pull down menu
A pop-up window will appear asking the user how to conform the networks When you have multiple networks over time some nodes may appear in certain time periods and be absent from others The user must therefore decide whether to
a) include nodes as isolates in time periods where they are not observed (union)
b) exclude nodes that are not in all time periods (intersection) c) calculate graph level measures on the networks as they are (do nothing)
8
ORA will spend a bit of time calculating measures and then the following screen will appear
The data used in this example comes from IkeNet 3 The networks analyzed are daily snapshots of the network
In the upper left the user can make some choices about the aggregation level In other words if you have daily networks do you want to aggregate over 7 time periods to have weekly networks Or perhaps you would prefer every 3 days
Below this are some options to restrict the time periods that the analyst wants to
look at This is particularly useful when there are many more than about 30 time periods This can also be used even if the dates are not recorded for the networks If no dates are recorded integer time periods are assigned to the networks beginning with time 1 An example of networks with no dates recorded is shown in the screen capture above
In the upper right of the Over Time Viewer the analyst will choose the particular measures that they want to analyze So far we have only explored network level measures Theoretically there is no reason why this will not work for any node level or meta network measure Therefore this capability is included in ORA We provide this disclaimer that analysis of agent level measures has not been proven as of the date of this publication
9
22 STEP 2 Over Time Dependence
One major obstacle to the study of network dynamics is periodicity or over-time dependence in longitudinal network data For example if we define a social network link as an agent sending an email to another we have continuous time stamped data Intuitively we can imagine that individuals are more likely to email each other at certain times of the day days of the week etc If the individuals in the network are students then their email traffic might follow the schoolrsquos academic calendar Seasonal trends in data are common in a variety of other applications as well When these periodic changes occur in the relationships that define social network links social network change detection methods are more likely to signal a false positive A false positive occurs when the social network change detection method indicates that a change in the network may have occurred when in fact there has been no change To illustrate assume that we are monitoring the density of the network for change in hourly intervals The density of the network measured for the interval between 3 AM and 4 AM might be significantly less than the network measured from 3 PM to 4 PM because most of the people in the network are asleep and not communicating between 3 AM and 4 AM This behavior is to be expected however and it is not desireable for the change detection algorithm to signal a potential change at this point Rather it would be ideal to control for this phenomenon by accounting for the time periodicity in the density measure Only then can real change be identified quickly in a background of noise
Periodicity can occur in many kinds of longitudinal data Organizations may
experience periodicity as a result of scheduled events such as a weekly meeting or monthly social event Social networks collected on college students are likely to have periodicity driven by both the semester schedule and academic year Even the weather may introduce periodicity in social network data as people are more or less likely to email or interact face-to-face At the US Military Academy people tend to run outside in warm weather in small groups of two or three During the winter people go to the gym where they are likely to see many people This causes an increase in face-to-face interaction as people stay inside In a similar fashion during the Spring and Fall many people participate in inter-unit sporting events such as soccer or Frisbee football This can also affect peoplersquo face-to-face interaction and thus the social network data collected on them
Spectral analysis provides a framework to understand periodicity Spectral
analysis is mathematical tool used to analyze functions or signals in the frequency domain as opposed to the time domain If we look at some measure of a social group over time we are conducting analysis in the time domain The frequency domain allows us to investigate how much of the given measure lies within each frequency band over a range of frequencies For example Figure 11 shows a notional measure on some made-up group in the time domain It can be seen that the measure is larger at points B and D corresponding to the middle of the week The measure is smaller at points A C and E
10
Figure 2 Notional Measure in Time Domain
If the signal in Figure 11 is converted to the frequency domain as shown in Figure
12 we can see how much of the measure lies within certain frequency bands The negative spike in Figure 12 corresponds to 7 days which is the weekly periodicity in the notional signal The actual frequency signal only runs to a value of 8 on the x-axis in Figure 12 The frequency domain signal after a value of 8 is a mirror image or harmonic of the actual frequency signal
Figure 3 Notional Measure in Frequency Domain
The frequency domain representation of a signal also includes the phase shift that
must be applied to a summation of sine functions to reconstruct the original over-time signal In other words we can combine daily weekly monthly semester and annual periodicity to recover the expected signal over-time due to periodicity For example Figures 13-15 represent monthly weekly and sub-weekly periodicities If these signals are added together meaning that the observed social network exhibits all three of these periodic behaviors the resulting signal is shown in Figure 16
2 4 6 8 10 12 14
5
10
15
20
2 4 6 8 10 12 14
15
10
5
5
10
15
A
B
C E
D
11
Figure 4 Monthly Period Figure 5 Weekly Period Figure 6 Sub-weekly Period
Figure 7 Sum of the Signal in Figures 13-15
If the periodicity in the signal shown in Figure 16 is not accounted for it appears that there may be a change in behavior around time period 20 where the signal is negatively spiked In reality this behavior is caused by periodicity If we transform the signal to the frequency domain as shown in Figure 17 we can see the weekly periodicity at point B and the sub-weekly periodicity at point A
Figure 8 Transformation of Figure 16 to the Frequency Domain
5 10 15 20 25 30
4
2
2
4
5 10 15 20 25 30
4
2
2
4
5 10 15 20 25 30
4
2
2
4
5 10 15 20 25 30
10
5
5
10
5 10 15 20 25 30
10
5
5
10
A
B
12
I propose that spectral analysis applied to social network measures over time will identify periodicity in the network I will transform an over time network measure from the time domain to the frequency domain using a Fourier transform I will then identify significant periodicity in the over-time network and present two methods for handling the periodicity The over time dependence analysis is accessed by selecting the Fast Fourier Transform tab in the Over Time Viewer as shown below This displays the frequency plot of the data
The analyst can use the Over Time Viewer to help determine which frequencies are significant Selecting Dominant Frequencies on the radio button to the lower left displays only the statistically significant frequencies The Fourier Transform uses the normal distribution in order to transform data from the time domain to the frequency domain Therefore the normal distribution is an appropriate distribution to fit to the frequencies plotted in the frequency plot All frequencies that are within two standard deviations of the mean are then set equal to zero for the dominant frequency plot revealing only the dominant frequencies A dominant frequency is a potential source of periodicity as opposed to random noise in the over time signal
13
The analyst will often want to transform the statistically significant frequencies from the frequency domain back into the time domain so that heshe can make better sense of them To do this the analyst must select the radio button on the lower left called Period Plot
The period plot shows the analyst the expected periodicity in the over-time data In the example you can see weekly periodicity The peaks and valleys in the period plot occur approximately every 7 days At this point the analyst may wish to merge the daily data into weekly networks This would average out the effects of weekends and evenings that are likely to affect the properties of daily networks Another approach is to simply look at the networks departure from what is expected
14
The Filtered Plot radio button will create an over-time plot of how the measure deviates from what is expected based on the periodicity of the measure You can also plot the filtered measure with the original measure to see the difference as shown below
15
23 STEP 3 Network Change Detect ion
The user may also wish to detect statistically significant change in the network over time The user can select the Change Detection tab shown in the screen capture below There are three different control chart procedures that can be applied to the signal We are applying the Cumulative Sum or CUSUM in this example The user must enter the number of ldquoIn-controlrdquo networks This is the number of networks that you must assume to be typical The procedure actually detects networks that are significantly different from the networks that are ldquoin the first however many networks are selected as in-controlrdquo For the CUSUM the analyst can select a standardized magnitude of change to optimize the procedure for A novice user should just use the default value of 1 Finally the user must determine the procedurersquos sensitivity to false alarms The user can select a decision interval or specify the false positive risk or specify the expected number of observations until a false positive is reached For this example we use a false positive risk of 001 which corresponds to a decision interval of 35 and 100 expected observations until a false positive
The maroon horizontal line is the decision interval of the change detection procedure When a plot of the CUSUM crosses the decision interval the analyst may conclude that a change in network behavior may have occurred The red line in the plot is the CUSUM statistic for detecting a decrease in the Betweenness Network Centralization The blue line in the plot is the CUSUM statistic for detecting an increase in the Betweenness Network Centralization The example above indicates that there may have been a statistically significant change in the network over time We detect a change in the network on 18 September 2008 (time period 18) when the blue line crosses the
16
decision interval This signals an increase in the Betweenness Network Centralization The most likely time the change actually occurred was the last time the statistic was 0 which was 14 September 2008
The cadet regimental chain of command assumed duties on 18 August Part of
the IkeNet3 experiment was to introduce blackberries to the chain of command and observe the impact The blackberries were scheduled to be issued to the cadet chain of command on 18 September They were notified at their weekly meeting on 14 September All of the cadets were not issued their blackberries until 22 September but the first blackberry was issued on 18 September Therefore dynamic network change detection is successful at detecting this significant event in the organizational behavior of one of three subpopulations monitored In other words the behavior only changed for 24 out of 68 individuals in the network This demonstrates the ability of dynamic network change detection to detect small persistent change in network behavior in a background of noise
The Over Time Viewer can be used to investigate multiple different network
measures different risks for false positives and different aggregation levels The analyst must simply make their selections and then hit the ldquoComputerdquo button in the Change Detection tab Different aggregation levels can also be investigated by selecting the aggregation level in the upper right of the interface hitting ldquoRecomputerdquo then hitting the ldquoComputerdquo button in the Change Detection tab
3 Future Work
Additional features in the Over Time Viewer will include additional change detection procedures Currently the software tool contains three procedures the Shewhart (1927) x-bar chart the CUSUM (Page 1951) and the Exponentially Weighted Moving Average (Roberts 1959) While these have been demonstrated to be an effective approach for network change detection (McCulloh 2009) other approaches exist
There are many factors that contribute to an analystrsquos choice of change detection
procedure Additional work is still required on the performance of network change detection to determine which of these factors are appropriate for network applications of statistical process control The Over Time Viewer will continue to incorporate additional change detection procedures to allow users to investigate change detection using the CASOS software suite An early example is the incorporation of agent level measures for change detection Although unproven these features are already present in the Over Time Viewer
Change detection in longitudinal networks is a relatively new field of active and
ongoing research No doubt new approaches and concerns will be raised as scientists explore network change As new methods are developed we intend to incorporate them in future versions of the Over Time Viewer
17
4 References Carley KM (1991) A theory of group stability American Sociology Review
56(3)331ndash354 Carley KM (1995) Communication Technologies and Their Effect on Cultural
Homogeneity Consensus and the Diffusion of New Ideas Sociological Perspectives 38(4) 547-571
Carley KM Diesner J Reminga J Tsvetovat M (2004) Interoperability of Dynamic Network Analysis Software
Carley K M (2007) ORA Organizational Risk Analyzer v178 [Network Analysis Software] Pittsburgh Carnegie Mellon University
Carrington PJ Scott J and Wasserman S (2007) Models and Methods in Social Network Analysis Cambridge University Press
Doreian P (1983) On the evolution of group and network structures II Structures within structure Social Networks 8 33-64
Doreian P and Stokman FN (Eds) (1997) Evolution of Social Networks Amsterdam Gordon and Breach
Feld S (1997) Structural embeddedness and stability of interpersonal relations Social Networks 19 91-95
Frank O (1991) Statistical analysis of change in networks Statistica Neerlandica 45 (1991) 283ndash293
Holland P and Leinhardt S (1977) A dynamic model for social networks Journal of Mathematical Sociology 5 5-20
Holland PW Leinhardt S (1981) An exponential family of probability distributions for directed graphs (with discussion) Journal of the American Statistical Association 76 33ndash65
Huisman M and Snijders TAB (2003) Statistical analysis of longitudinal network data with changing composition Sociological Methods and Research 32 253-287
Johnson JC Boster JS and Palinkas LA (2003) Social roles and the evolution of networks in extreme and isolated environments Journal of Mathematical Sociology 27 89-121
Katz L and Proctor CH (1959) The configuration of interpersonal relations in a group as a time-dependent stochastic process Psychometrika 24 317-327
Krackhardt D (1998) Simmelian ties Super strong and sticky In Power and Influence in Organizations (eds R Kramer M Neale) pp 21-38 Sage Thousand Oaks CA
Leenders R (1995) Models for network dynamics a Markovian framework Journal of Mathematical Sociology 20 1-21
McCulloh I (2009) Detecting Changes in a Dynamic Social Network PhD Thesis Carnegie Mellon University Pittsburgh PA
McCulloh I amp Carley K M (2008) Social Network Change Detection Carnegie Mellon University School of Computer Science Institute for Software Research Technical Report CMU-ISR-08-116
McCulloh I Garcia G Tardieu K MacGibon J Dye H Moores K Graham J M amp Horn D B (2007a) IkeNet Social network analysis of e-mail traffic in the Eisenhower Leadership Development Program (Technical Report No 1218)
18
Arlington VA US Army Research Institute for the Behavioral and Social Sciences
McCulloh I Lospinoso J and Carley KM (2007b) Social Network Probability Mechanics Proceedings of the World Scientific Engineering Academy and Society 12th International Conference on Applied Mathematics Cairo Egypt 29-31 December 2007
McCulloh I Ring B Frantz TL and Carley KM (2008) Unobtrusive Social Network Data from Email In Proceedings of the 26th Army Science Conference Orlando FL US Army
Newcomb TN (1961) The Acquaintance Process Holt Rinehart and Winston New York
Page ES (1961) Cumulative Sum Control Charts Technometrics 3 1-9 Roberts SV (1959) Control chart tests based on geometric moving averages
Technometrics 1 239-250 Robins G and Pattison P (2007) Interdependencies and Social Processes Dependence
Graphs and Generalized Dependence Structures In P Carrington J Scott and S Wasserman Editors Models and Methods in Social Network Analysis Cambridge University Press New York 192-214
Robins G and Pattison P (2001) Random graph models for temporal processes in social networks Journal of Mathematical Sociology 25 5-41
Sampson SF (1969) Crisis in a cloister PhD Thesis Cornell University Ithaca Sanil A Banks D and Carley KM (1995) Models for evolving fixed node networks
Model fitting and model testing Social Networks 17 1995 Shewhart WA (1927) Quality Control Bell Systems Technical Journal Snijders TAB (2007) Models for longitudinal network data In P Carrington J Scott
and S Wasserman Editors Models and Methods in Social Network Analysis Cambridge University Press New York 148ndash161
Snijders TAB (1990) Testing for change in a digraph at two time points Social Networks 12 539-573
Snijders T A B Van Duijn MAJ (1997) Simulation for Statistical Inference in Dynamic Network Models In Simulating Social Phenomena (Ed R Conte R Hegselmann and P Tera) Berlin Springer pp 493-512
Snijders TAB (2001) The statistical evaluation of social network dynamics In Sobel ME and Becker MP (Eds) Sociological Methodology 361-395 Boston Basil Blackwell
Wasserman S (1980) Analyzing social networks as stochastic processes Journal of American Statistical Association 75 280-294
Wasserman S (1977) Stochastic Models for Directed Graphs PhD dissertation Harvard University Department of Statistics Cambridge MA
Wasserman S (1979) A stochastic model for directed graphs with transition rates determined by reciprocity In Sociological Methodology 1980 (Ed Schuessler KF) San Francisco Jossey-Bass 392-412
Wasserman S amp Faust K (1994) Social Network Analysis Methods and Applications New York Cambridge University Press
Wasserman S Iacobucci D (1988) Sequential Social Network Data Psychometrika 53261-82
19
Van de Bunt GG Van Duijin MAJ and Snijders TAB (1999) Friendship networks through time An actor-oriented statistical network model Computational and Mathematical Organization Theory 5 167-192
- 1 Introduction
-
- 11 Importance of Change in Longitudinal Social Networks
- 12 Application
-
- 2 Using the Over Time Viewer
-
- 21 STEP 1 Launching the Over Time Viewer
- 22 STEP 2 Over Time Dependence
- 23 STEP 3 Network Change Detection
-
- 3 Future Work
- 4 References
-

10
Figure 2 Notional Measure in Time Domain
If the signal in Figure 11 is converted to the frequency domain as shown in Figure
12 we can see how much of the measure lies within certain frequency bands The negative spike in Figure 12 corresponds to 7 days which is the weekly periodicity in the notional signal The actual frequency signal only runs to a value of 8 on the x-axis in Figure 12 The frequency domain signal after a value of 8 is a mirror image or harmonic of the actual frequency signal
Figure 3 Notional Measure in Frequency Domain
The frequency domain representation of a signal also includes the phase shift that
must be applied to a summation of sine functions to reconstruct the original over-time signal In other words we can combine daily weekly monthly semester and annual periodicity to recover the expected signal over-time due to periodicity For example Figures 13-15 represent monthly weekly and sub-weekly periodicities If these signals are added together meaning that the observed social network exhibits all three of these periodic behaviors the resulting signal is shown in Figure 16
2 4 6 8 10 12 14
5
10
15
20
2 4 6 8 10 12 14
15
10
5
5
10
15
A
B
C E
D
11
Figure 4 Monthly Period Figure 5 Weekly Period Figure 6 Sub-weekly Period
Figure 7 Sum of the Signal in Figures 13-15
If the periodicity in the signal shown in Figure 16 is not accounted for it appears that there may be a change in behavior around time period 20 where the signal is negatively spiked In reality this behavior is caused by periodicity If we transform the signal to the frequency domain as shown in Figure 17 we can see the weekly periodicity at point B and the sub-weekly periodicity at point A
Figure 8 Transformation of Figure 16 to the Frequency Domain
5 10 15 20 25 30
4
2
2
4
5 10 15 20 25 30
4
2
2
4
5 10 15 20 25 30
4
2
2
4
5 10 15 20 25 30
10
5
5
10
5 10 15 20 25 30
10
5
5
10
A
B
12
I propose that spectral analysis applied to social network measures over time will identify periodicity in the network I will transform an over time network measure from the time domain to the frequency domain using a Fourier transform I will then identify significant periodicity in the over-time network and present two methods for handling the periodicity The over time dependence analysis is accessed by selecting the Fast Fourier Transform tab in the Over Time Viewer as shown below This displays the frequency plot of the data
The analyst can use the Over Time Viewer to help determine which frequencies are significant Selecting Dominant Frequencies on the radio button to the lower left displays only the statistically significant frequencies The Fourier Transform uses the normal distribution in order to transform data from the time domain to the frequency domain Therefore the normal distribution is an appropriate distribution to fit to the frequencies plotted in the frequency plot All frequencies that are within two standard deviations of the mean are then set equal to zero for the dominant frequency plot revealing only the dominant frequencies A dominant frequency is a potential source of periodicity as opposed to random noise in the over time signal
13
The analyst will often want to transform the statistically significant frequencies from the frequency domain back into the time domain so that heshe can make better sense of them To do this the analyst must select the radio button on the lower left called Period Plot
The period plot shows the analyst the expected periodicity in the over-time data In the example you can see weekly periodicity The peaks and valleys in the period plot occur approximately every 7 days At this point the analyst may wish to merge the daily data into weekly networks This would average out the effects of weekends and evenings that are likely to affect the properties of daily networks Another approach is to simply look at the networks departure from what is expected
14
The Filtered Plot radio button will create an over-time plot of how the measure deviates from what is expected based on the periodicity of the measure You can also plot the filtered measure with the original measure to see the difference as shown below
15
23 STEP 3 Network Change Detect ion
The user may also wish to detect statistically significant change in the network over time The user can select the Change Detection tab shown in the screen capture below There are three different control chart procedures that can be applied to the signal We are applying the Cumulative Sum or CUSUM in this example The user must enter the number of ldquoIn-controlrdquo networks This is the number of networks that you must assume to be typical The procedure actually detects networks that are significantly different from the networks that are ldquoin the first however many networks are selected as in-controlrdquo For the CUSUM the analyst can select a standardized magnitude of change to optimize the procedure for A novice user should just use the default value of 1 Finally the user must determine the procedurersquos sensitivity to false alarms The user can select a decision interval or specify the false positive risk or specify the expected number of observations until a false positive is reached For this example we use a false positive risk of 001 which corresponds to a decision interval of 35 and 100 expected observations until a false positive
The maroon horizontal line is the decision interval of the change detection procedure When a plot of the CUSUM crosses the decision interval the analyst may conclude that a change in network behavior may have occurred The red line in the plot is the CUSUM statistic for detecting a decrease in the Betweenness Network Centralization The blue line in the plot is the CUSUM statistic for detecting an increase in the Betweenness Network Centralization The example above indicates that there may have been a statistically significant change in the network over time We detect a change in the network on 18 September 2008 (time period 18) when the blue line crosses the
16
decision interval This signals an increase in the Betweenness Network Centralization The most likely time the change actually occurred was the last time the statistic was 0 which was 14 September 2008
The cadet regimental chain of command assumed duties on 18 August Part of
the IkeNet3 experiment was to introduce blackberries to the chain of command and observe the impact The blackberries were scheduled to be issued to the cadet chain of command on 18 September They were notified at their weekly meeting on 14 September All of the cadets were not issued their blackberries until 22 September but the first blackberry was issued on 18 September Therefore dynamic network change detection is successful at detecting this significant event in the organizational behavior of one of three subpopulations monitored In other words the behavior only changed for 24 out of 68 individuals in the network This demonstrates the ability of dynamic network change detection to detect small persistent change in network behavior in a background of noise
The Over Time Viewer can be used to investigate multiple different network
measures different risks for false positives and different aggregation levels The analyst must simply make their selections and then hit the ldquoComputerdquo button in the Change Detection tab Different aggregation levels can also be investigated by selecting the aggregation level in the upper right of the interface hitting ldquoRecomputerdquo then hitting the ldquoComputerdquo button in the Change Detection tab
3 Future Work
Additional features in the Over Time Viewer will include additional change detection procedures Currently the software tool contains three procedures the Shewhart (1927) x-bar chart the CUSUM (Page 1951) and the Exponentially Weighted Moving Average (Roberts 1959) While these have been demonstrated to be an effective approach for network change detection (McCulloh 2009) other approaches exist
There are many factors that contribute to an analystrsquos choice of change detection
procedure Additional work is still required on the performance of network change detection to determine which of these factors are appropriate for network applications of statistical process control The Over Time Viewer will continue to incorporate additional change detection procedures to allow users to investigate change detection using the CASOS software suite An early example is the incorporation of agent level measures for change detection Although unproven these features are already present in the Over Time Viewer
Change detection in longitudinal networks is a relatively new field of active and
ongoing research No doubt new approaches and concerns will be raised as scientists explore network change As new methods are developed we intend to incorporate them in future versions of the Over Time Viewer
17
4 References Carley KM (1991) A theory of group stability American Sociology Review
56(3)331ndash354 Carley KM (1995) Communication Technologies and Their Effect on Cultural
Homogeneity Consensus and the Diffusion of New Ideas Sociological Perspectives 38(4) 547-571
Carley KM Diesner J Reminga J Tsvetovat M (2004) Interoperability of Dynamic Network Analysis Software
Carley K M (2007) ORA Organizational Risk Analyzer v178 [Network Analysis Software] Pittsburgh Carnegie Mellon University
Carrington PJ Scott J and Wasserman S (2007) Models and Methods in Social Network Analysis Cambridge University Press
Doreian P (1983) On the evolution of group and network structures II Structures within structure Social Networks 8 33-64
Doreian P and Stokman FN (Eds) (1997) Evolution of Social Networks Amsterdam Gordon and Breach
Feld S (1997) Structural embeddedness and stability of interpersonal relations Social Networks 19 91-95
Frank O (1991) Statistical analysis of change in networks Statistica Neerlandica 45 (1991) 283ndash293
Holland P and Leinhardt S (1977) A dynamic model for social networks Journal of Mathematical Sociology 5 5-20
Holland PW Leinhardt S (1981) An exponential family of probability distributions for directed graphs (with discussion) Journal of the American Statistical Association 76 33ndash65
Huisman M and Snijders TAB (2003) Statistical analysis of longitudinal network data with changing composition Sociological Methods and Research 32 253-287
Johnson JC Boster JS and Palinkas LA (2003) Social roles and the evolution of networks in extreme and isolated environments Journal of Mathematical Sociology 27 89-121
Katz L and Proctor CH (1959) The configuration of interpersonal relations in a group as a time-dependent stochastic process Psychometrika 24 317-327
Krackhardt D (1998) Simmelian ties Super strong and sticky In Power and Influence in Organizations (eds R Kramer M Neale) pp 21-38 Sage Thousand Oaks CA
Leenders R (1995) Models for network dynamics a Markovian framework Journal of Mathematical Sociology 20 1-21
McCulloh I (2009) Detecting Changes in a Dynamic Social Network PhD Thesis Carnegie Mellon University Pittsburgh PA
McCulloh I amp Carley K M (2008) Social Network Change Detection Carnegie Mellon University School of Computer Science Institute for Software Research Technical Report CMU-ISR-08-116
McCulloh I Garcia G Tardieu K MacGibon J Dye H Moores K Graham J M amp Horn D B (2007a) IkeNet Social network analysis of e-mail traffic in the Eisenhower Leadership Development Program (Technical Report No 1218)
18
Arlington VA US Army Research Institute for the Behavioral and Social Sciences
McCulloh I Lospinoso J and Carley KM (2007b) Social Network Probability Mechanics Proceedings of the World Scientific Engineering Academy and Society 12th International Conference on Applied Mathematics Cairo Egypt 29-31 December 2007
McCulloh I Ring B Frantz TL and Carley KM (2008) Unobtrusive Social Network Data from Email In Proceedings of the 26th Army Science Conference Orlando FL US Army
Newcomb TN (1961) The Acquaintance Process Holt Rinehart and Winston New York
Page ES (1961) Cumulative Sum Control Charts Technometrics 3 1-9 Roberts SV (1959) Control chart tests based on geometric moving averages
Technometrics 1 239-250 Robins G and Pattison P (2007) Interdependencies and Social Processes Dependence
Graphs and Generalized Dependence Structures In P Carrington J Scott and S Wasserman Editors Models and Methods in Social Network Analysis Cambridge University Press New York 192-214
Robins G and Pattison P (2001) Random graph models for temporal processes in social networks Journal of Mathematical Sociology 25 5-41
Sampson SF (1969) Crisis in a cloister PhD Thesis Cornell University Ithaca Sanil A Banks D and Carley KM (1995) Models for evolving fixed node networks
Model fitting and model testing Social Networks 17 1995 Shewhart WA (1927) Quality Control Bell Systems Technical Journal Snijders TAB (2007) Models for longitudinal network data In P Carrington J Scott
and S Wasserman Editors Models and Methods in Social Network Analysis Cambridge University Press New York 148ndash161
Snijders TAB (1990) Testing for change in a digraph at two time points Social Networks 12 539-573
Snijders T A B Van Duijn MAJ (1997) Simulation for Statistical Inference in Dynamic Network Models In Simulating Social Phenomena (Ed R Conte R Hegselmann and P Tera) Berlin Springer pp 493-512
Snijders TAB (2001) The statistical evaluation of social network dynamics In Sobel ME and Becker MP (Eds) Sociological Methodology 361-395 Boston Basil Blackwell
Wasserman S (1980) Analyzing social networks as stochastic processes Journal of American Statistical Association 75 280-294
Wasserman S (1977) Stochastic Models for Directed Graphs PhD dissertation Harvard University Department of Statistics Cambridge MA
Wasserman S (1979) A stochastic model for directed graphs with transition rates determined by reciprocity In Sociological Methodology 1980 (Ed Schuessler KF) San Francisco Jossey-Bass 392-412
Wasserman S amp Faust K (1994) Social Network Analysis Methods and Applications New York Cambridge University Press
Wasserman S Iacobucci D (1988) Sequential Social Network Data Psychometrika 53261-82
19
Van de Bunt GG Van Duijin MAJ and Snijders TAB (1999) Friendship networks through time An actor-oriented statistical network model Computational and Mathematical Organization Theory 5 167-192
- 1 Introduction
-
- 11 Importance of Change in Longitudinal Social Networks
- 12 Application
-
- 2 Using the Over Time Viewer
-
- 21 STEP 1 Launching the Over Time Viewer
- 22 STEP 2 Over Time Dependence
- 23 STEP 3 Network Change Detection
-
- 3 Future Work
- 4 References
-
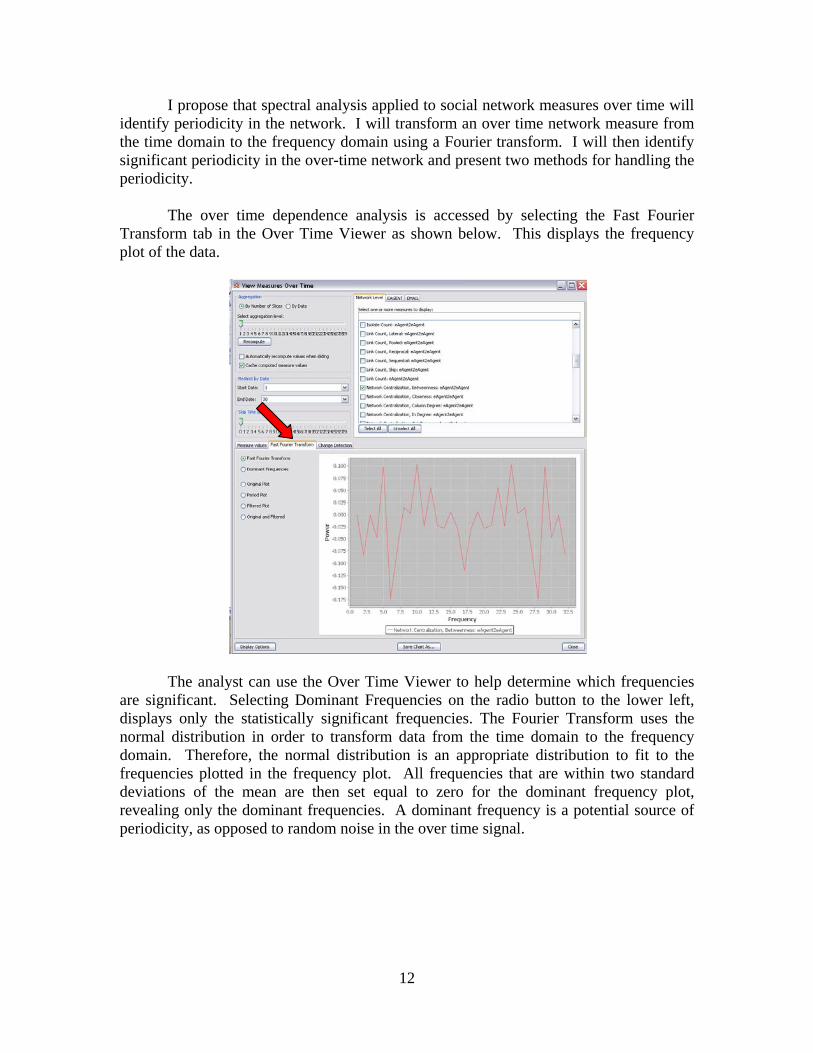
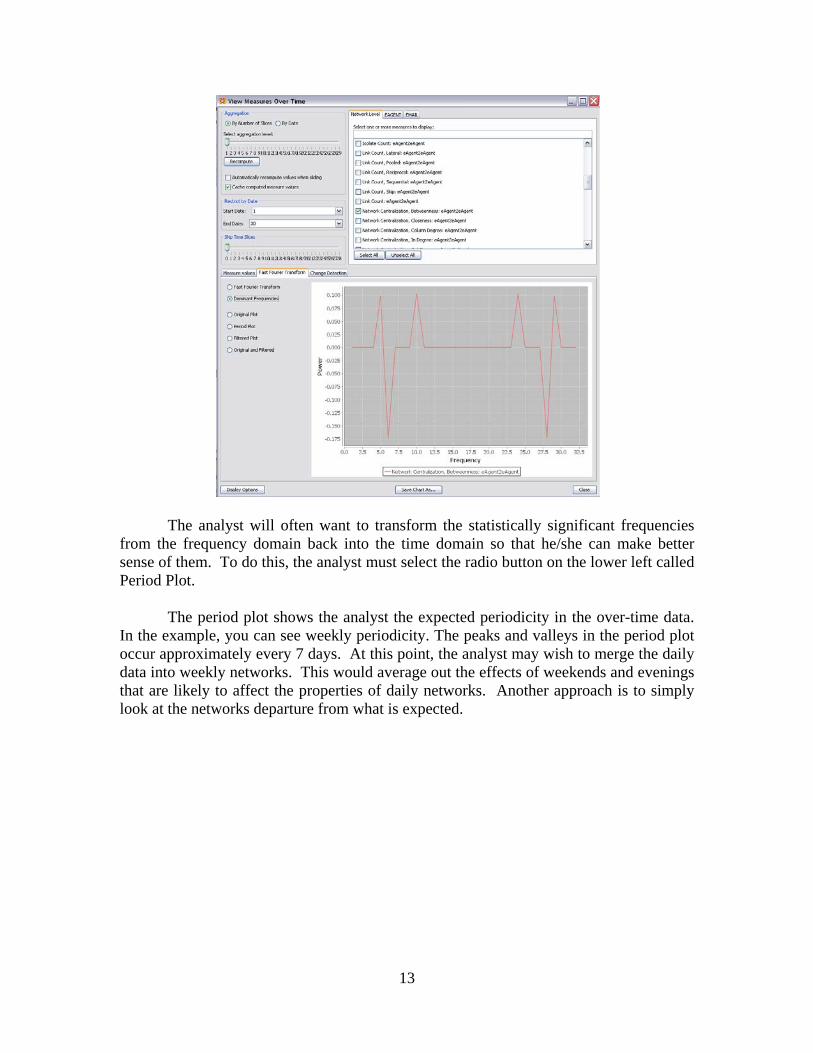
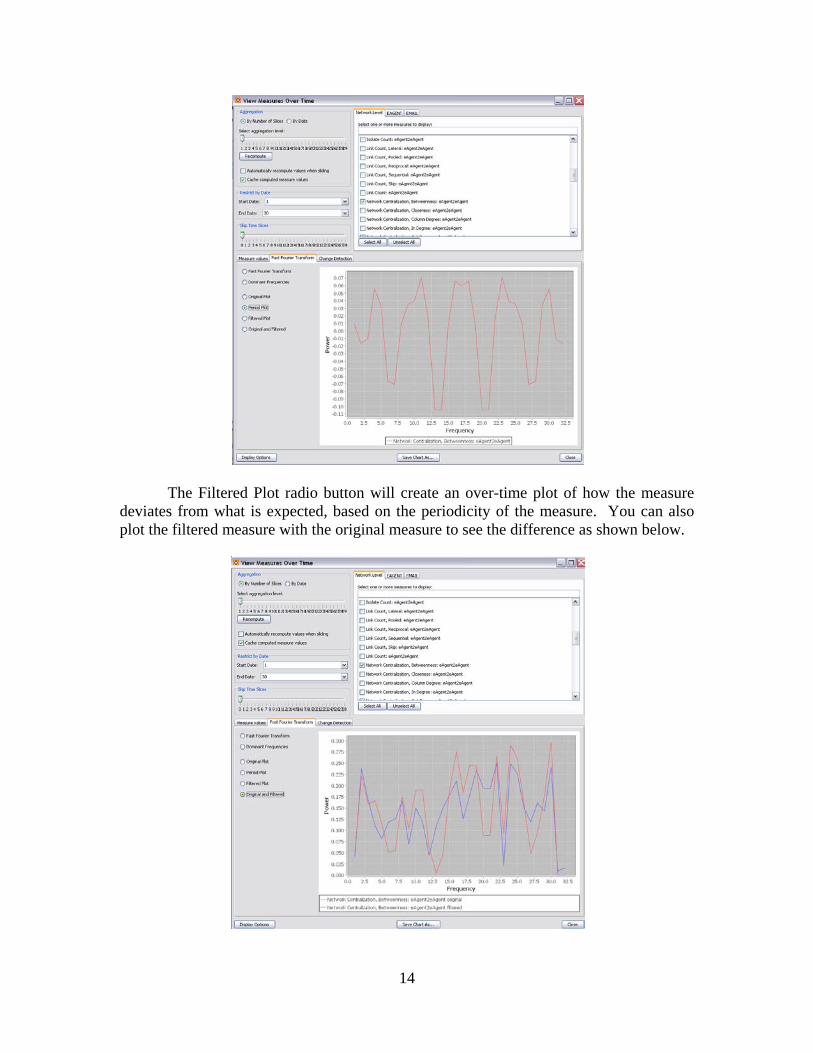