Long-Term Field Monitoring of an EIFS Clad Wall · Long-Term Field Monitoring of an EIFS Clad Wall1...
16
Long-Term Field Monitoring of an EIFS Clad Wall 1 M. Nady A. Saïd, William C. Brown, and Iain S. Walker 2 Institute for Research in Construction National Research Council Canada ABSTRACT A popular retrofit option is to install an exterior insulation finish system to the walls of existing buildings. This study evaluates the thermal and moisture performance of such a system with a vented wall assembly. In addition to being a case study, this field monitoring was intended to verify computation methods of building envelope performance. The long term monitoring was designed to be non-destructive so that the building envelope performance is not affected by the measurements that are made, and to allow easy removal of sensors for recalibration and retrieval at the end of the test period. The field monitoring is planned for two years to capture a wide range of environmental conditions. This paper discusses the instrumentation used in the study and presents interim results of the thermal resistance of the wall and surface moisture. RÉSUMÉ Une solution de rénovation souvent utilisée consiste à installer un parement extérieur isolant sur les murs de bâtiments existants. L’étude décrite évalue la performance hygrothermique de ces parements combinée à un mur à cavité ventilée. En plus de permettre une étude de cas, la surveillance in situ effectuée vise à vérifier certaines méthodes informatiques d’évaluation de la performance de l’enveloppe des bâtiments. La surveillance à long terme devait être non destructive pour éviter de nuire à la performance de l’enveloppe et pour faciliter l’enlèvement des capteurs afin de les réétalonner ou de les retirer définitivement à la fin de la période d’essai. La surveillance in situ s’étalera sur deux ans pour permettre la saisie d’un vaste éventail de conditions environnementales. Ce document traite des instruments utilisés pour l’étude et présente des résultats provisoires sur la résistance thermique du mur et sur l’humidité des surfaces. INTRODUCTION This paper concentrates on the evaluation of an upgraded vented wall assembly with an exterior insulation finish system (EIFS) cladding. The evaluation includes the potential for energy savings due to increased thermal resistance, and reduced air movement through the walls. In addition, possible shortcomings will be identified, for example, condensation which could lead to reduced insulation effectiveness or structural degradation (by corrosion of steel components, or damage to gypsum board). The study is part of a program of field monitoring being carried out by the National Research Council of Canada (NRC) to develop design guidelines and methods of performance evaluation for retrofitted masonry walls. During the retrofit construction, instrumentation to monitor temperature, heat flow, moisture, and air pressure was installed in the wall assembly. Air pressure measurements will be used, in a future paper, to evaluate pressure equalization potential of the wall cavity. The instrumentation is continuously monitored over an extended period to allow the seasonal variation of wall performance to be evaluated. This paper describes the instrumentation and presents interim results of the thermal resistance of the wall and surface moisture. 1 originally published in the Journal of Thermal Insulation and Building Envelopes, Vol 20, April 1997, pp 320-338 2 now at the Lawrence Berkeley Laboratory, Berkeley, California, USA, CA 94720
Transcript of Long-Term Field Monitoring of an EIFS Clad Wall · Long-Term Field Monitoring of an EIFS Clad Wall1...

Long-Term Field Monitoring of an EIFS Clad Wall1
M. Nady A. Saïd, William C. Brown, and Iain S. Walker2
Institute for Research in ConstructionNational Research Council Canada
ABSTRACT
A popular retrofit option is to install an exterior insulation finish system to the walls ofexisting buildings. This study evaluates the thermal and moisture performance of such a systemwith a vented wall assembly. In addition to being a case study, this field monitoring wasintended to verify computation methods of building envelope performance. The long termmonitoring was designed to be non-destructive so that the building envelope performance is notaffected by the measurements that are made, and to allow easy removal of sensors forrecalibration and retrieval at the end of the test period. The field monitoring is planned for twoyears to capture a wide range of environmental conditions. This paper discusses theinstrumentation used in the study and presents interim results of the thermal resistance of thewall and surface moisture.
RÉSUMÉUne solution de rénovation souvent utilisée consiste à installer un parement extérieur isolant surles murs de bâtiments existants. L’étude décrite évalue la performance hygrothermique de cesparements combinée à un mur à cavité ventilée. En plus de permettre une étude de cas, lasurveillance in situ effectuée vise à vérifier certaines méthodes informatiques d’évaluation de laperformance de l’enveloppe des bâtiments. La surveillance à long terme devait être nondestructive pour éviter de nuire à la performance de l’enveloppe et pour faciliter l’enlèvementdes capteurs afin de les réétalonner ou de les retirer définitivement à la fin de la période d’essai.La surveillance in situ s’étalera sur deux ans pour permettre la saisie d’un vaste éventail deconditions environnementales. Ce document traite des instruments utilisés pour l’étude etprésente des résultats provisoires sur la résistance thermique du mur et sur l’humidité dessurfaces.
INTRODUCTION
This paper concentrates on the evaluation of an upgraded vented wall assembly with anexterior insulation finish system (EIFS) cladding. The evaluation includes the potential for energysavings due to increased thermal resistance, and reduced air movement through the walls. Inaddition, possible shortcomings will be identified, for example, condensation which could lead toreduced insulation effectiveness or structural degradation (by corrosion of steel components, ordamage to gypsum board). The study is part of a program of field monitoring being carried outby the National Research Council of Canada (NRC) to develop design guidelines and methods ofperformance evaluation for retrofitted masonry walls.
During the retrofit construction, instrumentation to monitor temperature, heat flow,moisture, and air pressure was installed in the wall assembly. Air pressure measurements will beused, in a future paper, to evaluate pressure equalization potential of the wall cavity. Theinstrumentation is continuously monitored over an extended period to allow the seasonalvariation of wall performance to be evaluated. This paper describes the instrumentation andpresents interim results of the thermal resistance of the wall and surface moisture.
1 originally published in the Journal of Thermal Insulation and Building Envelopes, Vol 20, April 1997, pp 320-3382 now at the Lawrence Berkeley Laboratory, Berkeley, California, USA, CA 94720

2
BUILDING RENOVATION
The building is located on the Montreal Road campus of the NRC in Ottawa, Ontario,Canada. The climate in Ottawa varies from warm, humid summers to cold and damp winters.According to the Supplement to the National Building Code of Canada, the design (2.5%)climatic parameters for Ottawa are 4634 heating degree-days (base 18°C), a temperature rangefrom 30°C (86°F) in July to -25°C (-13°F) in January, 22 m/s (49.5 mph) average wind speed,and 846 mm (33.3 in.) average annual precipitation.
The three to four storey building was originally constructed in 1953 and the exterior wallwas made out of two layers of hollow clay tiles, with a total width of about 406 mm (16 inches).The outside finish of the building was a white painted stucco. To reduce heating and coolingloads, and control air and moisture flow through the envelope an additional wall assembly withEIFS cladding was added to the exterior of the building in the summer of 1993. The new wallsystem also has a stucco finish so that the building retained its characteristic style. Newwindows were also installed. The total floor plan area of the building is about 2800 m2 (30,000ft2). The building has a central air conditioning system with distribution throughout the building.
The wall, Figure 1, was assembled from the original wall outward in a series of steps, asfollows:
1. A polyethylene/modified bitumen adhesive membrane air/vapour seal. This membrane wasintended to act as the plane of airtightness for the building envelope.
2. Galvanized sheet steel angles (32 mm x 126 mm (1.25 in. x 5 in.) and 0.91 mm (20 gauge)thick) were attached vertically 406 mm (16 in.) on centre. These angles allowed for the gapbetween the steel studs and the existing brick wall to vary. This was required to make theexterior finish even and true because the original wall was not plumb (up to ± 75 mm (3 in.)from plumb). Standing the steel studs off the wall also provided an air cavity (of about 38mm (1.5 in.) average thickness) between the exterior gypsum sheathing and the mineralfibre insulation installed into the stud space. The unevenness of the original wall caused aircavity thickness variation of 15 to 50 mm (1/2 to 2 in.)
3. Galvanized steel studs (31 mm x 91 mm (1.2 in. x 3.5 in.) and 0.91 mm (20 gauge) thick)were attached to the angles. The studs had holes (approximately 28 cm2 (4.3 in2) in area)punched in the centre web every 700 mm (28 in.). These holes were covered by the mineralfiber board insulation in most places, except where the unevenness of the existing wallresulted in a large gap between the studs and the existing wall. The holes allowed for air toflow horizontally from one cavity compartment to another, which is an important aspectaffecting the effectiveness of potential pressure equalized rainscreen wall systems.
4. Galvanized steel tracks (29 mm x 93 mm (1.1 in. x 3.7 in.) and 0.91 mm (20 gauge) thick)were installed at the top and bottom of the wall assembly and above and below each window.Circular vent holes for the cavity were punched out of the bottom track sections. The ventholes were the standard drain holes that are typical of a cavity wall system. The holes were13 mm (1/2 in.) diameter and about 150 mm (6 in.) on centre. For the purposes of thisstudy, additional venting holes were cut out of the bottom track on the west side of thebuilding (at the test section only). These changes will be discussed later on the experimentalinstallation section.
5. Mineral fibre insulation board, 64 kg/m3 (4 lbs/ft3) nominal density and 100 mm (4 in.) thick,was installed between the studs. This insulation was mounted flush to thepolyethylene/bitumen membrane covering the existing wall.
6. Exterior grade fiberglass-faced gypsum sheathing board, nominally 13 mm (1/2 in.) thick,was screwed to the steel studs.

3
7. Rigid extruded polystyrene boards, 25 mm (1 in.) thick, were secured to the steel studs byscrews that passed through the gypsum sheathing.
8. A plastic mesh was fastened to the polystyrene boards as a base for the exterior finish.
9. The exterior finish was an acrylic based stucco about 7 mm (1/4 in.) thick. It was applied intwo coats, with the second coat containing the finish colour. Vertical expansion joints for theexterior finish were cut into the polystyrene insulation, but not as deep as the gypsumsheathing.
Figure 1. Plan view of east wall cross-section, including thermocouple array.
Selection Of Wall Test Sections
Two wall sections were chosen for monitoring; one on the West side and one on theEast side of the building. These locations were chosen based on the prevailing wind direction(North West) and on the height of the cavity in the wall.
West SideOn the West side of the building the test section consisted of three stud spaces. The
central stud space was instrumented and the remaining two stud spaces act as a guard studspace to each side. The three stud spaces formed a sealed compartment that was created bythe following modifications: A seal of the same bitumen/polyethylene material as applied to theoriginal walls was applied to the full height of the studs at the edges of the guard stud spaces; aclosed cell foam gasket was placed along the flange of the two guard studs (between the stud

4
and the exterior gypsum sheathing). These seals prevented air movement between the testsection and the rest of the wall system as is required for pressure equalization systems.
The bottom track on the west side test section had additional holes that increased theeffective vent area (Figure 2). The additional vents consisted of two rows of holes. The first rowof holes were 13 mm (1/2 in.) diameter on 25 mm (1 in.) centres and the second row of holeswere 19 mm (3/4 in.) diameter on 50 mm (2 in.) centres. These holes provided a total of 55 cm2
(8.5 in.2) of vent area per stud space. This was about an order of magnitude (13 times) morethan with unaltered bottom track (4.3 cm2 (0.6 in.2)). However, the effective area of the extraventing area may be reduced by the partial blockage by the mineral fibre insulation and by theflashing installed below the bottom track.
East SideOn the East side of the building there were no changes to the cavity. It was typical of
construction in the rest of the building. There was no horizontal compartmentalization, and thevent holes are the 13 mm (1/2 in.) diameter drain holes 150 mm (6 in.) on centre.
Figure 2. Sensor and vent hole locations at bottom of west wall.
DESIGN AND INSTALLATION OF SENSORS

5
Temperature Measurement
Type T Shielded thermocouple wire was used to reduce any electrical noisesuperimposed on the thermocouple signal. The thermocouples were bonded (with epoxy resin) tothe surface and covered with a cloth construction tape. The thermocouple wires were installed insuch a way that they would have a minimal effect on the measured temperatures, e.g., the wireswere located as far away as possible from other thermocouples. In addition, the wires were runalong isotherms near the measurement points.
For thermocouples installed at the gypsum sheathing/air space and gypsumsheathing/insulation interfaces, shallow grooves were cut into the gypsum sheathing, and thethermocouple wire was laid into these grooves. After bonding the wire to the gypsum with epoxythe wires were taped over with cloth construction tape. This left a flat surface on the back of thegypsum so as not to affect surface boundary layer development, and thus the surface heattransfer rate and temperature. For thermocouples placed between the gypsum and the exteriorinsulation the above method was also used so that the gypsum and insulation would lie flattogether and not be pushed apart resulting in an air gap between these two components.
For the interior and exterior air temperatures, radiation shields were used so that thethermocouple registered the true air temperature. This is particularly important for exteriormeasurements where solar radiation can significantly increase the indicated temperature. Ateach Relative Humidity (RH) measurement location, the air temperature was measured so thatthe dew-point temperature and vapour pressure could be calculated.
To obtain estimates of the thermal resistance of each layer of the wall section (includingthe original wall) an array of thermocouples was installed approximately half way up both theEast and West cavities. The thermocouples were arranged as shown in Figure 1 (east wall testsection). This arrangement consists of a set of thermocouples on the centreline (T26 to T31, midway between the studs) and a set of thermocouples along a stud (T32 to T41). Each set ofthermocouples measured the temperature at each material interface to allow calculation ofthermal resistance of each wall component. Differences between these two sets ofthermocouples showed the magnitude of the thermal bridging effect of the steel studs.Additional thermocouples (T34, T35, T38 and T39) mounted on the existing wall and on the backof the exterior gypsum next to the studs measured how far the thermal bridging effect penetrateslaterally from the studs.
Ambient Weather Conditions
The ambient conditions were monitored at a meteorological station about 150 m (500 ft)to the northwest of the building. Measurements, at 6 m height, included the temperature and RHof the outdoor air, wind speed, wind direction and rainfall. On the walls of the building solarradiation meters were mounted (at about mid-height of the wall) to monitor radiation directly atthe wall surface.
Pressure Measurement
Pressures were measured within the cavity and on the exterior surface of the buildingrelative to the interior pressure at each pressure measurement location. The pressuretransducers ( ±1 kPa (±4 in. water) range and specified accuracy 0.14% of full scale ) weremounted on the interior wall for easy recalibration and removal at the end of the experiment.PVC (10 mm (3/8 in.) I.D.) tubing extended through the wall from the pressure transducers to themeasurement location. The tubing was sealed to the bitumen/polyethylene using a flangecovered by another piece of membrane, caulking and construction tape to prevent air leakagearound the tubing. The tubing was also sealed to the exterior stucco to prevent air leakage intothe cavity from outside. Simple tests were performed using a dynamic pressure generatingapparatus to estimate the attenuation of higher frequency pressure fluctuations. The results of

6
these experiments showed that at frequencies below 5 Hz the tubing had little measurable effecton the frequency response of the pressure transducers.
The pressure differences were measured at three heights: near the top, middle andbottom of the cavity. These measurements will be used to investigate any spatial variation inpressure equalization as the measurement point is moved further from the vent holes at thebottom of the cavity. Each pressure transducer had a solenoid that acts to short circuit thetransducer so that zero pressure difference readings may be taken. These zero readings allowedfor any zero offset and any zero drift to be subtracted from each pressure measurement.
Rain Gauges
One external source of moisture for the building is rain. Rain gauges are commerciallyavailable for measuring vertical rainfall on horizontal surfaces, however the vertical walls of thebuilding are exposed to the horizontal component of wind blown rain. NRC constructed raingauges specifically to monitor rain driven by wind onto vertical surfaces. The rain gauge wasbased on one developed in Sweden in 1973. The rain gauges had a rain collector consisting ofan aluminum backing plate with a section of diagonally cut 390 mm (15 in) diameter PVC pipe.The collected rain exited at the bottom of the collector through a short section of copper tubing.The tubing supplied a tipping bucket system that monitored the flow of water out of the pipe. Asimple magnetic switch emitted an electrical pulse every time the bucket tips.
The rain gauges were calibrated by pouring measured amounts of water into thecollector and counting the number of pulses produced by the switch on the tipping buckets.Approximately 6 ml (1/3 in.3) of water was required to tip the bucket, which is therefore theresolution of rain measurement. This corresponded to a water layer 0.05 mm (2/1000 in.) thickover the 0.12 m2 (186 in.2) catchment area of the rain gauges (or 0.42 mm per m2).
Three rain gauges were mounted on each of the two test sides of the building in order tomonitor the surface wetting patterns. On the east side of the building the rain gauges weremounted near the top and at one-third and two-third of the wall height. On the West side of thebuilding, two rain gauges were mounted near the top of the wall about 2500 mm apart (6 studspaces). This horizontal spacing will allow the examination of horizontal variation of rain strikingthe building. The third rain gauge was mounted about two thirds the way up the wall.
Surface Wetting
In addition to the rain gauges, surface wetting patterns were measured using two typesof surface moisture sensors: electrochemical cell (ECC) and ceramic (resistance). The ECC(also called Sereda) sensors are small (approx. 18 mm x 10 mm (11/16 in. x 3/8 in.)) and light(few grams) [see ASTM standard G 84-89]. They contain two different metals, copper and gold,in an interlaced pattern plated onto an insulating substrate. When moisture condenses on thesensor it activates the cell, producing a small voltage (0 to 100 mV) across a 10 MΩ resistor.The ECC sensors were epoxied to the outer finish of the EIFS. Three sensors were mounted onthe East face and four on the West face. On the East face, each ECC sensor was mounted justabove the rain gauges to examine the correlation between measured rain fall and surfacewetting. On the West side, the top two sensors were mounted above the rain gauges and theother two are lower down on the wall.
Additional surface moisture measurements were provided by measuring the resistanceacross pieces of ceramic material. These ceramic resistance sensors, made at NRC, consist oftwo wires fastened with conductive epoxy to opposite sides of a 5 mm thick block cut from a claybrick (size approximately 19 mm x 10 mm x 5 mm (0.75 in. x 3/8 in. x 3/16 in.)). When theceramic material becomes wet, its electrical resistance decreases and this drop in resistance isused to indicate the presence of moisture. The ECC and ceramic sensors were placed side byside in some locations in order to investigate the sensitivity and time response of the two sensortypes.

7
Relative Humidity - Inside the Air Cavity
The relative humidity (RH) of the air in the cavity was measured at five locations oneach test side. The locations were at different heights to determine the variation of moisture inthe cavity air. Combining the RH measurements with the temperature on the surfaces of thecavity allows the calculation of the possibility of condensation forming on the cavity surfaces.The RH of the outside and indoor air were also monitored so that rates of moisture exchange bydiffusion or air flow could be estimated.
Polymer resistance RH sensors (specified accuracy ±1% to 2%) were used because theyprovide a continuous electrical output that is suitable for remote, long term monitoring. The RHsensors required periodic recalibration and will be removed at the end of this study. To fulfillthese requirements, a system was developed to allow for easy removal and installation of thesensors without damaging the wall system. The RH sensors were inserted into the cavity airspace through holes from the interior of the building. To keep the installation tidy and to preventair and moisture entering the wall system around the sensors, PVC pipes were installed into theholes in the walls. The PVC pipes were sealed to the interior and exterior surfaces of the originalwall to prevent air and moisture movement. The electronics for the RH sensor were mounted onthe interior wall next to measurement location. This interior mounting of the electronics allowedfor easier troubleshooting and testing because the output and power supply were easilyaccessible. It was important to calibrate the RH sensors with their extension rods because thecalibration depended on the wire length between the sensor and the electronics. Thisdependence on wire length is because the sensors used AC excitation and were thereforesensitive to the capacitance and impedance (therefore the length and orientation) of theconnecting wires. The RH sensors were calibrated using saturated salt solutions andtemperature controlled small environmental chamber.
Wetting of Cavity Surfaces
ECC sensors were installed in the cavity to detect surface condensation. They weremounted in pairs 75 mm (3 in.) above the bottom track. One sensor was on the back of thegypsum sheathing and the other was mounted on the steel stud, as shown in Figures 2 and 3(sensors # S1, S2, S11 and S12).
Ceramic sensors were installed in the bottom track of both the East and West cavities.These ceramic sensors were intended to detect any condensation or water flow in the cavity. Onthe West side three sensors were installed; one near each stud at the ends of the cavity and oneon the centreline of the cavity. On the East side only two were installed; one near the left stud(looking from outside) and one on the centreline, as shown in Figure 3 (C5 and C6).
In the East cavity a different kind of moisture sensing device was installed in order to betested. It consisted of a side by side wire pair whose insulation had been removed ("nicked") atregular intervals - approximately 0.5 mm (1/64 in.) every 5 mm (3/16 in.). The wire coversalmost the width of the stud space. If there is moisture between these exposed wires theresistance between the wires would fall. A resistance drop is therefore indicates the presence ofmoisture. For both the ceramic and nicked wire sensors. The installation included putting alayer of insulation epoxy between the sensor and the steel bottom track to prevent short circuits.

8
Figure 3. Sensor and vent hole locations at bottom of east wall.
Heat Flux Measurement
A heat flux sensor was installed on the inside surface of the wall on each of the wall testsections. These sensors were installed above the location of the thermocouple arrays (mid-waybetween the studs) for heat transfer and thermal bridging measurements. The heat flux sensorswere covered with thin (3 mm (1/8 in.)) aluminum plates, painted same colour as the wall, to holdthem firmly against the wall. This allowed for good thermal contact without damaging the interiorfinish of the building. The heat flux sensors consist of a thermopile encapsulated in plastic andsurrounded by a guard area. The overall diameter of the sensor is about 200 mm (8 in.) with asensing diameter of about 50 mm (2 in.) at the centre. The thermopile consisted of two arrays ofthermocouple junctions separated by an insulating layer. The heat flow through the unit isproportional to the difference in voltage generated by the two thermocouple arrays. The unitswere individually calibrated by the manufacturer (specified accuracy ±5%), and were verified atNRC using the guarded hot plate apparatus.

9
DATA ACQUISITION SYSTEMS
Two data acquisition systems were used in this study because the pressure monitoringsystem was required to operate at a different speed. The output from the systems are combinedduring data analysis.
System 1 - Thermal and Moisture Monitoring
This system recorded the temperatures, relative humidity, solar radiation, and moisture(except rain gauges). The system scanned through all of the readings in about 9 seconds. Thisincluded a one second wait after each relay closed for the resistance measurements. This onesecond wait protected the system from measuring the switching noise that can be present on therelays. Every hour, an hourly average was calculated (of approximately 400 readings from eachsensor). These hourly averages were saved in a data file.
System 2 - Pressure and Rain Gauge Monitoring
This system monitored the pressure differences and the rain gauges. The rain gaugepulses were monitored using a pulse counter. Counting the number of pulses in a given timeperiod allowed the calculation of the rainfall rate.
The pressure difference data acquisition system had two modes of operation, normaland a high wind mode. The two modes of operation differ in the amount of data saved. Most ofthe time the system operated in normal mode. The data was taken at about 42 Hz and averagedover 10 minutes (approximately 25,000 pressure measurements). The high wind mode wastriggered when any of the transducers shows a measured pressure difference in excess of 200Pa (0.8 in. water). During a high wind event, the system records 15,000 individual pressuremeasurements which are all saved to disk. This procedure took about 5 minutes and 30seconds. This data will allow the dynamic response of the wall cavity to be examined and theextreme peak values to be observed.
Ambient Weather Conditions
The system measuring the ambient weather conditions was an existing system alreadytaking data for other projects. Hourly and ten minute averages of temperature, relative humidity,wind speed, wind direction, and rainfall are stored by this system.
INTERIM RESULTSEffective Thermal Resistance
The thermal resistance was calculated using the measured temperatures across the walland heat flux. Although this appears to be a straightforward calculation, it is complicated by thethermal mass lag effect of the clay tile wall. Figure 4 shows the temperature differencemeasured across the whole wall and the heat flux for the west wall. This figure illustrates thediurnal change of temperature difference from day to night and the corresponding change in heatflux. The thermal mass makes the heat flow about 12 hours out of phase with the temperaturedifference, i.e., the maximum heat flow occurs at minimum temperature difference and theminimum heat flow occurs at maximum temperature difference. Effective thermal resistancemust therefore be calculated by taking long time averages of both temperature difference andheat flux. Brown and Schuyler (1982) described the procedure for calculating in-situ thermalresistance of walls (also see ASTM Standards C1046-90 and C1155-90).

10
Figure 4. Effect of wall thermal mass on the relationship between temperature difference acrossthe wall and heat flux (midway between the studs).
One week of temperature and heat flux measurements was found to be the minimumand one month being preferable. The thermal resistance of the wall was found to be RSI 3.38 (R19.2) (not including air films). Using the thermocouples on each side of the clay tile wall, thethermal resistance of the original wall was found to be RSI 0.77 (R 4.4). Therefore therenovation increased the effective thermal resistance by almost a factor of five, which impliessignificant energy savings. It should be noted that this applies only to sections of the exteriorwall which are solid (opaque).
Because of the arrays of thermocouples were installed in the walls, it was possible tocalculate the effective thermal resistance of each component of the wall. These were comparedto design values (using the ASHRAE handbook and manufacture data), see Table 1. The tablecontains values for the east wall test section only, but the measured results for the west wall arewithin 18% of these values and are not shown for brevity. This difference may be attributed tovariations in the wall assembly and heat flux sensor installations. On the east wall section, theheat flux sensor was installed close to a window (in an office) and is further away from thetemperature array (1160 mm) than that in the west wall (in a stairwell) where the distancebetween sensor and the temperature array was 200 mm.
Table 1. Thermal resistance of wall components (not corrected for temperature)
Component MeasuredRSI (R)
DesignRSI (R)
Clay tile 0.77 (4.4) 0.64 (3.6)Mineral fibre insulation 1.60 (9.1) 2.90(16.4)
Air gap 0.10 (0.6) 0.15 (0.9)Gypsum sheathing 0.07 (0.4) 0.08 (0.5)
Extruded polystyrene 0.84 (4.8) 0.87 (4.9)Total 3.38(19.2) 4.64 (26.3)
For the clay tile, gypsum sheathing and extruded polystyrene insulation, the designvalues compare well to the measured values. The differences between measured and design

11
values for the air gap are due to uncertainties in the thickness of the air gap (as noted earlier thisranged from 15 mm (1/2 in.) to 50 mm (2 in.) due to variations in the original clay tile wall) andconvective air flow within the cavity. More critical is the low measured thermal resistance of themineral fibre insulation. The measured value is 45% less than the nominal value. The mostprobable explanation is that there may be air gaps between the insulation board and the originalwall, and between the insulation board and the studs. These air gaps combined with the otherface of the insulation being exposed to the air cavity, means that the likelihood of air convectionthrough the insulation is high. This convection acts to reduce the effective thermal resistance ofthe insulation.
Laboratory experiments by Brown et al. (1993) have shown that installation defects canreduce insulating value by up to 36% even without a surface exposed to an air cavity. Thisresult was at a temperature difference across the insulation of 55 K (99°F). In the resultspresented for the current study, the average temperature difference is only 10 K (18°F) and thereduction in insulating value due to installation defects would be considerably less. It is beyondthe scope of preliminary results presented here to perform a more sophisticated analysis of theseresults.
Moisture Performance
Exterior WettingExterior wetting of the wall is from two sources: rain and condensation. The measured
rainfall in this study is the horizontal (wind-driven) component of the rain, only. Driving rain isimportant in considering rain penetration of the building envelope because it coincides with highwind pressures across the EIFS cladding. To get an indication of the possible magnitude of theproblem, Table 2 gives the number of hours in which driving rain was measured by the raingauges over seven months at four different locations. Comparing the top and bottom raingauges for the west wall shows that more rain strikes the top of the wall. The results in Table 2show that, driving rain strikes the top of the building about 17 to 20 hours per month in average.
Table 2. Hours of driving rain
Sensor Location April May June July Aug. Sept. Oct.
Total
West top 3 19 12 35 14 17 21 121West top corner 3 26 13 20 - - - 62
West Bottom 1 1 - 3 - - - 5East top 27 25 34 11 7 20 16 140
Exterior wetting of the building can also occur due to condensation. Condensationoccurs during summer months when hot and humid days are followed by cool nights. Additionalcooling of the exterior surface of the wall by radiation to the night sky produces a temperaturedepression on the wall about one degree Celsius (2°F) below the ambient air temperature.Rather than the localized effects of rain, which are concentrated near the top of the building, theexterior condensation occurs over the full height of the wall, as shown in Figure 5-a. In thisfigure, three exterior moisture sensors at different heights on the wall indicate the presence ofmoisture each night. This time-line plot starts at midnight, and each hour of the following weekthe hourly averaged sensor output is shown. The condensation is seen to occur during the nighttime hours, when exterior temperatures are lowest, relative humidity the highest, and surfacetemperature drops below the dew-point (see Figure 5-b). For the results shown in Figure 5 thenight time relative humidity was 95% to 100%. The diurnal cycles in Figure 5 show that whenthe sun rises in the morning and heats up the wall (and the relative humidity of the air falls) thewall rapidly dries out.

12
a) Diurnal condensation on exterior of east wall
b) Exterior surface temperatures and dew-point of outdoor air
Figure 5. East wall exterior surface condensation and temperatures, and dew-point ofoutdoor air, for a selected period in August 1994.
Interior WettingBecause the EIFS clad wall system has an interior air cavity, condensation can occur
within the wall system. In July 1994, the dew-point of cavity air reached 29.4°C and 26.5°C inthe west and east wall cavities, respectively. The relative humidity (Figure 6-a) in the east wallcavity reached up to 90% and is generally higher than that in the west wall cavity while the airtemperature (Figure 6-b) in the east wall cavity is lower than that in the west wall cavity. Thevariation in the air temperature and RH in the cavity basically follows the cyclic variation in

13
outdoor air temperature and RH (Figure 6). The RH diurnal cycles in the west wall lag behindthe RH diurnal cycles in the east cavity which is consistent with the sun shining on the east wallin the morning and shining on the west wall in the afternoon. It is also noted that high RH valuesin the east cavity coincide with low cavity air temperatures.
a) Relative humidity
b) Air temperature
Figure 6. Relative humidity and temperature of air at the bottom of wall cavities and outdoors,for a selected period in July 1994.
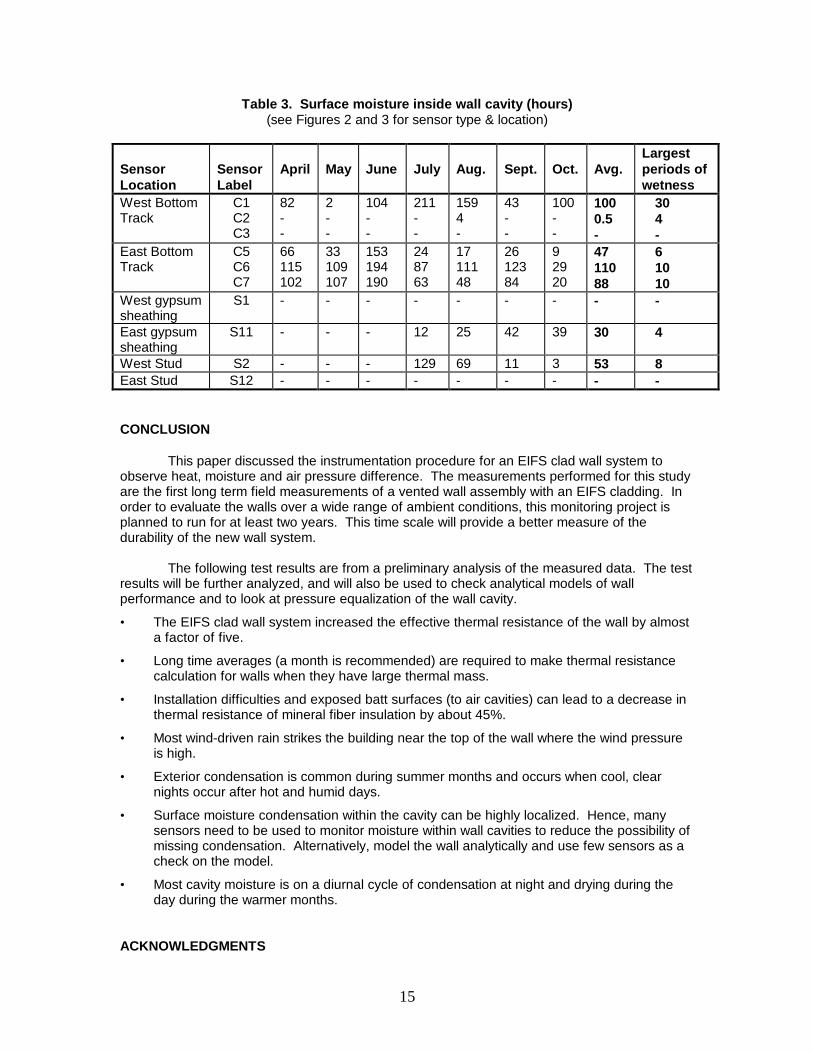
In this study surface moisture sensors monitored the time of wetness of the bottom track,stud and gypsum sheathing. The total number of hours per month during which moisture wasdetected over a period of 7 months are summarized in Table 3. The results show thatcondensation can be highly localized. For the west wall cavity, moisture was detected on thestud, but not on the gypsum sheathing and the opposite is true for the east wall cavity. However,moisture was detected on the bottom track in both the west and east cavities. The dew-point ofcavity air at the bottom of the west wall cavity reached higher values than that at the bottom ofthe east wall cavity (Figure 7). Thus the potential for condensation would be higher in the west

14
wall cavity, particularly on the steel stud because of its thermal bridge effect. Table 3 shows thatsome locations (bottom track) can average 100 hours per month with condensation on thesurface. This is important information for estimating the occurrence of corrosion on the steelstuds and bottom track (and thus any structural problems). Assessment of the potential forcorrosion is beyond the scope of this paper and remains a topic for future consideration.
Figure 7. Dew-point of air at the bottom of the wall cavities and outdoors, for a selected periodin July 1994.
Table 3 also shows the largest periods for which wetness is present at each location. Formost of the sensors (except C1) this is 10 hours or less which, combined with furtherobservations of the wetness time history, shows that the moisture is present in diurnal cycles.This is a similar result to the condensation on the outside of the wall as discussed earlier. Atnight the air in the cavity cools below its dew-point, leading to condensation. When the sun risesit heats up the cavity, thus reducing the relative humidity of the air in the cavity and drying outthe cavity surfaces.
15
Table 3. Surface moisture inside wall cavity (hours)(see Figures 2 and 3 for sensor type & location)
SensorLocation
SensorLabel
April May June July Aug. Sept. Oct. Avg.Largestperiods ofwetness
West BottomTrack
C1C2C3
82--
2--
104--
211--
1594-
43--
100--
1000.5-
304-
East BottomTrack
C5C6C7
66115102
33109107
153194190
248763
1711148
2612384
92920
4711088
61010
West gypsumsheathing
S1 - - - - - - - - -
East gypsumsheathing
S11 - - - 12 25 42 39 30 4
West Stud S2 - - - 129 69 11 3 53 8East Stud S12 - - - - - - - - -
CONCLUSION
This paper discussed the instrumentation procedure for an EIFS clad wall system toobserve heat, moisture and air pressure difference. The measurements performed for this studyare the first long term field measurements of a vented wall assembly with an EIFS cladding. Inorder to evaluate the walls over a wide range of ambient conditions, this monitoring project isplanned to run for at least two years. This time scale will provide a better measure of thedurability of the new wall system.
The following test results are from a preliminary analysis of the measured data. The testresults will be further analyzed, and will also be used to check analytical models of wallperformance and to look at pressure equalization of the wall cavity.
• The EIFS clad wall system increased the effective thermal resistance of the wall by almosta factor of five.
• Long time averages (a month is recommended) are required to make thermal resistancecalculation for walls when they have large thermal mass.
• Installation difficulties and exposed batt surfaces (to air cavities) can lead to a decrease inthermal resistance of mineral fiber insulation by about 45%.
• Most wind-driven rain strikes the building near the top of the wall where the wind pressureis high.
• Exterior condensation is common during summer months and occurs when cool, clearnights occur after hot and humid days.
• Surface moisture condensation within the cavity can be highly localized. Hence, manysensors need to be used to monitor moisture within wall cavities to reduce the possibility ofmissing condensation. Alternatively, model the wall analytically and use few sensors as acheck on the model.
• Most cavity moisture is on a diurnal cycle of condensation at night and drying during theday during the warmer months.
ACKNOWLEDGMENTS

16
The authors acknowledge the contribution of Dr. A.H.P. Maurenbrecher, Mr. W.A. Dalgliesh, Mr.C.J. Shirtliffe, Mr. G.F. Poirier, Mr. L.M. Mcsheffrey, Mr. J.M. Marans and Mr. R. Demers in thefield measurements.
REFERENCES
ASHRAE Handbook (1993), Chapter 23, ASHRAE, Atlanta, Georgia
Brown, W.C. and Schuyler, G.D. (1982). “In Situ Measurements of Frame Wall ThermalResistance”, ASHRAE Transactions, Vol. 88, Part I, pp. 667-676.
Brown, W.C., Bomberg, M.T., Ullett, J.M., and Rasmussen, J. (1993). "Measured ThermalResistance of Frame Walls with Defects in the Installation of Mineral Fibre Insulation", J.Thermal Insul. and Bldg. Envs., Vol. 16, April 1993.
Supplement to the National Building Code of Canada, 1990, Associate Committee on theNational Building Code, National Research Council of Canada, NRCC No. 23178