Design of Genetic Algorithms Based Fuzzy Logic Power System ...

Method no.:
Matrix:
Target concentration:
Procedure:
Sampling rate of monitor:(3M specification)
Minimum air velocity:(3M specification)
Reliable quantitationlimit:(Section 1.2.3.)(based on an 8-h exposureat 760 mm Hg and 25°C)
Standard error ofestimate at the targetconcentration:(Section 4.4.)
Special requirement:
Status of method:
Date: November 1984
ETHYLENE OXIDE
49
Air
1 ppm (1.8 mg/m 3 )
Samples are collected by exposing 3M EthyleneOxide Monitors #3551 for a measured period oftime. Samples are desorbed with tetrahydrofuran. An aliquot of the desorbed sample isderivatized with heptafluorobutyric acid anhydride. The derivative is analyzed by gaschromatography using electron capture detection.
49.3 mL/min at 760 W~ Hg and
15 ft/min for area samples
0.7 ppb (1.3 ~g/m3)
6.4%
It is recommended samples be refrigerated uponreceipt by the laboratory until analyzed.
Evaluated method. This method has been subjected to the established evaluation procedures of the Organic Methods EvaluationBranch.
Chemist: Carl J. Elskamp
Organic Methods Evaluation BranchOSHA Analytical Laboratory
Salt Lake City, Utah

1. General Discussion
1.1. Background
1.1.1. History
The 3M Ethylene Oxide Monitor was evaluated at a targetconcentration of 1 ppm. The monitor is a badge containinga chemically treated charcoal disk which converts adsorbedethylene oxide to 2-bromoethanol (Ref. 5.1.). (It ispresumed the charcoal is impregnated with hydrogen bromide, but the exact coating procedure is proprietary information.) Ethylene oxide is collected by diffusion,thus no sampling pumps are needed, but a minimum air velocity must exist during sampling to assure that badgestarvation does not occur. The 2-bromoethanol formed onthe sampler is less likely to migrate than ethylene oxide.The migration of ethylene oxide can be a major disadvantage in other methods that utilize untreated charcoal forcollection (Refs. 5.2 and 5.3.) when samples have to beshipped to a laboratory for analysis. Also it is possibleto sample for 8 h with one badge instead of using numeroussamplers for the same period required for untreated charcoal tube methods.
The original analytical procedure for the monitors wasdeveloped by 3M when the time-weighted PEL was 50 ppm.'lnIS procedure involves analysis by gas chromatographyusing flame ionization detection with a detection limit ofabout 0.25 ppm for an 8-h exposure (Ref. 5.1.). EffectiveAugust 21, 1984 the new time-weighted average PEL is 1 ppm(Ref. 5.4.). In order to achieve a lower detection limitto accommodate this lower standard, an alternate analytical scheme was investigated.
An electron capture detector was considered for use in theanalysis since it is much more sensitive than the flameionization detector for 2-bromoethanol. The 3M methodspecifies the use of 10% (v/v) methylene chloride in methanol for the desorption solvent. Since methylene chlorideis not compatible with an electron capture detector, othersolvents were tested. Among those tried were acetone,isopropyl alcohol, tetrahydrofuran (THF), benzene, andmixtures of carbon disulfide in isopropyl alcohol. Several of these solvents appeared to desorb the 2-bromoethanol well, notably THF and acetone, but after repeatedinjections of desorbed samples, chromatography problemsdeveloped. These problems included drastic changes indetector response, loss of resolution, and loss of peaksymmetry. These difficulties may have been due to unreacted hydrogen bromide which could also have been desorbedfrom the samplers. Attempts were made to destroy theexcess hydrogen bromide by adding sodium carbonate, sodiumbicarbonate, or ammonium acetate to the desorbed samples,
49-1

but no improvement was made. At this point an attempt toform a derivative of 2-bromoethanol was considered.
The stable and volatile fluoroacyl derivative of 2-bromoethanol formed from heptafluorobutyric acid anhydride(HFAA) or heptafluorobutyrylirnidazole (HFBI) which isanalyzed in a concurrently evaluated ethylene oxide methodutilizing a solid sorbent tube proved to be an excellentcandidate for analysis by electron capture chromatography(Ref. 5.5.). Since the derivative is so heavily halogenated to give a high response, only a small aliquot ofthe desorbed sample is used, thus interferences are greatly diluted. Also the derivatized aliquot is washed withwater to extract any water soluble material such as hydrogen bromide. Tetrahydrofuran gives consistently highdesorption efficiencies. The only minor inconvenience isthat a side reaction of TBF with BBr occurs during thedesorption process to form 4-bromobutanol. This is similarly derivatized as the 2-bromoethanol during the derivatization step and upon analysis elutes about 10 min afterthe 2-bromoethanol derivative. N,N-Dimethylformamideappears to be a good desorption solvent but chromatographic interferences are extracted from blank samplers whichare significant at lOwer sample concentrations.
Thus, the 3M badges were successfully validated at a target concentration equivalent to 1 ppm (for an 8 h exposure) by desorbing the samplers with TBF, derivatizing analiquot of the sample with BFAA, and analyzing by gaschromatography with electron capture detection.
1.1.2. Toxic effects (This section is for information only andshould not be taken as the basis of OSHA policy.)
It has long been recognized that exposure to high levelsof ethylene oxide can cause a variety of toxic effectsincluding respiratory tract, eye, and skin irritations,nausea, vomiting, central nervous system depression andeven death. Intermittent high exposures are also reportedto cause neurological effects such as sensory motor neuropathies and seizures (Ref. 5.6.).
Recently major concern has focused on the mutagenic andcarcinogenic properties exhibited by ethylene oxide.Quoting the June 22, 1984 publication of the new ethyleneoxide standard from the Federal Register:
The evidence suggests that EtO may cause cancer ofthe blood (leukemia) as well as other organs in humans. In addition, EtO exposure causes mutations,increases in the rate of chromosomal aberration andsister-chromatid exchange, and causes other undesirable changes in the DNA of mammalian cells ... EtOexposure has also been associated with an increased
49-2
risk of spontaneous abortions among pregnant women andis capable of causing other adverse reproductive effects in both men and women.
These conclusions are supported by a number of animalexperiments involving exposure to ethylene oxide by avariety of different routes including: inhalation, subcutaneous injection, dermal exposure and intragastricadministration. Additional data is cited in the publication of the standard to indicate that "virtually everymutagenicity test system applied to EtO has shown thechemical to be mutagenic." Several epidemiological studIes indicate that excess cancers may be occurring in theworkplace due to ethylene oxide exposure. Additionalstudies involving groups of workers exposed to varyinglevels of ethylene oxide indicate an ethylene oxide dosedependent increase in sister-chromatid exchange rates aswell as increased chromosomal breaks and aberrations.Based on this increasing body of evidence, OSHA has actedto reduce the permissible exposure limit (PEL) to 1 ppmfor an 8-h TYA (Ref. 5.4.).
1.1.3. Potential workplace exposure
Ethylene oxide is a major industrial chemical with production volume ranking in the top 25 among all chemicalsproduced in the United States. Approximately 6.7 billionpounds were produced domestically by the most recent estimate (Ref~ 5~4.)~ Over 99% of the total produced in theUnited States is used in the manufacture of other products. Approximately 70% of the total is used to produceethylene glycol. Ethylene oxide is also used to producenon-ionic surface-active agents used in household detergents, ethanolamines, glycol ethers, di-, tri-, tetra-,and polyethylene glycols and crown ethers (Ref. 5.6.).
Although less than 1% of the total ethylene oxide producedin the United States is used as a sterilizing agent, thissmall sector represents the greatest number of potentialwork exposures. It is estimated that some 62,370 employees in 6237 hospitals in the United States are potentiallyexposed to ethylene oxide. Another 5000 workers are estimated to be potentially exposed to ethylene oxide in itsuse as a sterilizing agent in the medical products manufacturing industry (Ref. 5.4.).
A small number of workers in other industries are alsopotentially exposed to ethylene oxide during its use as afumigant and a sterilizing agent. Spice manufacturing,libraries, museums, dairy packing and fur treatment aresome of the industries and work settings in which ethyleneoxide exposure can occur (Ref. 5.6.).
49-3

1.1.4. Physical properties (Ref. 5.7. unless otherwise noted)
CAS no.:molecular weight:boiling point:color:density:structural formula:
vapor pressure:flash point (tag open cup):odor (Ref. 5.3.):
synonyms (Ref. 5.4.):
75-21-844.0510.4°C at 760 mm Hgcolorless gas0.8697 g/mL at 20°CH2C - CH2
\ /
°1094 mm Hg at 20°C<-18°Cether-likelower, 3% by volumeupper, 100% by volumedihydrooxirene, dimethyleneoxide, EO, EtO, ETO, oxane,oxiran, oxirane, oxidoethane,oxacyclopropane, alpha/betaoxidoethane, 1,2-epoxyethane
1.2. Limit Defining Parameters (The analyte air concentrations listedthroughout this method are based on an exposure time of 8 h (at760 mm Hg & 25°C), a desorption volume of 1.5 mL THF, and thederivatization of 25 ~L of desorbed sample with 20 ~L of HFAAcontained in 1.0 mL of isooctane. The amounts are expressed asethylene oxide, although the derivative is analyzed.)
1.2.1. Detection limit of the analytical procedure
The detection limit of the analytical procedure is 0.2 pgper injection. This is the amount of analyte which willgive a measurable response with the amounts of interferences present in a standard. (Section 4.1.)
1.2.2. Detection limit of the overall procedure
The detection limit of the overall procedure is 0.03 ~g
per sample (0.7 ppb or 1.3 ~g/m3). This is the amount ofanalyte spiked on the sampling device which allows recovery approximately equivalent to the detection limit of theanalytical procedure. (Section 4.2.)
1.2.3. Reliable quantitation limit
The reliable quantitation limit is 0.03 ~g per sample (0.7ppb or 1.3 ~g/m3). This is the smallest amount of analytewhich can be quantitated within the requirements of arecovery of at least 75% and a precision (±1.96 SO) of±25% or better. (Section 4.3.)
49-4

The reliable quantitation limit and detection limits reported inthe method are based upon optimization of the instrument for thesmallest possible amount of analyte. Vhen the target concentration of an analyte is exceptionally higher than these limits, theymay not be attainable at the routine operating parameters.
1.2.4. Sensitivity
The sensitivity of the analytical procedure over the concentration range representing 0.5 to 2 times the targetconcentration based on the recommended exposure time isapproximately 60,000 area units per ug/sample. This isdetermined by the slope of the calibration curve. (Section4.3.) The sensitivity will vary with the particular instrument used in the analysis.
1.2.5. Recovery
The recoveries of ethylene OXIde from samples used in a15-day storage test remained above 78% when the sampleswere stored at ambient temperatures (20-26°C) in a closeddrawer. (Section 4.4.) The recovery of analyte from thecollection medium during storage must be 75% or greater.
1.2.6. Precision
The pooled coefficient of variation obtained from replicate determinations of analytical standards at 0.5, 1, and2 times the target concentration is O~009~ (Section 4~3~)
1.2.7. Precision (overall procedure)
The precision at the 95% confidence level for the 15-daystorage test is ±12.4%. (Section 4.4.) This includes anadditional ±5% for sampling error. The overall proceduremust provide results that are ±25% or better at the 95%confidence level.
1.2.8. Reproducibility
Six samples collected from a controlled test atmosphereand a draft copy of this procedure were given to a chemistunassociated with this evaluation. The samples were analyzed after 15 days of storage at aoc. The average recovery was 99.0% with a standard deviation of 3.1%. (Section 4.5.)
1.3. Advantages
1.3.1. The badge provides a convenient method for sampling sinceno sampling pumps are required.
49-5
1.3.2. Sampler exposure times can be longer for the badge thanthe recommended maximum sampling times for untreated charcoal tubes, thus fewer samples are required.
1.4. Disadvantages
1.4.1. A minimum face velocity is required for reliable sampling.This may not be obtainable in all field situations.
1.4.2. The analysis involves the formation of a derivative of2-bromoethanol which is more time-consuming than directanalysis.
2. Sampling Procedure
2.1. Apparatus
Samples are collected on 3M Ethylene Oxide Monitors *3551.
2.2. Reagents
None required
2.3. Technique
2.3.1. The monitor and closure cap are removed from the resealable bag. The cap remains with the bag.
2.3.2. The monitor is removed from its sealed package.
2.3.3. The exposure start time is recorded on the back of themonitor.
2.3.4. The monitor is attached to the worker near the breathingzone. The white film (wind screen) and ring must not beremoved until the sampling period is terminated.
2.3.5. After sampling, the monitor is removed from the worker.The white film and its retaining ring should be immediately removed from the monitor with a coin or other suitable device.
2.3.6. The closure cap is snapped onto the monitor and the portsfirmly closed.
2.3.7. The time at the end of the sampling period is recorded onthe back of the monitor.
2.3.8. The sampling information is entered on the original bag.This information should include atmospheric station pressure or elevation of the sampling site. The capped monitor is placed in the bag and the bag is sealed with OSHAForm 21. The white films and retaining rings are discarded.
49-6

2.3.9. At least one blank monitor is submitted with each sampleset.
2.4. Capacity
The sampling capacity of the monitor is 3200 ~g of ethylene oxideas reported by 3M. This is equivalent to sampling a 75-ppm atmosphere for 8 h.
2.5. Desorption efficiency
2.5.1. The average desorption efficiency of ethylene oxide fromspiked monitors is 96.9% over the range of 0.5 to 2 timesthe target concentration. (Section 4.6.)
2.5.2. The time required foreach lot of monitors.the desorption tookleveled off.
desorption must be determined forIt was found that for newer lots,
about 24 h before the efficiency
2.6. Sampling rate and minimum air velocity required (from 3M)
2.6.1. The sampling rate at 760 mm Hg and 25°C is 49.3 mL/min.
2.6.2. The mInImum air velocity required for area samples is 15ft/min.
2.7. Interferences (sampling)
2.7.1. It is not known if any compound(s) will severely interferewith the collection of ethylene oxide.
2.7.2. Suspected interferences should be reported to the laboratory with submitted samples.
2.8. Safety precautions
2.8.1. Attach the sampling equipment to the employee so that itwill not interfere with work performance or safety.
2.8.2. Follow all safety procedures that apply to the work areabeing sampled.
3. Analytical Procedure
3.1. Apparatus: The following are required for analysis:
3.1.1. A GC equipped with an electron capture detector.this evaluation, a Hewlett-Packard 5840A GC waswith a 7671A Automatic Sampler.
Forused
3.1.2. A GC column capable of separating the BFAA derivative of2-bromoethanol from isooctane and any interferences. AlO-ft x 1/8-in. stainless steel column packed with 10%
49-7

SP-1000 coated on 80/100 Supelcoport was used in thisevaluation.
3.1.3. An electronic integrator or some other suitable method ofmeasuring peak areas or heights.
3.1.4. Small vials with Teflon-lined caps capable of holding 4mL. VISP vials were used in this evaluation.
3.1.5. Small vials with Teflon-lined caps capable of holding 2mL. Hewlett-Packard autosampler vials were used.
3.1.6. A dispenser capable of delivering 1.5 mL THF into themonitors for desorption and into vials for preparation ofstandards. A 2.5-mL Gas-Tight Hamilton syringe was usedin this evaluation.
3.1.7. Dispensers, one capable of delivering 20 ~L and anothercapable of delivering 25.0 ~L. SMI digital adjust MicrolPettors were used in this evaluation.
3.1.8. Syringes for preparation of standards and for injection ofsamples and standards into a Ge. A 10-~L syringe was usedfor standard preparation and a l-~L syringe was used forthe injections in this evaluation.
3.1.9. Volumetric flasks and pipets to dilute the 2-bromoethanol.
3.1.10. Disposable dropping pipets.
3.2. Reagents
3~2~1~ Tetrahydrofuran, isooctane and water; reagent grade.
3.2.2. 2-Bromoethanol, reagent grade. Kodak lot AlOB was used.
3.2.3. Heptafluorobutyric acid anhydride (HFAA).Pierce Chemical Company was used.
3.2.4. Magnesium sulfate, reagent grade.
3.3. Standard preparation
HFAA from
3.3.1. Stock standards are prepared by diluting 1.0 mL of 2-bromoethanol to 100 mL with THF.
3.3.2. Analytical standards are prepared by injecting micro~lter
amounts of stock standards into VISP vials containing 1.5mL of THF. A 25-~L aliquot of this solution is thenadded to another VISP vial containing 1.0 mL of isooctane.To this vial, 20 ~L of HFAA is added and the vial iscapped and shaken for a few seconds. After 10 min, 1 mLof water is added and the vial is shaken for 10 s. Theisooctane layer is transferred with a disposable pipet to
49-8
an autosampler vial containing approximately 50 mg ofmagnesium sulfate. The vial is capped and shaken for afew seconds. This solution is injected into a GC.
3.3.3. Analytical standard concentrations should bracket sampleconcentrations. Thus, if samples fallout or tne range ofprepared standards, additional standards must be preparedto ascertain detector response.
3~4~ Sample preparation
3.4.1. Add 1.5 mL of THF through one of the ports in the monitorusing the same dispenser as used for preparing standards.
3.4.2. The port is immediately plugged. The monitors are desorbed for a period of time as determined in Section 2.5.
3.4.3. The desorption solution is transferred to a YISP vial anda 25-~L aliquot is derivatized as in 3.3.2.
3.5. Analysis
3.5.1. GC conditionszone temperatures
gas flow (mL/min):injection volume:column:
retention times (min):
chromatogram:
1nn I,. .... l .....~\~vv \I.;.V~UJllllJ
200 (injector)300 (detector)25 (argon/methane(95/5»0.4 ~L
lO-ft x liB-in. 55, 10%SP-1000 on 80/100 Supelcoport6.2 (2-bromoethanol deriv.)16.5 (4-bromobutanol deriv.)Section 4.7.
3.5.2. Peak areas (or heights) are measured by an integrator orother suitable means.
3.5.3. A calibration curve is constructed by plotting peak areas(or heights) of standard injections versus ~g ethyleneoxide per sample. Sample concentrations must be bracketedby standards.
3.6. Interferences (analytical)
3.6.1. Any compound that responds on an electron capture detectorand has the same general retention time as the HFAA derivative of 2-bromoethanol is a potential interference. Possible interferences should be reported to the laboratorywith submitted samples by the industrial hygienist. Theseinterferences should be considered before samples aredesorbed.
3.6.2. GC parameters (i.e. column and column temperature) may bechanged to possibly circumvent interferences.
49-9

3.6.3. Retention time on a single column is not considered proofof chemical identity. Samples should be confirmed byGC/MS if possible.
Calculations
The analyte concentration for samples is obtained from the appropriate calibration curve in terms of micrograms per sample, uncorrected for desorption efficiency. The air concentrations are calculated using the following formulae. The amount of analyte foundon the samples is corrected by subtracting the amount (if any)found on the blank.
mg/m 3(liters of air sampled)(desorption efficiency)
Sixintolyzed
Liters of air sampled is found by the following:liters sampled (T)(0.0493)«K/298)A1.5)(760/P)
where T Exposure time (minutes)K Sampling site temp (OK)P Sampling site pressure (mm Hg)
0.0493 sampling rate in L/min at 760 mm Hg and 25°C
ppm = (mg/m 3 )(24.46/44.01) = (mg/m 3 )(0.5553)
3.8. Safety precautions (analytical)
3.8.1. Avoid skin contact and inhalation of all chemicals.
3.8.2. Restrict the use of all chemicals to a fume hood if possible.
3.8.3. Year safety glasses and a lab coat at all times while inthe lab area.
4. Backup Data
4.1. Detection limit data
The injection size listed in the analytical procedure (0.4 ~L) wasused in the determination of the detection limit of the analyticalprocedure. The detection limit of 0.2 pg of ethylene oxide wasdetermined by analyzing a dilute standard equivalent to 0.03 ~g ofethylene oxide per sample. Shown in Figure 4.1. is a chromatogramof this analysis made on a Hewlett-Packard 5840A GC equipped withan electron capture detector se( at an attenuation of 16. Thechart speed was set at 0.2 cm/min.
4.2. Detection limit of the overall procedure and reliable quantitationlimit data
samples were prepared by injecting 0.03 ~g of ethylene oxidesix monitors. The samples were then later desorbed and ana
to determine the amount recovered. Since recovery was high
49-10

I
and approximately equal to the detection limit of the analyticalprocedure, the detection limit of the overall procedure and thereliable quantitation limit are taken to be 0.03 ~g per sample(0.7 ppb or 1.3 ~g/m3). The results of this study are given inTable 4.2.
Table 4.2.Detection Limit Data
% recovery statistics
96.300 i70.'
91.793.096.091.7
x =SD
1.96 SD
94.62.95.7
4.3. Sensitivity and Precision (analytical method only)
The sensitivity and preCISIon of the analytical procedure weredetermined from multiple injections of analytical standards.These data are given in Table 4.3. and Figure 4.3.
Table 4.3.Sensitivity and Precision Data
x target cone.~g/sample
ppm
area counts
XSDCV
0.5x Ix 2x21.3 42.6 85.20.50 1.00 2.00
1311000 2506000 47140001289000 2528000 47160001 ':l1 ':If"\f"\f"\ 2538000 4765000~J~-Jvvv
1339000 2546000 47270001314000 2497000 47300001324000 2555000 4716000
1315000 2528000 472800016500 22800 19300
0.0125 0.009 0.004
cv ~ 0.009
4.4. Recovery data (storage)
Storage samples were generated from test atmospheres (air at approximately 80% relative humidity) containing ethylene oxide atapproximately 8 ppm. The samples were generated at ambient temperatures (20-25°C) and pressures (660-665 mm Hg) by exposing the
49-11
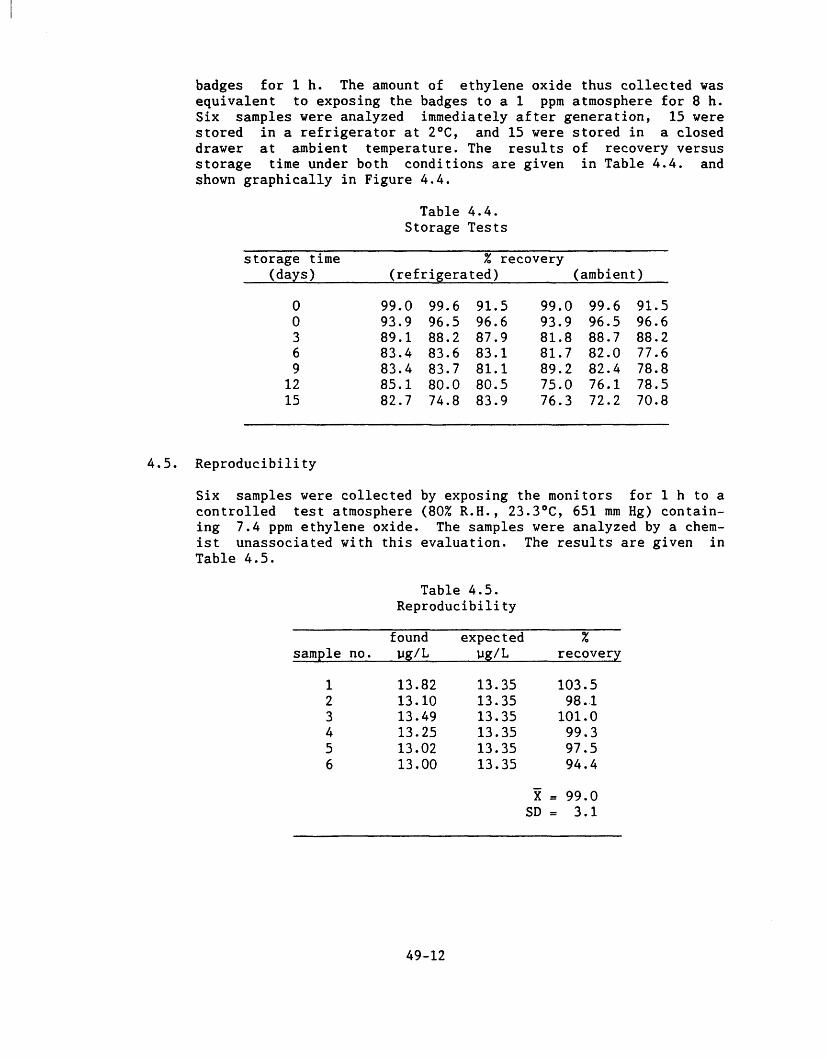
badges for 1 h. The amount of ethylene oxide thus collected wasequivalent to exposing the badges to a 1 ppm atmosphere for 8 h.Six samples were analyzed immediately after generation, 15 werestored in a refrigerator at 2°C, and 15 were stored in a closeddrawer at ambient temperature. The results of recovery versusstorage time under both conditions are given in Table 4.4. andshown graphically in Figure 4.4.
Table 4.4.Storage Tests
storage time % recovery(days) (refrigerated) (ambient)
0 99.0 99.6 91.5 99.0 99.6 91.50 93.9 96.5 96.6 93.9 96.5 96.63 89.1 88.2 87.9 81.8 88.7 88.26 83.4 83.6 83.1 81.7 82.0 77.69 83.4 83.7 81.1 89.2 82.4 78.8
12 85.1 80.0 80.5 75.0 76.1 78.515 82.7 74.8 83.9 76.3 72.2 70.8
4.5. Reproducibility
Six samples were collected by exposing the monitors for 1 h to acontrolled test atmosphere (80% R.B., 23.3°e, 651 mm Bg) containing 7.4 ppm ethylene oxide. The samples were analyzed by a chemist unassociated with this evaluation. The results are given inTable 4.5.
Table 4.5.Reproducibility
found expected %sample no. )Jg/L )Jg/L recovery
1 13.82 13.35 103.52 13.10 13.35 98.13 13.49 13.35 101.04 13.25 13.35 99.35 13.02 13.35 97.56 13.00 13.35 94.4
X 99.0SO = 3.1
49-12

4.6. Desorption efficiency
The desorption efficiency was determined by injecting knownamounts of ethylene oxide standards (in THF) into the monitors.
,The samples were analyzed the next day after storing at room temperature in a closed drawer.
Table 4.6.Desorption Efficiency Data
4.7. Chromatogram
x target conc.llgisampleppm
desorptionefficiency,%
XSO
x = 96.9
O.5x21.30.50
96.699.098.697.095.794.9
97.01.6
1x42.61.00
95.195.595.597.395.195.1
95.60.86
2xn~ "O~.L.
2.00
97.499.597.798.098.698.2
98.20.74
A chromatogram is shown in Figure 4.7. The chromatogram represents a 0.4-11L injection of a standard equivalent to 42.6 llg ofethylene oxide per sample. This concentration is equal to 1.0 ppmfor an 8-h exposure of a monitor.
49-13

t III II II
III 1111
1111 II
III IIIII II
IU II
m II1111 II111 II II
III II II111 II IIIII II II
1'1 II III I II~ III I 11M II
II It~ III I II. III I III II II H F A A 0 e r i vat i v eII IIIMI 0 f 2 - B rom 0 6 t han 0 I
I I IU II III I 1111 11 Il
,IIII~III II jII III III II I' 1\II H' I ,1\ II ItII '\ 1\/ ~ Iy~~ \r ~ IW
~ V~
Figure 4.1. Detection limit chromatogram.
49-14

988118 27 36 45 54 63 72U~ ETHYLEHE OXIDE PER SAft'LE (D[~ORIED WITH 1.6 ftL)
ZOft. T..perature. CDe9 el,Col~ Oven 1••Injec tor 2••l.tectorl£C) 3••
Colu.n.18 ~t. X 1/8 In. SS1811: SPleea one8/188 Supelcoport
CAr,.ie,. c;&SIA,. / ... thane. 95/(;28 a!..""a1n
• &11••••
.11••••• ,--.............'T'9"'-.............,...--......PT""-.....-'PT"'......................""T"'..............--r-_.........,........-............,._......_.....,~ .....-.....
&88••••
1.88••••
1&81••••
1518....
••••••••
•~~1I18.1••~o~J6••••••
•~41111'''.
Figure 4.3. Sensitivity.
77
89
> 'lit.Q;
'"'>3 ss'"'&
..... 44
ller""'- "T""'---"""T" - .....,r"""" .-.. .,......-_ ~ ""'T"" _ ...., ~ ..."
..... & . -:-.-.a __ & ...........
~ --- .. -.
I -----:~I&~=~T-=·=-=·11K=:::-==:~:~:-~:~-:~::~:-~-;-R~--~--~-~-=--=--j.::::::::- _ A R __n
---::::::::____ A I:l• '_. R
.-.~:----------------------------- .-... -- - ------ ------_ ... - .. _----
33
22
11
R£FRIc;(RATED SA"PL(S
PAFuUOL 1C CURVE:TOTAL STn ERROR O~ EST-S.oj9S~ COHfIDEHC£ LIMIT- +or-(1.~i.S.6~)
9S~ COHFIDEHC£ LIMIT -.or-11.1
AMfll£HT SAMPLES
PAR~"Ol1 C CIJI(V(TOTAL STD ERROR O~ E~T·o.35
is'~ COHflDE:I4C£ LIMIT: +0"-'1.~o.6.35)
's~ COHFIDEHC£ LIMIT -.or-12.4
1S.013.5\2.010 .56.0 7.S ~.O
STOR~'( TI"E ID~Y:1".53.e1.6
e~-......._ ........._-~----'---_ ..................._~_ .......--~--_--...--- ......_ ......._-_....J......_-......,ji.0
Figure 4.4. Storage samples.
49-15

1..0
Figure 4.7. Chromatogram of a 42.6 ~g/mL standard.
1.0 1 ~"7-.LV

5. References
5.1. 3M/Occupational Health and Safety Products Division "DiffusionalMonitoring For Ethylene Oxide", 3M Center, St. Paul, MN 55144
5.2. Qazi, A.H,; Ketcham, N.H. Am. Ind. Hyg. Assoc. J. (1977), (38),635-647.
5.3. Potter, Yayne "OSHA Method No. 30, Ethylene Oxide", August 1981,OSHA Analytical Laboratory, Salt Lake City, Utah 84165.
5.4. "Occupational Exposure to Ethylene OXide", "Federal Register, June22, 1984, (49), 25734-809.
5.5. Cummins, K.J. "OSHA Method No. 50, Ethylene Oxide", September1984, OSHA Analytical Laboratory, Salt Lake City, Utah 84165.
5.6. "Current Intelligence Bulletin No. 25, Ethylene Oxide", May 22,1981, u.S. Dept. of Health and Human Services, Public Health Service, Center for Disease and Control, NIOSH.
5.7. J.N. Cawse in "Kirk-Othmer Encyclopedia of Chemical Technology",Vol. 9, pp. 432-471, 3rd ed., John Yiley and Sons, N.Y. 1980.
49-17