![OOS for web[1]](https://static.fdocuments.in/doc/165x107/544c2b66af7959a8438b5a86/oos-for-web1.jpg)
LOG950 Logistics Title:On the Shelf availability in Food ... · In our proposed research we are...
101
Master’s degree thesis LOG950 Logistics Title:"On the Shelf availability in Food Based Discount Stores Molde Grocery Environment" Author(s)Muhammad Rizwan Erland Berg Hansen Number of pages included the first page: 101 Molde, Date: 25th of May, 2009
Transcript of LOG950 Logistics Title:On the Shelf availability in Food ... · In our proposed research we are...

Master’s degree thesis
LOG950 Logistics
Title:"On the Shelf availability in Food Based Discount
Stores Molde Grocery Environment"
Author(s)Muhammad Rizwan
Erland Berg Hansen
Number of pages included the first page: 101
Molde, Date: 25th of May, 2009
Publication agreement
Title: On the Shelf availability in Food Based Discount Stores Molde Grocery Environment
Author(s): Muhammad Rizwan, Erland Berg Hansen
Subject code: LOG 950
ECTS credits: 30
Year: 2009
Supervisor: Bjørn Guvåg
Agreement on electronic publication of master thesis
Author(s) have copyright to the thesis, including the exclusive right to publish the document (The
Copyright Act §2).
All theses fulfilling the requirements will be registered and published in Brage HiM, with the approval
of the author(s).
Theses with a confidentiality agreement will not be published.
I/we hereby give Molde University College the right to, free of
charge, make the thesis available for electronic publication: yes no
Is there an agreement of confidentiality? yes no
(A supplementary confidentiality agreement must be filled in)
- If yes: Can the thesis be online published when the
period of confidentiality is expired? yes no
Date: 25.05.2009

Table of Contents
List of abbreviations ......................................................................................................................................... 6
Acknowledgement ............................................................................................................................................ 7
Introduction ............................................................................................................................................................. 8 1.1 Objective of the study ....................................................................................................................... 8
1.2 Research Motivation ......................................................................................................................... 9
Chapter 1 – Research Problem .............................................................................................................................. 10 1.3 Alternative research option to study OOS in retail environment..................................................... 11
1.4 Research Questions ......................................................................................................................... 12
Chapter 2 - Literature Review ............................................................................................................................... 13 2.1 Retail out of Stock ........................................................................................................................... 13
2.2 On the shelf Availability ................................................................................................................. 14
2.3 Reasons behind out of stock ............................................................................................................ 17
2.4 Proposed model ............................................................................................................................... 18
2.5 Ordering practices ........................................................................................................................... 19
2.5.1 Inaccurate forecasts and insufficient ordering ............................................................................. 19 2.5.2 Monitoring and control of forecasting process ............................................................................ 22 2.5.3 Forgot to order ............................................................................................................................. 22
2.6 Replenishment practices .................................................................................................................. 22
2.6.1 Lack of an adequate signal to the retail management when OOS ................................................ 22 2.6.2 Poor back-room inventory handling procedures .......................................................................... 23 2.6.3 SKU misplaced ............................................................................................................................ 24 2.6.4 Product variety ............................................................................................................................. 24 2.6.5 Inventory level ............................................................................................................................. 25 2.6.6 Employee turnover ....................................................................................................................... 25 2.6.7 Customer shopping habits ............................................................................................................ 26 2.6.8 Frequency with when to replenish shelves .................................................................................. 26
2.7 Planning practices ........................................................................................................................... 27
2.7.1 Communication and discontinued SKUs ..................................................................................... 27 2.7.2 Errors in picking routines at wholesaler or supplier .................................................................... 28 2.7.3 New item being planned .............................................................................................................. 29 2.7.4 SKU not activated in order system .............................................................................................. 29 2.7.5 Insufficient control of incoming shipments ................................................................................. 29 2.7.6 Allocated shelf space ................................................................................................................... 30 2.7.7 Poor plan-o-gram compliance ...................................................................................................... 32 2.7.8 Poor planning of supply chain promotions .................................................................................. 32 2.7.9 Design of retail outlet .................................................................................................................. 33
2.8 Vendor Managed Inventory (VMI) ................................................................................................. 34
Chapter 3 - Research Methodology ....................................................................................................................... 35 3.1 Case study Method .......................................................................................................................... 36
3.2 Sources of Evidence in Case studies ............................................................................................... 37
3.3 Research Design .............................................................................................................................. 37
3.4 Case Study Participants ................................................................................................................... 39
3.4.1 Norgesgruppen – Kiwi and Bunnpris .......................................................................................... 39
4
3.4.2 Ica Norge - Rimi .......................................................................................................................... 40 3.4.3 Coop NKL – Coop Prix ............................................................................................................... 41 3.4.4 Rema 1000 – ................................................................................................................................ 41
Chapter 4 – Analysis & Presentation of Results ................................................................................................... 42 4.1 Reasons behind out-of-stock at retail outlet .................................................................................... 42
4.1.1 Retail store 1 (R1) ........................................................................................................................ 42 4.1.2 Retail store 2 (R2) ........................................................................................................................ 49 4.1.3 Retail store 3 (R3) ........................................................................................................................ 54 4.1.4 Retail store 4 (R4) ........................................................................................................................ 61 4.1.5 Retail store 5 (R5) ........................................................................................................................ 68
4.2 Analysis of Results .......................................................................................................................... 72
4.2.1 Average OOS ............................................................................................................................... 72 4.2.2 Molde OOS average for each day ................................................................................................ 73 4.2.3 OOS during Mondays and Thursdays on each store .................................................................... 73 4.2.4 Reasons behind OOS and comparison among Molde average, Europe and World Average ....... 75 4.2.5 Employee Turnover and OOS due to Replenishment practices ................................................... 79 4.2.6 Knowledge of EDI and OOS ....................................................................................................... 79 4.2.7 OOS performance comparison of different retailers within the same group................................ 80 4.2.8 VMI and out-of-stock .................................................................................................................. 82 4.2.9 Retail management opinion on major causes for OOS at retail outlet ......................................... 83
4.3 Discussion ....................................................................................................................................... 84
4.4 Shortcoming and limitation of our research: some suggestions for Future research ....................... 85
References ............................................................................................................................................................. 88
5
Table of figures
Figur 2.5.1-1 Consumer response to stock outs ................................................................................................... 16
Figur 2.5.1-1 Reasons for OOS at store level ....................................................................................................... 18
Figur 2.7.9-1 Iterative Process ............................................................................................................................. 36
Figur 4.1.1-1 Physical inventory deviation from system inventory record .......................................................... 44
Figur 4.1.1-2 Out-of-stock caused by replenishment practices ............................................................................. 45
Figur 4.1.1-3 Out-of-stock caused by planning practices ...................................................................................... 47
Figur 4.1.1-4 Out-of-stock caused by planning practices ...................................................................................... 48
Figur 4.1.1-5 OOS with none or insufficient response .......................................................................................... 48
Figur 4.1.2-1 Out-of-stock caused by order practices ........................................................................................... 49
Figur 4.1.2-2 Out-of-stock caused by order practices ........................................................................................... 50
Figur 4.1.2-3 Out-of-stock caused by order practices ........................................................................................... 51
Figur 4.1.2-4 Out-of-stock caused by order practices ........................................................................................... 52
Figur 4.1.2-5 Out-of-stock caused by order practices ........................................................................................... 53
Figur 4.1.3-1 Out-of-stock caused by order practices ........................................................................................... 54
Figur 4.1.3-2 Out-of-stock caused by replenishment practices ............................................................................. 55
Figur 4.1.3-3 Out-of-stock caused by planning practices ...................................................................................... 57
Figur 4.1.3-4 Out-of-stock caused by planning practices ...................................................................................... 59
Figur 4.1.3-5 Out-of-stock caused by planning practices ...................................................................................... 59
Figur 4.1.3-6 OOS with none or insufficient response ......................................................................................... 60
Figur 4.1.4-1 Out-of-stock caused by order practices ........................................................................................... 61
Figur 4.1.4-2 Out-of-stock caused by replenishment practices ............................................................................. 63
Figur 4.1.4-3 Out-of-stock caused by planning practices ...................................................................................... 64
Figur 4.1.4-4 Out-of-stock caused by planning practices ...................................................................................... 66
Figur 4.1.4-5 Out-of-stock caused by planning practices ...................................................................................... 66
Figur 4.1.4-6 Out-of-stock caused by planning practices ...................................................................................... 67
Figur 4.1.4-7 OOS with none or insufficient response .......................................................................................... 67
Figur 4.1.5-1 Out-of-stock caused by order practices ........................................................................................... 68
Figur 4.1.5-2 Out-of-stock caused by order practices ........................................................................................... 69
Figur 4.1.5-3 Out-of-stock caused by order practices ........................................................................................... 70
Figur 4.1.5-4 Out-of-stock caused by order practices ........................................................................................... 71
Figur 4.2.1-1 Average out of stock ....................................................................................................................... 72
Figur 4.2.2-1 Molde average for each day ........................................................................................................... 73
Figur 4.2.3-1 OOS during Monday and Thursday ............................................................................................... 73
Figur 4.2.3-2 Categories of products that go OOS ............................................................................................... 74
Figur 4.2.4-1 Reasons behind OOS ...................................................................................................................... 75
Figur 4.2.4-2 Comparison of reasons for OOS .................................................................................................... 76
Figur 4.2.4-3 Delivery frequency and OOS at all stores ...................................................................................... 78
6
Figur 4.2.5-1 Relationship between Employee turnover and OOS due to Replacement Practices ...................... 79
Figur 4.2.6-1 EDI knowledge and OOS ............................................................................................................... 80
Figur 4.2.8-1 Vendor Managed Inventory and out-of-stock ................................................................................ 82
List of abbreviations
CPR – Continuous Product Replenishment
CRP – Continuous Replenishment Process
EAN – European Article Number
EDI – Electronic Data Interchange
EDLP – Every Day Low Price
FMCG – Fast Moving Consumer Goods
OOS – Out Of Stock
OSA – On the Shelf Availability
POS – Point of Sales
SKU – Stock Keeping Unit
VMI – Vendor Managed Inventory
VMO – Vendor Managed Order
Appendix
Appendix A: Interview part 1 - Store level
Appendix B: Interview part 2 - Store level
Appendix C: Interview part 3 - VMI
7
Acknowledgement
We would like to show our gratitude to all those who helped us completing this project. First
of all we would like to thank our supervisor Bjørn Guvåg. Moreover we are grateful to all
those people working at Bunnpris Sentrum, Kiwi Nordbyen, Coop Prix Granlia, Rimi Roseby
and Rema Reknes., who helped us finding reason for OOS. Special thanks to the retail
managers in these stores.
In addition to store employees there were many people in regional and Head offices of the
companies we studied, especially Sven Ivar Lona at Norgesgruppen, Arild Sørlien, Petter
Ove Krågsæther and Ståle Langolf at Coop Orkla Møre. We would also like to give a big
shout out to our family and friends, the Almighty from above. If you‘re not mentioned, you
probably shouldn‘t be here. Peace, one love and we out.
University College Molde Authors
May 2009 Muhammad Rizwan
Erland Berg Hansen
8
Introduction
In today‘s competitive environment, retailers are faced with one important question:
“How can we deliver good service levels to our customers, while becoming more cost efficient
at the same time”?
Part of offering better customer service can be considered as offering wider variety of
products (Verhoef and Sloot 2006). However, offering more variety in products and brands
has two important consequences. First, retailers are confronted with more costs in the supply
chain, due to higher inventory, procurement, handling, and warehouse costs. Second, more
variety also increases the probability that out-of-stocks (OOS) may occur, which may lead to
customer dissatisfaction and (temporary) store disloyalty. As retailers strive to compete with
discounters on service, OOS can severely jeopardise their competitive position in the
consumers mind. According to Vuyk (2003), out of stock situation not only reduces turnover
but also loss of customers as well. In 20% cases store switching is due to out of stock
situations.
That‘s why it is important for retail business people to manage their assortments in a
professional way. In managing the assortment they must strive for an optimal assortment,
which at the same time creates customer satisfaction by offering the customers‘ required
products, reduces supply chain costs, and minimises OOS levels. The minimisation of OOS
levels is not an easy task for retailers. Retailers have been struggling with out-of-stock
situation for decades with little evidence of improvement (Corsten and Gruen 2002). The
OOS can also cause brand switching, so it is matter of concern for the manufacturers as well.
We don‘t suggest 100% service level. But it is objective of Marketing to enhance customer
satisfaction better than the competitors while considering profitability of the firm. In any case
it is job of the retailers to make a product available for the customers at right time, at right
place, in right quantity.
1.1 Objective of the study
In our proposed research we are looking forward to study this phenomenon of OOS in retail
business environment. We will find out what are the logistical reasons behind OOS for a retail
outlet. So we propose the topic as, ‗On the Shelf availability in Molde grocery environment‘.
9
The proposed topic clearly suggests about the scope, that we shall look for only logistical
reasons behind OOS. Financial- or environmental reasons are out of our scope.
Due to limited budget we can focus only one Molde. Molde is a good representative town, as
discount stores from the four largest grocery chains are present (Coop Norge, Bunnpris,
Norgesgruppen, Ica Norge and Rema). So we will be in a good position to develop an insight
about the issue by comparing major food based retail business of Norway.
1.2 Research Motivation
Retailing today is an exciting field. The largest enterprise of the world for last many years
belongs to this industry. After USA, retailing is growing into a big business in rest of the
world. In future retailers will face intense competition for providing better customer service
and managing their costs. OOS can be suicidal for any retailer, if not given attention. Through
this study we will try to identify an OOS problem for retail business in Norway. According to
Norwegian Ministry of Trade and Industry statistics, retailing business contribute 14.34% in
GDP and provides employment to 302,400 people directly. That shows its valuable economic
impact on the country. Net sales of Norwegian grocery market were 14 Billion USD in 2003
(Denstadli et al. 2005) and four major groups account for 99% of total sales and 49% of the
total volume goes to discounters. In our study we are focusing on EDLP (Every Day Low
Priced) stores that are major form of retailing in Norwegian economy.
This way we can say that this study will have considerable impact on the industry in
particular. At micro level it will help retailers to do better for customer satisfaction and for
their own profitability. As OOS causes lost revenues of more than 11% of gross sales (Chary
and Christoper 1979), and according to Corsten and Gruen (2002) European OOS rates are
between 7 to 10% in various categories. It is 5% for canned food, 18% for fresh meal and
even 32% for women stockings.
The current study revealed that there is no single reason for retailers to go OOS, store
management, suppliers, and wholesalers all factor can cause OOS. But the two most
important reasons of OOS are retail store operations and vendors.
10
Chapter 1 – Research Problem
”…We are never out of stock; our objective is to give full service to our customers, so we
offer them all goods at the lowest possible price”.
This is a statement of an owner manager of a retail store in Molde. The discussion with him
led to many questions. If they were never out of stock, how is it possible to maintain 100%
service level all the time? A stroll through the store told a different story. There were many
empty shelves with no goods. Was it really true that they always maintain 100% level in
store? When we pointed out the manager about the empty shelves, he blamed the supplier,
that sometimes we have such situation, this is always due to poor performance of supplier.
The supplier may be out of stock, that‘s why occasionally we may be out of stock.
The discussion with the manager motivated us to further investigate the matter more
scientifically, and we decided to take this a topic of our master thesis. Broadly this topic
covers reasons behind out of stock in retail grocery environment of Molde. We are looking for
what causes a retail store to go out of stock. A large body of knowledge deals with retail out
of stock. For the first time a comprehensive examination of the stockout problem was
sponsored by a trade magazine, Progressive Grocer (1968). It measured stockout frequencies
in grocery stores as well as consumer response stockouts (Zinn and Liu 2008). In recent times
there have been many more studies by Emmelhainz et al. (1991), Verbeke et al. (1998),
Campo et al. (2000), Gruen et al. (2002), Corsten and Gruen (2003) and Sloot et al. (2005)
who continued this theme in determining factors which induce consumer reactions, such as
the product category, the nature of brand loyalty, consumer type and the immediacy of need.
So all of these studies were somewhat related to measure consumer response as a result of
OOS situation at retail.
11
OOS situation is too costly for retailers, as it can cause loss in revenue; the study conduct in
1968 for Progressive Grocer measured more than 11% reduction in sales. Emmelhainz et al.
(1991) research results show, for instance, that a stock-out can make a manufacturer lose
more than 50% of his customers to competitors, on the other hand retailers face the loss of up
to 14% of the buyers of the missing product. This revenue loss not only due to lost sales
during the OOS period, but can also extend to later periods and sometimes other product
categories.
To minimize OOS, it is important to find out factors that cause such problem. There was very
little work done on reason behind out of stock in retail environment. Corsten and Gruen
(2002) studied the challenges of out of stock, and they tried to find out reason behind OOS in
grocery environment. They, after examining 40 studies, found average OOS rate worldwide
was 8.3 per cent. The highest reported rate was 12.3 % and the lowest was 4.9%. This
variation is due to management practices and the methodology that was used to measure out
of stock. They categorized reasons in to four levels in supply chain and three functional areas
including planning ordering and replenishing. According to their study ―three-quarters of out-
of-stocks are caused by retailer store ordering and forecasting practices or by shelf re-stocking
practices‖. It is quite a high percentage.
1.3 Alternative research option to study OOS in retail environment
While looking into various literature sources we found two possible research streams as
shown in figure 1.1.
Figure 1.3-1Alternative research streams to study OOS
We built our study on first two factors in the diagram shown above. Our major emphasis is to
categorize reasons behind OOS. We tried to identify to what extent OOS is caused at retail
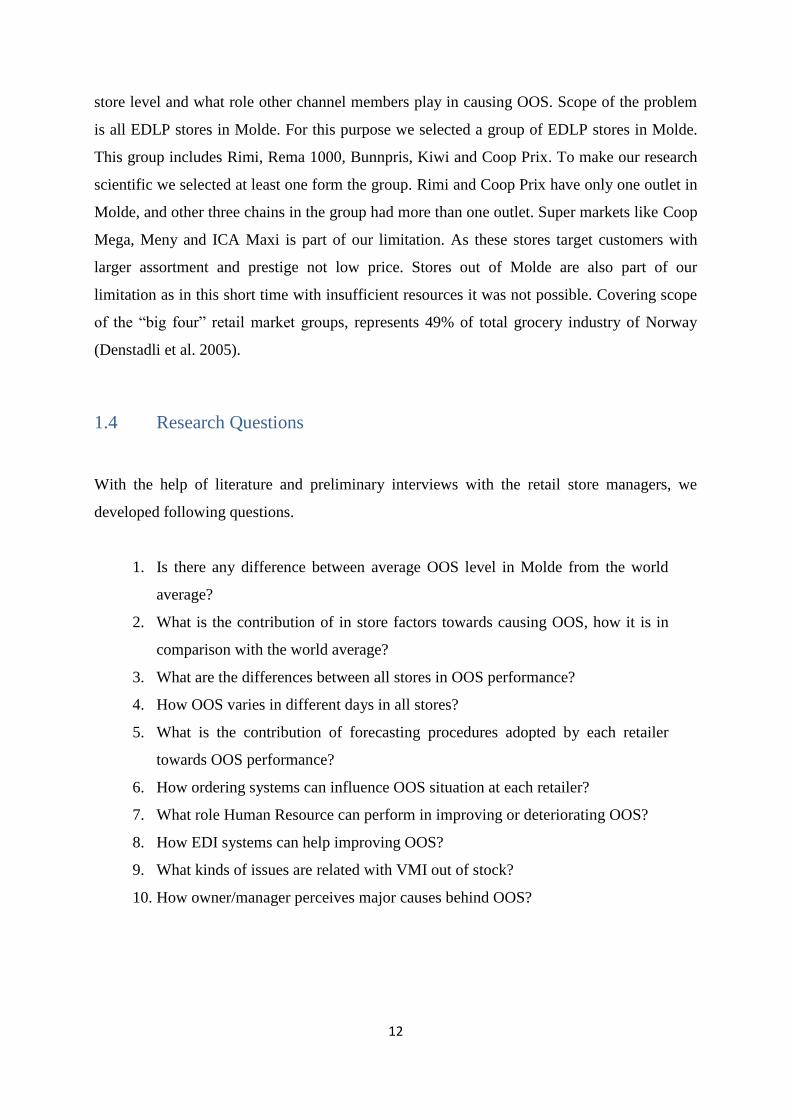
12
store level and what role other channel members play in causing OOS. Scope of the problem
is all EDLP stores in Molde. For this purpose we selected a group of EDLP stores in Molde.
This group includes Rimi, Rema 1000, Bunnpris, Kiwi and Coop Prix. To make our research
scientific we selected at least one form the group. Rimi and Coop Prix have only one outlet in
Molde, and other three chains in the group had more than one outlet. Super markets like Coop
Mega, Meny and ICA Maxi is part of our limitation. As these stores target customers with
larger assortment and prestige not low price. Stores out of Molde are also part of our
limitation as in this short time with insufficient resources it was not possible. Covering scope
of the ―big four‖ retail market groups, represents 49% of total grocery industry of Norway
(Denstadli et al. 2005).
1.4 Research Questions
With the help of literature and preliminary interviews with the retail store managers, we
developed following questions.
1. Is there any difference between average OOS level in Molde from the world
average?
2. What is the contribution of in store factors towards causing OOS, how it is in
comparison with the world average?
3. What are the differences between all stores in OOS performance?
4. How OOS varies in different days in all stores?
5. What is the contribution of forecasting procedures adopted by each retailer
towards OOS performance?
6. How ordering systems can influence OOS situation at each retailer?
7. What role Human Resource can perform in improving or deteriorating OOS?
8. How EDI systems can help improving OOS?
9. What kinds of issues are related with VMI out of stock?
10. How owner/manager perceives major causes behind OOS?
13
Chapter 2 - Literature Review
2.1 Retail out of Stock
Every one of us has experience to visit retail stores to buy our daily food stuff. A grocery
store may take different forms in different parts of world. According to Kotler (2003)
―Includes all activities involved in selling goods or services directly to final consumers‖. The
retail store can take different forms. They vary in size, level of service, ownership status and
assortments they carry. They are given different names based upon these variables. They can
be classified as convenience store, super market, departmental store, discount store and hyper
market.
Grocery shopping normally follows a pattern and that includes a considerable amount of
habitual and low involvement behavior. According to Art and Ron (2004) some grocery
purchasers do organized shopping by preparing written lists for the major grocery shopping
trip, whilst others do not. Apparently, individuals in this latter group either prepare some
mental list, or have no list at all but choose instead to use a store's environment and its shelves
as cues. In any case all shoppers have something in their mind or on paper before they go for
grocery shopping. Everyone has a routine of buying grocery items; Watkins (1984) suggested
that reutilized behavior incorporated pre-planning in our daily food purchases.
As a shopper when we visit any grocery store with pre-planned intentions to buy certain
items, and during shopping we don‘t find our desired products, it creates dissatisfaction. This
dissatisfaction can lead to different responses of shoppers. In most of the cases they go for
substitution. This substitution can cause loss for retailer or manufacturer. Retailer may lose a
customer and manufacturer can suffer from losing a consumer for good.
In logistics and supply chain literature, when a shopper does not find item of his or her own
choice on shelf in a retail store, the retailer is considered out of stock. Apparently it is easy to
say what is out of stock, but like any researchable issue it has its own dimensions. Generally,
two types of out of stock can be identified: item and Brand. In first case an SKU of a brand

14
may be out of stock and in second case all variants of a single brand in a product group may
be out of stock. It may be product or a brand. The literature available does not say much about
it.
Researchers are defining OOS in measurement terms. For example Gruen and Corsten (2002)
define OOS ‗the first and most widely used definition of OOS is the percentage of SKUs that
are OOS on the retail store shelf at a particular moment in time (ie, the consumer expects to
find the item but it is not available). A second and alternative consumer based definition of an
OOS, is the number of times a customer look for the SKU and does not find it. The
percentage rate is calculated as the number of times the consumer does not find the SKU
divided into the sum of the times the consumer does find the SKU, plus the number of times
the consumer does not find it.
In the following sections of the chapter we would discuss various concepts related to out-of-
stock in retail market. We used took help from published literature to describe these concepts.
2.2 On the shelf Availability
Availability is a basic issue of good retail management but, as Walters (1994) discussed, it is
also an expensive facet of retailing. Assuring availability demands cost at all points in the
distribution chain, including shipping, stockholding (i.e. storage and warehousing),
distribution, and at the point of sale. Owing to the cost of assuring availability, most retailers
are selective and try to offer high levels of availability only for competitive reasons (Walters,
1994). Good customer service requires appropriate number of supplies. It is causes
dissatisfaction for customers to find an item they like only to be informed that it is out of
stock (Heung & Cheng, 2000).
When a shopper does not find the desired item, it will lead to substitution. Many researchers
attempted to measure responses of shopper when they don‘t find their desired item in shelves.
According to Sloot et al (2005) consumer may have six different responses:

15
store switch
item switch
postponement
cancel
category switch
brand switch
First response is much important from retailer point of view as is can result in store disloyalty
and other are of relevance with manufacturer. As we are studying with reference to retailer so
this response is of great importance for us.
It is interesting to see that consumers have different responses in OOS situation for different
product categories. According to Gruen and Corsten (2004) in case of cosmetics 43%
customers will switch the store and for coffee store switch is 29%. In a study conducted in 29
countries on 71,000 respondents, on average 31% consumers will switch store, 26% will
switch brand, 19% item switch, 15% postpone and 9% cancel the purchase. While looking in
to this data we can assume that OOS can have serious consequences. Here one thing is
important; all studies were measuring immediate response. OOS has its long term
implications as well. If a consumer does not find her choice in a store, she may switch the
brand for the moment, but for the next time she may not consider buying from the same store.
In this way such situation may result in even worse.
This is an important issue for the retailers to define level of service they want to maintain for
their customers. Keeping all items are not possible sometimes, as it may be very expensive.
But empty shelves tell a lot about retailers. When a shelf space in unoccupied, it causes some
cost too for the retailer. So they have to make a wise decision about service level they want to
maintain. Here we should also consider this point with reference to online buying. It is easy to
decide about substitution in a typical grocery store, as most of the items are visible. Suppose a
200mg detergent is not available for a specific brand, shopper may select a 400mg detergent
from the same shelf. Shopper satisfaction is a question in this case. Products out of stock or,
in the case of online orders, substitutions, are the inherent weakness of online ordering. Buyer
does not have much control over substitution (Boyer 2004), the retailer now takes
16
responsibility for picking items, instead of the customer. Thus, at best, substitutions match
what the customer would have done at worst, they are completely wrong. As online shopping
trend is growing in most part of the world so this is a bigger challenge for the online seller in
future.
In the following discussion we would emphasis only on physical grocery stores and try to
explain the phenomenon of OOS. A 1996 study estimated that 8.2% of items in supermarkets
are out-of-stock in a typical afternoon. This is an improvement over the average of 12.2%
obtained in a similar study in 1968 (Zinn and Liu 2001). While the two numbers may not be
directly comparable because of the differences in the methodologies employed and the
changes in the products sold in the 28 year span separating the two studies, these
independently obtained results converge in demonstrating the importance of the retail
stockout problem. OOS is not a problem itself. Issue is how a shopper will respond to this
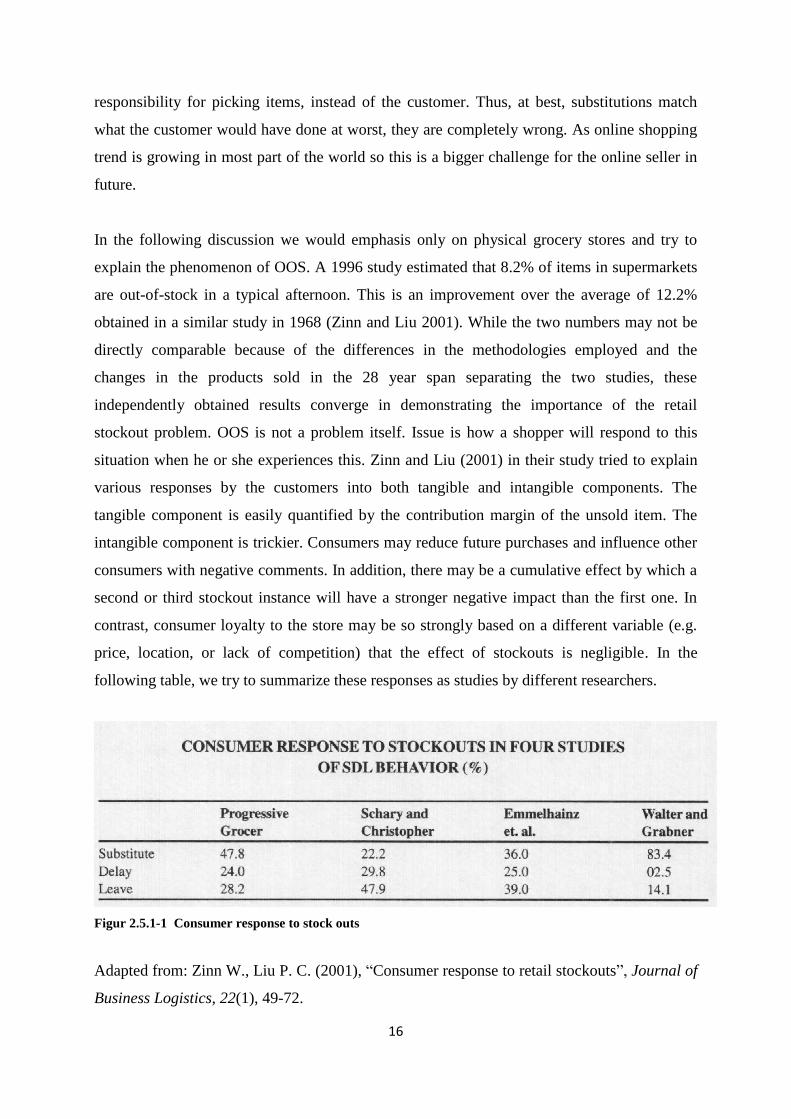
situation when he or she experiences this. Zinn and Liu (2001) in their study tried to explain
various responses by the customers into both tangible and intangible components. The
tangible component is easily quantified by the contribution margin of the unsold item. The
intangible component is trickier. Consumers may reduce future purchases and influence other
consumers with negative comments. In addition, there may be a cumulative effect by which a
second or third stockout instance will have a stronger negative impact than the first one. In
contrast, consumer loyalty to the store may be so strongly based on a different variable (e.g.
price, location, or lack of competition) that the effect of stockouts is negligible. In the
following table, we try to summarize these responses as studies by different researchers.
Figur 2.5.1-1 Consumer response to stock outs
Adapted from: Zinn W., Liu P. C. (2001), ―Consumer response to retail stockouts‖, Journal of
Business Logistics, 22(1), 49-72.
17
Campo et al. (2000) studied the consumer responses with reference to cost for consumers.
According to them substitution costs are caused by a decrease in utility when a consumer
switch to another alternative, because of lower preference and/or higher price. Transaction
costs are costs incurred to buy the items. They are not exclusively financial in nature, but
include the time and effort cost of shopping efforts. Transaction costs can be further broken
down into search costs (time and mental effort to find a suitable alternative), handling costs
(including storage costs), and transportation costs. Opportunity cost represents reduction in
utility incurred when consumption in the category is reduced or dropped. Below we represent
their model in more simplified form.
C=SC+TC+OC
Where C is total cost, SC is substitution cost, TC is transaction cost and OC is opportunity
cost.
The response behavior of consumer can be studies with reference to various other variables.
This OOS is not related to instore process; it can be outstore decision process as well (Kotler
and Scott 1993). Particularly a shopper may be reluctant to visit store where he or she
experiences more OOS. Other psychological factors mediate can be consumer cognition and
attitudes are not given and stable, they may vary under the effect of the learning processes. In
addition to this The balance theory (Heider 1946, Alessio 1990) and the cognitive dissonance
(Festinger 1957) are useful to understand why events as OOSs, are big threats for the
retailers. So in any case retailers should try to keep OOS level as low as possible.
2.3 Reasons behind out of stock
Why retailer go OOS. There can be many reasons behind this. Researchers divide them in
four different levels. Some is caused at store level; some at distribution center level,
wholesaler headquarter level and supplier level. Reasons on all these levels can be categorized
into 3 different causes, i.e. Planning, Ordering and Replenishing. According to Corsten and
Gruen (2003) poor store ordering is greatest cause of OOS (34 per cent), store shelving causes
18
25%, Retail Headquarters or manufacturer causes 14%, store forecasting causes 13%,
distribution center causes 10% and other causes are 4%. These reason show different pattern
in different parts of world, as in USA forecasting and order contribute 51% in OOS, and in
Europe these two reason cause 32% of total. In Europe 38% OOS is due to shelving and in
USA it contributes only 22%.
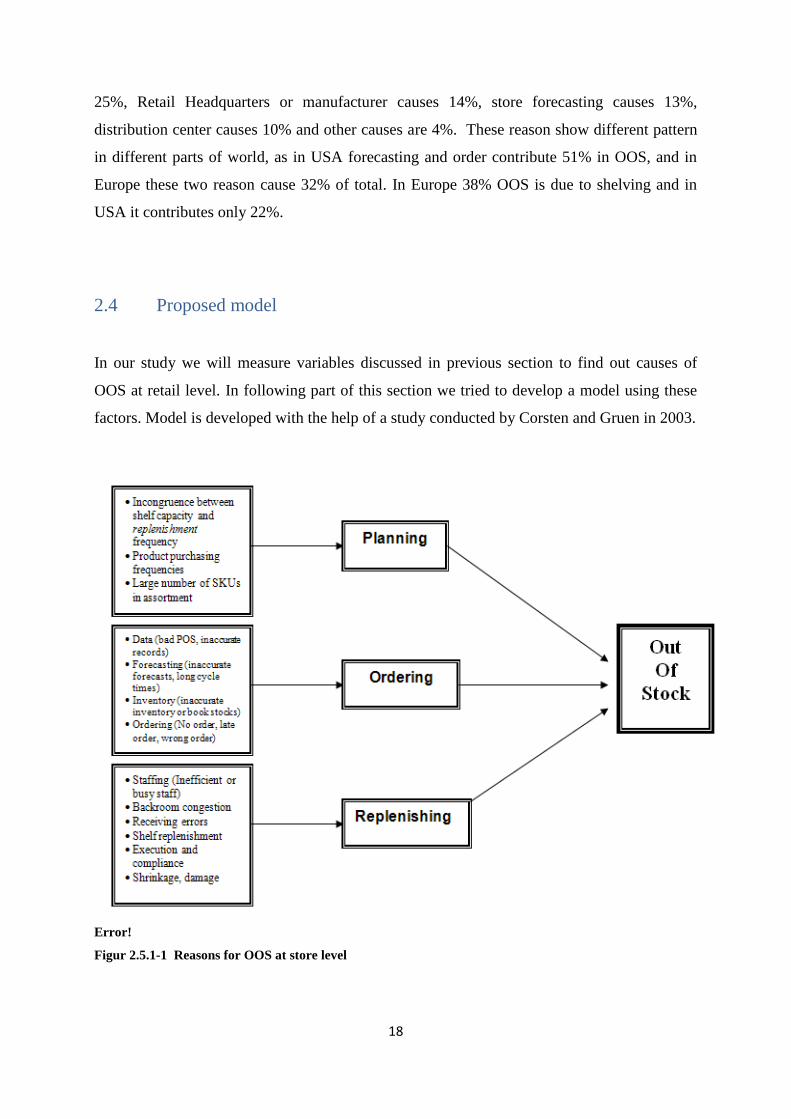
2.4 Proposed model
In our study we will measure variables discussed in previous section to find out causes of
OOS at retail level. In following part of this section we tried to develop a model using these
factors. Model is developed with the help of a study conducted by Corsten and Gruen in 2003.
Error!
Figur 2.5.1-1 Reasons for OOS at store level
19
2.5 Ordering practices
2.5.1 Inaccurate forecasts and insufficient ordering
A retailer may experience stock-out for many reasons. One well known cause is related
to the forecasting process and subsequent insufficient ordering of SKUs. If the retail
manger should happen to miss with the accuracy of the forecasts, this will in turn affect
the level of items available on the shelf. Insufficient forecasting/ ordering could also
happen at the wholesaler and warehouse level.
Below we have listed a few variables that may affect the reliability of the forecast
(make forecasting more difficult).
2.5.1.1 Quality of POS data
Many retailers make use of information systems to support the ordering process.
Forecasts are then commonly based on average sales from the week before. This
kind of detailed information can be translated into each independent SKU, and
further increase the reliability of the forecasts.
The POS data is captured through scanning equipment, which is linked to the
inventory system and back office through an electronic price book (Reid 2003).
Electronic price books provide better control with promotions and product prices,
as one person may adjust price information for multiple stores on a short notice.
However, the POS data that the information systems rely on need to be accurate
(Manhattan Associates 2006), an aspect which not always is the case. For
instance, inexperienced staff (and sometimes even more experienced staff) makes
the POS data suffer from poor routines in the check-out process during busy
periods of the week (Raman et al 2001, DeHoratius and Ton 2008). Consider the
following example:
20
Two similar SKUs might appear identical, and sometimes the cashier scans just
one of the items, twice. As a result the information system inventory record will
show one too many of the one SKU, while the other appear as one less than in the
physical inventory. Bottom line, if the POS data is inaccurate, so will the forecasts
(that are based on POS data) be. This is a situation that could happen quite often,
considering that many retail outlets only match physical inventory with system
inventory records once a year. In worst case, a popular item might actually be
dropped from the assortment because the POS data make it appear as this item is
not selling at all.
2.5.1.2 Length of forecasting cycles
As seasonality and trends have a major impact on the demand pattern, it is vital
that forecasts are updated and aligned with any changes in market demand for
shippable end products (Vitasek 2008). The demand pattern in the grocery
industry might not randomly fluctuate that much on an annual basis, but the retail
management should strive to keep the forecasting cycles short. Longer forecasting
cycles will result in higher levels of OOS, as changes in the demand pattern have
not been updated for a while.
A forecasting cycle should not be shorter than the time retail management need to
re-forecast and execute changes. 1 month forecasting cycle and 2 weeks to
regenerate forecast would remove the inventive for short forecast cycle time (CFO
2004).
2.5.1.3 Seasonality and trends
Sales in the grocery market industry tend to change from one day to the next
(Arnold et al 2008), and the forecasts for independent SKUs should reflect this
matter. If the retail management fail to identify hidden information behind the
21
POS data, statistical output like average sales last week will not have any meaning
at all (any seasonality and trend information need to be attached to the POS data).
Retailers have the option to forecast sales based on POS data captured from the
cash-register, but these figures may not always be reliable. Basically, the concept
is: ―The quantity we sold yesterday is the quantity we will sell tomorrow‖, a
statement that only reflects the reality parts of the time. Seasonal changes are not
considered in this forecasting method (Rostoks 2003).
Forecasting short-term demand/ seasonal product lines has become quite a
challenge over the recent years, as the average number of SKUs in a supermarket
has grown from 6000 items a generation ago to approximately 30 000 items today.
Also, considering that the life cycle of products has been dramatically reduced
over the past years, there are simply too many items and too little data for each
SKU, to construct a reliable forecasting model for each seasonal item
independently (Dekker et al 2004).
2.5.1.4 Sales and promotional activities
Sales activity can be assigned to 2 main categories, promotional and clearance
(Harrison 2008), both adding to the challenge of forecasting. Promotional sales
include:
seasonal sales
one-day sales
holiday sales
Both promotional and clearance sales aim at increasing the demand through price
reduction. The latter, hold SKUs that the store wishes to remove from the
assortment. Reducing the inventory through price reduction and ―going out of
business‖ sales can also be added to this category.
22
Running promotions and other sales activities on different SKUs, would make it
even more difficult to anticipate real demand. Observations reveal that OOS for
promotional inventory might be as much as twice the amount of OOS for regular
turn inventory (Teradata January 2005).
2.5.2 Monitoring and control of forecasting process
Information systems are no doubt an critical factor to succeed in the retailing business,
and there exists a wide variety of computer software to assist the forecasting process
and thus improve shelf availability. These are sophisticated statistical programs that
show seasonal- and other trends. However, if the retail management does not fully
understand the system capabilities and functions, nor have faith of the system, then the
information technology will contribute minimal to the forecasting process (Moon et al
1998). Forecasts tend to be based on qualitative variables.
2.5.3 Forgot to order
When the retail outlet forgets to execute an order, the warehouse or manufacturer is not
able to make delivery before an item run out on the shelves.
2.6 Replenishment practices
2.6.1 Lack of an adequate signal to the retail management when OOS
In smaller retail outlets (like discount stores), the responsibility of identifying what
SKUs are OOS and need to be ordered, is mainly on the shoulders of the retail manager.
As opposed to the above, supermarkets hold a much wider assortment, presenting an
even greater challenge to keep track on what SKUs are in the shelf at any point in time.
As a result, the responsibility of ordering and checking is allocated to the staff, which

23
will pass forward a signal when an item is missing from the shelves. If such a system
should fail, then in worst case there will be no issued orders for the specific SKU
(Corsten and Gruen 2002).
An adequate signal might also refer to the use of information systems. In order to
improve the replenishment process and subsequently on-shelf availability, Tesco (UK-
based global supermarket chain) make use of balanced scorecards. Green, yellow and
red light indicators provide the staff with a signal when an item is OOS in the shelf
(Businessline 2002).
A third example is the support of RFID (radio frequency identification) tracking tags,
like the ones Wal-Mart apply. Each SKU is equipped with an item level RFID, and
shelf-level readers hint a signal to the staff whenever an item is close to OOS (Kambil
2003).
2.6.2 Poor back-room inventory handling procedures
A retailer carried out a customer survey on product availability verses purchasing
intentions, and estimated about $ 5.000 in lost sales from not having products available
when customer needed them. The SKUs were located in the store, but poor visibility to
on hand quantities in the back-room and returning area made it very difficult to find a
specific item when it was needed (Alexander et al 2003).
The example above is an illustration of how poor back-room inventory handling
procedures could reduce on-shelf availability and sales. Congested storage locations
make it difficult to get an overview about what SKUs actually are available in store
(Corsten and Gruen 2002), something that creates a bottleneck for replenishment of
shelves.
According to survey by the Grocery Manufacturers Association, approximately 75
percent of the time, an OOS-item is sitting in the back-room and nobody can locate it
(Dennison 2006). This very fact underlines the importance of keeping a tidy and

24
organised storage area. Also worth adding, it seems to be a relationship between OOS
due to poor back-room inventory handling procedures and the level of inventory kept in
the retail outlet. Excess inventory cause congestion in the back-room, and thus hampers
the synchronisation between replenishment processes (Corsten and Gruen 2002b).
2.6.3 SKU misplaced
According to an investigation by Raman et al (2001), when a customer approached the
sales associates for help, about 16 percent of all SKUs could not be located in the
shelves. This very fact underlines poor replenishment practices where products have
been misplaced (either in the back room or in the wrong shelves/locations).
Below we have listed supply chain- and organisational factors that contribute to
execution problems (like misplaced items) and subsequently OOS incidents at store
level:
2.6.4 Product variety
When product variety increases, more steps will be added to the replenishment
process, a aspect that challenges the shelf-availability- and service level. Each step
have potential to increase errors in the replenishment process, and higher product
variety in one area is proved to associate with more products not being available
on the selling floor (because their located in the storage area) (DeHoratius and
Ton 2008).

25
2.6.5 Inventory level
When the product variety increases, more steps will be added to the replenishment
process, increasing the possibility for OOS in shelves due to replenishment
practices. In other words, higher product variety seems to associate with more
products not being available on the selling floor (DeHoratius and Ton 2008).
2.6.6 Employee turnover
2.6.6.1 Disrupts the operations
Employee turnover (staff in or out) tends to disrupt the operations in an
organisation (Dalton and Todor 1979). The process of finding and train
prospects for an available job position, temporarily translates into more work
for the existing staff, and subsequently, there will be more errors in the daily
operations (like replenishment of products).
2.6.6.2 Demoralisation
Having employees leaving one organisation for the next, may undermine the
attitude of the remaining staff (Staw 1980). Turnover often triggers additional
turnover, since the remaining employees may feel left behind (sees their own
fate as less desirable). There will be questions about the motivation of staying
in the organisation. This aspect will affect the effort and motivation put down
in daily operations of the organisation.

26
2.6.6.3 Loss of accumulated experience
Loss of accumulated experience is another impact of employee turnover
(Argote and Epple 1990). Over a longer period, employees learn to do their job
more efficient and better (and hence less errors). In other words, there is a
learning curve that translates into knowledge and experience. High turnover
decrease the overall accumulated experience, and potentially make the
replenishment process more prone to errors. Below is an example of how
inexperience (and as a result; misplaced items) may cause out-of-stock
situations:
There should always be a label on the shelf, and only the item with identical
EAN (to the one on the label) should be put in the shelf above that tag. When
an item is misplaced (and thereby taking up the space for other SKUs), this in
turn will cause that some products are not ordered. The retail manager observes
the shelves manually before triggering an order, and seldom has the time to
match the EAN number on the label with the one on the item itself
Other factors that cause SKUs being misplaced in store:
2.6.7 Customer shopping habits
A customer may pick an item from its shelf location, and then later decide not to
buy the product anyway. Frequently, when this is the case, an item is not put back
in its original location and the SKU figure as misplaced (DeHoratius and Ton
2008).
2.6.8 Frequency with when to replenish shelves
German grocery retailer Globus discovered that shelf replenishment made up 47
percent of their internal logistics cost, and as a consequence decided to look into
27
the idea of store design without a back-room (Angerer 2005). This idea would
reduce frequency of shelf replenishment together with internal logistical cost and
replenishment errors, if enough shelf space would be allocated.
Frequency of shelf replenishment depends on two variables, namely store turnover
and store size (Angerer 2005). If the turnover is the same for both a small and a
larger retail outlet, then replenishment will be carried through with more
frequency for the smaller store (because the storage department is smaller).
The frequency with when to replenish the shelves (Corsten and Gruen 2002) is
another aspect that needs attention. Some specific days or time interval of the
week have greater demand, thus there might not be enough staff to get around.
Replenishment issues might also serve as a problem at the warehouse, when
experiencing trouble in meeting demand from retailer. In some situations like this,
the warehouse fulfilment team mark the line as ―backordered‖, and the delivery
falls short (Versatile Systems Inc. 2008).
2.7 Planning practices
2.7.1 Communication and discontinued SKUs
Discontinued items should be removed from the plan-o-gram as soon as possible, in order
to reduce the chances of stock-out (Alexander et al 2002). A discontinued item may be left
on shelf until it sells out, or the retail outlet could mark down the price. A third alternative
is to send the SKU back to manufacturer as part of reclamation process. If the store forgets
to remove any existing labels, the discontinued item will continue to be ordered (but not
delivered) and potential shelf space (discontinued SKUs shelf space) for any new products
subsequently will not be replenished.
28
Poor communication might result in perceived stock-out incidents (from both customer
and retail manager perspective) when a SKU is discontinued without notifying the retailer
(Gruen and Corsten 2002). Consider the following example:
When communication about discontinued items is well functioning, the retail manger
updates the assortment list and remove any existing shelf-labels for discontinued items. If
the communication is absent, the label for discontinued SKUs would still be present on
shelf, and customers perceive the item as part of the assortment (no product above label
and stock-out situation).
Changing product assortment (as a result of discontinued and new SKUs) is a particularly
labour intensive task (Muller at al 2007)). Removing labels and closing gaps for
discontinued items might not always have top priority due to periods with insufficient
staffing. For this reason, labels and shelf space continue to figure in the plan-o-gram, even
though the SKU has been discontinued.
2.7.2 Errors in picking routines at wholesaler or supplier
Retail outlets commonly does not scan incoming shipments on receipt, hence any errors
(wrong quantity or product) with the delivery will not be detected until there is a stock-out
situation for the concerning items (DeHoratius and Raman 2004).
Causes of error in picking process at supplier or wholesaler:
a. Decision to batch orders
Error in the picking process may appear for many reasons, and the option to batch orders
(each warehouse worker retrieve many orders in one trip) is just one possible explanation. The
picking process is relatively time-consuming, and the employees have to sort the orders into
separate containers as they go along (Bartholdi and Hackman 2008). Considering strict
deadlines for shipment, this is an aspect that will increase chances of making errors, and
potentially result in wrong shipments to retailer.

29
b. Stocking process is not timely nor prompt
Poor stocking and replenishment routines (stocking is not on time) at warehouse are two other
aspects that need attention. If the warehouse shelves are not fully stocked, ―pickers‖ will
temporarily stop their work in order to restock the shelves (Kempfer 2006). This will then in
turn reduce picking rates substantially and increase picking-errors (to be able to keep up with
the time schedule).
c. Similar SKUs stored close to each other
When two items appear to be similar, there is a tendency for pickers to misread and mix up
SKUs (Kempfer 2006). This is especially the situation when error-prone items are stored next
to each other.
2.7.3 New item being planned
During our data collection at store level, we identified labels on the shelf for items not yet part
of the assortment. The concerning products had not been ordered/ shipped, due to planning
activities (shelf-space allocation etc.) in the supply chain. However, labels for the planned
products happened to be present on the shelves (with no physical inventory in that location), a
situation which very well might be perceived as OOS by the customers. The main point is
that, labels for planned products should not enter the shelf until the shipment actually reach
the store.
2.7.4 SKU not activated in order system
This is another problem that we discovered during our data collection at store level. An SKU
might be part of the assortment list, and still consequently be stock-out in the retail store. The
reason for this is located at the administration of the concerning organisation, where all items
must be registered into an ordering system. If the SKU is not activated in this system, the
retail outlet will as a consequence not receive any shipment of this item (the order will not be
executed, since the item is not activated in the ordering system).
2.7.5 Insufficient control of incoming shipments
The order verification process consists of the following steps (Snow 2005):
30
a. Ensure compliance between shipment and specification on purchase order, by drawing
a sample for inspection
b. Report status of inspection to purchasing and inventory control
c. Count material and check against shipping invoice
d. Note any discrepancies
The control of incoming shipments may not always be as formal as above, at least not for
smaller retail outlets.
The consequences of insufficient control of incoming shipments are perhaps more of a
concern for supermarkets (and other large –scale retail outlets). If discrepancy between the
shipment record and actual shipment goes unnoticed by the receiving clerk, the consequences
will be inaccuracy in the system inventory record. This is the system that supermarkets and
other large-scale retail outlets apply for issuing orders (order is based on quantity status in
system record), since it‘s too time-consuming to manually track all SKUs out on the sales
floor (Kang and Gershwin 2005). Any inaccuracies in the system record, could in worst case
translate into OOS situation for the concerning product (insufficient with resources to verify
system inventory quantities with physical inventory, for all SKUs).
2.7.6 Allocated shelf space
2.7.6.1 Insufficient with allocated shelf space
In a worldwide study, Gruen and Corsten (2007) found that fast-moving items have six
times more lost sales due to OOS than slower-moving items. Thus developing
sufficient techniques for allocating shelf space is perhaps of greatest interest for this
category of products. More so, about 86 percent of the inventories in shelves happen to
be in excess of seven days‘ supply. The inabilities of the store to match shelf space
with replenishment frequency and sales rate is an issue that causes stock-out incidents
(ECR Australasia 2001) on a frequently basis. This is especially a great concern for
fast-moving items, an observation that becomes apparent when frequency of
replenishment is low.
31
The shelf space commonly is planned through a computerized space management
system that develops plan-o-grams for locating all of the products in-store. However,
the quality of the plan-o-grams and subsequently allocation of shelf space depends on
the solution-algorithms that the systems adopt (Yang 2001).
Sometimes the supply chain may allocate insufficient with shelf space on purpose.
This is the situation when the retailer decides to promote own-brand products on the
expense of alternative products, due to the fact that the first category creates higher
margins. Then commonly, own-brand products get both more and better shelf space
(London Economics 1997).
About 91 percent of store SKUs have allocated shelf space based on case-pack sizes
(Gruen and Corsten 2007).
Below we have listed some other standards for allocating shelf space:
Sales profit of each SKU
In descending order, shelf space will be assigned according to sales profit of
each SKU per display area of length, assumed that shelf depth remain the same
(Yang 2001).
Space elasticity
Shelf elasticity is defined as the ratio of relative change in unit sales to relative
change in shelf space. A better understanding of this concept can prove valuable
to the management in developing strategies for allocating sufficient with shelf
space (Curhan 1973).
Build up method.
This is the ratio of expected sales for items to total expected store sales.
Market share of each brand
Top-brands get more shelf space.

32
2.7.7 Poor plan-o-gram compliance
Retail outlets commonly allocate shelf space for independent SKU according to plan-
o-grams. The plan-o-gram provides a shelf layout and workable methods by which
merchandise plans can be communicated efficiently (Lim et al 2004). In some
situations, specific items might be OOS due to poor compliance with the plan-o-gram.
This is particularly the case for medium-moving items (ECR Australasia 2001).
Poor compliance with the plan-o-gram might be a result of poor replenishment
practices, like for instance the tendency to hide or place overstock items behind
adjacent products (Brackman 2008).―Hiding‖ holes in shelf (create illusion of shelves
being fully replenished) and the failure to ensure proper price tags is also relevant
examples that ultimately would lead to OOS incidents.
2.7.8 Poor planning of supply chain promotions
Recent studies of the retail business show OOS rates up to 14 percent during
promotion periods (Nath et al 2006).
Planning for promotion activity in the supply chain is a challenging task, in which
even the smallest errors would translate into OOS situations and lost sales. Commonly,
upcoming promotional events are based on order quantities from ―last like‖ chain-
wide (in the trading area) promotions (Cooper at al 1999). ―Last like‖ is defined as the
last time a promotion for the item was offered at the same price point. This policy or
system has some rather unfavourable features.
a. ―Price‖ has too many levels to be considered as a criterion for comparison.
Rules about what is considered to be ―the same price‖, has to be determined
in advance.
b. No other promotion conditions (type of feature or display) is considered for
establishing ―last like‖.

33
c. New order quantity relates to last order quantity, not last sales plus safety
stock. As a result there will be under- and over-ordering on the last promotion
(as the system doesn‘t learn).
Most organizations are faced with limited relevant historical observations for planning
upcoming promotions, and typically the forecasts tend to be intuitively developed and
highly subjective (Mcintyre et al 1993). Considering the many important factors (a
few listed below) that influence sales in a promotion campaign, it‘s not surprising that
incorporating all of them in one successful mix, in the end will create some space for
error (forecasting accuracy).
The amount of price mark-down.
The duration of the promotion.
The time since the item last was promoted
The type and effect of in-store display (primary end-isle display verses an in-
line display)
The subjective and intuitively developed method towards forecasting promotional
sales can be considered an expertise, based on learning and collection of experience
from previous mistakes in the forecasting process (Mcintyre et al 1993). The level of
expertise and rate of learning from mistakes, both are variables that differ widely from
one organisation to the next (and can be very costly to the organisation), hence this
approach could partly explain why the results of promotional planning fluctuate to
such a high degree (accuracy of forecast etc.).
2.7.9 Design of retail outlet
Having multiple storage locations at a retail outlet may prove to be very costly for the
organisation. If one specific type of SKU is stored at two or three different locations, it
would be difficult to get an overview whether an item is in-store or not. The system
inventory may show that the item is available, but when one try to locate the product,
it‘s not there (Brooks and Wilson 2007). As a consequence, the retail outlet will be
OOS and a new order has to be issued.
34
2.8 Vendor Managed Inventory (VMI)
A VMI program separates control from ownership. The supplier decides when to ship the
products, and the ownership of the goods is transferred to the retailer upon delivery (Taylor
2004). VMI helps the supplier to better coordinate the product flow to the customer, and thus
provides the following benefits (Lapide 2008):
A distributor or retailer customer is not caught short on product availability
Neither a customer nor its supplier is holding more inventory than absolutely
necessarily to meet the consumer demand.
Many manufacturers believe that the retailers have enjoyed the benefits of VMI programs at
the expense of the manufacturer. Originally, VMI was developed to create better visibility in
the supply chain through information sharing. In other words, the retailer is supposed to
forward real demand data upwards in the supply chain, so that the manufacturer can adjust
production and avoid excess inventory. However, most VMI programs do not make use of
POS (point of sales) data to trigger replenishment; hence buffer inventories are transferred to
the manufacturer warehouse (Cooke 1998).

35
Chapter 3 - Research Methodology
There‘s been performed relatively little research on out-of-stock in the retail business.
However, the logistical reasons behind OOS have been documented fairly well through
worldwide surveys and case studies (Corsten and Gruen 2002). In our work we want to
continue this trend by exploring the logistical causes behind OOS at a local level (grocery
stores in Molde).
Selecting the right methodology is always a challenge for researcher. For scientific
investigation right methodology help researchers to uncover the issue effectively. Once
researcher chooses right methodology, the other issues are validity and reliability of research.
These issues will be addressed in later part of this chapter.
The issue on hand for our Master Thesis is ―On the Shelf availability in Food Based Discount
Stores Molde Grocery Environment‖. The problem is discussed in more detail, in problem
definition chapter. For the topic on hand we chose ―case study‖ method. Case research has
consistently been one of the most powerful research methods in operations management
(Voss et all 2002), particularly in the development of new theory. As the topic on hand is an
inductive study, most researchers in retail OOS studies the consumer response, very little
work is done on issues related to retail store level and other members of supply chain.
Today retailers are using reasonably good information technology tools to ensure the good
customer service. To measure impact of the growing frequency and magnitude of changes in
technology and managerial methods, researchers in the field of logistics and supply chain
conducting a lot of field-based research methods (Lewis, 1998). Case study research is widely
used in Europe but is less common in North American operations management (Drejer et al.,
1998). Case study and field study research accounted for 4.94 per cent and 3.80 per cent
respectively of published papers (Pannirselvan et al. 1999). This shows an increasing trend of
using case studies in this field.

36
Gruen and Corsten 2002) studied OOS in grocery retailers, they used survey method, as to
measure consumer response they conducted survey with sample size of 71,000. In 29
countries they studied 661 retail outlets.
3.1 Case study Method
Case research is very important in the field of logistics and supply chain management as the
most of the times quantitative findings and theory constructions is based on the findings that
will be based on qualitative understanding (Meredith, 1998).
Meredith (1998) cites some strengths of case study put forward by Bebensat et al. (1987):
(1) The phenomenon can be studied in its natural setting and meaningful, relevant theory that
is generated from the understanding gained through observing actual practice.
(2) The case method answers the questions of why, what and how, with a relatively better
understanding of the nature and complexity of the complete phenomenon.
(3) The case study adds something to exploratory investigations where the variables are not
known and the phenomenon not at all understood.
According to Angerer (2005), Case study research as iterative process between theory and
empiricism, as described by the diagram below.
Figur 2.7.9-1 Iterative Process
37
Adapted From: Angerer, A. 2005
3.2 Sources of Evidence in Case studies
There are six primary sources of evidence for any case study research Yin (1994). It may
require different skills to use them all. Not all sources are essentially required in every case
study, but the importance of multiple sources of data to the reliability of the study is well
established (Stake, 1995; Yin, 1994). Yin (1994) identifies six sources of evidence as given
below:
1. documentation
2. archival records
3. interviews
4. direct observation,
5. participant observation
6. Physical artifacts
3.3 Research Design
For our case studies, we used most of the sources of evidence mentioned above. This ensured
our construct validity. After performing our literature review, and getting good understanding
of theories and practice in grocery retailers. We started each case study with list of all SKUs
each grocery store carrying. Then we used systematic random sampling technique to pick a
sample of approximately 300 SKUs. Total sample drawn was 3015 for all five stores over two
days of the week. Doing multiple case studies help in achieving external validity.
Once sampling is done, we physically verified on the shelf availability of each SKU in store.
For this observational study, criteria for OOS was, if one the shelf product label with bar code
is available, and shelf does not carry that item, we would declare it OOS in our list. If did not
find the product label in the whole store, we selected the very next SKU on list as sample.
This observation was taken 2 different days of the same week during different timings. One
observation was made on Mondays, during 9.00 am to 2.00 pm. The other observation was

38
made in later part of the week, which was on Thursdays during 12.00 pm to 5.00 pm.
Observations during two different parts of week gave very good bases for comparison.
After we identified all OOS items in store, we performed in-depth interviews with store
manager and other key informants at each of the five stores. The interviews were open ended
semi structured; the data collection instruments we used for the interviews are given in
appendices. Following up on this, we were able to map the supply chain and pin point data
that‘s vital to our investigations. Information about suppliers, inventory policies and
purchasing practices, ordering practices, forecasting and General Management of store are
just a few areas we investigated. In general, this part relates to mapping the logistical
variables that causes stock-out in the retail outlets. In those cases when some item is OOS due
to suppliers, also tried to contact them to know reason at their level. But the response was not
very encouraging.
We tried to follow case study protocol for our research as described by Yin 1984. First of all
both of investigator hold Masters Degree in Logistics and Supply Chain Management, that
help them understanding logistical phenomenon at store level. In addition to this a thorough
reading to OOS literature also made, that can help in doing more meaningful investigation.
Documentation of observations and interviews help in attaining reliability in research.
For the analysis purposes, we divided all products into three categories including edibles, non-
edibles and perishables. We followed this category scheme used in a report of Progressive
Grocer (1999). As it has been described earlier, we conducted this study on 5 EDLP stores in
Molde. So in our analysis, we mostly made comparison between different store and product
categories.
For analysis, we used MS Excel. MS Excel is very useful for data tabulation, and analysis. In
MS Excel all the right tools are available the we need to build a solid, stable estimating
system that saves time and is easy to use for estimations (Kumar 2007). We calculated
percentages for data analysis and made graphs for data presentations with the help of MS
Excel.
Total sample drawn was 3015 for all five stores over two days of the week.
39
3.4 Case Study Participants
Figure 1 provides a short summary of operational key figures by the end of 2008 for each
independent organisation. The numbers in the brackets are the % change from previous year.
Tabell 1 Market share and Net Turnover 2008
Norgesgruppen Ica Norge Coop NKL Rema 1000
Grocery
market share
in %
39.8 (+0.6) 16.4 (-1.0) 24.1 (+0.3) 18.7 (+1.4)
Result before
tax
in billion
NOK
1.053 (-32.5) Operating result
in billion NOK:
-0.4117 (-461.1)
2.463* 2.05* (+84.2)
Net turnover
in billion
NOK
Operating
revenues:
49.016 (+14.9)
in billion
NOK:16.07
(+6.3)
Operating
revenues:
23.506 (+9.1)*
45.841* (+37.4)
Discount
stores
Kiwi Bunnpris Rimi Coop Prix Rema 1000
Market share
in %
12.5
(+1.0)
3.6
(+0.3)
6.2 (-0.7) 7.0 (-0.1) 18.7 (+1.4)
*for the year 2007
Numbers translated to NOK with exchange rates per April 21st 2009.
3.4.1 Norgesgruppen – Kiwi and Bunnpris
By the end of 2008, Norgesgruppen had 39.8 percent of the Norwegian grocery market. That
is 0.6 percent increase from 2007. The low price concepts; Kiwi and Bunnpris, could show for
12.5 and 3.6 percent of the total market in 2008. In other words, there has been an increase of

40
1.0 and 0.3 percent subsequently from 2007 (Nielsen 2009). In 2008, Norgesgruppen made
49.016 billion NOK in operating revenues (Norgesgruppen 2009), and 1.053 billion NOK in
results before tax. Respectively 14.9 percent increase and 32.5 percent decrease from 2007.
Considering the supply chain of Norgesgruppen, all negotiations with the suppliers of the
different concept stores are performed by central organization representatives. Before the
negotiations start, the different chains (Kiwi, Meny and Joker) have an option to affect how
the final assortment should look like for each of the concepts (discount store, supermarket
etc.). However, the central organisation of Norgesgruppen has the final word.
Kiwi and Bunnpris are the low price concepts (discount stores), although Bunnpris only is an
associate member of Norgesgruppen. All of the chains are free to decide the retail price they
want to charge for their products (within a predefined interval).
3.4.2 Ica Norge - Rimi
Rimi had 16.4 percent of the market in 2008, which is a decrease of 1.0 percent from 2007
(Nielsen 2009). Net turnover for 2008 estimated 16.07 billion NOK, while the operating
result happens to be -411.7 million NOK (Ica April 2009). These are 6.3 percent increase and
461.1 percent decrease respectively.
Rimi is a low price concept (discount store), embracing a relative narrow assortment of
products. All the chains (including Rimi) are part of an integrated system that calls decisions
regarding procurement, assortment, product supply and marketing. Assortment and retail price
for each chain is decided in co-operation with the wholesaler.
All of the retail outlets of Ica Norge are partly owned and run, or operated on franchise
contracts. Negotiations are performed at the central level of the organization.
41
3.4.3 Coop NKL – Coop Prix
By the end of 2008, Coop Norge (as part of Coop NKL) controlled 24.1 percent of the
Norwegian grocery market. This is a steady 0.3 percent increase from the year before (Nielsen
2009). Operating revenues estimated 23.5 billion NOK (9.1 percent increase from 2006) for
2007 (Coop NKL n.d.), while the result before tax closed in on 2.463 billion NOK.
Coop Norge (as part of Coop NKL) is a fully integrated chain, where all decisions on
procurement, assortment and price are made at the central level. Coop Prix is the
organizations discount store, covering about 7.0 percent of the Norwegian grocery market in
2008. This is a 0.1 percent decline from 2007.
3.4.4 Rema 1000 –
Performing a jump on 1.4 percent from their market share in 2007, Rema 1000 now has an
even stronger hold in the Norwegian grocery market with 18.7 percent in 2008 (Nielsen
2009). Net turnover for 2007 was 45.841 billion NOK, and 2.05 billion NOK in result before
tax (Reitangruppen n.d.). 37.4 and 84.6 percent increase respectively.
Rema 1000 is owned by Reitangruppen, a vertically integrated enterprise that do business
within distribution and grocery retail sales. Rema 1000 is a low price concept, and the retail
stores are mainly operated on franchise contracts. Assortment and retail prices are predefined
at the central level.
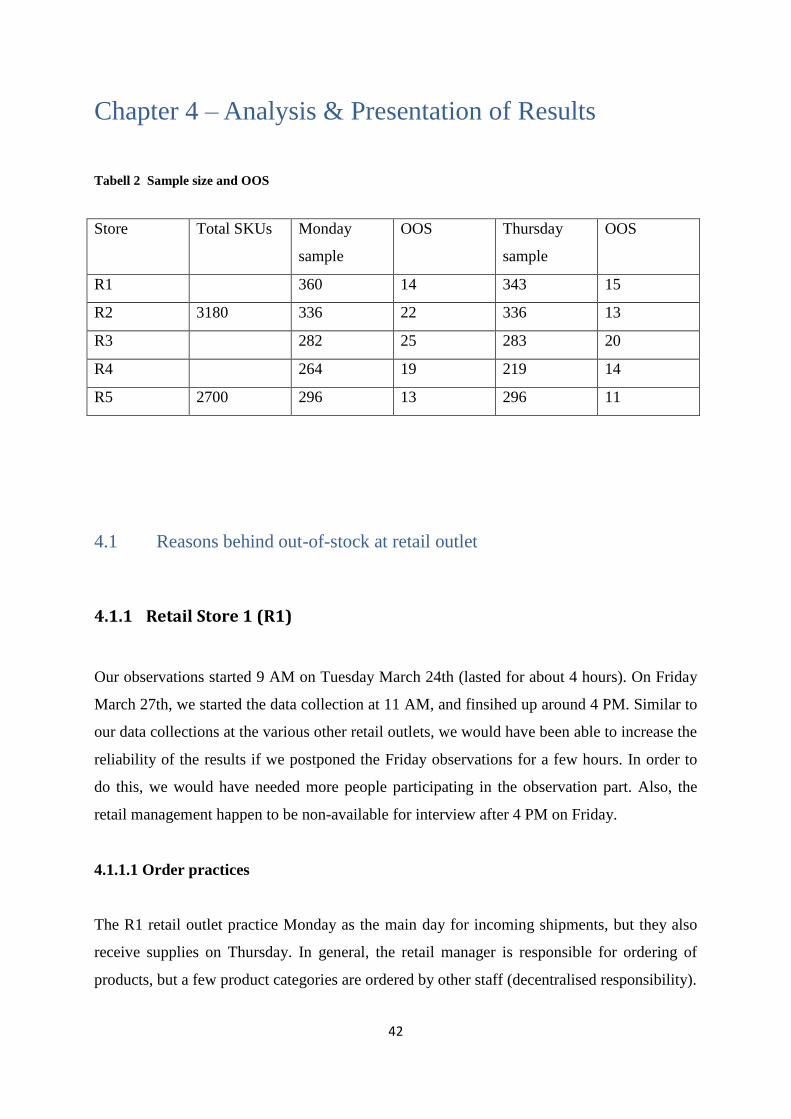
42
Chapter 4 – Analysis & Presentation of Results
Tabell 2 Sample size and OOS
Store Total SKUs Monday
sample
OOS Thursday
sample
OOS
R1 360 14 343 15
R2 3180 336 22 336 13
R3 282 25 283 20
R4 264 19 219 14
R5 2700 296 13 296 11
4.1 Reasons behind out-of-stock at retail outlet
4.1.1 Retail Store 1 (R1)
Our observations started 9 AM on Tuesday March 24th (lasted for about 4 hours). On Friday
March 27th, we started the data collection at 11 AM, and finsihed up around 4 PM. Similar to
our data collections at the various other retail outlets, we would have been able to increase the
reliability of the results if we postponed the Friday observations for a few hours. In order to
do this, we would have needed more people participating in the observation part. Also, the
retail management happen to be non-available for interview after 4 PM on Friday.
4.1.1.1 Order practices
The R1 retail outlet practice Monday as the main day for incoming shipments, but they also
receive supplies on Thursday. In general, the retail manager is responsible for ordering of
products, but a few product categories are ordered by other staff (decentralised responsibility).
43
Unlike the other retail outlets, R1 has implemented an automatic ordering system for most of
its assortment (volunteer assortment is still ordered manually by the retail manager). An
electronic system automatically releases an order for a product when the order point for that
item is reached. Basically, orders are triggered based on quantities in the system inventory
record (not physical inventory out on the sales floor).
Being that most products are ordered automatically, the need for control routines becomes
apparent. About two times a week, the retail management receives a list from the R1
administration. The list is made up of 10 selected SKUs that the store manager is supposed to
check against physical inventory. The system inventory record quantity for each of the 10
SKUs is matched against the physical inventory out on the sales floor, and the system is
updated in case of any mismatch.
Unfortunately we did not manage to capture data about any OOS incidents related to ordering
practices at the time of observations. To be more specific, we should have matched the system
inventory record with physical inventory (out on the sales floor) for each of the SKUs under
the ―Non response category‖. However, for both days of observations we send a list for the
items being OOS, and made the wholesaler write a rapport on each of the items.
At the time of observations, none of the SKUs under the ―Non response category‖ had been
ordered. First of all, this implies that the wholesaler could not be blamed for any OOS
situations at the store level. Second, the report suggests that there may have been a mismatch
between the system inventory record and physical inventory, considering that no orders for
OOS items (belonging to ―No response‖ category) had been triggered.
For either day of observations, the wholesaler could not be blamed for OOS incidents at
the retail outlet.
About 2 and a half weeks later we went back to the R1 store and captured additional data
about non-response items (SKUs for which we failed to identify OOS reasons). We matched
physical inventory with system inventory record for the following SKUs.

44
• 3 of the 6 SKUs OOS in the ―Non response‖ category Tuesday (remaining 3 SKUs gave no
results)
• 6 of the 6 SKUs OOS in the ―Non response‖ category Friday
About 78 percent of the SKUs above happen to have a physial inventory that were less than
the system inventory record. Figure 5 below shows the percentage deviation between system
inventory record and physical inventory. Positive deviations (measured in percent) means that
physical inventory is less than system inventory record
Figur 4.1.1-1 Physical inventory deviation from system inventory record
Although the results in figure 4.2-1 above were obtained about half a month after the primary
observations at the R1 retail outlet, our findings may give some indication on the reasons for
OOS for the ―Non response‖ category. The positive deviations suggests that OOS SKUs had
not been ordered by the automatic ordering system because the system inventory record
showed more quantities in-stock than actually was the case.
45
4.1.1.2 Replenishment practices
Figur 4.1.1-2 Out-of-stock caused by replenishment practices
* Covers total 11 (or 78.6%) of the 14 SKUs not available in the shelf.
**Covers total 9 (or 60%) of the 15 SKUs not available in the shelf.
SKU misplaced in shelf
From figure 4.2-2 we may observe that 9.1 percent of the SKUs OOS on Tuesday had been
misplaced in the shelf. On Friday we had about 22.2 percent in the same category.
Considering that the SKUs are not available in theire assigned locations, and also that not all
customers ask the staff about products they can´t find (some customers just leave the store
when they cannot find the products), we decided to threat misplaced SKUs as OOS.
For the R1 store, misplaced SKUs are not a treath to the ordering practices, as they have an
automatic ordering system (orders based on system inventory record). With manual ordering
(retail manager physically audit the shelves and make issue orders), misplaced items could
cause SKUs OOS not to be ordered.
The R1 retail outlet has total 8 employees, and all of them except one has more than 6 months
experience from the retail business. During the last 12 months, 1 staff has been hired while 3
46
have left the job. From this we may conclude that the staff has sufficient with experience in
retail, but perhaps to high a workload per staff (1 hired and 3 left) could explain some of the
replenishment issues. During the period we collected our data, the R1 store happen to have
insufficient with staff on the shifts (either poor planning or employees called in sick).
Also worth mentioning, the R1 store keep 3 employees on a normal day shift (any time period
except weekend and period of incoming shipments) and 2 on the night shift. In busy periods
or shifts (weekends and day of delivery), the store practices 4 employees on day shift (also 4
during late shift in weekends). These figures are quite normal compared to the other outlets of
the same size.
All recently hired staff has to go through the official training program of R1 (information
DVD, guidlines and sign an agreement).
SKU not visible in shelf
With 9.1 and 22.2 percent for Tuesday and Friday respectively, show that the store has some
minor issues related to replenishment practices. The concerning SKUs happen to be non-
visible in theire assigned shelf location. This means that the items either were ―hidden‖
behind another type of SKU, some empty packing or in the back of the shelf. The point is that
the products were not visible to the customer, in such a manner that the store very well could
loose sales.
Date of consumption overdue
With 9.1 and 11.1 percent of the OOS Tuesday and Friday respectively, related to SKUs that
had expired on date of consumption.
Located in the back room
On Tuesday, 27,3 percent of the OOS SKUs could be found in the back room. Friday
estimated 44.4 percent due to the same reason. The relative high numbers cant partly be
explained by insufficient with staff to replenish the shelves that week. Planning issues (hiring
new staff, employees left the job etc) resulted in that a lot of the incoming shipments that
week stayed too long out in the storage area.

47
In general, the back room appeared to be rather unorganised (products and package piled up
on the floor), and it is likely that employees would experience problems attaining an overview
about which SKUs are available at the store at all times. This would most certain be an issue
during busy shifts. The R1 Store happen to have all storage departments in the same area.
This is an aspect that will benifit the process of getting an overview.
4.1.1.3 Planning practices
Figur 4.1.1-3 Out-of-stock caused by planning practices
* Covers total 11 (or 78.6%) of the 14 SKUs not available in the shelf.
**Covers total 9 (or 60%) of the 15 SKUs not available in the shelf.
Item discontinued by supplier
18.2 percent of the SKUs out-of-stock on Tuesday had been removed from the assortment.
The concerning products still happen to have their label visible for any customers to observe.
This is why we decided to label the situation as OOS, since a customer would perceive the
products as part of the assortment. About 50 percent of the SKUs belong under VMI
assortment, and perhaps the supplier is responsible for removing any labels for discontinued
items.

48
4.1.1.4 Supplier
Figur 4.1.1-4 Out-of-stock caused by planning practices
* Covers total 11 (or 78.6%) of the 14 SKUs not available in the shelf.
**Covers total 9 (or 60%) of the 15 SKUs not available in the shelf.
4.1.1.5 No response
Figur 4.1.1-5 OOS with none or insufficient response
*Figure covers the Remaining 3 (or 21.4%) of 14 SKUs OOS Tuesday (not Monday)
**Figure covers the Remaining 6 (or 40%) of 15 SKUs OOS Friday (not Thursday)
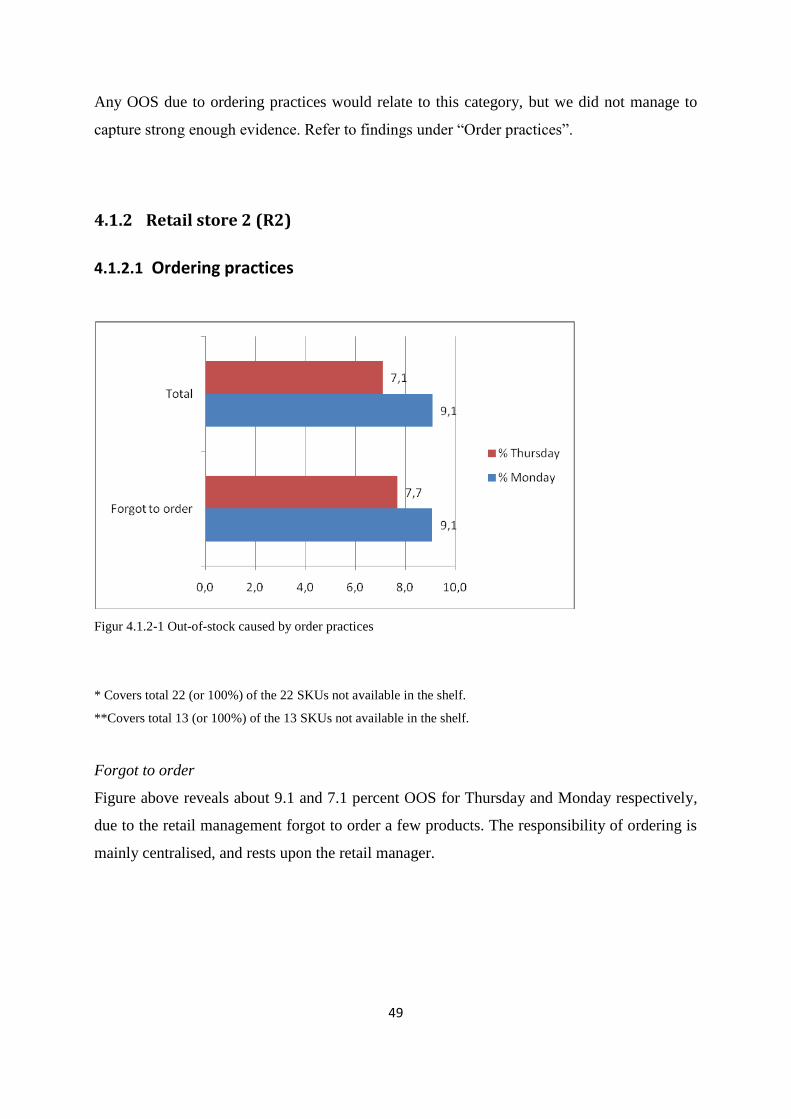
49
Any OOS due to ordering practices would relate to this category, but we did not manage to
capture strong enough evidence. Refer to findings under ―Order practices‖.
4.1.2 Retail store 2 (R2)
4.1.2.1 Ordering practices
Figur 4.1.2-1 Out-of-stock caused by order practices
* Covers total 22 (or 100%) of the 22 SKUs not available in the shelf.
**Covers total 13 (or 100%) of the 13 SKUs not available in the shelf.
Forgot to order
Figure above reveals about 9.1 and 7.1 percent OOS for Thursday and Monday respectively,
due to the retail management forgot to order a few products. The responsibility of ordering is
mainly centralised, and rests upon the retail manager.
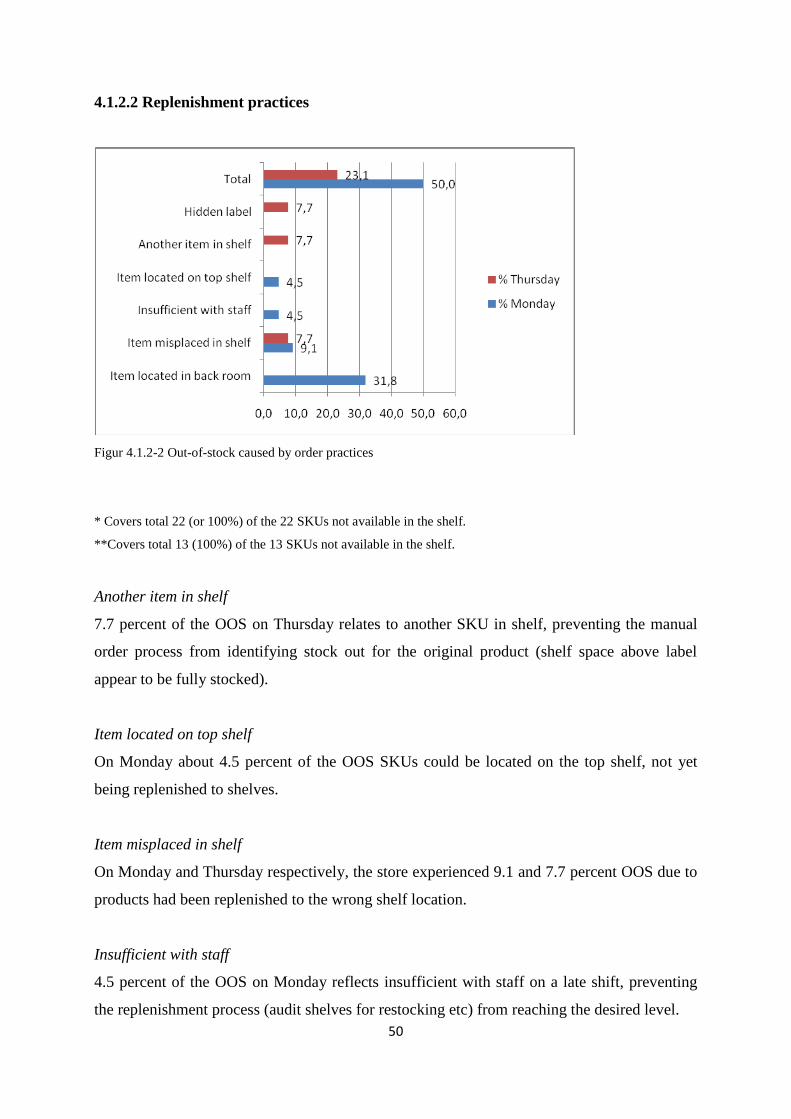
50
4.1.2.2 Replenishment practices
Figur 4.1.2-2 Out-of-stock caused by order practices
* Covers total 22 (or 100%) of the 22 SKUs not available in the shelf.
**Covers total 13 (100%) of the 13 SKUs not available in the shelf.
Another item in shelf
7.7 percent of the OOS on Thursday relates to another SKU in shelf, preventing the manual
order process from identifying stock out for the original product (shelf space above label
appear to be fully stocked).
Item located on top shelf
On Monday about 4.5 percent of the OOS SKUs could be located on the top shelf, not yet
being replenished to shelves.
Item misplaced in shelf
On Monday and Thursday respectively, the store experienced 9.1 and 7.7 percent OOS due to
products had been replenished to the wrong shelf location.
Insufficient with staff
4.5 percent of the OOS on Monday reflects insufficient with staff on a late shift, preventing
the replenishment process (audit shelves for restocking etc) from reaching the desired level.
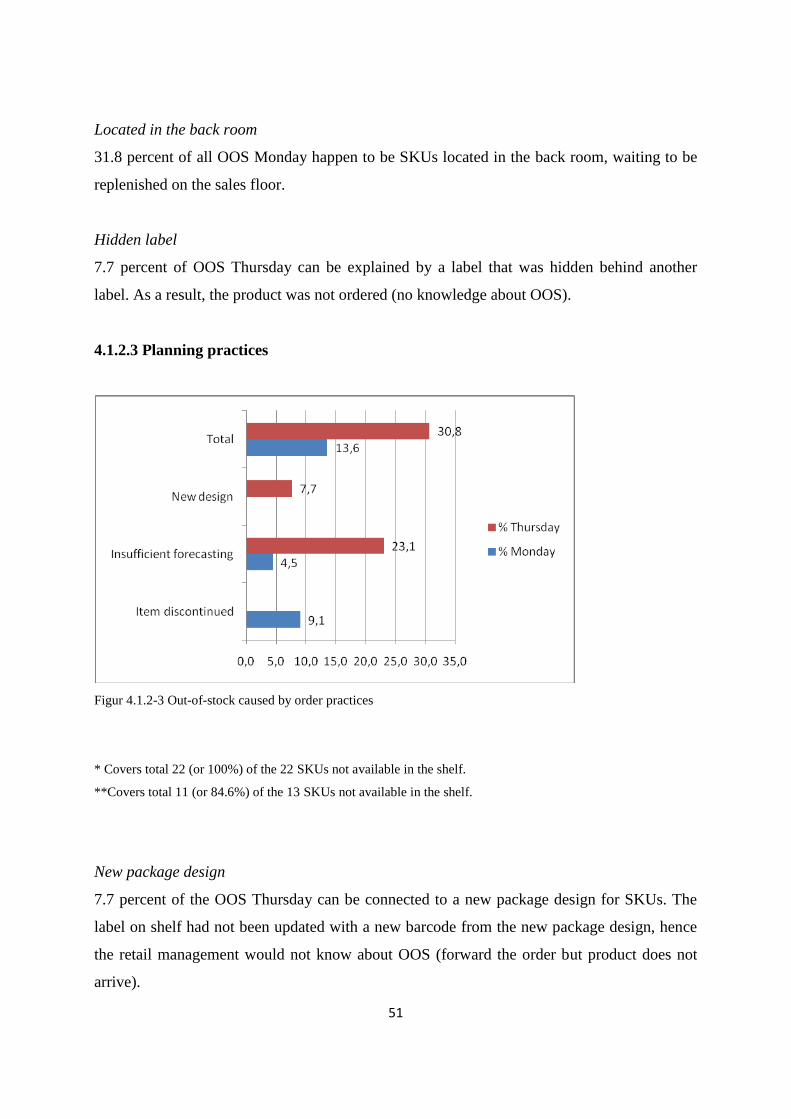
51
Located in the back room
31.8 percent of all OOS Monday happen to be SKUs located in the back room, waiting to be
replenished on the sales floor.
Hidden label
7.7 percent of OOS Thursday can be explained by a label that was hidden behind another
label. As a result, the product was not ordered (no knowledge about OOS).
4.1.2.3 Planning practices
Figur 4.1.2-3 Out-of-stock caused by order practices
* Covers total 22 (or 100%) of the 22 SKUs not available in the shelf.
**Covers total 11 (or 84.6%) of the 13 SKUs not available in the shelf.
New package design
7.7 percent of the OOS Thursday can be connected to a new package design for SKUs. The
label on shelf had not been updated with a new barcode from the new package design, hence
the retail management would not know about OOS (forward the order but product does not
arrive).

52
Item discontinued
For Monday we found 9.1 percent OOS among SKUs discontinued, but with labels still
figuring on the shelf. With labels and subsequent shelf space allocated out in the store,
customers would most certain perceive the SKUs at part of assortment.
Insufficient forecasting
A 4.5 and 23.1 percent OOS on Monday and Thursday refers to poor forecasting in advance
of the ordering process. Retailer R2 makes use of manual ordering (physically audit shelves
and place order), and shelves are checked for replenishment about two times a week.
Regarding the forecast process, the order quantity is based upon sales data from the previous
week (1 week historical data).
4.1.2.4 Wholesaler
Figur 4.1.2-4 Out-of-stock caused by order practices
* Covers total 22 (or 100%) of the 22 SKUs not available in the shelf.
**Covers total 13 (or 100%) of the 13 SKUs not available in the shelf.

53
4.1.2.5 Supplier
Figur 4.1.2-5 Out-of-stock caused by order practices
* Covers total 22 (or 100%) of the 22 SKUs not available in the shelf.
**Covers total 13 (or 100%) of the 13 SKUs not available in the shelf.
OOS at supplier
A 7.7 and 4.5 percent OOS on Thursday and Monday respectively can be blamed on suppliers
not being able to make delivery.
VMI
Total 23.1 and 18.2 percent of the OOS Thursday and Monday respectively happen to be on a
VMI program. We did not get any detailed response for this category, else that the OOS is the
suppliers responsibility.
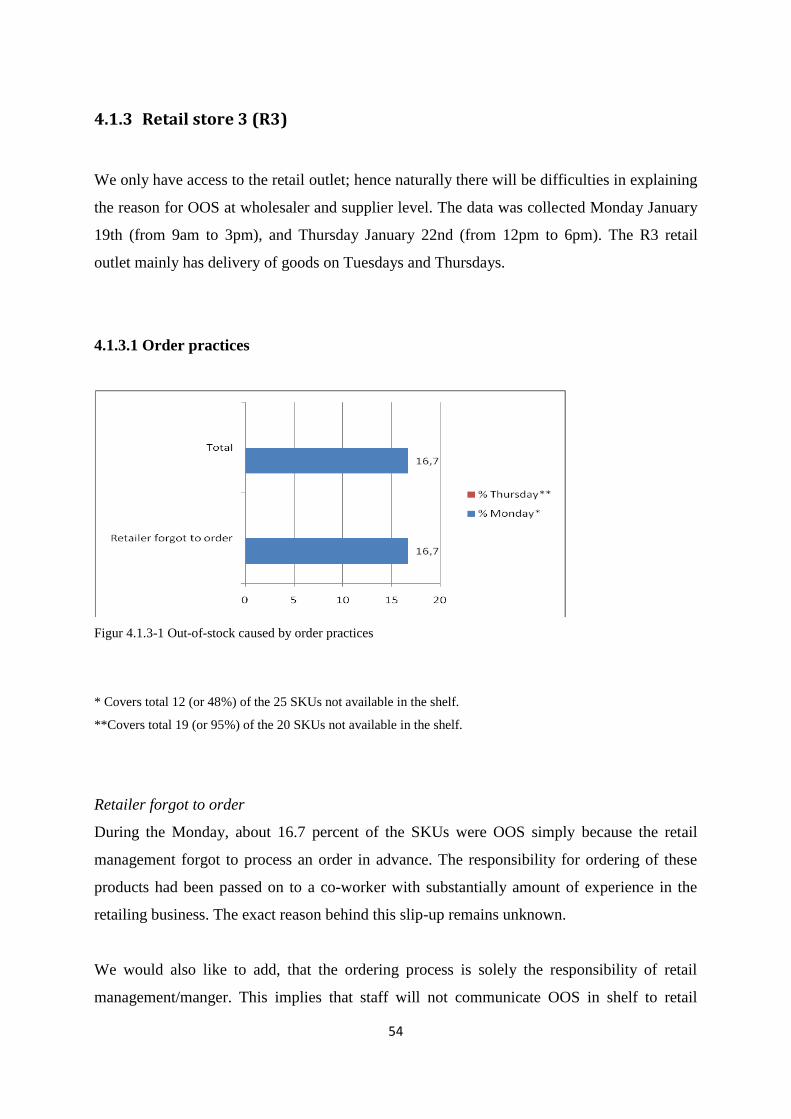
54
4.1.3 Retail store 3 (R3)
We only have access to the retail outlet; hence naturally there will be difficulties in explaining
the reason for OOS at wholesaler and supplier level. The data was collected Monday January
19th (from 9am to 3pm), and Thursday January 22nd (from 12pm to 6pm). The R3 retail
outlet mainly has delivery of goods on Tuesdays and Thursdays.
4.1.3.1 Order practices
Figur 4.1.3-1 Out-of-stock caused by order practices
* Covers total 12 (or 48%) of the 25 SKUs not available in the shelf.
**Covers total 19 (or 95%) of the 20 SKUs not available in the shelf.
Retailer forgot to order
During the Monday, about 16.7 percent of the SKUs were OOS simply because the retail
management forgot to process an order in advance. The responsibility for ordering of these
products had been passed on to a co-worker with substantially amount of experience in the
retailing business. The exact reason behind this slip-up remains unknown.
We would also like to add, that the ordering process is solely the responsibility of retail
management/manger. This implies that staff will not communicate OOS in shelf to retail
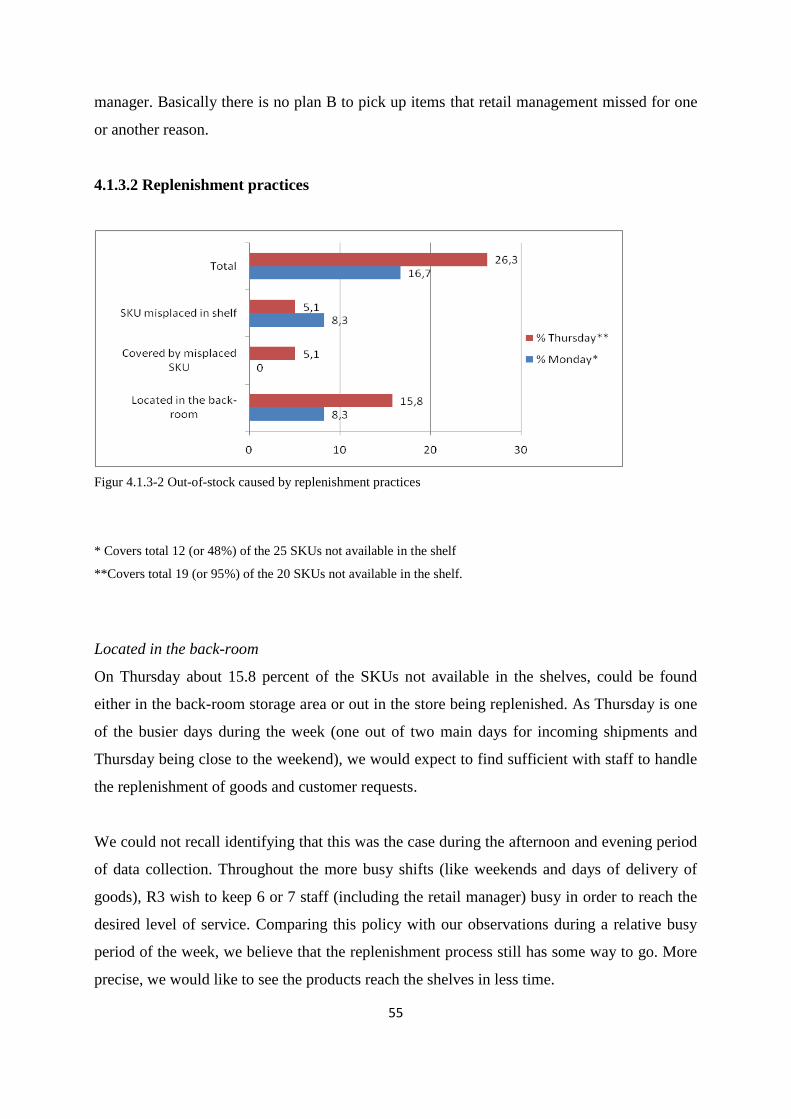
55
manager. Basically there is no plan B to pick up items that retail management missed for one
or another reason.
4.1.3.2 Replenishment practices
Figur 4.1.3-2 Out-of-stock caused by replenishment practices
* Covers total 12 (or 48%) of the 25 SKUs not available in the shelf
**Covers total 19 (or 95%) of the 20 SKUs not available in the shelf.
Located in the back-room
On Thursday about 15.8 percent of the SKUs not available in the shelves, could be found
either in the back-room storage area or out in the store being replenished. As Thursday is one
of the busier days during the week (one out of two main days for incoming shipments and
Thursday being close to the weekend), we would expect to find sufficient with staff to handle
the replenishment of goods and customer requests.
We could not recall identifying that this was the case during the afternoon and evening period
of data collection. Throughout the more busy shifts (like weekends and days of delivery of
goods), R3 wish to keep 6 or 7 staff (including the retail manager) busy in order to reach the
desired level of service. Comparing this policy with our observations during a relative busy
period of the week, we believe that the replenishment process still has some way to go. More
precise, we would like to see the products reach the shelves in less time.

56
All together, R3 retail outlet has 4 storage locations (including a cold-storage- and freeze
chamber). The outlay is well planned with very good accessibility and overview. This is an
aspect that should facilitate the process of replenishment. However, there also exists a lot of
storing on top-shelves, and we found it rather difficult to trace SKUs back to these areas.
From the floor, it was a challenge to get an exact overview of what SKUs actually are
available at the retail outlet.
Covered by misplaced SKU
The figure above reveals for Thursday, that about 5.3 percent of the SKUs were hidden
behind another misplaced item. To collect any loose ends, the original item could be found on
the right shelf (with an attached label close), but the next product on the same shelf was given
too much space and actually covered the original product. Now, if a customer is in a hurry,
he/she could easily miss the original item. Both SKUs are relatively fast-moving items, hence
this would only be a small temporarily problem. Also, planned shelf space allocation for
either SKU could not be identified as an issue.
SKU misplaced in shelf
About 8.3 percent of the SKU OOS Monday were misplaced in shelf or not ordered because
another item was misplaced in self. As a consequence of the latter, approximately one-third of
the items had not been ordered. To be more precise, a different SKU had been given the space
of the original product, such that the latter had failed to be ordered. This could only happen
because of the order practice of the retail outlet. The store manager walks around the shelves
and observe. If a SKU is not present above the label on the shelf, an order is issued.
The results proved to be better on Thursday, considering about 5.3 percent OOS in the same
category. The SKUs had not been ordered because another product took up the space of the
original item. About 50 percent of the items can be assigned to the fast-moving item category,
and inadequate shelf space allocation did not seem to be a problem in this situation.
R3 retail outlet has total 19 staff, all with more than 6 months experience in the retail
business. Last 12 months, the outlet has seen 2 staff leave and another 2 been hired. On a
normal shift (not weekend nor days of incoming shipments), R3 employ 4 workers including
the retail manager, and all staff have at some point received proper training through the

57
official training program (training manual and follow-up by a co-worker) for new staff.
Considering the overall experience and turnover (replacement of staff the last 12 months) of
the workforce, we found the results for replenishment practices surprisingly high.
4.1.3.3 Planning practices
Figur 4.1.3-3 Out-of-stock caused by planning practices
* Covers total 12 (or 48%) of the 25 SKUs not available in the shelf.
**Covers total 19 (or 95%) of the 20 SKUs not available in the shelf.
Insufficient ordering by retailer
From the figure we may observe that forecasts tend to be inaccurate (about 10.5 percent for
Thursday and 8.3 percent on Monday). Many of the SKUs have different delivery days than
Thursday, thus which might partly explain the OOS on shelves that day. Almost all the SKUs
have a lead-time of 1-2 days, but fixed delivery day policy usually prevent from shipping
extra order throughout the week.
R3 has a computer system called Pocket Super, which supports the forecasting and ordering
process. Once a week, the store manager physically (no automatic ordering by system) audit
and execute orders on SKUs that could not be observed in the shelf. The order is based on
POS data about average sales from the week before. The quality of the POS data is closely

58
related to the accuracy in the check-out process. This will be dealt with under replenishment
practices.
The retail outlet also has an electronic inventory information system with records on the
current shelf availability status. However, the system is just recently implemented, and
currently not being applied in the forecasting nor the order process.
The concerning SKUs (OOS related to insufficient forecasting) are not part of a promotion,
but about 50 percent of SKUs OOS in this category are fast-moving items. Hence this would
add another dimension to the challenge of forecasting accuracy. As far as we could see, there
was adequate shelf space allocated to the fast-moving items.
New SKU in assortment
Walking around the shelves on Monday, we identified 8.3 percent OOS that could directly be
assigned to the planning of new SKUs in assortment. There was already put up a label on the
shelves for these slow-moving items, but no physical inventory could be located in the area.
We asked around, and it turned out that an first-time orders already been executed. Basically,
we believe that the labels should not enter the shelves before a planned product reaches the
store, but this is just a minor issue considering the SKUs to be standard with many substitutes
available.
Item discontinued by supplier
About 21.1 percent of the items OOS on Thursday had been discontinued by the supplier. The
label could still be found on the shelf, but we are not sure whether or not the retail manager
knew that the SKUs were in fact discontinued. If the label had no bar-code present, something
we failed to observe (and also forgot to ask), then the retail manager has got information from
supplier about item no longer in assortment.
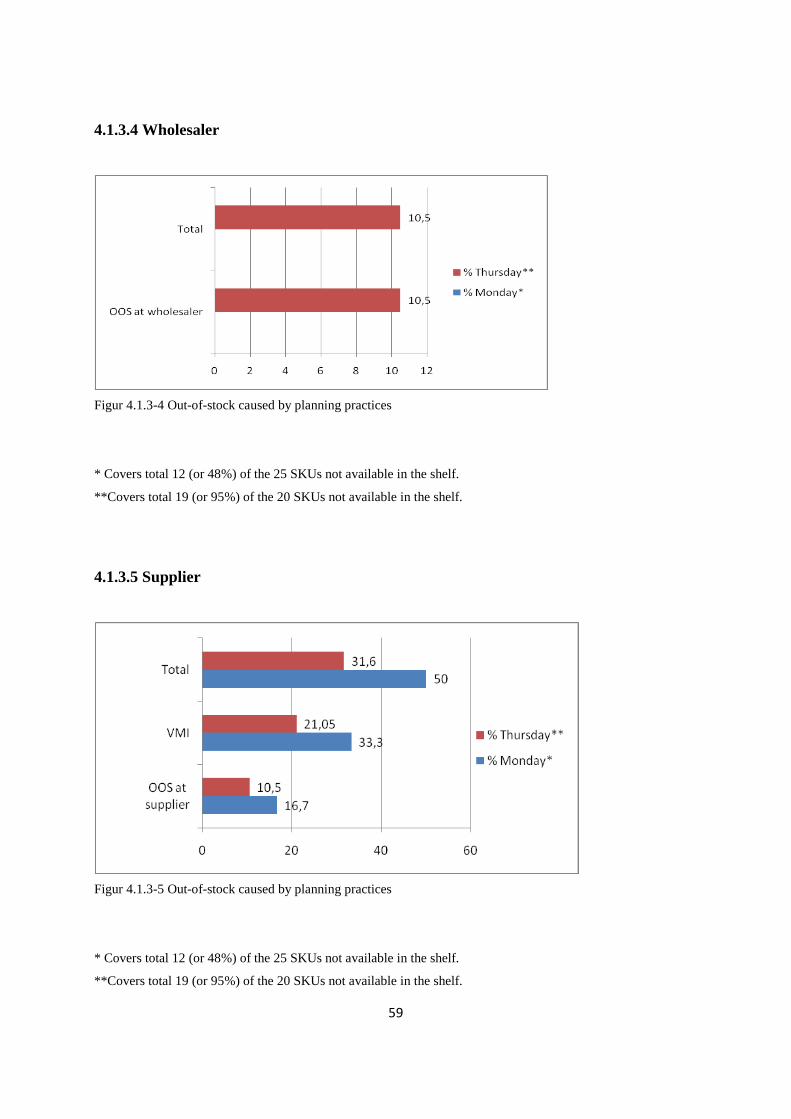
59
4.1.3.4 Wholesaler
Figur 4.1.3-4 Out-of-stock caused by planning practices
* Covers total 12 (or 48%) of the 25 SKUs not available in the shelf.
**Covers total 19 (or 95%) of the 20 SKUs not available in the shelf.
4.1.3.5 Supplier
Figur 4.1.3-5 Out-of-stock caused by planning practices
* Covers total 12 (or 48%) of the 25 SKUs not available in the shelf.
**Covers total 19 (or 95%) of the 20 SKUs not available in the shelf.
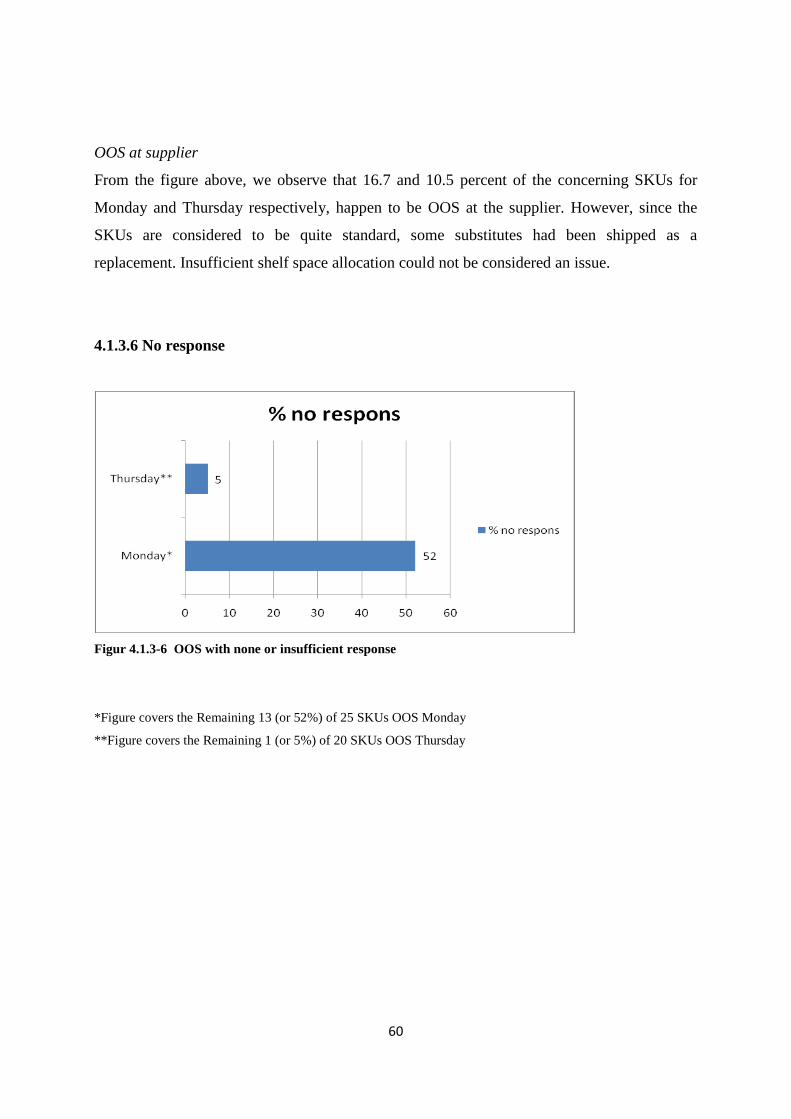
60
OOS at supplier
From the figure above, we observe that 16.7 and 10.5 percent of the concerning SKUs for
Monday and Thursday respectively, happen to be OOS at the supplier. However, since the
SKUs are considered to be quite standard, some substitutes had been shipped as a
replacement. Insufficient shelf space allocation could not be considered an issue.
4.1.3.6 No response
Figur 4.1.3-6 OOS with none or insufficient response
*Figure covers the Remaining 13 (or 52%) of 25 SKUs OOS Monday
**Figure covers the Remaining 1 (or 5%) of 20 SKUs OOS Thursday

61
4.1.4 Retail store 4 (R4)
We did only have access to the retail store, and therefore could not give explanation to all of
the items. R4 mainly receives shipments on Monday and Thursday. We collected our data on
Monday February 9th (9am to 3pm) and Friday February 13th (10am to 3pm). Later we
learned that we should have chosen Thursday instead of Friday, for reasons explained below.
4.1.4.1 Order practices
Figur 4.1.4-1 Out-of-stock caused by order practices
* Covers total 15 (or 78.9%) of the 19 SKUs not available in the shelf.
**Covers total 14 (or 100%) of the 14 SKUs not available in the shelf.
Decided not to order
From figure 4.2-17, we may observe stock-out situations that can be traced back to the
ordering procedures. R4 apparently has good control on the forecasting process, as no OOS
incidents tie with insufficient ordering. The concerning products (―decided not to order‖) for
both Monday and Friday, are part of a volunteer assortment, thus one might not find them in
store at all times. Half of the OOS items on Monday were not ordered because the supply

62
chain was running a promotion on substitutes of this SKU. The Remaining 50 percent (on
Monday) only appear in the assortment during weekends.
Ordering practices creates a severe problem, since customers perceive the volunteer
assortment as OOS when retail managers deliberately decide not to orders. To be more
precise, labels present on the shelf creates an illusion that the item is part of assortment at all
times. We decided to include these SKUs in our results, since there were no obvious patterns
about when retail manager decided to issue an order. Also, we knew that many more of the
items present in our sample were in fact volunteer. It would take ages (and non-available time
from retail manager) to identify and remove concerning SKUs from sample, hence we
decided to leave it be.
The responsibility of ordering supply is decentralised, which means that categories of
products (Fruit and vegetables, Milk and dairy etc.) are assigned to different staff (and each
employee issues orders for his/her assigned category). Ordering is done manually, and
observations on shelf (whether stock-out or not) becomes input on a portable device (which
gathers all necessary data and provide information relevant for ordering a product). Later, the
data is transferred to the information system, and orders are submitted electronically.
The forecasting for each SKU is based on sales history the last 15 weeks (Moving average).
All weeks are equally weighted, and seasons are not part of the data. The output translates
into ordering quantities and safety-stock.
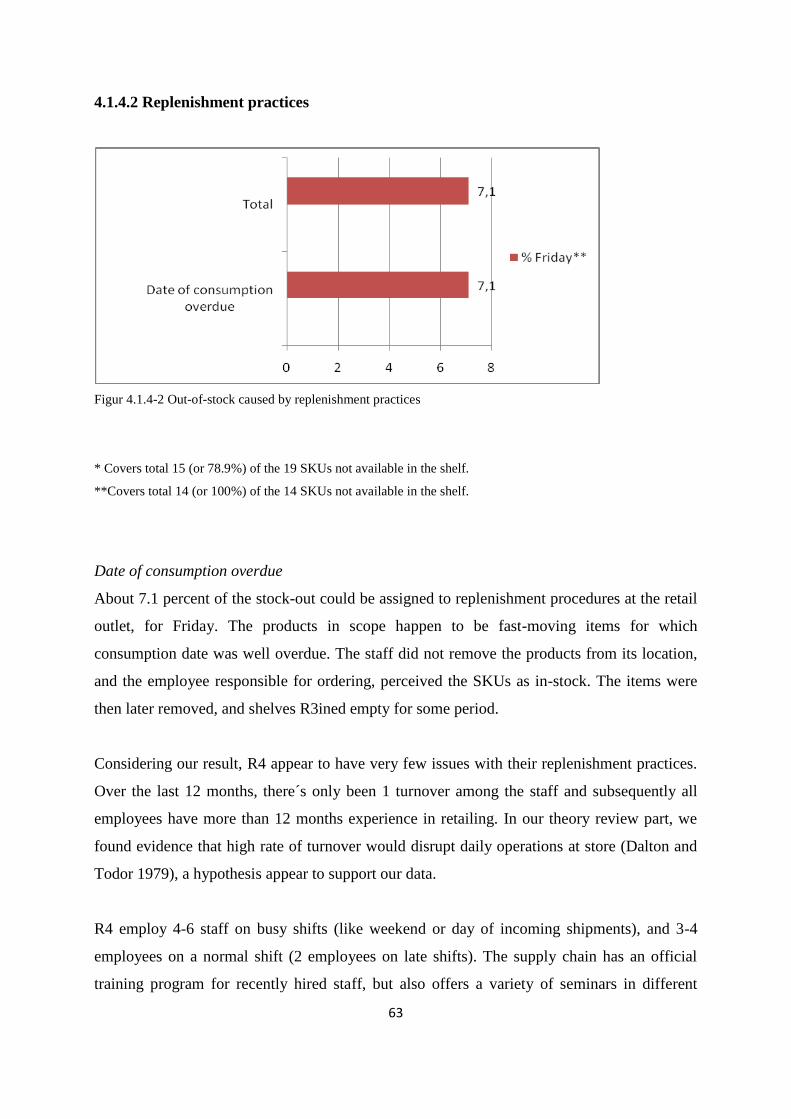
63
4.1.4.2 Replenishment practices
Figur 4.1.4-2 Out-of-stock caused by replenishment practices
* Covers total 15 (or 78.9%) of the 19 SKUs not available in the shelf.
**Covers total 14 (or 100%) of the 14 SKUs not available in the shelf.
Date of consumption overdue
About 7.1 percent of the stock-out could be assigned to replenishment procedures at the retail
outlet, for Friday. The products in scope happen to be fast-moving items for which
consumption date was well overdue. The staff did not remove the products from its location,
and the employee responsible for ordering, perceived the SKUs as in-stock. The items were
then later removed, and shelves R3ined empty for some period.
Considering our result, R4 appear to have very few issues with their replenishment practices.
Over the last 12 months, there´s only been 1 turnover among the staff and subsequently all
employees have more than 12 months experience in retailing. In our theory review part, we
found evidence that high rate of turnover would disrupt daily operations at store (Dalton and
Todor 1979), a hypothesis appear to support our data.
R4 employ 4-6 staff on busy shifts (like weekend or day of incoming shipments), and 3-4
employees on a normal shift (2 employees on late shifts). The supply chain has an official
training program for recently hired staff, but also offers a variety of seminars in different

64
fields (training program for improving sales person ability, fire and medical aid training,
basics in business operations, economical aspect of store operations etc.).
Considering the policy of staff employment, we would say that the supply chain focus on
efficiency. We also believe that various training programs allow this way of thinking without
reducing the service level.
4.1.4.3 Planning practices
Figur 4.1.4-3 Out-of-stock caused by planning practices
* Covers total 15 (or 78.9%) of the 19 SKUs not available in the shelf.
**Covers total 14 (or 100%) of the 14 SKUs not available in the shelf.
New SKU in assortment
About 6.7 percent of the OOS on Monday (figure 4.2-19), were due to the planning of a new
SKU. The labels happen to be present on the shelf, but the item was not part of the assortment
yet. More precise, there existed a link between the concerning item and an identical product
already available in the shelf. As soon as the available product (which is about to be removed
from assortment) is sold out and removed from inventory, the new SKU continue the shelf
space of the original item.
We believe the store should have postponed putting up a new label, until the planned item
actually entered the assortment. The customer perceives the item as part of the assortment
(label present on shelf) and OOS, when SKU is not available in the shelf.
65
Item discontinued by supplier
Figure 15 reveals that 33.3 percent of the OOS Monday could be blamed on discontinued
SKUs. For Friday, we have about 28.6 percent for the same category. 25 percent of the
concerning items on Friday (in the item discontinued category) were seasonal products, and
observations discovered a bar-code present on the label for about 2/4 of the OOS incidents.
Commonly, when a SKU is discontinued and bar-code is still present on label, this would
suggest that the retail manager does not know that the item no longer is part of assortment.
Hence, most likely there exists a communication problem in the supply chain.
On Monday, about half of the concerning items had a bar-code present, an aspect that further
should put attention to the communication issues in the supply chain. 25 percent of the
discontinued items on Friday were in fact part of the supply chains own brand name (R4
offers the SKU as a low price substitute). Another 25 percent were on a VMI program, and
suppliers take care of ordering and replenishment. In this case, the supplier should have
removed label for any discontinued SKUs and perhaps notified the retail manager.
Last, there is the opportunity that retail manager and/or employees knew about the
discontinued SKUs, but simply forgot to remove the label from shelf/ location. At least 16
percent (by mistake did not observe for the rest) of the discontinued items Monday, had no
bar-code present on label. The observation implies that store have been notified, and any label
is replaced with a temporarily solution (until the discontinued item is sold out and removed
from inventory). The result was at least 20 percent for Friday.
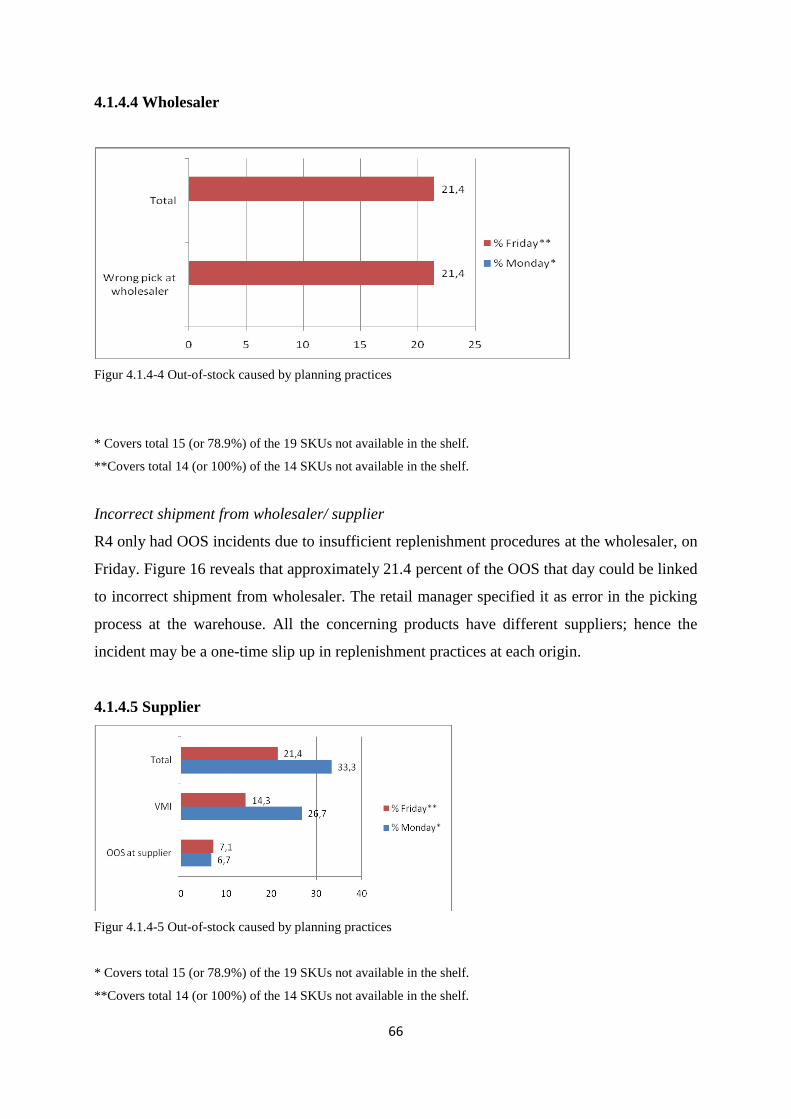
66
4.1.4.4 Wholesaler
Figur 4.1.4-4 Out-of-stock caused by planning practices
* Covers total 15 (or 78.9%) of the 19 SKUs not available in the shelf.
**Covers total 14 (or 100%) of the 14 SKUs not available in the shelf.
Incorrect shipment from wholesaler/ supplier
R4 only had OOS incidents due to insufficient replenishment procedures at the wholesaler, on
Friday. Figure 16 reveals that approximately 21.4 percent of the OOS that day could be linked
to incorrect shipment from wholesaler. The retail manager specified it as error in the picking
process at the warehouse. All the concerning products have different suppliers; hence the
incident may be a one-time slip up in replenishment practices at each origin.
4.1.4.5 Supplier
Figur 4.1.4-5 Out-of-stock caused by planning practices
* Covers total 15 (or 78.9%) of the 19 SKUs not available in the shelf.
**Covers total 14 (or 100%) of the 14 SKUs not available in the shelf.
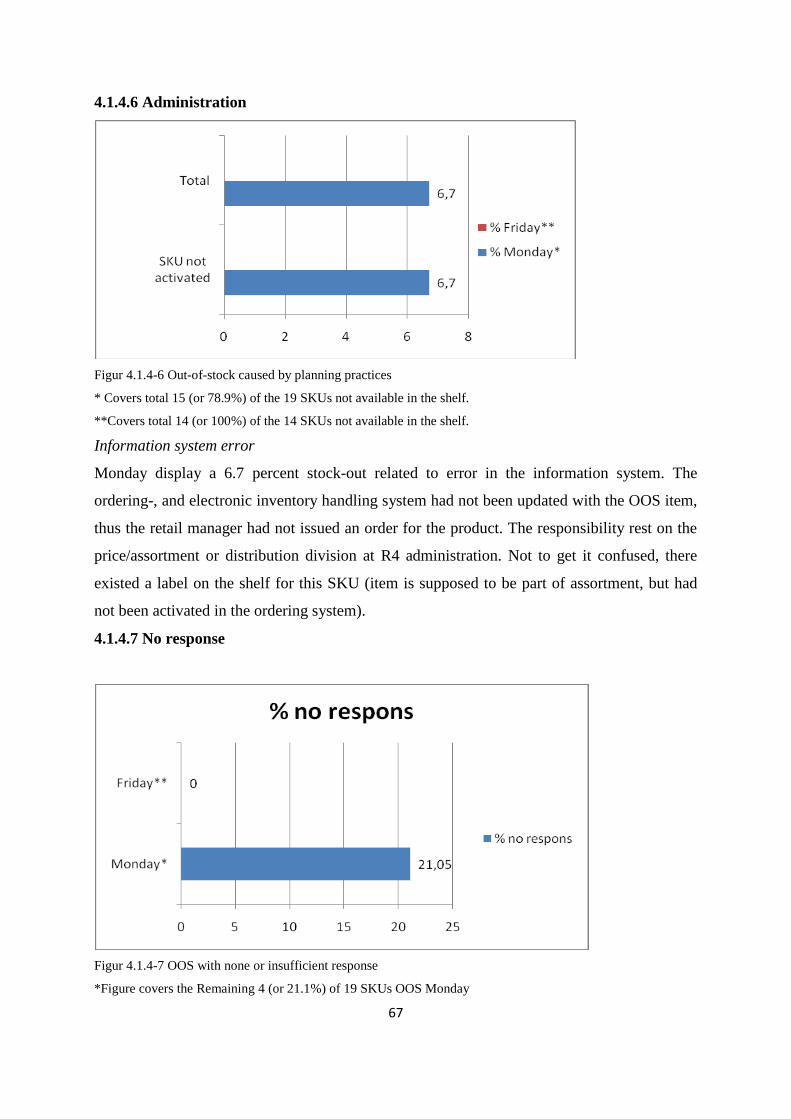
67
4.1.4.6 Administration
Figur 4.1.4-6 Out-of-stock caused by planning practices
* Covers total 15 (or 78.9%) of the 19 SKUs not available in the shelf.
**Covers total 14 (or 100%) of the 14 SKUs not available in the shelf.
Information system error
Monday display a 6.7 percent stock-out related to error in the information system. The
ordering-, and electronic inventory handling system had not been updated with the OOS item,
thus the retail manager had not issued an order for the product. The responsibility rest on the
price/assortment or distribution division at R4 administration. Not to get it confused, there
existed a label on the shelf for this SKU (item is supposed to be part of assortment, but had
not been activated in the ordering system).
4.1.4.7 No response
Figur 4.1.4-7 OOS with none or insufficient response
*Figure covers the Remaining 4 (or 21.1%) of 19 SKUs OOS Monday

68
4.1.5 Retail store 5 (R5)
4.1.5.1 Order practices
Figur 4.1.5-1 Out-of-stock caused by order practices
* Covers total 12 (or 92.3%) of the 13 SKUs not available in the shelf.
**Covers total 11 (or 100%) of the 11 SKUs not available in the shelf.
Decided not to order
About 9.1 percent of OOS Thursday were a result of the retail management‘s decision not to
order the concerning SKUs. The items are part of a voluntary assortment, and may only be
present from time to time (like during weekends). The responsibility of ordering is
decentralised and information systems (ABC, data about seasonal variation etc) are heavily
deployed to secure the reliability of forecasts
Issued order too late
On Monday the store had 8.3 percent OOS due to a late order.

69
4.1.5.2 Replenishment practices
Figur 4.1.5-2 Out-of-stock caused by order practices
* Covers total 12 (or 92.3%) of the 13 SKUs not available in the shelf.
**Covers total 11 (or 100%) of the 11 SKUs not available in the shelf.
Item covered by another SKU
A 9.1 percent OOS on Thursday reflects the situation were the original product was covered
by a misplaced item.
Item located on top shelf
On Thursday another 9.1 percent of total OOS happen to sit on the top shelf, not yet being
replenished.
Item located in back room
An 8.3 percent OOS on Monday was located in the storage area, more specific at the freezer.
Item not visible
Monday and Thursday represented a total 8.3 and 18.2 percent OOS respectively due to SKUs
not being visible in shelves (hidden in the back of shelves).

70
Another item in shelf
A 9.1 and 33.3 percent OOS for Thursday and Monday respectively reflects poor
replenishment practices, where items had been misplaced. This could also be the result of
customers putting items back in the wrong place (decided not to buy).
4.1.5.3 Wholesaler
Figur 4.1.5-3 Out-of-stock caused by order practices
* Covers total 12 (or 92.3%) of the 13 SKUs not available in the shelf.
**Covers total 11 (or 100%) of the 11 SKUs not available in the shelf.
Communication issues
On Monday we found 8.3 percent OOS due to wholesaler reasons. The situation concerns
communication problems, with the result of products not being delivered. This had been an
issue for multiple times over a short period.

71
4.1.5.4 Supplier
Figur 4.1.5-4 Out-of-stock caused by order practices
* Covers total 12 (or 92.3%) of the 13 SKUs not available in the shelf.
**Covers total 11 (or 100%) of the 11 SKUs not available in the shelf.
Product quality issues
A 9.1 percent OOS on Thursday reflects a few SKUs that had to be returned to the supplier
due to the product quality not meeting some preset standards.
VMI
About 16.7 percent of the OOS Monday happen to be on VMI program. Supplier is
responsible for OOS.
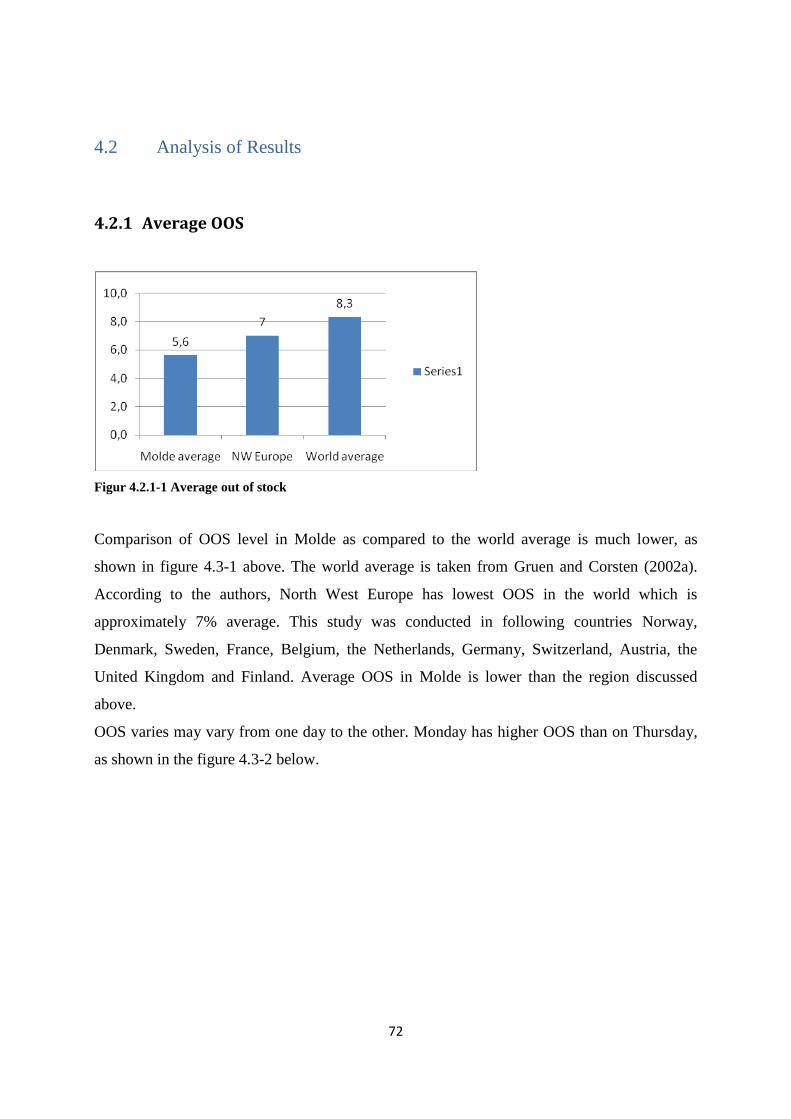
72
4.2 Analysis of Results
4.2.1 Average OOS
Figur 4.2.1-1 Average out of stock
Comparison of OOS level in Molde as compared to the world average is much lower, as
shown in figure 4.3-1 above. The world average is taken from Gruen and Corsten (2002a).
According to the authors, North West Europe has lowest OOS in the world which is
approximately 7% average. This study was conducted in following countries Norway,
Denmark, Sweden, France, Belgium, the Netherlands, Germany, Switzerland, Austria, the
United Kingdom and Finland. Average OOS in Molde is lower than the region discussed
above.
OOS varies may vary from one day to the other. Monday has higher OOS than on Thursday,
as shown in the figure 4.3-2 below.
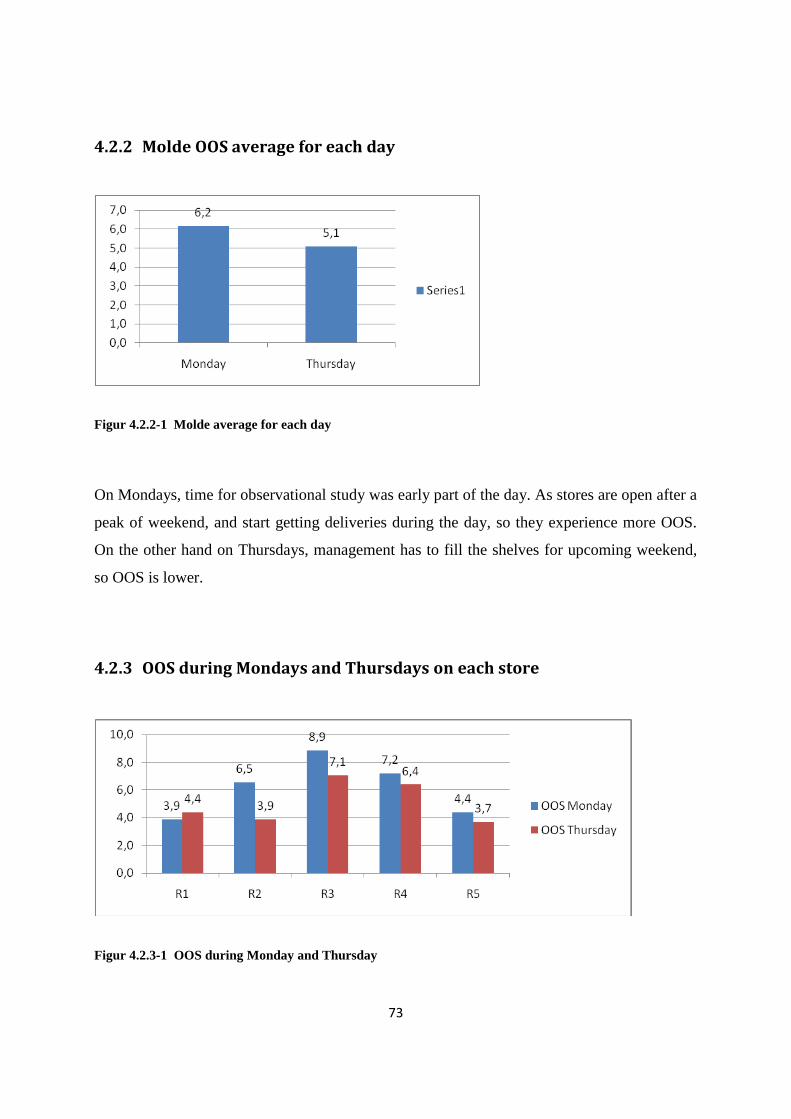
73
4.2.2 Molde OOS average for each day
Figur 4.2.2-1 Molde average for each day
On Mondays, time for observational study was early part of the day. As stores are open after a
peak of weekend, and start getting deliveries during the day, so they experience more OOS.
On the other hand on Thursdays, management has to fill the shelves for upcoming weekend,
so OOS is lower.
4.2.3 OOS during Mondays and Thursdays on each store
Figur 4.2.3-1 OOS during Monday and Thursday
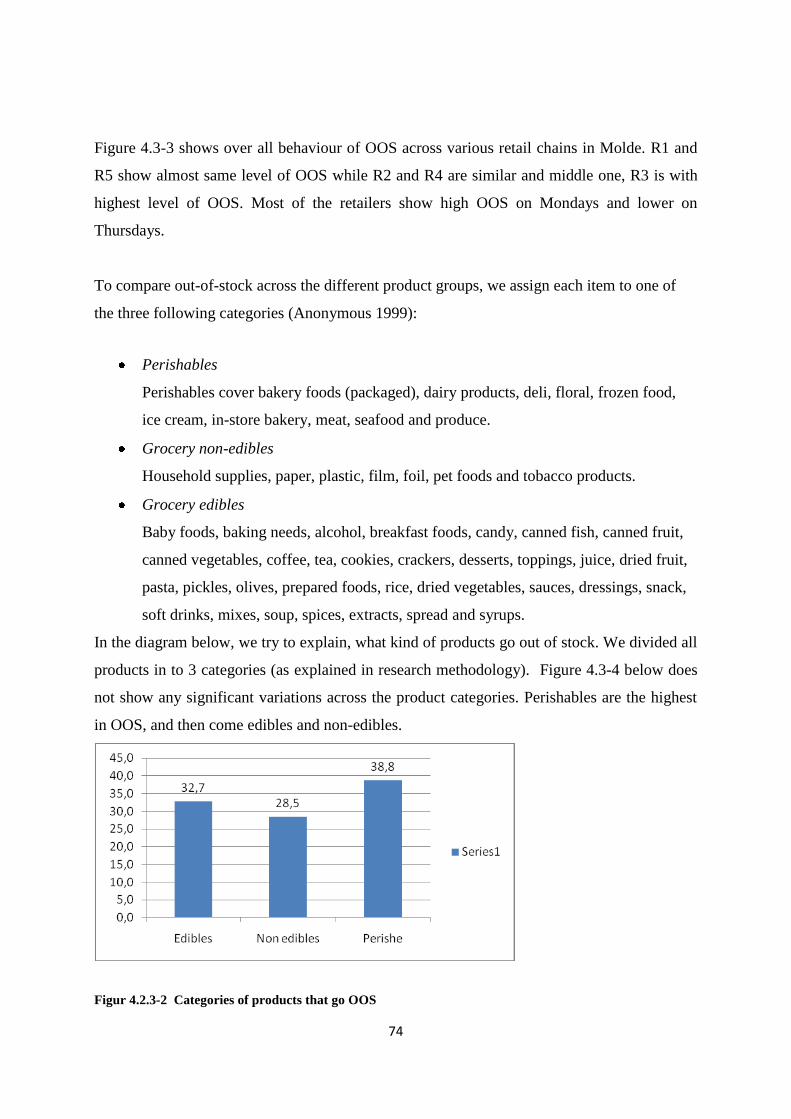
74
Figure 4.3-3 shows over all behaviour of OOS across various retail chains in Molde. R1 and
R5 show almost same level of OOS while R2 and R4 are similar and middle one, R3 is with
highest level of OOS. Most of the retailers show high OOS on Mondays and lower on
Thursdays.
To compare out-of-stock across the different product groups, we assign each item to one of
the three following categories (Anonymous 1999):
Perishables
Perishables cover bakery foods (packaged), dairy products, deli, floral, frozen food,
ice cream, in-store bakery, meat, seafood and produce.
Grocery non-edibles
Household supplies, paper, plastic, film, foil, pet foods and tobacco products.
Grocery edibles
Baby foods, baking needs, alcohol, breakfast foods, candy, canned fish, canned fruit,
canned vegetables, coffee, tea, cookies, crackers, desserts, toppings, juice, dried fruit,
pasta, pickles, olives, prepared foods, rice, dried vegetables, sauces, dressings, snack,
soft drinks, mixes, soup, spices, extracts, spread and syrups.
In the diagram below, we try to explain, what kind of products go out of stock. We divided all
products in to 3 categories (as explained in research methodology). Figure 4.3-4 below does
not show any significant variations across the product categories. Perishables are the highest
in OOS, and then come edibles and non-edibles.
Figur 4.2.3-2 Categories of products that go OOS

75
4.2.4 Reasons behind OOS and comparison among Molde average, Europe
and World Average
Figur 4.2.4-1 Reasons behind OOS
If we look in to the figure 4.3-5, it gives us an idea that store ordering is the most important
reason behind OOS in world. Molde average is even less than average of Europe, and this
difference is significant. In Molde, the most important reason behind OOS is store
replenishment, which seems to be over all phenomena in Europe too. In Molde the second
most important reason behind OOS is suppler. This includes performance of vendors. Retail
store in many cases experience OOS because they don‘t replenish inventory, and these are the
items that are not order in most of the cases store can exert very low level of control over
them.
Over all we can say 66% OOS reasons are related to store performance, which is lower than
over all world average. As world average says that in 72% cases OOS situations are caused by
the poor performance of store related functions. Here from the methodological point of view,
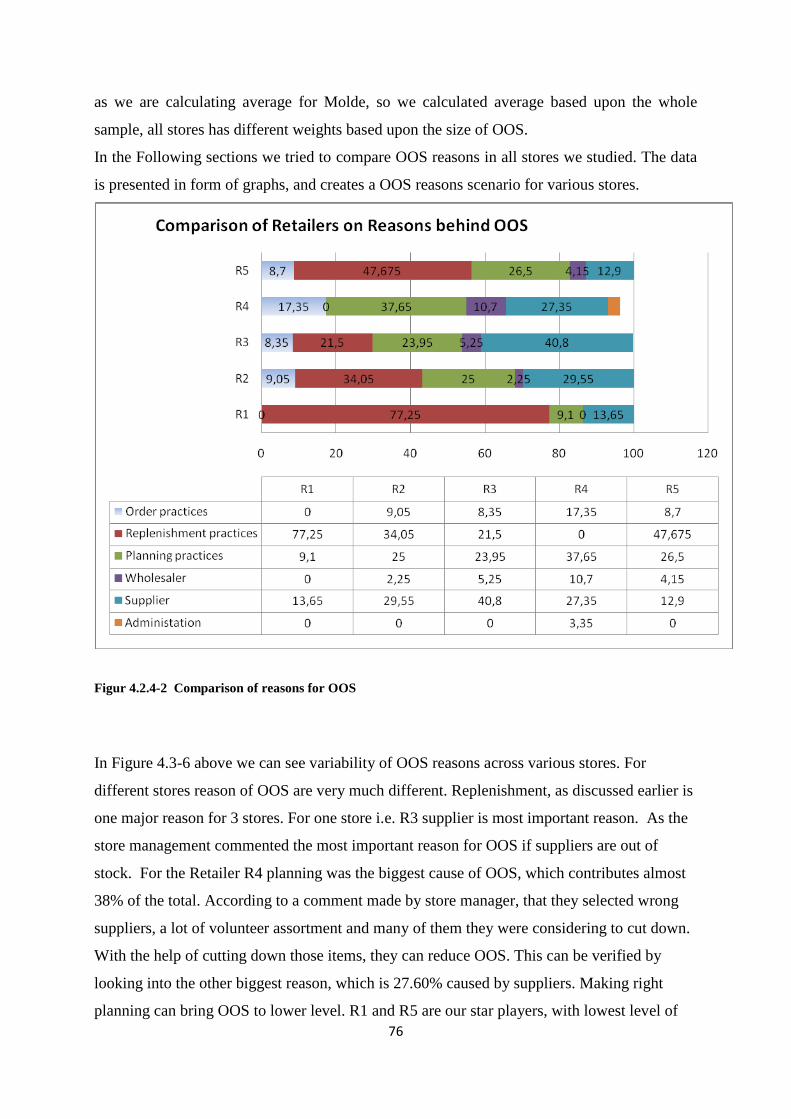
76
as we are calculating average for Molde, so we calculated average based upon the whole
sample, all stores has different weights based upon the size of OOS.
In the Following sections we tried to compare OOS reasons in all stores we studied. The data
is presented in form of graphs, and creates a OOS reasons scenario for various stores.
Figur 4.2.4-2 Comparison of reasons for OOS
In Figure 4.3-6 above we can see variability of OOS reasons across various stores. For
different stores reason of OOS are very much different. Replenishment, as discussed earlier is
one major reason for 3 stores. For one store i.e. R3 supplier is most important reason. As the
store management commented the most important reason for OOS if suppliers are out of
stock. For the Retailer R4 planning was the biggest cause of OOS, which contributes almost
38% of the total. According to a comment made by store manager, that they selected wrong
suppliers, a lot of volunteer assortment and many of them they were considering to cut down.
With the help of cutting down those items, they can reduce OOS. This can be verified by
looking into the other biggest reason, which is 27.60% caused by suppliers. Making right
planning can bring OOS to lower level. R1 and R5 are our star players, with lowest level of

77
OOS. For both days, their OOS percentage is around 4%. For both of them one major reason
of OOS is number of Employees. R1 and R5 with minimum no of Employees, experiencing
heights level of OOS due to replenishments. The reliability of this can be measured against
another variable, which is number of employees during the shift when stores receive
shipments. Low vales for this shift also referred to the same conclusion.
Employee data for all stores is as below:
Tabell 3
R1 R2 R3 R4 R5
Total no of employees 8 15 19 12 10
Total no of employees when they receive shipments 4 6-7 6-7 4-6 4
The store R2 is an interesting study, this store is a family owned business, run by different
family members. Thought there are some non family members working there, but major
responsibilities are divided amongst close family. An organization with 15 employees, but
with poor replenishment can be a good organization behaviour study. Most of the functions
are done informally and tasks are not very well defined. For example, while asking who
performs Ordering function, the contact person responded that ―either me or my father‖. If we
evaluate the OOS performance, it is not very poor; overall OOS is slightly more than the
Molde average. Our assessment is they used informality as a tool to achieve their objectives,
with more flexibility and understanding; they work like a good team and produce good results
and OOS slides down from Monday Thursday from 6.5% to less than 4%.
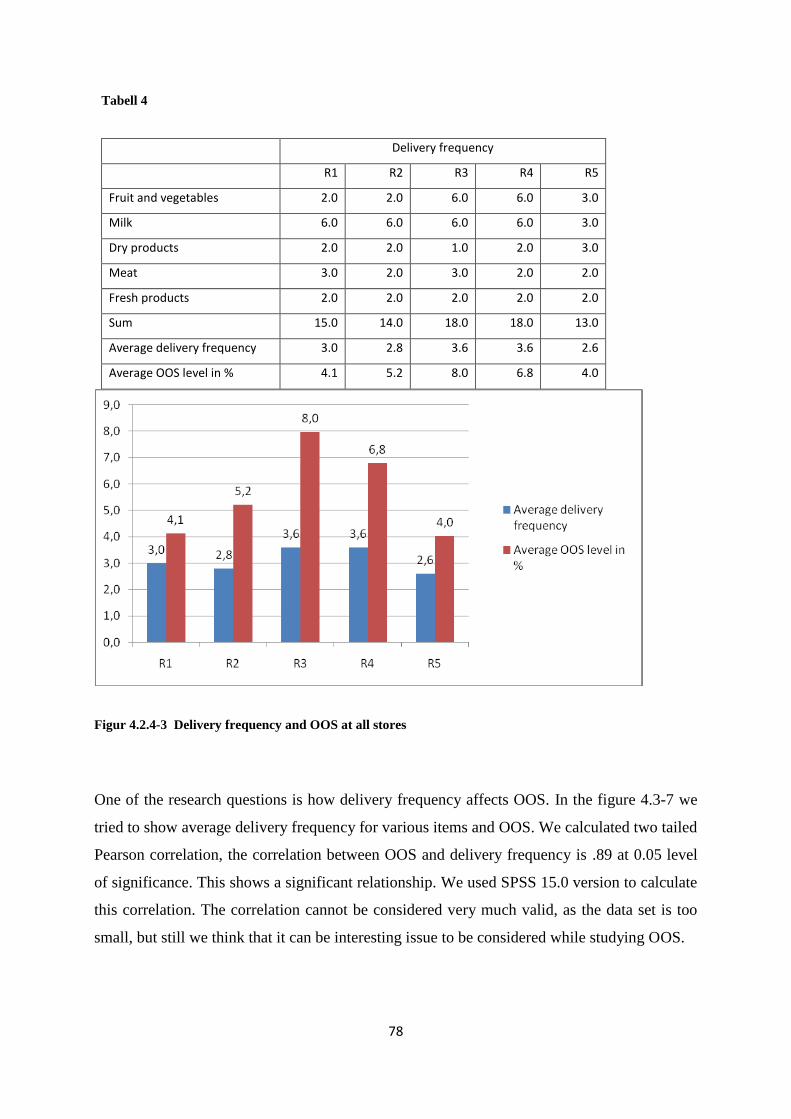
78
Tabell 4
Delivery frequency
R1 R2 R3 R4 R5
Fruit and vegetables 2.0 2.0 6.0 6.0 3.0
Milk 6.0 6.0 6.0 6.0 3.0
Dry products 2.0 2.0 1.0 2.0 3.0
Meat 3.0 2.0 3.0 2.0 2.0
Fresh products 2.0 2.0 2.0 2.0 2.0
Sum 15.0 14.0 18.0 18.0 13.0
Average delivery frequency 3.0 2.8 3.6 3.6 2.6
Average OOS level in % 4.1 5.2 8.0 6.8 4.0
Figur 4.2.4-3 Delivery frequency and OOS at all stores
One of the research questions is how delivery frequency affects OOS. In the figure 4.3-7 we
tried to show average delivery frequency for various items and OOS. We calculated two tailed
Pearson correlation, the correlation between OOS and delivery frequency is .89 at 0.05 level
of significance. This shows a significant relationship. We used SPSS 15.0 version to calculate
this correlation. The correlation cannot be considered very much valid, as the data set is too
small, but still we think that it can be interesting issue to be considered while studying OOS.
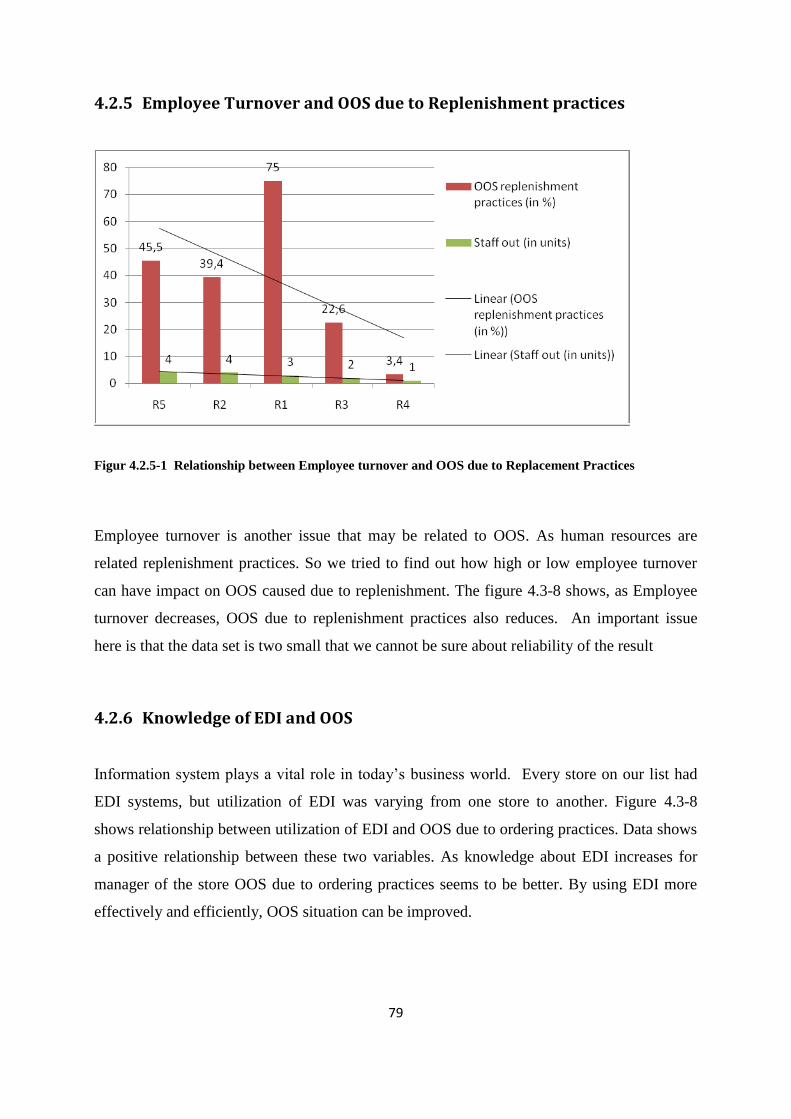
79
4.2.5 Employee Turnover and OOS due to Replenishment practices
Figur 4.2.5-1 Relationship between Employee turnover and OOS due to Replacement Practices
Employee turnover is another issue that may be related to OOS. As human resources are
related replenishment practices. So we tried to find out how high or low employee turnover
can have impact on OOS caused due to replenishment. The figure 4.3-8 shows, as Employee
turnover decreases, OOS due to replenishment practices also reduces. An important issue
here is that the data set is two small that we cannot be sure about reliability of the result
4.2.6 Knowledge of EDI and OOS
Information system plays a vital role in today‘s business world. Every store on our list had
EDI systems, but utilization of EDI was varying from one store to another. Figure 4.3-8
shows relationship between utilization of EDI and OOS due to ordering practices. Data shows
a positive relationship between these two variables. As knowledge about EDI increases for
manager of the store OOS due to ordering practices seems to be better. By using EDI more
effectively and efficiently, OOS situation can be improved.
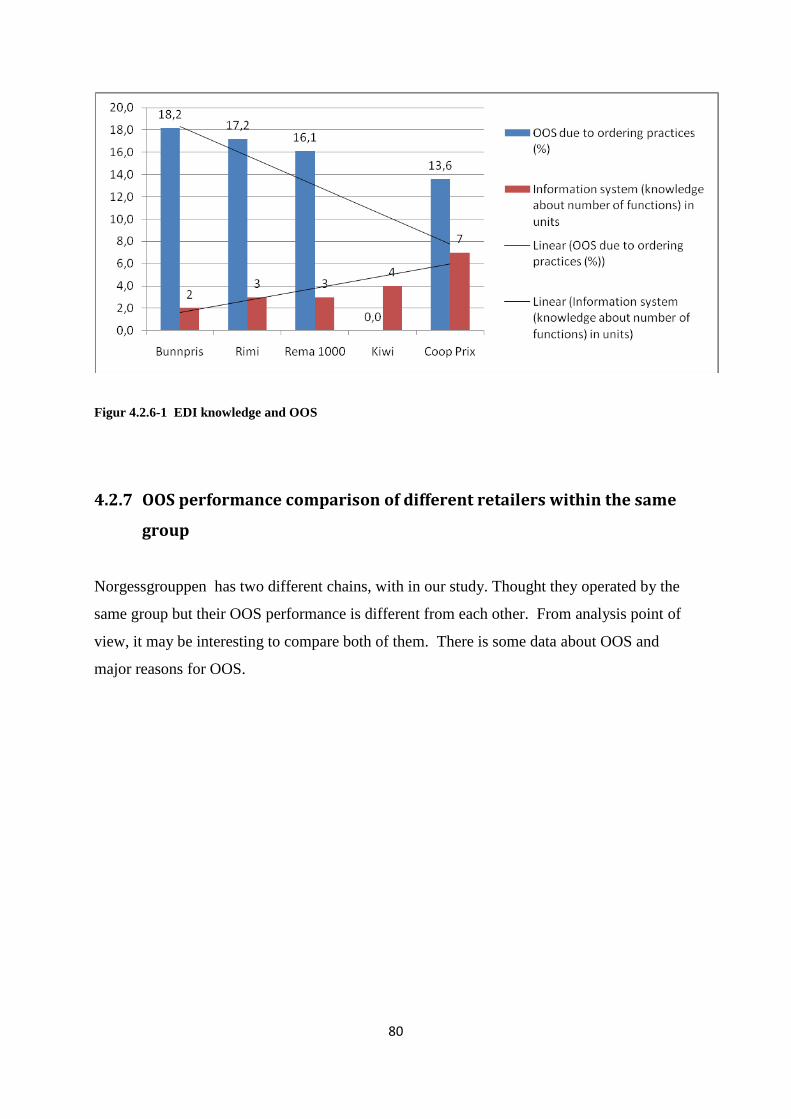
80
Figur 4.2.6-1 EDI knowledge and OOS
4.2.7 OOS performance comparison of different retailers within the same
group
Norgessgrouppen has two different chains, with in our study. Thought they operated by the
same group but their OOS performance is different from each other. From analysis point of
view, it may be interesting to compare both of them. There is some data about OOS and
major reasons for OOS.
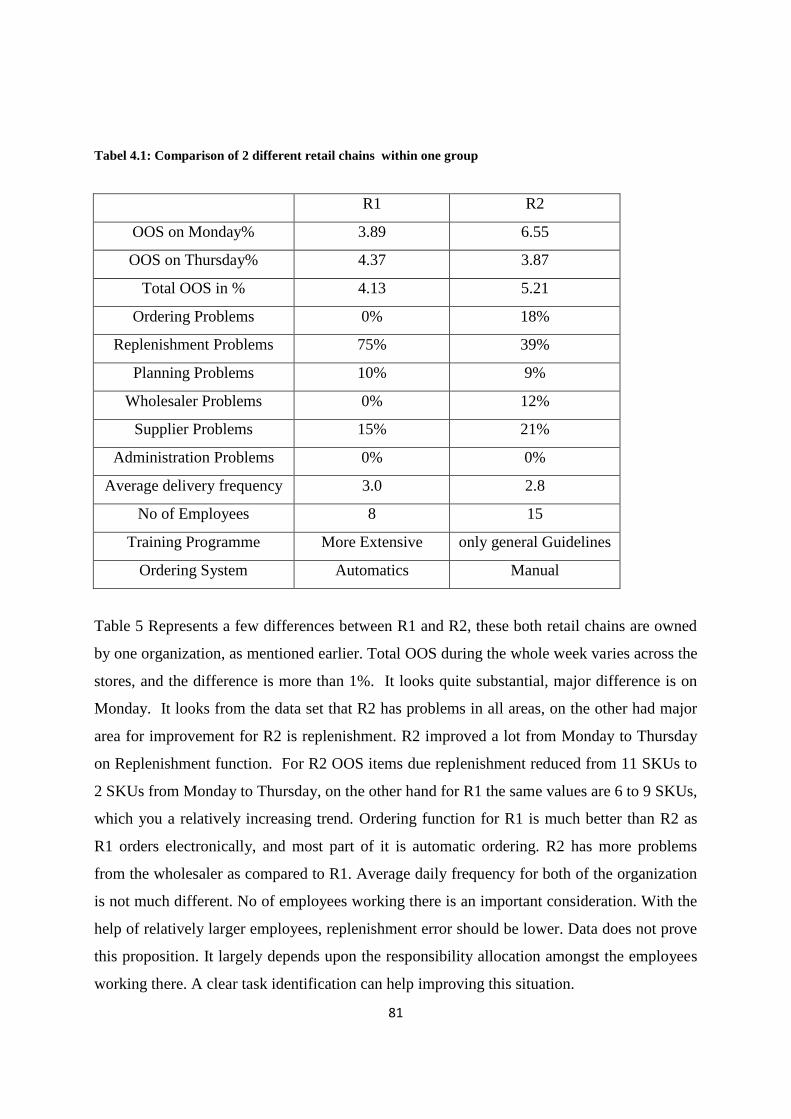
81
Tabel 4.1: Comparison of 2 different retail chains within one group
R1 R2
OOS on Monday% 3.89 6.55
OOS on Thursday% 4.37 3.87
Total OOS in % 4.13 5.21
Ordering Problems 0% 18%
Replenishment Problems 75% 39%
Planning Problems 10% 9%
Wholesaler Problems 0% 12%
Supplier Problems 15% 21%
Administration Problems 0% 0%
Average delivery frequency 3.0 2.8
No of Employees 8 15
Training Programme More Extensive only general Guidelines
Ordering System Automatics Manual
Table 5 Represents a few differences between R1 and R2, these both retail chains are owned
by one organization, as mentioned earlier. Total OOS during the whole week varies across the
stores, and the difference is more than 1%. It looks quite substantial, major difference is on
Monday. It looks from the data set that R2 has problems in all areas, on the other had major
area for improvement for R2 is replenishment. R2 improved a lot from Monday to Thursday
on Replenishment function. For R2 OOS items due replenishment reduced from 11 SKUs to
2 SKUs from Monday to Thursday, on the other hand for R1 the same values are 6 to 9 SKUs,
which you a relatively increasing trend. Ordering function for R1 is much better than R2 as
R1 orders electronically, and most part of it is automatic ordering. R2 has more problems
from the wholesaler as compared to R1. Average daily frequency for both of the organization
is not much different. No of employees working there is an important consideration. With the
help of relatively larger employees, replenishment error should be lower. Data does not prove
this proposition. It largely depends upon the responsibility allocation amongst the employees
working there. A clear task identification can help improving this situation.
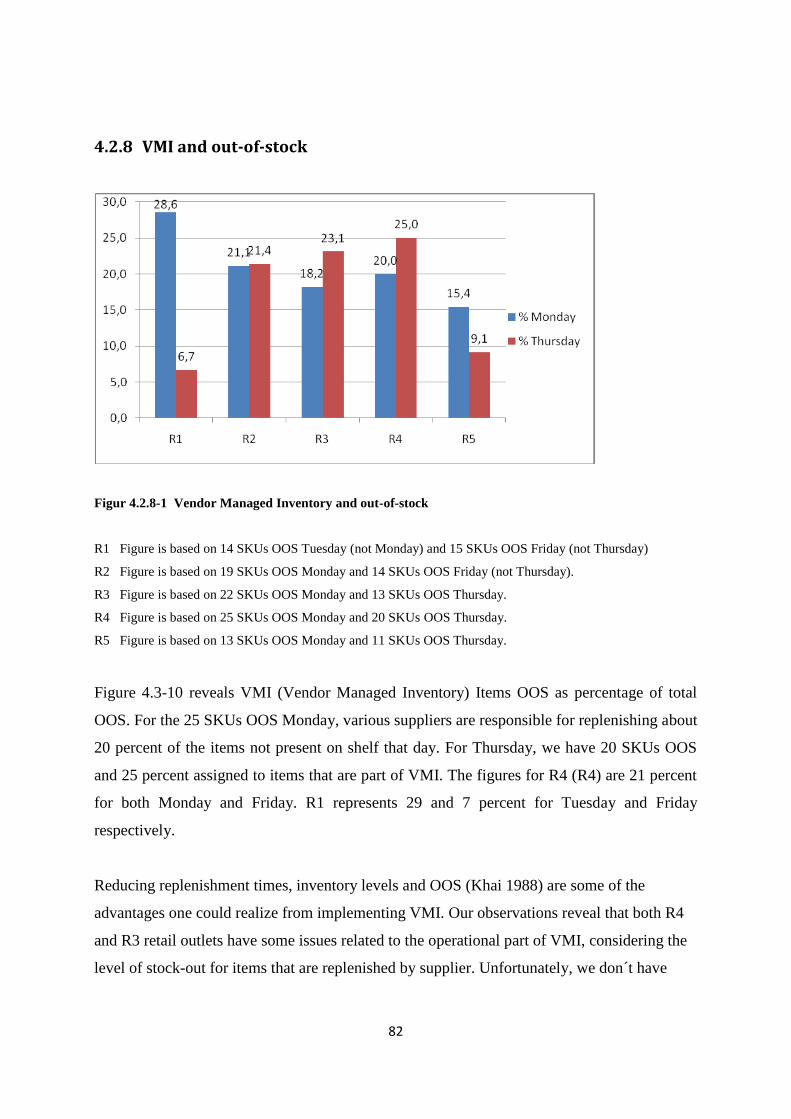
82
4.2.8 VMI and out-of-stock
Figur 4.2.8-1 Vendor Managed Inventory and out-of-stock
R1 Figure is based on 14 SKUs OOS Tuesday (not Monday) and 15 SKUs OOS Friday (not Thursday)
R2 Figure is based on 19 SKUs OOS Monday and 14 SKUs OOS Friday (not Thursday).
R3 Figure is based on 22 SKUs OOS Monday and 13 SKUs OOS Thursday.
R4 Figure is based on 25 SKUs OOS Monday and 20 SKUs OOS Thursday.
R5 Figure is based on 13 SKUs OOS Monday and 11 SKUs OOS Thursday.
Figure 4.3-10 reveals VMI (Vendor Managed Inventory) Items OOS as percentage of total
OOS. For the 25 SKUs OOS Monday, various suppliers are responsible for replenishing about
20 percent of the items not present on shelf that day. For Thursday, we have 20 SKUs OOS
and 25 percent assigned to items that are part of VMI. The figures for R4 (R4) are 21 percent
for both Monday and Friday. R1 represents 29 and 7 percent for Tuesday and Friday
respectively.
Reducing replenishment times, inventory levels and OOS (Khai 1988) are some of the
advantages one could realize from implementing VMI. Our observations reveal that both R4
and R3 retail outlets have some issues related to the operational part of VMI, considering the
level of stock-out for items that are replenished by supplier. Unfortunately, we don´t have
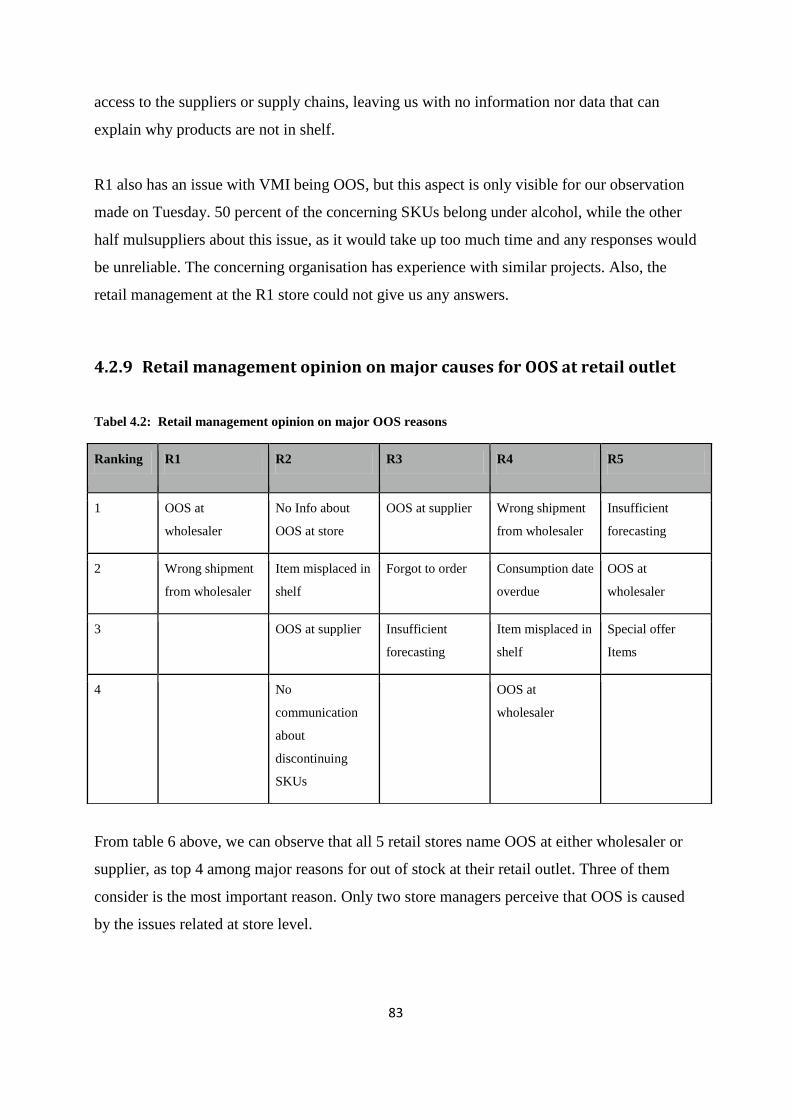
83
access to the suppliers or supply chains, leaving us with no information nor data that can
explain why products are not in shelf.
R1 also has an issue with VMI being OOS, but this aspect is only visible for our observation
made on Tuesday. 50 percent of the concerning SKUs belong under alcohol, while the other
half mulsuppliers about this issue, as it would take up too much time and any responses would
be unreliable. The concerning organisation has experience with similar projects. Also, the
retail management at the R1 store could not give us any answers.
4.2.9 Retail management opinion on major causes for OOS at retail outlet
Tabel 4.2: Retail management opinion on major OOS reasons
From table 6 above, we can observe that all 5 retail stores name OOS at either wholesaler or
supplier, as top 4 among major reasons for out of stock at their retail outlet. Three of them
consider is the most important reason. Only two store managers perceive that OOS is caused
by the issues related at store level.
Ranking R1 R2 R3 R4 R5
1 OOS at
wholesaler
No Info about
OOS at store
OOS at supplier Wrong shipment
from wholesaler
Insufficient
forecasting
2 Wrong shipment
from wholesaler
Item misplaced in
shelf
Forgot to order Consumption date
overdue
OOS at
wholesaler
3 OOS at supplier Insufficient
forecasting
Item misplaced in
shelf
Special offer
Items
4 No
communication
about
discontinuing
SKUs
OOS at
wholesaler

84
Poor forecasting and misplacement of item in shelves are two other important reasons causing
OOS, as perceived by managers. These results give us an understanding that, store managers
identify that OOS is caused more due to the reasons outside their store, which is not verified
by result.
4.3 Discussion
OOS is a common problem for all types of retailers. It is true that they cannot maintain a very
high level of service in all cases. I many cases, retailers pay all costs for carrying an item, but
still they are OOS, which causes more damages to their business. Empty shelves cause loss of
sales at that point of time, but it has its long term implications for them. A customer who
expects something to be available in store, when does not find it there, leads to various
responses. Customer my switch brand, switching brand means cost for the manufacturer
immediately. For retailer, this situation may be costly in long run. If shopper postpones
cancels or buys it from other store, in all situations, it is expensive for the retailer directly.
Retailer can also lose this customer for future. In this way ―On the Shelf availability‖ is very
important for retailers. No retailer can ignore being OOS when particularly they are bearing
cost to carry those SKUs.
We conducted a study to evaluate the On the Shelf availability in Molde grocery environment.
Most of the store face problem of OOS with varying degree. Average OSA is 93.2%, which is
quite reasonable. Over all OOS in Molde is 5.6%, which is less than the world average and
average of North Western Europe. All stores face OOS in almost all type of product
categories including store edibles, non-edibles and perishables. Highest OOS is in Perishables
followed by edibles; both contribute more than 70% of OOS. As they are food based grocery
stores, so they carry food items more than nonfood, that‘s why they face high OOS in food
items.
There are different reasons behind OOS; some can be attributed to store level inefficiencies
and some out of store. Most of the retail managers are of the view that they are OOS due the
wholesaler and vendors. Data revealed a different picture. Store ordering is the biggest reason
of OOS in the world, but in Molde is significantly low, though it varies from one store to the
others. Replenishment is the biggest problem here. In 66% cases, OOS was caused by store

85
level inefficiencies. And the managers responsible for store operations do not give it much
consideration. To find out OOS reasons, they look out of store.
A comparison of OOS and tracing reason helped us to develop an understanding about the
situation that why the retailers face OOS. Poor Store operations are the biggest reason behind
OOS, the other biggest reason is Vendor Managed Inventory. In 27% cases, VMI was not
available on shelves. Another important point here is, that store management has no much
knowledge of stock level of VMI. Lack of knowledge in many cases causes problems in OSA.
A good information system about stock out can help solving this problem. Moreover
contacting with vendors is also an important issue. Lowest VMI out of stock we found in R5,
which is a company operated store, all buying is centralized, so they can exert relatively high
level control over vendors, which leads to low OOS. Moreover, information sharing with
vendors is too low. An integtrative supply chain can slove this problem.
4.4 Shortcoming and limitation of our research: some suggestions for
Future research
Nothing can be perfect to the extent that there should not be any need for improvements.
Particularly, every research has room for improvement, like ours‘. We studied ―On the shelf
availability of ELDPs in Molde.‖ So, in future scope of the research can be increased. A
comparison between ELDPs and larger super markets, which deal in larger assortment and
operated by more professional management, can be compared. Moreover grocery stores can
be compared with other types of retailing, like clothing, hardware etc.
As all items are not of equal importance for every retail store. Some items are categorized
most critical and other may be less critical to carry on store. In current study, one of the
shortcomings of our research was that we did not try to identify importance of an SKU in
assortment. In future, if such study is repeated, an interesting comparison can be made to find
reason behind more critical to less critical items.
86
As our sample size was very small, we conducted our study in 5 different store, total OOS
items in a particular store was around 15 on a typical day. So we categorized all SKUs in
very broad categories. In future, such study can be conducted using larger sample sizes and
narrower product categories to draw more meaningful results.
Our unit for analysis in this study was retail store. In future, more research can be done based
upon relationships between retailers and other upstream supply chain members. For example
suppliers can be studied for the same issues, and their role in improving OSA can be
discussed.
We did not cover consumer responses in any OOS situation, a separate study can be
conducted to measure consumer response in OOS situations, and it can be compared with
other regions in the world.
Definition of OOS is also an important issue; we defined OOS by using stock list of retailers
to draw a sample and then verifying it physically. Stock out can be defined in consumer
terms. For consumers stock out is a situation when he or she does not find something he or
she looks for in store and expected it to be there.
From the data analysis and evaluation of result we listed some suggestions, than can improve
OSA at store level.
1. Human resources are most important; every store should have well trained personnel,
who can organize SKUs on their appropriate places with minimum waste of time. The
employees must be motivated through training and feedback. As some retailers may
face high employee turnover, so they should have some quick training modules for
new entrants in the job.
2. EDI systems must be utilized effectively and efficiently, store managers and other
personnel who are involved in ordering should be trained to use EDI systems for
forecasting and take off rate from shelves.
87
3. EDI systems should be improved, as all stores generate POS data, this data must be
used to know stock levels at store. EDI system should give indication when stock
reaches at reorder level.
4. Data sharing is also an important issue. Stores generate a lot of POS data, this data
should be shared with suppliers of both store managed inventory and VMI.
5. Above all a collaborative supply chain can increase value for all partners in chain.
This issue should be taken into account by the wholesalers, because they are the
largest stakeholders in the system, they should look for increasing collaborations with
the supply chain members.
88
References
1. Alexander, K., Birkhofer, G,. Gramling, K., Kleinberger, H., Leng, S., Moogimame, D.
and Woods, M. (2002), Focus on retail: applying auto-ID to improve product
availability at retail shelf, viewed March 4th
2009,
http://www.autoidlabs.org/uploads/media/IBM-AUTOID-BC-001.pdf
2. Alexander, K., Gilliam, T., Gramlin, K., Grubelic, C., Kleinberger, H., Leng, S.,
Moogimame, D., Sheedy, C. (2003), Applying auto-id to reduce losses associated with
product obsolescence, viewed February 18th 2009,
http://www.autoidlabs.org/uploads/media/IBM-AUTOID-BC-004.pdf
3. Angerer, A. (2005), ―The impact of automatic store replenishment systems on retail‖,
viewed February 27th 2009,
http://www.unisg.ch/www/edis.nsf/wwwDisplayIdentifier/3123/$FILE/dis3123.pdf
4. Anonymous (1999), 1999 Sales manual: Databank, Progressive Grocer. Vol 78, Iss 7;
ABI/INFORM Global pg 55
5. Argote, L. and Epple, D. (1990), Learning curves in manufacturing, Science, vol. 247, p
920-924
6. Arnold, J.R., Chapman, S.N. and Clive, L.M. (2008), ―Introduction to materials
management‖, 6th edition 2008, p.219-220, Pearson Educational International, U.S.
7. Art T. and Ron G. (2004), Grocery shopping: List and non-list usage, Marketing
Intelligence & Planning, 22(6/7), 623-635
8. Bartholdi, J. and Hackman, S., Warehouse & Distribution Science, revised August 20th
2008, p 24, viewed March 4th
2009, http://www.warehouse-science.com/
9. Bengtsson, M. and Kock, S. (2000), Coopetition in Business Networks- To cooperate
and compete simultaneously, Industrial Marketing Management, Vol. 29, Iss. 4, pg.
411-426.
10. Boyer, Kenneth K. (2004), Extending the Supply Chain: How Cutting-Edge Companies
Bridge the Critical Last Mile into Customers‘ Homes. Saranac Lake, NY, USA:
AMACOM 2004. Pg. 62
89
11. (check out validity) Brackman, J.P. (2008), A Comprehensive Guide to Retail Out of
Stock Situations in the Fast moving Consumer Goods Industry, viewed March 18, 2009,
http://209.85.129.132/search?q=cache:Y3idaDhNvTsJ:www.gmaisld.com/RetailOutOfS
tockReduction_Brackman.pdf+%22planogram+compliance%22%2Bout+of+stock&cd=
5&hl=en&ct=clnk
12. Brooks, R. and Wilson, W. (2007), Inventory Record Inaccuracy: Unleashing the Power
of Cycle Counting, 2nd
edition 2007, published by John Wiley and Sons, p. 68
13. Businessline (2002), Shopping online at Tesco, Businessline. Chennai: March 7th,
2002. p 1
14. Campo, K., Gijsbrechts, E. and Nisol, P. (2000), Towards understanding consumer
response to stock-outs, Journal of Retailing, Vol. 76, Iss. 2, pg. 219-242
15. CFO Advisory services (2004), ―2004 Budgeting and Forecasting Survey Report:
Process Tweak or Process Overhaul?‖, viewed February 3rd 2009,
http://74.125.77.132/search?q=cache:W9-
Dp9iy0fgJ:www.us.kpmg.com/jnet/English/Archives/2005/MarApr/PDFs/2004_BudgF
or_Report.pdf+%22forecast+cycle%22%2Bretail&hl=no&ct=clnk&cd=83&gl=no
16. Chary, Philip b, Christopher, Martin, n.d. ―The anatomy of out of stock‖, Journal of
Retailing, Greenwich, summer 1979, Vol. 55, Issue 2, Page 59.
17. Colacchio, F., Tikhonova, O. and Kisis, J. (2003), Consumer Response to Out-of-
Stocks: Decision-making process and influence factors, student award essay 2003, by
International Commerce Review: ECR Journal.
18. Cooke, J.A. (1998), VMI: Very mixed impact? , Logistics Management and
Distribution Report, Vol. 37, Iss. 12; pg. 51
19. Coop NKL, n.d., Årsmelding 2007, viewed November 25th 2008,
http://85.19.206.30/_bin/9a867b12-f483-43b5-b370-646766edaa8a.pdf
20. Cooper, Chris (Editor) (2005), Shopping Tourism, Retailing and Leisure, Channel View
Publication, p. 162
21. Cooper, L., Baron, P., Levy, W., Swisher, M. and Gogos, P. (1999), PromoCast: A new
forecasting method for promotion planning, Marketing Science. Linthicum: 1999. Vol
18, Iss 3; pg. 301

90
22. Corsten, D. and Gruen, T. (2006), Improve out of stock methods at the shelf, Chain
Store Age. New York, Iss. July. Pg.35A, 1 pg.
23. Corsten, D. and Gruen, T (2004) ―Stock-outs cause Walkouts‖, Harvard Business
Review, May 2004, pp 26-29
24. Corsten, D. and Gruen, T. (2003), Desperately seeking shelf availability: an
examination of the extent, causes, and the efforts to address retail out-of-stock,
International Journal of Retail & Distribution Management, 31, 11/12; ABI/INFORM
Global pg.605
25. Corsten, D. and Gruen, T. (2002) ―Rising challenge of out-of-stocks―, ECR Journal,
Vol. 2, No. 2, Winter 2002 pg. 45.
26. Corsten, D. and Gruen, T. (2002b), Retail out of stocks: A worldwide examination of
extend, causes and consumer responses, viewed February 18th 2009,
27. Curhan, R. (1973), Shelf Space Allocation and Profit Maximization in Mass Retailing,
Journal of Marketing, Jul 1973; 37, p 54
28. Dagligvarehandelen (December 2007), Dagligvarefasiten, viewed November 25th 2008,
http://www.pht.no/prosjekt/dvh/fasit/fasit.html
29. Dalton, D. and Todor, W. (1979), Turnover turned over: An expanded and positive
perspective, Academy of Management Review, 4(2) p 225-232
30. Dennison, A. (2006), Finding value in item level RFID, white paper published by Avery
Dennison viewed February 18th 2009,.
31. DeHoratius, D. and Ton, Z. (2008), The role of execution in managing product
availability, chapter 4 in Retail supply chain Management, edited by N. Agrawal and S.
Smith, New York: Springer
32. DeHoratius, N. and Raman, A. (2004), Record Inventory Inaccuracy: an Empirical
Analysis, viewed March 4th, 2009,
http://209.85.129.132/search?q=cache:K8wEKqZdbUMJ:bctim.wustl.edu/calendar/med
iafiles/IRI04.pdf+error+in+picking+process%2Bwarehouse%2B%22stock+out%22&hl
=en&ct=clnk&cd=44
91
33. Dekker, M., van Donselaar, K. and Ouwehand, P. (2004), How to use aggregation and
combined forecasting to improve seasonal demand forecasts, International Journal of
Production Economics, Vol 90, Iss 2: pg 151-167
34. Denstadli J. M, Lines R. and Grønhaug K., (2005), ―First Mover Advantage in the
discount Grocery Industry‖, European Journal of Marketing, Vol. 39, No. 7/8, pp 873-
884
35. Drejer, A., Blackmon, K. and Voss, C. (1998), ``Worlds apart? a look at the operations
management area in the US, UK and Scandinavia'', Scandinavian Journal of
Management, Vol. 16, pp. 45-66.
36. ECR Austalasia (2001), A guide to Efficient Replenishment and reducing ―stock outs‖
within the Grocery Industry, Published online on ECR Australasia 2001
(www.ecraustralasia.org), viewed March 12, 2009,
http://www.ecraustralasia.org.au/node/41
37. Emmelhainz, M. and Emmelhainz, L. (1991), A logistic implications of retail stockouts,
Journal of Business Logistics, Vol. 12, Iss. 2
38. Fastinger, L. (1957), Theory of cognitive dissonance, Stanford University Press,
Stanford- Calif.
39. Gruen, T. and Corsten, D. (2007), A comprehensive guide to out-of-stock reduction in
the fast-moving consumer goods industry, Published online at GMA
(www.gmaonline.org), viewed March 12th
2009,
40. Harrison, M.N. (2008), Shopping at Sales, viewed February 4th 2009,
http://edis.ifas.ufl.edu/HE728
41. Heider, F. (1946), Attitude and Cognitive Organisation, Journal of Psychology, Vol. 21
42. Heung, V.C.S. and Cheng, E. (2000), Assessing tourists‘ satisfaction with shopping in
the Hong Kong Special Administrative Region of China, Journal of Travel Research,
Vol. 38 (4), p. 396-404
43. Ica (April 2009), Bokslutskommuniké ICA AB 1 januari – 31 december 2008,
http://www.ica.no/file_archive/arsberetninger//Arsberetning_2008.pdf
44. Kambil, A. (2003), Move over Bar-codes: Consumer-goods firms eye Radio-Frequency
ID, viewed February 11th 2009,
92
45. Kang,Y. and Gershwin, S. (2005), Information Inaccuracy in Inventory Systems: Stock
loss and Stockout, IIE Transactions, September 2005, Vol. 37; p 843-859, viewed
March 20, 2009, http://findarticles.com/p/articles/mi_hb6670/is_9_37/ai_n29204512
46. Kauffel, R., Leinwand, P., Sauer, J. and Utzig, C. (2007), The Power of Operational
POS From Managing at the Mean to Managing the Meaningful, viewed November
24th, http://www.boozallen.com/media/file/The_Power_of_Operational_POS.pdf
47. Kempfer, L. (2006), Warehouse basics: Picking fundamentals, viewed March 6, 2009,
http://www.mhmonline.com/nID/4948/MHM/viewStory.asp
48. Khai, Eric, G.S. (1988), What is Vendor Managed Inventory?, viewed February 17th
2009, http://www.12manage.com/methods_vendor_managed_inventory.html
49. Knowledge@Wharton, ―Out of Stock? It may be your employees payroll—Not your
supply chain—that‘s to blame‖, April 4, 2007.
50. Kotler P. (2003) Introduction to Marketing, Prentice Hall Inc. Chapter 16.
51. Kotler, P. and Scott W.G. (1993), Marketing Management, Iesdi Prentice Hall
International Utet, Torino.
52. Kulp S. Cohen, Lee L. Hau and Ofek E. (2004), Manufacturer Benefits from
information Integration with Retail Customers, Management Science, Vol. 50(4), p.
434-444
53. Kumar A. (2007). Using the Power of Excel in Estimating Systems. AACE
International Transactions,ES201-ES203,ES207-ES209,ES2010-ES2014. Retrieved
May 15, 2009, from ABI/INFORM Global database. (Document ID: 1466802211).
54. Lapide, L. (2008), Use VMI to improve forecasting, The Journal of Business
Forecasting, Vol. 27, Iss. 3; pg 28
55. Lewis, M.W. (1998), ``Iterative triangulation: a theory development process using
existing case studies'', Journal of Operations Management, Vol. 16, pp. 455-69.
56. Lim, A., Rodriguez, B. and Zhang, X. (2004), Metaheuristics with Local Search
Techniques for Retail Shelf-space Optimization, Management Science, Vol. 50, Iss. 1; p
117

93
57. London Economics (1997), Competition in Retailing, Office of Fair Trading, London,
Published online at The Office of Fair Trade (www.oft.gov.uk), viewed March 18,
2009, http://www.oft.gov.uk/shared_oft/reports/comp_policy/oft195.pdf
58. Manhattan Associates (2006), Technology Visioning: the future Retail replenishment,
Business Value Research Series, viewed November 25th 2008,
http://www.manh.com/library/MANH-TechVis_Whitepaper.pdf
59. Mcintyre, S., Achabal, D., and Miller, C. (1993), Applying case-based reasoning to
forecast retail sales, Journal of Retailing; Vol.69, Iss.4; ABI/INFORM Global pg. 372
60. Meredith, J. (1998), ``Building operations management theory through case and field
research'', Journal of Operations Management, Vol. 16, pp. 441-54.
61. Muller, G., Berger, M., Dutta, S. and Levy, D. (2007), Holiday non-price rigidity and
cost of adjustment, Managerial Decision Economics, Vol.28, Iss.7; p 817-832,
Published online in Wiley InterScience (www.interscience.wiley.com), viewed March
20, 2009, http://www3.interscience.wiley.com/cgi-bin/fulltext/114298995/PDFSTART
62. Nath, S., Kuppusamy, K., and Faldu, T. (2006), Making DDSN work: The CPG
perspective, viewed March 23, 2009, http://www.infosys.com/industries/consumer-
packaged-goods/white-papers/demand-driven-supply-chain-PoV.pdf
63. Nielsen (March 19th
2009), Pressenotat: Kjedenes markedsandeler, Dagligvarerapporten
2009, viewed March 26th 2009,
http://www.norgesgruppen.no/norgesgruppen/multimedia/archive/00011/Dagligvarerap
porten__11912a.pdf
64. Norgesgruppen (2009), Årsresultat 2008, viewed April 21st 2009,
http://www.norgesgruppen.no/norgesgruppen/multimedia/archive/00012/_rsresultat_20
08_12071a.pdf
65. Official website of Ministry of Trade and Industry Norway
66. Oversikt over Dagligvaremarkedet (2004), viewed October 15th
2008,http://www.liaa.gov.lv/uploaded_files/overview.doc
67. Pannirselvan, G., Ferguson, L., Ash, R. and Siferd, S. (1999), ``Operations management
research: an update for the 1990s'', Journal of Operations Management, Vol. 18, pp. 95-
112.
94
68. Progressive Grocer; Jul 1999; 78, 7; ABI/INFORM Global page 55
69. Progressive Grocer (1968a) The Out of Stock Study, Part 1, October, 1-16.
70. Raman, A., DeHoratius, N. and Ton, Z. (2001), Execution: The missing link in retail
operations, California Management Review, Spring 2001; 43, 3; p 136
71. Reid, K. (2003), Scanning and pricebook, NPN, National Petroleum News. Chicago: Jul
2003. Vol 95, Iss 7; p 32
72. Reitangruppen, n.d., Reitangruppen Året 2007, viewed November 25th 2008,
http://www.R3.no/multimedia/archive/00000/Aarsrapport_R3_2007_234a.pdf
73. Rostok, L. (2003), From empty shelf to the exit door, Canadian Grocer. Toronto: Feb
2003. Vol 117, Iss 1; pg 58
74. Snow, J. (2005), Guidelines for Warehousing Health Commodities, John Snow,
Inc./DELIVER. 2005. Guidelines for Warehousing Health Commodities, Arlington,
Va.: John Snow, Inc./DELIVER, for the U.S. Agency for International Development,
viewed March 11, 2009, http://www.phishare.org/files/3592_WMM_2005.pdf
75. Sloots, L. M., Verhoef, P. C. and Franses, P. H. (2005) The impact equity and hedonic
level of products on consumer stock-out reactions, Journal of Retailing, 81 (1), 15-34
76. Stake, R. (1995). The art of case research. Newbury Park, CA: Sage Publications.
77. Staw, B.M. (1980), The consequences of turnover, Journal of Occupational Behaviour,
Vol. 1, p 253-273
78. Taylor, D. A. (2004), The problem with programs, Logistics today. Vol. 45. Iss. 3: pg.
31
79. Teradata (January 2005), An Executive‘s Guide to Reducing Out-of-Stocks With
Performance Management, viewed November 24th
2008,http://www.teradata.com/library/pdf/TD%20Executive%20Guide%20to%20OOS.
80. Verbeke, W., Farris, P. and Thurik, R. (1998) Consumer response to the preferred brand
out-of-stocks situation, European Journal of Marketing, 32 (1), 1008-1028.
81. Verhoef, Perter C., Sloot Laurens M., ―Retailing in 32nd Century‖, 1st Edition, 2006,
Springer Berlin Heidelberg, pg. 239

95
82. Versatile Systems Inc. (2008), How Intelligent Field Sales Automation Can Reduce
Out-of-Stock Conditions On the Retailer‘s Shelf, viewed November 24th,
http://www.versatile.com/files/html_docs/white_papers/VersatileWhitePaper_How_To_
Reduce_Out-of-Stocks.pdf
83. Vitasek, K. (2008), Supply Chain terms and glossary, viewed February 6th
2009,
http://cscmp.org/Downloads/Public/Resources/glossary03.pdf
84. Voss C., Tsikriktsis N., Frohlich M., (2002), ‖Case research in operations
management‖, International Journal of Operations & Production Management, Vol.22,
Issue 2, p. 195-219
85. Vuyk Chris, n.d., ―Out–of-Stocks: A nightmare for retailers and supplier, Beverage
World, February 2003, www.beveraheworld.com
86. Walters, D. (1994), Retailing Management: Analysis, planning and Control. London:
Macmillan, p. 45
87. Watkins, T. (1984), Consumer purchase of low-involvement goods: routine or impulse?,
Marketing Intelligence & Planning, Vol. 2; Iss. 2, pg. 51-66
88. Yang, Ming-Hsien (2001), An efficient algorithm to allocate shelf space, European
Journal of Operational Research, Vol. 131, Issue 1, p 107-118
89. Yin, R. (1994), Case study research: Design and Methods (2nd
edition), Thousand Oaks,
Ca: Sage Publishing
90. Yin. R.K. (2003), Applications of Case Study Research, Sage publications Inc, United
States of America
91. Zinn W., Liu P. C. (2008). A comparison of actual and intended consumer behavior in
response to retail stockouts, Journal of Business Logistics, 29(2), 141-VII.
92. Zinn W. and Liu P.C. (2001), Consumer response to retail stockouts, Journal of
Business Logistics, Vol. 22 (1), p. 49-72

96
Appendix A: Interview part 1
Store:
Day(s) of delivery:
Store design and access
1. How many storage locations in store (on top-shelf, basement, basically anywhere),
including back-room?
2. General accessibility (everything is piled up on the floor?) and overview in back-room
?
Forecasting and ordering
Forecasting technique (Arnold et al 2008)
Qualitative. Based on judgment, intuition and informed options. Subjective in nature.
Appropriate for forecasting general business trends and potential demand for large families
of products over an extended period of time.
Extrinsic. Demand for product group is directly proportional or correlates to activity in
another field. Example; sales of bricks are proportional to housing starts. Housing starts is
an economical indicator (describes economic conditions that prevail during a given time
period). Find an indicator that leads demand (number of construction contracts awarded will
determine the building material sold in the next period).
Intrinsic. Apply historical data to forecast. Example of intrinsic techniques.
Exponential smoothing.
Moving average.
1. Apply the same forecast method for all SKU?
2. Apply different forecast methods across product families?
3. If yes, what forecasting methods?
97
4. Use of Periodic Review System for re-ordering?
Store employees
1. How many employees total?
2. How many employees in/out the last 12 months?
3. How many employees have less than 6 months experience from retail business?
4. How many employees on average on a normal (any time-period except weekends, day
of incoming shipments etc) shift?
5. In busy periods/shifts, how many employees on average?
6. Training program as a policy for recently hired employees?
98
Appendix B: Interview part 2
Name of Product and Order No.:
If product is discontinued from store assortment: Yes No
(if answer is yes please go to the next product)
If product is available in the lager (Back store) please mark: Yes
No
If yes, do you have information about this: Yes No
If yes , what may be the reason if product not made available on shelf please describe,
If product is not available in Back store, have you placed order to rebuy: Yes
No
If you have already placed the order to rebut this item, what can be the reason behind
product not delivered yet:
If you have not placed order yet, what can be the possible reason for not ordering,
Any other comment:
Q.1. How many full time employee hours you have on fulltime basis in a week:
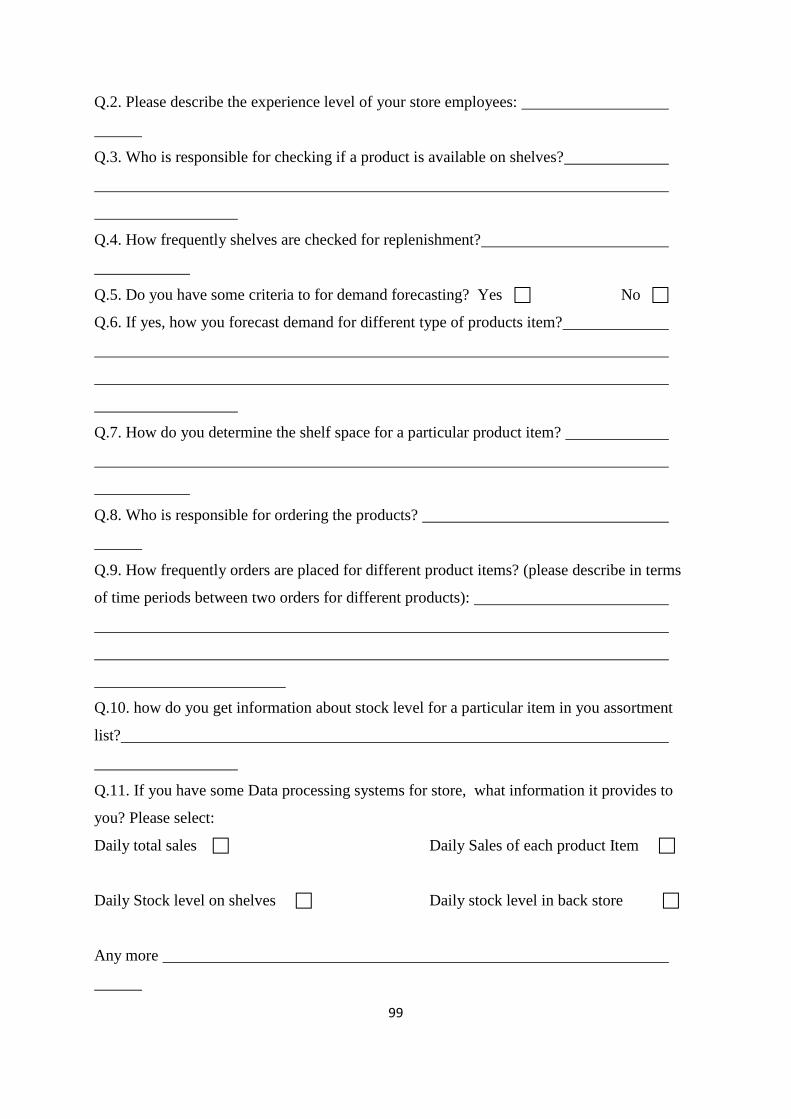
99
Q.2. Please describe the experience level of your store employees:
Q.3. Who is responsible for checking if a product is available on shelves?
Q.4. How frequently shelves are checked for replenishment?
Q.5. Do you have some criteria to for demand forecasting? Yes No
Q.6. If yes, how you forecast demand for different type of products item?
Q.7. How do you determine the shelf space for a particular product item?
Q.8. Who is responsible for ordering the products?
Q.9. How frequently orders are placed for different product items? (please describe in terms
of time periods between two orders for different products):
Q.10. how do you get information about stock level for a particular item in you assortment
list?
Q.11. If you have some Data processing systems for store, what information it provides to
you? Please select:
Daily total sales Daily Sales of each product Item
Daily Stock level on shelves Daily stock level in back store
Any more
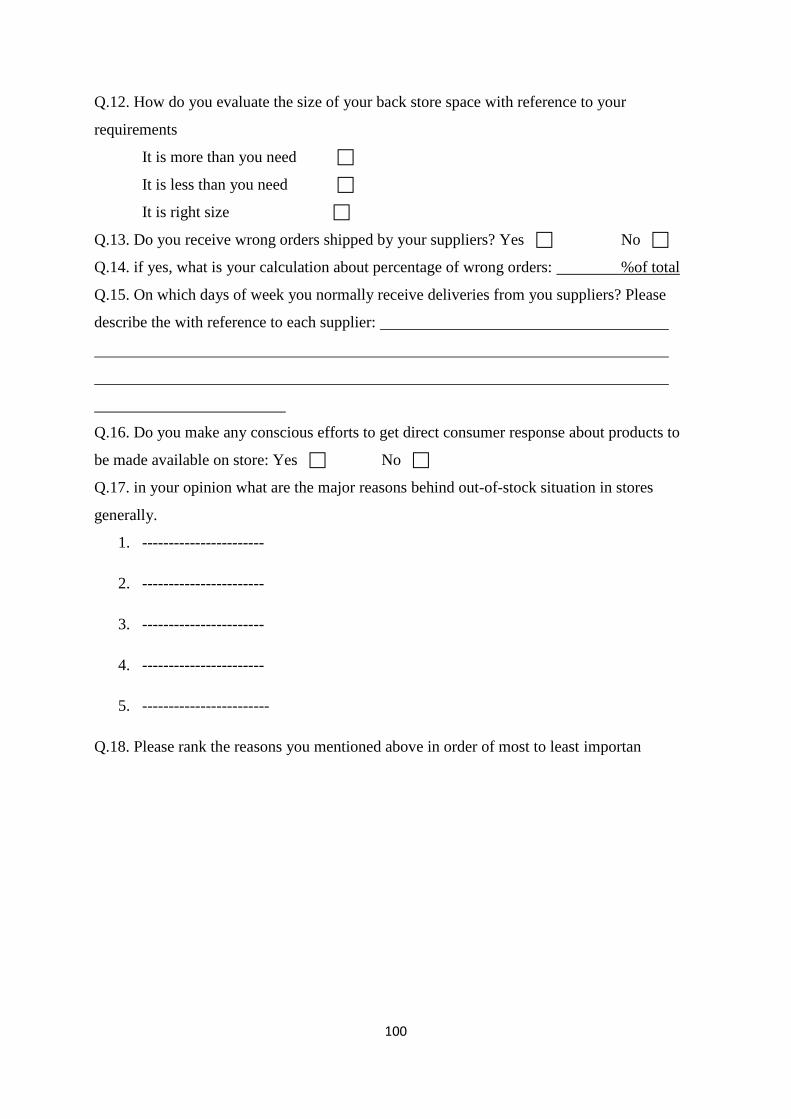
100
Q.12. How do you evaluate the size of your back store space with reference to your
requirements
It is more than you need
It is less than you need
It is right size
Q.13. Do you receive wrong orders shipped by your suppliers? Yes No
Q.14. if yes, what is your calculation about percentage of wrong orders: %of total
Q.15. On which days of week you normally receive deliveries from you suppliers? Please
describe the with reference to each supplier:
Q.16. Do you make any conscious efforts to get direct consumer response about products to
be made available on store: Yes No
Q.17. in your opinion what are the major reasons behind out-of-stock situation in stores
generally.
1. -----------------------
2. -----------------------
3. -----------------------
4. -----------------------
5. ------------------------
Q.18. Please rank the reasons you mentioned above in order of most to least importan
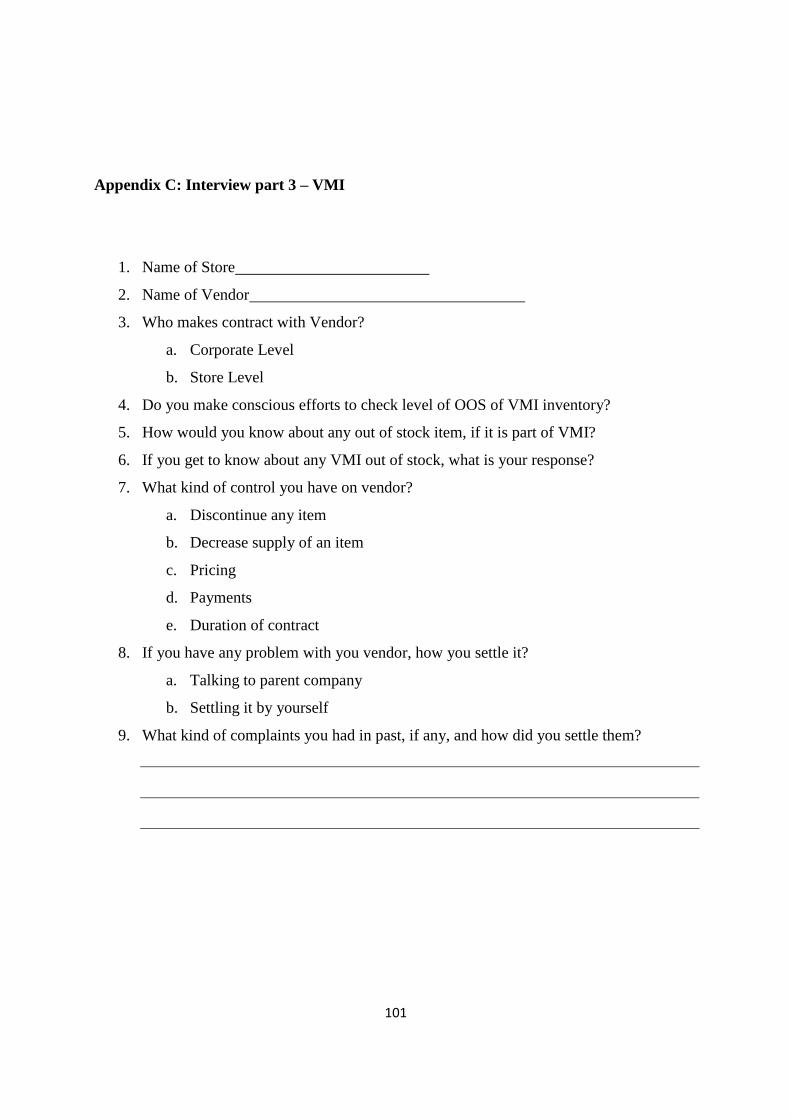
101
Appendix C: Interview part 3 – VMI
1. Name of Store
2. Name of Vendor
3. Who makes contract with Vendor?
a. Corporate Level
b. Store Level
4. Do you make conscious efforts to check level of OOS of VMI inventory?
5. How would you know about any out of stock item, if it is part of VMI?
6. If you get to know about any VMI out of stock, what is your response?
7. What kind of control you have on vendor?
a. Discontinue any item
b. Decrease supply of an item
c. Pricing
d. Payments
e. Duration of contract
8. If you have any problem with you vendor, how you settle it?
a. Talking to parent company
b. Settling it by yourself
9. What kind of complaints you had in past, if any, and how did you settle them?