Location prediction of electron TGFs - NASA · Location prediction of electron TGFs ... less...
8
Location prediction of electron TGFs S. Xiong, 1 M. S. Briggs, 1 V. Connaughton, 1 G. J. Fishman, 2 D. Tierney, 3 G. Fitzpatrick, 3 S. Foley, 4 S. Guiriec, 1 R. H. Holzworth, 5 and M. L. Hutchins 5 Received 22 August 2011; revised 22 November 2011; accepted 13 December 2011; published 15 February 2012. [1] Terrestrial Gamma-ray Flashes (TGFs) are brief pulses of energetic radiation that correlate with thunderstorms and lightning. Most TGFs are observed as gamma-ray pulses; less frequently they can be observed as electrons and positrons that travel along the geomagnetic field line from the source to the detector. In this paper we predict where electron TGFs should be observed by tracing geomagnetic field lines from likely TGF sources and determining the intersections with satellite orbits. TGF source locations are based upon lightning maps by the Lightning Imaging Sensor (LIS) and the Optical Transient Detector (OTD). Predictions are made both for existing spacecraft with instruments observing TGFs and for other orbits. We compare the predictions to the locations of TGFs that have been observed as electron TGFs. 12 of the 13 known electron TGFs are within the predicted high-rate regions. Based on the predicted location maps of electron TGFs, we find that electron TGFs should sometimes be observed above areas with low lightning activity and that electron TGFs are best observed at low altitudes (below approximately 1000 km). Citation: Xiong, S., M. S. Briggs, V. Connaughton, G. J. Fishman, D. Tierney, G. Fitzpatrick, S. Foley, S. Guiriec, R. H. Holzworth, and M. L. Hutchins (2012), Location prediction of electron TGFs, J. Geophys. Res., 117, A02309, doi:10.1029/2011JA017085. 1. Introduction [2] Terrestrial Gamma-ray Flashes (TGFs) are brief intense energetic emission from Earth’s atmosphere. Since their unexpected discovery by the Burst And Transient Source Experiment (BATSE) on the Compton Gamma-Ray Obser- vatory (CGRO) in the early 1990s [Fishman et al., 1994], TGFs have been studied extensively with observations by the Reuven Ramaty High Energy Solar Spectroscopic Imager (RHESSI) [Smith et al., 2005], the Astro-rivelatore Gamma a Immagini LEggero (AGILE) [Marisaldi et al., 2010], and the Gamma-ray Burst Monitor (GBM) onboard the Fermi Gamma-ray Space Telescope (Fermi) [Briggs et al., 2010; Fishman et al., 2011]: They are featured with short dura- tion (ms to ms), single pulse or multipulses and very hard spectrum (above 40 MeV) [Briggs et al., 2010; Marisaldi et al., 2010; Tavani et al., 2011]; The association with thunderstorm regions [Fishman et al., 1994] and lightning discharge [Inan et al., 1996; Cohen et al., 2006; Cummer et al., 2005; Connaughton et al., 2010] has been strongly confirmed; The widely accepted mechanism for explaining TGFs is Relativistic Runaway Electron Avalanche (RREA) [Gurevich et al., 1992; Roussel-Dupré and Gurevich, 1996; Lehtinen et al., 1999; Dwyer, 2003, 2007] in which electrons within intense electric fields are accelerated and produce secondaries by interacting with air leading to an avalanche of relativistic electrons and then gamma-ray photons through bremsstrahlung. The observed spectrum of TGFs follows a power law with an exponential cutoff at around 7 MeV, consistent with the RREA model [Dwyer and Smith, 2005]. However, recent AGILE observations of a high energy power law are inconsistent with this model [Tavani et al., 2011]. [3] Lehtinen et al. [2001] first suggested that the elec- tron beams accompanying TGFs may escape upward from the hemisphere and then be indirectly detected through the interactions at the conjugate footprint, assuming those elec- tron beams originate at high altitude above thunderstorms. However, spectral analysis of RHESSI data and accom- panying modeling favor a low altitude (15–21 km) source [Dwyer and Smith, 2005; Carlson et al., 2007]. Motivated by BATSE data, Dwyer et al. [2008] proposed a new mecha- nism to produce electron-positron beams: As the gamma-rays of TGFs propagate upwards through atmosphere, electrons and positrons are produced by Compton scattering and pair production. Although most electrons and positrons are quickly absorbed, a good fraction of these secondaries above 40 km can escape the atmosphere and travel along the geomagnetic field lines to be directly detectable by low-orbit satellites. Propagation effects give “electron TGFs” time histories that distinguish them from gamma-ray TGFs: arrival dispersion due to pitch angles causes longer durations, and if the mag- netic field is stronger at the conjugate point there will be a second peak due to magnetic mirroring. Two factors change the detectability of electron TGFs compared to gamma-ray TGFs: first, gamma-rays disperse while the magnetic field confines the charged particles, which allows electron TGFs 1 CSPAR, University of Alabama in Huntsville, Huntsville, Alabama, USA. 2 Space Science Office, NASA Marshall Space Flight Center, Huntsville, Alabama, USA. 3 School of Physics, University College Dublin, Dublin, Ireland. 4 Max-Planck-Institut für Extraterrestrische Physik, Garching, Germany. 5 Earth and Space Sciences, University of Washington, Seattle, Washington, USA. Copyright 2012 by the American Geophysical Union. 0148-0227/12/2011JA017085 JOURNAL OF GEOPHYSICAL RESEARCH, VOL. 117, A02309, doi:10.1029/2011JA017085, 2012 A02309 1 of 8
Transcript of Location prediction of electron TGFs - NASA · Location prediction of electron TGFs ... less...
Location prediction of electron TGFs
S. Xiong,1 M. S. Briggs,1 V. Connaughton,1 G. J. Fishman,2 D. Tierney,3 G. Fitzpatrick,3
S. Foley,4 S. Guiriec,1 R. H. Holzworth,5 and M. L. Hutchins5
Received 22 August 2011; revised 22 November 2011; accepted 13 December 2011; published 15 February 2012.
[1] Terrestrial Gamma-ray Flashes (TGFs) are brief pulses of energetic radiation thatcorrelate with thunderstorms and lightning. Most TGFs are observed as gamma-ray pulses;less frequently they can be observed as electrons and positrons that travel along thegeomagnetic field line from the source to the detector. In this paper we predict where electronTGFs should be observed by tracing geomagnetic field lines from likely TGF sources anddetermining the intersections with satellite orbits. TGF source locations are based uponlightning maps by the Lightning Imaging Sensor (LIS) and the Optical Transient Detector(OTD). Predictions are made both for existing spacecraft with instruments observing TGFsand for other orbits. We compare the predictions to the locations of TGFs that havebeen observed as electron TGFs. 12 of the 13 known electron TGFs are within the predictedhigh-rate regions. Based on the predicted location maps of electron TGFs, we find thatelectron TGFs should sometimes be observed above areas with low lightning activity andthat electron TGFs are best observed at low altitudes (below approximately 1000 km).
Citation: Xiong, S., M. S. Briggs, V. Connaughton, G. J. Fishman, D. Tierney, G. Fitzpatrick, S. Foley, S. Guiriec,R. H. Holzworth, and M. L. Hutchins (2012), Location prediction of electron TGFs, J. Geophys. Res., 117, A02309,doi:10.1029/2011JA017085.
1. Introduction
[2] Terrestrial Gamma-ray Flashes (TGFs) are brief intenseenergetic emission from Earth’s atmosphere. Since theirunexpected discovery by the Burst And Transient SourceExperiment (BATSE) on the Compton Gamma-Ray Obser-vatory (CGRO) in the early 1990s [Fishman et al., 1994],TGFs have been studied extensively with observations bythe Reuven Ramaty High Energy Solar Spectroscopic Imager(RHESSI) [Smith et al., 2005], the Astro-rivelatore Gammaa Immagini LEggero (AGILE) [Marisaldi et al., 2010], andthe Gamma-ray Burst Monitor (GBM) onboard the FermiGamma-ray Space Telescope (Fermi) [Briggs et al., 2010;Fishman et al., 2011]: They are featured with short dura-tion (ms to ms), single pulse or multipulses and very hardspectrum (above 40 MeV) [Briggs et al., 2010; Marisaldiet al., 2010; Tavani et al., 2011]; The association withthunderstorm regions [Fishman et al., 1994] and lightningdischarge [Inan et al., 1996; Cohen et al., 2006; Cummeret al., 2005; Connaughton et al., 2010] has been stronglyconfirmed; The widely accepted mechanism for explainingTGFs is Relativistic Runaway Electron Avalanche (RREA)[Gurevich et al., 1992; Roussel-Dupré and Gurevich, 1996;
Lehtinen et al., 1999; Dwyer, 2003, 2007] in which electronswithin intense electric fields are accelerated and producesecondaries by interacting with air leading to an avalanche ofrelativistic electrons and then gamma-ray photons throughbremsstrahlung. The observed spectrum of TGFs followsa power law with an exponential cutoff at around 7 MeV,consistent with the RREA model [Dwyer and Smith, 2005].However, recent AGILE observations of a high energy powerlaw are inconsistent with this model [Tavani et al., 2011].[3] Lehtinen et al. [2001] first suggested that the elec-
tron beams accompanying TGFs may escape upward fromthe hemisphere and then be indirectly detected through theinteractions at the conjugate footprint, assuming those elec-tron beams originate at high altitude above thunderstorms.However, spectral analysis of RHESSI data and accom-panying modeling favor a low altitude (15–21 km) source[Dwyer and Smith, 2005; Carlson et al., 2007]. Motivated byBATSE data, Dwyer et al. [2008] proposed a new mecha-nism to produce electron-positron beams: As the gamma-raysof TGFs propagate upwards through atmosphere, electronsand positrons are produced by Compton scattering and pairproduction. Although most electrons and positrons are quicklyabsorbed, a good fraction of these secondaries above 40 kmcan escape the atmosphere and travel along the geomagneticfield lines to be directly detectable by low-orbit satellites.Propagation effects give “electron TGFs” time histories thatdistinguish them from gamma-ray TGFs: arrival dispersiondue to pitch angles causes longer durations, and if the mag-netic field is stronger at the conjugate point there will be asecond peak due to magnetic mirroring. Two factors changethe detectability of electron TGFs compared to gamma-rayTGFs: first, gamma-rays disperse while the magnetic fieldconfines the charged particles, which allows electron TGFs
1CSPAR, University of Alabama in Huntsville, Huntsville, Alabama,USA.
2Space Science Office, NASAMarshall Space Flight Center, Huntsville,Alabama, USA.
3School of Physics, University College Dublin, Dublin, Ireland.4Max-Planck-Institut für Extraterrestrische Physik, Garching, Germany.5Earth and Space Sciences, University of Washington, Seattle,
Washington, USA.
Copyright 2012 by the American Geophysical Union.0148-0227/12/2011JA017085
JOURNAL OF GEOPHYSICAL RESEARCH, VOL. 117, A02309, doi:10.1029/2011JA017085, 2012
A02309 1 of 8

to be detected at great distances from the sources. Second,because of the confinement of electrons within a narrowbeam, the sample of known electron TGFs is much smallerthan the gamma-ray TGF sample [Dwyer et al., 2008;Carlson et al., 2009].[4] The first evidence of electron TGFs came from BATSE
TGFs 2221 and 1470 [Dwyer et al., 2008], as well as theRHESSI TGF of 17 January 2004 [Smith et al., 2006], all ofwhich showed long durations, while two of them, detectedwhen the spacecrafts were over the Sahara desert butmagnetically connected to active thunderstorm regions insouthern Africa, contained a second pulse due to mirroring.Moreover, many possible electron TGFs have been iden-tified from The Solar Anomalous Magnetospheric ParticleExplorer (SAMPEX) Heavy Ion Large Telescope (HILT)[Carlson et al., 2009], but can not be solidly confirmeddue to the low time resolution (20 ms) of the data. As addi-tional confirmation, the associated lightning discharge wasobserved for the first time at the footprint of the geomagneticfield line for an electron TGF (GBM TGF 100515) [Cohenet al., 2010].[5] Since its launch in June 2008, the Gamma-ray Burst
Monitor (GBM) [Meegan et al., 2009] onboard the Fermi hasdetected hundreds of TGFs by on-orbit trigger [Briggs et al.,2010; Fishman et al., 2011]. Most TGFs detected by GBMare gamma-ray events with duration usually less than 1 msand usually between 0.05 ms and 0.20 ms. However, a feware identified as electron TGFs because they have longduration, lower maximum energy compared to most TGFsand lightning discharges suggesting storm activity at oneof the termini of the geomagnetic field lines through Fermibut not underneath Fermi [Briggs et al., 2010; Connaughtonet al., 2010; Fishman et al., 2011]. Furthermore, the spectralanalysis of three electron TGFs strongly confirmed thatelectron TGFs contains not only electrons but also positrons[Briggs et al., 2011], as predicted by [Dwyer et al., 2008].[6] In this paper, we predict where electron TGFs should
be observed by tracing geomagnetic field lines from likelyTGF sources and determining the intersections with satelliteorbits. In section 2, the TGF source locations and lightningmaps are stated. In section 3, the geomagnetic field modeland tracing method are presented. Predictions are made bothfor existing spacecraft with instruments observing TGFs andfor other orbits, shown in section 4. We compare the pre-dictions to the locations of TGFs that have been observed aselectron TGFs and discuss the result in section 5.
2. TGF Location and Lightning Map
[7] Since TGFs have been conclusively associated withlightning discharge [Inan et al., 1996; Cohen et al., 2006;Cummer et al., 2005; Connaughton et al., 2010], and thegeographic distribution of TGFs observed by RHESSI andAGILE are consistent with active lightning regions [Smithet al., 2005; Grefenstette et al., 2009; Fuschino et al., 2011],the TGF occurrence rate is assumed to be proportional to thelightning rate so that lightning rate maps can be used toestimate the locations and rates of the TGF sources.[8] We take use of the lightning data (available at http://
ghrc.msfc.nasa.gov) observed by the Lightning ImagingSensor (LIS) [Christian et al., 1999] and Optical Transient
Detector (OTD) [Boccippio et al., 2000] from 1995 to 2005.We used the so-called “High resolution” maps which havethe pixel size of 0.5 degree ! 0.5 degree, and only considerthe regions with flash rate greater than or equal to 10 flasheskm"2 yr"1. The full climatology (full year) and seasonallightning maps used in this paper are shown in Figure 1.[9] There is strong evidence that the TGF/lightning ratio
varies geographically [Smith et al., 2010; Fuschino et al.,2011]. Since the TGF/lightning ratio directly determines therate of electron TGFs in a geographical area, the geographicvariation will change the relative importance of the regionswhere electron TGFs are favored. Therefore, we correct thedependence of TGF/lightning ratio on latitude and longitudeby using the data given by Smith et al. [2010, Figures 6 and7]. TGF/lightning ratio is calculated by dividing the RHESSITGF numbers by the LIS/OTD lightning rates, corrected forthe non-uniform RHESSI exposure. Then the trends withlatitude and longitude are each fit with 4th order polynomialfunctions, see Figure 2.[10] The TGF/lightning ratio calculated by this method is
a relative value, so we can only calculate the relative ratesof electron TGFs. The calculation of the absolute value fromRHESSI data is unrealistic without the detection efficiency.Although there is an absolute estimation from AGILEobservations [Fuschino et al., 2011], that estimation is basedon a very narrow latitude range so it may not extrapolate wellto other regions.
3. Tracing Geomagnetic Field
[11] Since electrons will travel along the geomagnetic fieldlines, it can be determined where electron TGFs would beobserved by an instrument in-orbit by calculating the inter-sections of geomagnetic field lines with the orbital plane.[12] The International Geomagnetic Reference Field (IGRF)
is a global model of the geomagnetic field of Earth. It is thestandard mathematical description of the Earth’s main mag-netic field and its annual rate of change. Here the latest ver-sion of IGRF model, IGRF-11 [Finlay et al., 2010], is used todescribe geomagnetic field.[13] As shown in Figure 3, the longitude and latitude of
intersections are derived for source TGF for a given altitudeof orbit. Note that there are usually two intersections for aparticular field line and altitude, but there may be no inter-section if the altitude is too high.
4. Locations of Electron TGFs
[14] For each pixel in the lightning map (see Figure 1) withflash rate greater than or equal to 10 flashes km"2 yr"1, thecentral position of this pixel is taken as the location of thesource TGF. Then for each source TGF, the correspondingelectron TGF locations are calculated by solving the inter-sections of the geomagnetic field line going through thissource TGF and the orbital plane of instrument, as shown inFigure 3. The lengths of geomagnetic field line from thelocation at which the TGF is initiated to its detection as anelectron TGF on the spacecraft, which is a good indicator ofthe time history of electron TGFs, are derived as well.Because the TGF rate is correlated to flash rate by the TGF/lightning ratio, the occurrence rate of the electron TGF can be
XIONG ET AL.: LOCATION PREDICTION OF ELECTRON TGFS A02309A02309
2 of 8

Figure 1. Lightning map by LIS/OTD [Christian et al., 1999; Boccippio et al., 2000]. (top) Full-climatology (full year) map, (middle left) Dec-Jan-Feb season map, (middle right) Mar-Apr-May seasonmap, (bottom left) Jun-Jul-Aug season map, and (bottom right) Sep-Oct-Nov season map. The filledcontours correspond to lightning rates of 10–30 (green), 30–50 (blue) and ! 50 (red) flashes km"2 yr"1.
XIONG ET AL.: LOCATION PREDICTION OF ELECTRON TGFS A02309A02309
3 of 8

estimated, it is a relative rate though. Therefore, apart fromlocation, every electron TGF has two more characteristicparameters: relative rate and length of geomagnetic field line.[15] With these electron TGF locations, we make an elec-
tron TGF location map as follows: First, set the pixel sizeof the map to 2 degree ! 2 degree; Second, for each pixel,determine which electron TGF locations fall inside. For eachpixel in the electron TGF location map, there are sometimestwo groups of electron TGFs which come from the Southernand Northern parts of the Earth, respectively. We take thesummed rate of all electron TGFs of the two groups as therate for that pixel. The length of geomagnetic field line issimilar in each group but sometimes greatly differentbetween the two groups. However, we found that the totalrate of electron TGFs in one group is 10 times greater thanthat of the other group for >90% of the valid pixels inthe electron TGF location map. Therefore, for simplicity, wetake the length of geomagnetic field line of the group withhigher rate as the length for that pixel.[16] Fermi has a nearly circular orbit with a typical altitude
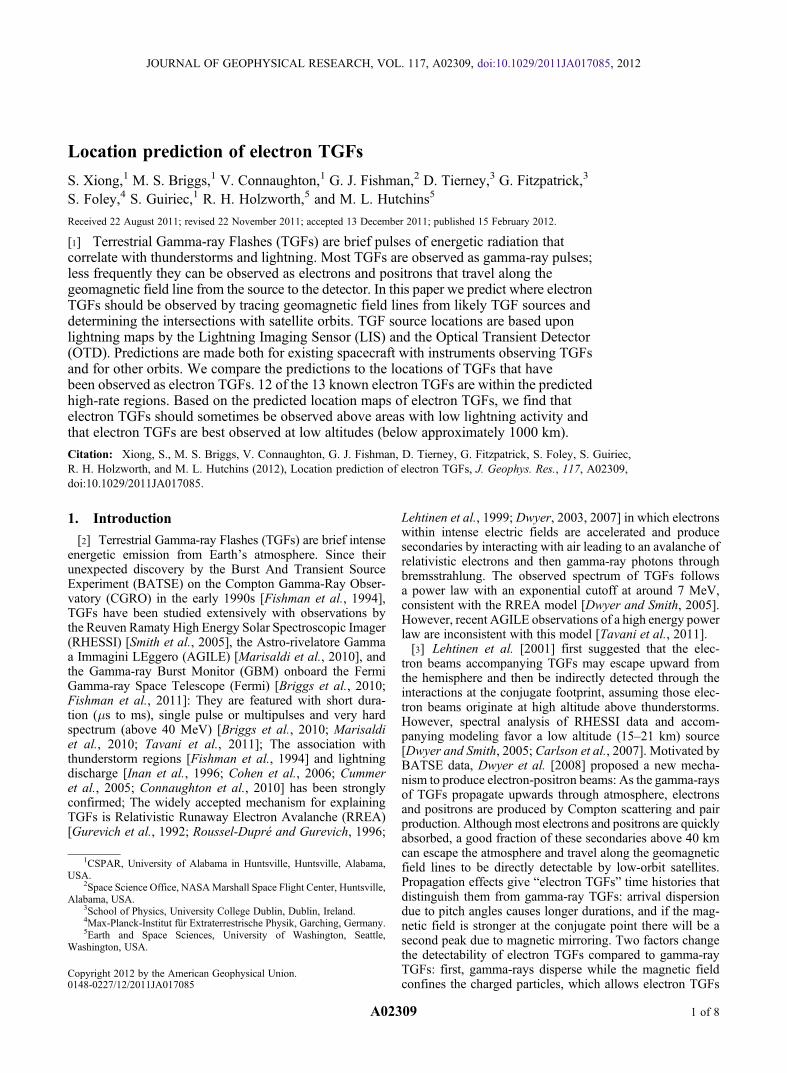
of 560 km. The full-year averaged electron TGF predictionmap for Fermi GBM is made for this altitude using the fullyear lightning map, as shown in Figure 4. Seasonal maps arealso produced with the corresponding seasonal lightningmap, as shown in Figure 5.[17] In addition, full-year averaged electron TGF location
predictions are made for some typical altitudes: 350 km,470 km, 1000 km, 2000 km and 5000 km, as shown inFigures 6 and 7. These maps could serve as guidelines forpotential TGF observations at these altitudes.
5. Discussion and Conclusion
[18] In Figures 4, 5, and 7, we compare the compliancebetween the locations of electron TGFs that have beendetected with BATSE, RHESSI and GBM (see Table 1) andthe predicted regions of high electron TGF rates. The detec-tion of electron TGFs by AGILE is strongly hampered bythe plastic anti-coincidence shield, which surrounds all the
Figure 2. TGF/lightning ratio geographic variation derived from Smith et al. [2010, Figures 6 and 7]. Forlongitude, data only in the continental regions (shadowed areas in Figure 2 (right)) are used because oceanicareas have low flash rates then are not used in creating the electron TGF maps. Data are shown with plussymbols while the fit results (4th degree polynomial) are shown with solid lines.
Figure 3. Illustration of tracing the geomagnetic field. Thesolid line represents a field line that passes through a TGF-produced electrons source (triangle) and the dashed linethe altitude of a spacecraft, resulting in two intersections(circles). The altitude of electron production by the TGFis assumed to be 30 km since this is the average altitude ofelectron generation by Compton scattering and pair produc-tion by the primary gamma-rays of TGFs.
XIONG ET AL.: LOCATION PREDICTION OF ELECTRON TGFS A02309A02309
4 of 8
Figure 5. Seasonal location maps of electron TGFs for GBM (altitude of 560 km). (top left) Dec-Jan-Febseason map, (top right) Mar-Apr-May season map. (bottom left) Jun-Jul-Aug season map, and (bottomright) Sep-Oct-Nov season map. The contours, regions, lines and symbols have the same definitions asin Figure 4.
Figure 4. Full-year averaged location map of electron TGFs for GBM (altitude of 560 km). The solid linecontours correspond to relative electron TGF rates of 1–5 (green), 5–20 (blue) and ! 20 (red). The coloredregions indicate the length of the magnetic field line to that point: 500–2000 (light red), 2000–5000 (lightyellow) and ! 5000 (light blue) km. The solid yellow polygon shows the South Atlantic Anomaly (SAA)region, in which the GBM detectors are turned off, and the dashed yellow lines are the latitude limits ofthe GBM orbit. The plus symbols indicate the locations of GBM detected electron TGFs, while the triangleis an RHESSI observed electron TGF.
XIONG ET AL.: LOCATION PREDICTION OF ELECTRON TGFS A02309A02309
5 of 8

payload except the interface with the spacecraft and isdesigned for charged particle rejection (M. Marisaldi, privatecommunication, 2011). Table 1 includes the six GBM TGFsthat can be confidently classified as electron TGFs, out of the172 TGFs detected by the GBM flight software through theend of July 2011. Classification of a GBM TGF as an elec-tron TGF is based on the event having at least several of thefollowing characteristics: a duration longer than 1 ms (notpossibly caused by multiple gamma-ray pulses), the spec-trum containing a positron annihilation line (511 keV), aspectrum with a lower maximum energy, radio observationsfrom WWLLN showing lightning at a magnetic footprint butnot underneath Fermi, and having signal only in detectors onone side of the spacecraft. The BATSE electron TGFs arethose identified by Dwyer et al. [2008] based upon differingtime histories in the eight BATSE detectors. The RHESSIevent has a distinctive time history with a mirror peak [Smith
et al., 2006]. Since RHESSI’s altitude (about 600 km) isclose to that of Fermi (560 km), location predictions forRHESSI and Fermi GBM will be similar and we use a singlemap for these two instruments.[19] With a single exception, all known electron TGFs are
within the predicted high-rate regions. If we compare theseasonal maps (Figure 5) to the full-year averaged map(Figure 4), the seasonal maps show an improvement in theagreement of the locations of the observed electron TGFswith the predicted high-rate regions. For example, the GBMevents in North Africa are out of the red line in Figure 4 butwell inside the red line in Figure 5. A significant improve-ment for the GBM events in North America is also evident.Although duration is not only determined by the propagationeffect, a good correlation between duration and predictedlength of magnetic field line is found, see Table 1. Thelocations of electron TGFs matching the predicted high-rate
Figure 7. Full-year averaged location map of electron TGFs for BATSE (altitude of 470 km). The con-tours and regions have the same definitions as in Figure 4, and the plus symbols indicate the locations ofelectron TGFs detected by BATSE [Dwyer et al., 2008].
Figure 6. Full-year averaged location maps of electron TGFs for different altitudes. (top left) Altitude of350 km, (top right) altitude of 1000 km, (bottom left) altitude of 2000 km, and (bottom right) altitude of5000 km. The contours and regions have the same definitions as in Figure 4.
XIONG ET AL.: LOCATION PREDICTION OF ELECTRON TGFS A02309A02309
6 of 8
regions, especially the enhancement from full-year aver-aged map to seasonal maps, and the time history correctlyreflecting the predicted magnetic field line length, demon-strate the validity of our calculation.[20] As the only exception, BATSE TGF 07229 occurred
when the Compton Observatory was over the Pacific(Table 1) outside the areas where electron TGFs are probableaccording to our analysis. Occasionally electron TGFs willtrace back to lightning in regions of lower lightning rates.The southern magnetic footprint of this TGF is near theislands of Fiji and Vanu Levu, with a closest approach to landof #250 km. While the lightning rate at the precise footprintlocation is only 1.44 flashes km"2yr"1 for the season, therate reaches 2.61 flashes year km"2 yr"1 within 200 km and4.72 flashes year km"2 yr"1 at Fiji, 360 km away. The higherrates suggest that the source might be farther from the cal-culated footprint than expected.[21] A thunderstorm can typically produce both close and
distant electron TGFs, from the two intersections shown inFigure 3. The close solutions produce electron TGF regionsthat are similar to the parent lightning activity regions, andto the geographic distribution of gamma-ray TGFs from thatlightning. In some cases the distant solutions create regionsof high rates of electron TGFs that are above areas of lowlightning activity; gamma-ray TGFs will rarely be detectedabove these areas. Examples of such regions (Figure 4)include northern Africa, sections of the Pacific off the westcoast of South America and the south coast of Japan, and aportion of the Indian Ocean. Indeed, while gamma-ray TGFsare extremely rare above +15° latitude in Africa, two dis-tinctive electron TGFs with double peaks from magneticmirroring have been observed over Northern Africa, one byRHESSI on 17 January 2004 [Smith et al., 2006], and thesecond by GBM on 14 December 2009 [Briggs et al., 2011](Table 1). These areas are well suited for observations of theemissions (e.g. optical emissions, secondary ionization andgamma-rays [Lehtinen et al., 2001]) by the relativistic parti-cles interacting with the upper atmosphere at the conjugatepoint to the source since there may be less other activity.[22] In order to determine which altitude range is best for
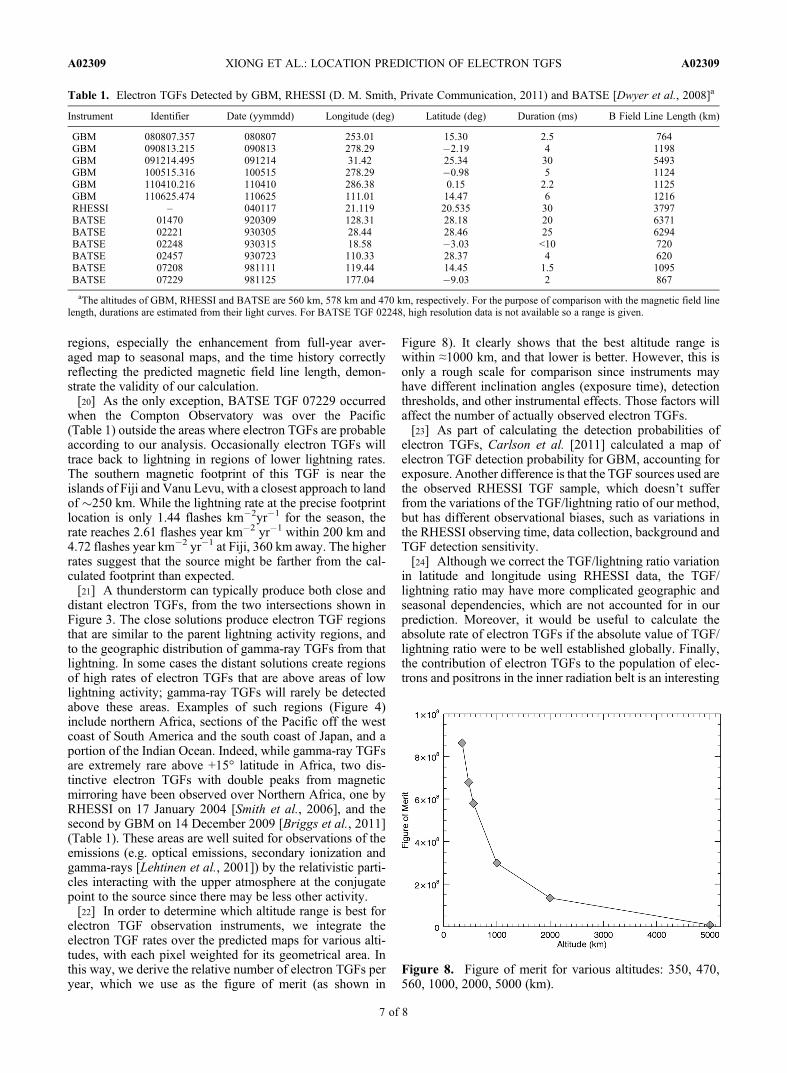
electron TGF observation instruments, we integrate theelectron TGF rates over the predicted maps for various alti-tudes, with each pixel weighted for its geometrical area. Inthis way, we derive the relative number of electron TGFs peryear, which we use as the figure of merit (as shown in
Figure 8). It clearly shows that the best altitude range iswithin "1000 km, and that lower is better. However, this isonly a rough scale for comparison since instruments mayhave different inclination angles (exposure time), detectionthresholds, and other instrumental effects. Those factors willaffect the number of actually observed electron TGFs.[23] As part of calculating the detection probabilities of
electron TGFs, Carlson et al. [2011] calculated a map ofelectron TGF detection probability for GBM, accounting forexposure. Another difference is that the TGF sources used arethe observed RHESSI TGF sample, which doesn’t sufferfrom the variations of the TGF/lightning ratio of our method,but has different observational biases, such as variations inthe RHESSI observing time, data collection, background andTGF detection sensitivity.[24] Although we correct the TGF/lightning ratio variation
in latitude and longitude using RHESSI data, the TGF/lightning ratio may have more complicated geographic andseasonal dependencies, which are not accounted for in ourprediction. Moreover, it would be useful to calculate theabsolute rate of electron TGFs if the absolute value of TGF/lightning ratio were to be well established globally. Finally,the contribution of electron TGFs to the population of elec-trons and positrons in the inner radiation belt is an interesting
Table 1. Electron TGFs Detected by GBM, RHESSI (D. M. Smith, Private Communication, 2011) and BATSE [Dwyer et al., 2008]a
Instrument Identifier Date (yymmdd) Longitude (deg) Latitude (deg) Duration (ms) B Field Line Length (km)
GBM 080807.357 080807 253.01 15.30 2.5 764GBM 090813.215 090813 278.29 "2.19 4 1198GBM 091214.495 091214 31.42 25.34 30 5493GBM 100515.316 100515 278.29 "0.98 5 1124GBM 110410.216 110410 286.38 0.15 2.2 1125GBM 110625.474 110625 111.01 14.47 6 1216RHESSI – 040117 21.119 20.535 30 3797BATSE 01470 920309 128.31 28.18 20 6371BATSE 02221 930305 28.44 28.46 25 6294BATSE 02248 930315 18.58 "3.03 <10 720BATSE 02457 930723 110.33 28.37 4 620BATSE 07208 981111 119.44 14.45 1.5 1095BATSE 07229 981125 177.04 "9.03 2 867
aThe altitudes of GBM, RHESSI and BATSE are 560 km, 578 km and 470 km, respectively. For the purpose of comparison with the magnetic field linelength, durations are estimated from their light curves. For BATSE TGF 02248, high resolution data is not available so a range is given.
Figure 8. Figure of merit for various altitudes: 350, 470,560, 1000, 2000, 5000 (km).
XIONG ET AL.: LOCATION PREDICTION OF ELECTRON TGFS A02309A02309
7 of 8
issue. A more complex and model-dependent approachis needed to address this problem, requiring knowledge ofthe intensity distribution of electron TGFs and assumptionsabout the fraction of electrons scattered out of the beam.[25] Although the geomagnetic field changes with time,
the IGRF-11 model predicts a shift at 560 km altitude of lessthan 1 degree within 10 years so our calculations are usefulfor near past and future observations.
[26] Acknowledgments. We thank the reviewers for their commentsthat improved this paper. The Fermi GBM Collaboration acknowledges sup-port for GBM development, operations, and data analysis from NASA in theUnited States and from BMWi/DLR in Germany. This work was supportedin part by the Fermi Guest Investigator Program. The v2.2 gridded satellitelightning data were produced by the NASA LIS/OTD Science Team (Prin-cipal Investigator, Hugh J. Christian, NASA / Marshall Space Flight Center)and are available from the Global Hydrology Resource Center (http://ghrc.msfc.nasa.gov). The authors wish to thank the World Wide Lightning Loca-tion Network (http://wwlln.net), a collaboration among over 50 universitiesand institutions, for providing the lightning location data used in this paper.The authors appreciate David M. Smith for helpful comments. SF acknowl-edges the support of the Irish Research Council for Science, Engineering andTechnology, cofunded by Marie Curie Actions under FP7.[27] Robert Lysak thanks the reviewers for their assistance in evaluating
this paper.
ReferencesBoccippio, D. J., W. Koshak, R. Blakeslee, K. Driscoll, D. Mach,D. Buechler, W. Boeck, H. J. Christian, and S. J. Goodman (2000),The optical transient detector (OTD): Instrument characteristics andcross-sensor validation, J. Atmos. Oceanic Technol., 17(4), 441–458,doi:10.1175/1520-0426(2000)017<0441:TOTDOI>2.0.CO;2.
Briggs, M. S., et al. (2010), First results on terrestrial gamma ray flashesfrom the Fermi Gamma-ray Burst Monitor, J. Geophys. Res., 115,A07323, doi:10.1029/2009JA015242.
Briggs, M. S., et al. (2011), Electron-positron beams from terrestrial light-ning observed with Fermi GBM, Geophys. Res. Lett., 38, L02808,doi:10.1029/2010GL046259.
Carlson, B. E., N. G. Lehtinen, and U. S. Inan (2007), Constraints on terres-trial gamma ray flash production from satellite observation, Geophys.Res. Lett., 34, L08809, doi:10.1029/2006GL029229.
Carlson, B. E., N. G. Lehtinen, and U. S. Inan (2009), Observations ofterrestrial gamma-ray flash electrons, AIP Conf. Proc., 1118(1), 84–91,doi:10.1063/1.3137717.
Carlson, B. E., T. Gjesteland, and N. Østgaard (2011), Terrestrial gamma-ray flash electron beam geometry, fluence, and detection frequency,J. Geophys. Res., 116, A11217, doi:10.1029/2011JA016812.
Christian, H. J., et al. (1999), The lightning imaging sensor, paper presentedat the 11th International Conference on Atmospheric Electricity, NASA,Guntersville, Ala.
Cohen, M. B., U. S. Inan, and G. Fishman (2006), Terrestrial gamma rayflashes observed aboard the Compton Gamma Ray Observatory/Burstand Transient Source Experiment and ELF/VLF radio atmospherics,J. Geophys. Res., 111, D24109, doi:10.1029/2005JD006987.
Cohen, M. B., U. S. Inan, R. K. Said, M. S. Briggs, G. J. Fishman,V. Connaughton, and S. A. Cummer (2010), A lightning discharge pro-ducing a beam of relativistic electrons into space, Geophys. Res. Lett.,37, L18806, doi:10.1029/2010GL044481.
Connaughton, V., et al. (2010), Associations between Fermi Gamma-rayBurst Monitor terrestrial gamma ray flashes and sferics from the WorldWide Lightning Location Network, J. Geophys. Res., 115, A12307,doi:10.1029/2010JA015681.
Cummer, S. A., Y. Zhai, W. Hu, D. M. Smith, L. I. Lopez, and M. A.Stanley (2005), Measurements and implications of the relationshipbetween lightning and terrestrial gamma ray flashes, Geophys. Res. Lett.,32, L08811, doi:10.1029/2005GL022778.
Dwyer, J. R. (2003), A fundamental limit on electric fields in air, Geophys.Res. Lett., 30(20), 2055, doi:10.1029/2003GL017781.
Dwyer, J. R. (2007), Relativistic breakdown in planetary atmospheres,Phys. Plasmas, 14(4), 042901, doi:10.1063/1.2709652.
Dwyer, J. R., and D. M. Smith (2005), A comparison between Monte Carlosimulations of runaway breakdown and terrestrial gamma-ray flash obser-vations, Geophys. Res. Lett., 32, L22804, doi:10.1029/2005GL023848.
Dwyer, J. R., B. W. Grefenstette, and D. M. Smith (2008), High-energyelectron beams launched into space by thunderstorms, Geophys. Res.Lett., 35, L02815, doi:10.1029/2007GL032430.
Finlay, C. C., et al. (2010), International Geomagnetic Reference Field: Theeleventh generation, Geophys. J. Int., 183(3), 1216–1230, doi:10.1111/j.1365-246X.2010.04804.x.
Fishman, G. J., et al. (1994), Discovery of intense gamma-ray flashes ofatmospheric origin, Science, 264(5163), 1313–1316, doi:10.1126/science.264.5163.1313.
Fishman, G. J., et al. (2011), Temporal properties of the terrestrial gamma-ray flashes from the Gamma-Ray Burst Monitor on the Fermi Observa-tory, J. Geophys. Res., 116, A07304, doi:10.1029/2010JA016084.
Fuschino, F., et al. (2011), High spatial resolution correlation of AGILETGFs and global lightning activity above the equatorial belt, Geophys.Res. Lett., 38, L14806, doi:10.1029/2011GL047817.
Grefenstette, B. W., D. M. Smith, B. J. Hazelton, and L. I. Lopez (2009),First RHESSI terrestrial gamma ray flash catalog, J. Geophys. Res.,114, A02314, doi:10.1029/2008JA013721.
Gurevich, A. V., G. M. Milikh, and R. Roussel-Dupre (1992), Runawayelectron mechanism of air breakdown and preconditioning during a thun-derstorm, Phys. Lett. A, 165(5–6), 463–468, doi:10.1016/0375-9601(92)90348-P.
Inan, U. S., S. C. Reising, G. J. Fishman, and J. M. Horack (1996), On theassociation of terrestrial gamma-ray bursts with lightning and implica-tions for sprites, Geophys. Res. Lett., 23(9), 1017–1020, doi:10.1029/96GL00746.
Lehtinen, N. G., T. F. Bell, and U. S. Inan (1999), Monte Carlo simulationof runaway MeV electron breakdown with application to red sprites andterrestrial gamma ray flashes, J. Geophys. Res., 104(A11), 24,699–24,712,doi:199910.1029/1999JA900335.
Lehtinen, N. G., U. S. Inan, and T. F. Bell (2001), Effects of thunderstorm-driven runaway electrons in the conjugate hemisphere: Purple sprites,ionization enhancements, and gamma rays, J. Geophys. Res., 106(A12),28,841–28,856, doi:200110.1029/2000JA000160.
Marisaldi, M., et al. (2010), Detection of terrestrial gamma ray flashes upto 40 MeV by the AGILE satellite, J. Geophys. Res., 115, A00E13,doi:10.1029/2009JA014502.
Meegan, C., et al. (2009), The Fermi gamma-ray burst monitor, Astrophys.J., 702, 791–804.
Roussel-Dupré, R., and A. V. Gurevich (1996), On runaway breakdown andupward propagating discharges, J. Geophys. Res., 101(A2), 2297–2311,doi:199610.1029/95JA03278.
Smith, D. M., L. I. Lopez, R. P. Lin, and C. P. Barrington-Leigh(2005), Terrestrial gamma-ray flashes observed up to 20 MeV, Science,307(5712), 1085–1088, doi:10.1126/science.1107466.
Smith, D. M., et al. (2006), The anomalous terrestrial gamma-ray flash of17 January 2004, Eos Trans. AGU, 87(52), Fall Meet. Suppl., AbstractAE31A-1040.
Smith, D. M., B. J. Hazelton, B. W. Grefenstette, J. R. Dwyer, R. H.Holzworth, and E. H. Lay (2010), Terrestrial gamma ray flashescorrelated to storm phase and tropopause height, J. Geophys. Res., 115,A00E49, doi:10.1029/2009JA014853.
Tavani, M., et al. (2011), Terrestrial gamma-ray flashes as powerful particleaccelerators, Phys. Rev. Lett., 106(1), 018501, doi:10.1103/PhysRevLett.106.018501.
M. S. Briggs, V. Connaughton, S. Guiriec, and S. Xiong, NSSTC, 320Sparkman Drive, Huntsville, AL 35805, USA. ([email protected])G. J. Fishman, Space Science Office, NASA Marshall Space Flight
Center, VP62, Huntsville, AL 35812, USA.G. Fitzpatrick and D. Tierney, School of Physics, University College
Dublin, Belfield, Stillorgan Road, Dublin 4, Ireland.S. Foley, Max-Planck-Institut für Extraterrestrische Physik, Giessenbachstr. 1,
D-85748 Garching, Germany.R. H. Holzworth and M. L. Hutchins, Earth and Space Sciences,
University of Washington, Seattle, WA 98195, USA.
XIONG ET AL.: LOCATION PREDICTION OF ELECTRON TGFS A02309A02309
8 of 8

![The Relativistic Electron Density [1ex] and Electron ... · PDF fileThe Relativistic Electron Density and Electron Correlation Markus Reiher ... Electron density distributions for](https://static.fdocuments.in/doc/165x107/5ab2020e7f8b9aea528d15ec/the-relativistic-electron-density-1ex-and-electron-relativistic-electron-density.jpg)