LOCATING SUITABLE REPLACEMENT PROPERTY...
64
LOCATING SUITABLE REPLACEMENT PROPERTY FOR THE CACHE RIVER NATIONAL WILDLIFE REFUGE BY USE OF A GIS MITIGATION SITE LOCATOR by Robert Reed A thesis presented to the Department of Geography and the Graduate School of University of Central Arkansas in partial fulfillment of the requirements for the degree of Master of GIS Conway, Arkansas August 2012
Transcript of LOCATING SUITABLE REPLACEMENT PROPERTY...
LOCATING SUITABLE REPLACEMENT PROPERTY
FOR THE CACHE RIVER NATIONAL WILDLIFE REFUGE
BY USE OF A GIS MITIGATION SITE LOCATOR
by
Robert Reed
A thesis presented to the Department of Geography
and the Graduate School of University of Central Arkansas in partial
fulfillment of the requirements for the degree of
Master of GIS
Conway, Arkansas
August 2012

All rights reserved
INFORMATION TO ALL USERSThe quality of this reproduction is dependent on the quality of the copy submitted.
In the unlikely event that the author did not send a complete manuscriptand there are missing pages, these will be noted. Also, if material had to be removed,
a note will indicate the deletion.
All rights reserved. This edition of the work is protected againstunauthorized copying under Title 17, United States Code.
ProQuest LLC.789 East Eisenhower Parkway
P.O. Box 1346Ann Arbor, MI 48106 - 1346
UMI 1516391Copyright 2012 by ProQuest LLC.
UMI Number: 1516391

TO THE OFFICE OF GRADUATE STUDIES:
The members of the Committee approve the thesis of
Robert Reed presented on July 3,2012.
ooks Pearson, ommittee ChaIrperson
Dr. Brooks Green
-

PERMISSION
Title Locating Suitable Replacement Property for the Cache River National Wildlife Refuge by Use of a GIS Mitigation Site Locator
Department Geography
Degree Master of Geographic Information Systems
In presenting this thesis/dissertation in partial fulfillment of the req uirements for
graduate degree from the University of Central Arkansas, I agree that the Library
of this University shall make it freely available for inspections. I further agree that
permission for extensive copying for scholarly purposes may be granted by the
professor who supervised my thesis work, or, in the professor's absence, by the
Chair of the Department or the Dean of the Graduate School. It is understood that
due recognition shall be given to me and to the University of Central Arkansas in
any scholarly use which may be made of any material in my thesis.
July 3, 2012

iv
ACKNOWLEDGEMENTS
I would like to thank Dr. Brooks Pearson for serving as the chair of my committee and
for helping me along my journey through graduate school. I would also like to thank Dr.
Brooks Green for helping me not only get through my thesis but my undergraduate
studies as well, which helped get me to this point. I would like to give a special thanks to
Dr. Sally Entrekin for taking the time to work with me on my thesis and provide insight
into the environmental aspects.
I would also like to thank the members of the Environmental Division of the Arkansas
Highway and Transportation Department. They have made my job something truly great,
and have had patience with me as I have made this endeavor to complete my thesis.
v
Abstract
Locating potential areas to be used as a mitigation bank site for impacts to existing
wetlands due to highway projects is the responsibility of the Environmental Division of
the Arkansas Highway and Transportation Department. The focus of this study is to use
a Geographic Information System (GIS) to determine suitability for proposed areas to be
used as a mitigation bank site. By combining data layers with characteristics specific to
wetlands, such as soils, land use, and topographical conditions, with key spatial analyses,
a GIS can successfully locate viable candidates to be used as a mitigation bank. From
there, a range of suitability can be devised to classify the results as a guide for
determining which area is most likely to be successful as a mitigation bank site.
vi
TABLE OF CONTENTS
Acknowledgements……………………………………………………………………….iv
Abstract……………………………………………………………………………………v
Table of Contents…………………………………………………………………………vi
List of Tables……………………………………………………………………………viii
List of Figures………………………………………………………………………….…ix
List of Abbreviations……………………………………………………………………...x
Chapter 1 Introduction…………………………………………………………………….1
Background………………………………………………………………………………..1
Theoretical/Conceptual Framework……………………………………………….………3
Objectives and Hypothesis……………………………………………………………..….9
Chapter 2 Literature Review……………………………………………………………..12
Purpose…………………………………………………………………………………...12
Mitigation Banks…………………………………………………………………………12
Data Sources……………………………………………………………………………..13
Analyzing Wetlands Using GIS………………………………………………………….18
Suitability Modeling……………………………………………………………………..20
Wetlands and Highway Management……………………………………………………21
Summary…………………………………………………………………………………22
Chapter 3 Methodology………………………………………………………………….23

vii
Software Used……………………………………………………………....……………23
Current Methodology………….…………………………………………………………23
Data…………………………...………………………………………………………….24
Analysis of Data………………………………………………………………………….29
Classification……………………………………………………………………………..33
Method of Application…………………………………………………………………...33
Summary…………………………………………………………………………………35
Chapter 4 Results……………………………………..………………………………….36
Land Classification………………………………………………………………………36
Accuracy Evaluation……………………………………………………………………..39
Examination of Results…………………………………………………………………..39
Summary of Results……………………………………………………………………...41
Chapter 5 Discussion…………………………………………………………………….43
Application within the Environmental Division…………………………………………43
Benefits…………………………………………………………………………………..44
Limitations……………………………………………………………………………….44
Chapter 6 Conclusion……………………………….……………………………………46
Works Cited…………………………………...…………………………………………48
Appendix…………………………………………………………………………………51
viii
LIST OF TABLES
Table 1 Data layers used for the MiSiL analysis………………………………………...16
Table 2 A detail of the six level MiSiL classification system…………………………...34
Table 3 Acres and percentages of data layers calculated by MiSiL……………………..37

ix
LIST OF FIGURES
Figure 1 The Cache River National Wildlife Refuge acquisition boundary managed
by the U.S. Fish and Wildlife Service……………………………………………………..4
Figure 2 The Western Lowlands 2-year and 5-year floodplains…………………………..8
Figure 3 Natural Resource Conservation Services digital soil database for hydric and
non-hydric soils…………………………………………………………………………..15
Figure 4 The National Wetland Inventory database which outlines existing wetlands….17
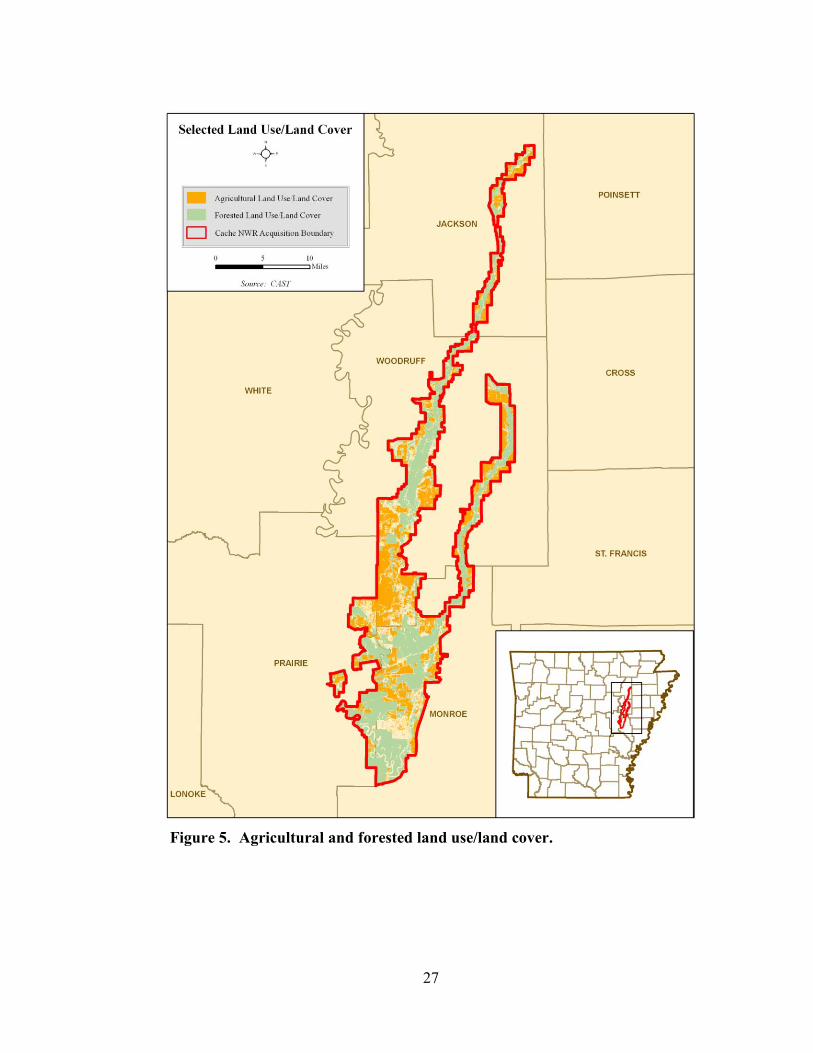
Figure 5 Agricultural and forested land use/land cover………….………………………27
Figure 6 A comparison between a hillshaded topographic map and the same area as a
slope generated raster file………………………………………………………………..28
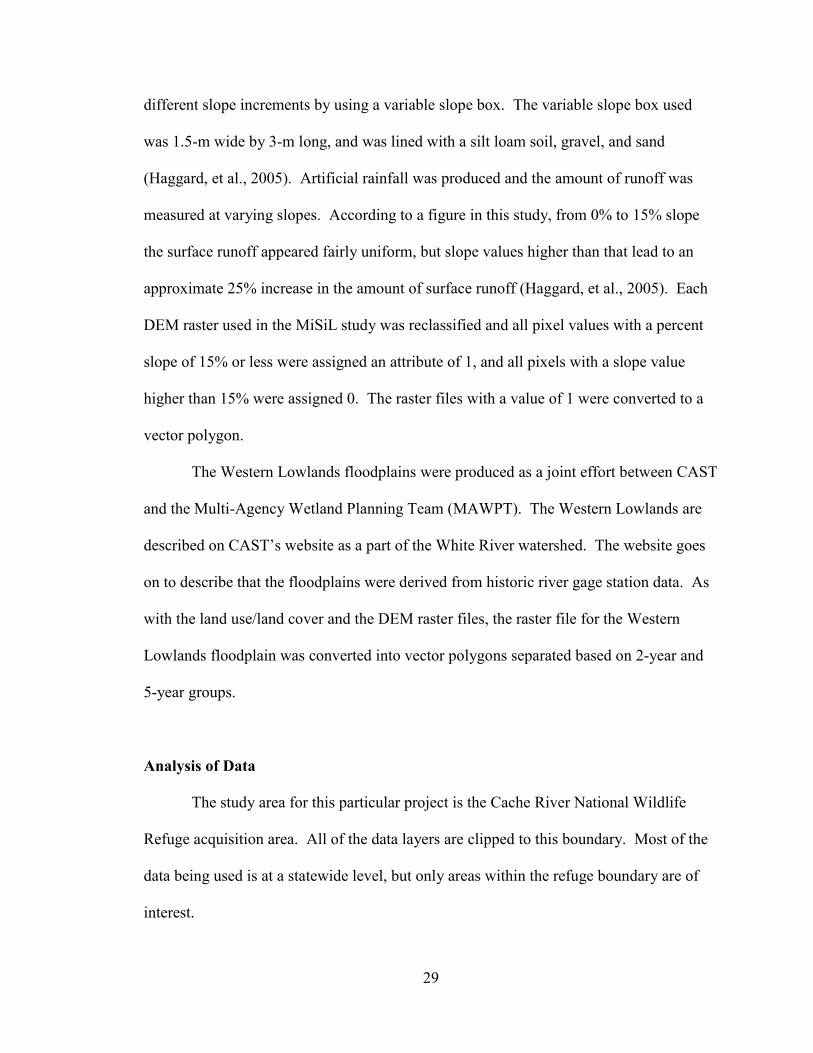
Figure 7 A layout of the input data layers and the additional criteria that leads to the
MiSiL classification system……………………………………………………………...31
Figure 8 Level 1 through Level VI classification coverages…………………………….38
Figure 9 Level I and Level IV suitability results of the MiSiL classification system…...40
x
LIST OF ABBREVIATIONS
AHTD – Arkansas Highway and Transportation Department
ANL-E – Argonne National Laboratory-East
CAST – Center for Advanced Spatial Technologies
CWA – Clean Water Act
DEM – Digital Elevation Model
EPA – Environmental Protection Agency
GIS – Geographic Information Systems
LULC – Land Use Land Cover
MAWPT – Multi-Agency Wetland Planning Team
MiSiL – Mitigation Site Locator
NRCS – Natural Resources and Conservation Services
NWI – National Wetland Inventory
SSURGO – Soil Survey Geographic Database
SWAMP – Spatial Wetland Assessment for Management & Planning
USACE – United States Army Corps of Engineers
USFWS – United States Fish and Wildlife Service

1
Chapter 1
Introduction
Background
The Environmental Division of the Arkansas Highway and Transportation
Department (AHTD) establishes and maintains areas throughout the state known as
mitigation banks. The Environmental Protection Agency (EPA) defines mitigation
banking as “the restoration, creation, enhancement and, in exceptional circumstances,
preservation of wetlands and/or other aquatic resources expressly for the purpose of
providing compensatory mitigation in advance of authorized impacts to similar
resources.” This definition provides the key criteria that the Environmental Division has
to address in order to classify a new area as a mitigation bank.
The purpose of the AHTD mitigation banks is compensatory mitigation. In a
federal register that was coordinated between the U.S. Army Corps of Engineers
(USACE) and the EPA, the term compensatory mitigation is described as involving
“actions taken to offset unavoidable adverse impacts to wetlands, streams and other
aquatic resources authorized by Clean Water Act section 404 permits and other
Department of the Army (DA) permits” (U.S. Army Corps. of Engineers & EPA, 2008).
The register goes on to describe the term “no net loss” of a wetland area, even if due to
unavoidable means. This simply states that for any wetland or aquatic area that is
removed, compensation for its replacement must be met.
The U.S. Army Corps of Engineers and the EPA describe four strategies for
compensatory mitigation: restoration of a previously existing wetland, enhancement of

2
an existing aquatic site, establishment of a new aquatic site, and preservation of an
existing aquatic site (U.S. Army Corps. of Engineers & EPA, 2008).
Whenever a highway project is to impact a wetland area, the amount of
potentially disturbed acreage is determined by wetland biologists. These acreage values
are included in the overall determination process for selecting the best highway alignment
alternative. When a wetland or aquatic area is disturbed and no longer suitable as a
functioning ecological system from highway construction, the Environmental Division of
AHTD is required to follow protocols set forth by Section 404 of the Clean Water Act
(CWA) (U.S. Fish and Wildlife Service, 2011). The CWA was established in 1972 and
provides a basic structure for the regulation of discharge of pollutants into the waters of
the United States as well as quality standards for surface waters (Environmental
Protection Agency, 2012). The CWA also includes steps for permit review and issuance
of permits that supports the avoidance of impacts to wetlands or aquatic areas. However,
if unavoidable impacts occur then mitigation is required.
Currently the process of identifying land suitable as a mitigation bank generally
involves one of the staffed wetland biologists of the Environmental Division looking over
aerial imagery and cross-referencing with soil types, to attempt to locate viable areas.
Topographic maps are also consulted to aid the determination for suitable hydrography
for a wetland. The purpose of a Geographic Information Systems (GIS) based mitigation
site locator (Mitigation Site Locator or MiSiL) will be a tool that will streamline the
determination process used for compensatory mitigation. MiSiL will be able to access
multiple datasets and provide levels of suitability for all tracts of land within a study area.
This paper will provide the details of how the MiSiL procedure was created within the
3
GIS Section of the Environmental Division of the AHTD. Presently any analyses
performed, even by the GIS Section, to determine the suitability of a tract of land to be
used as a mitigation bank are conducted separately from each other, with no unifying
examination. A digital soil layer can be viewed and even overlaid onto a topographic
map or aerial image, but this is as far as the analysis currently goes. MiSiL will greatly
change how these analyses are managed by incorporating every available dataset that
pertains to wetlands and mitigation banks into one analysis, and will then provide sets of
polygons ranked by suitability.
The MiSiL procedure has access to multiple datasets, imagery, and search criteria
which will greatly reduce the time and resources currently used. The search criteria will
attempt to locate areas that are not currently aquatic or wetland areas. The purpose of
this is to determine areas that are presently not functioning as a wetland, have the
characteristics of a wetland and can be converted into one. This is to provide an
exchange of wetlands impacted by highway projects with the establishment of wetlands
where they do not currently exist.
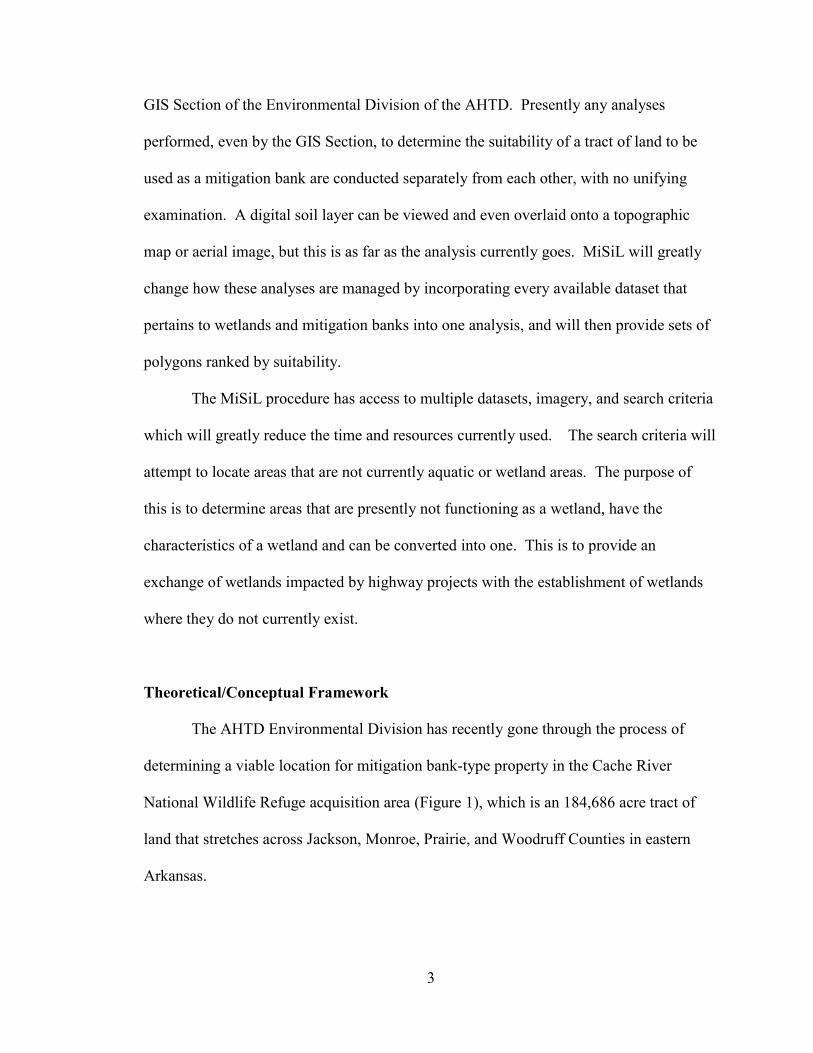
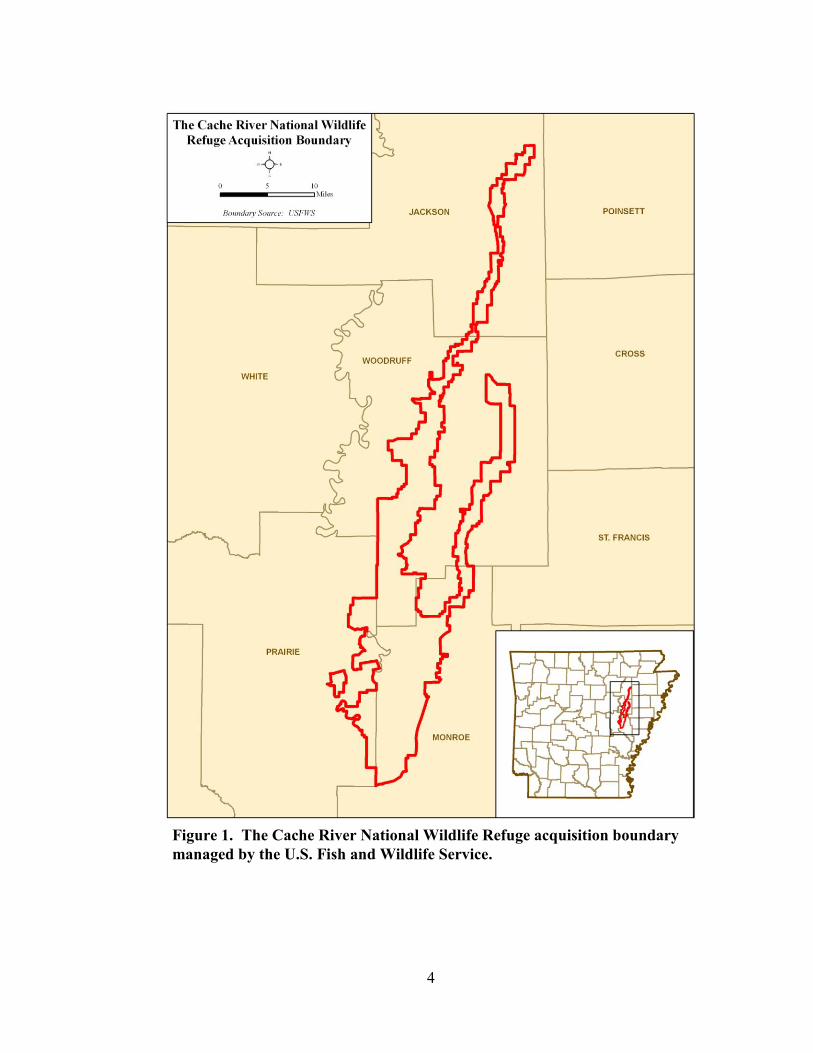
Theoretical/Conceptual Framework
The AHTD Environmental Division has recently gone through the process of
determining a viable location for mitigation bank-type property in the Cache River
National Wildlife Refuge acquisition area (Figure 1), which is an 184,686 acre tract of
land that stretches across Jackson, Monroe, Prairie, and Woodruff Counties in eastern
Arkansas.
4
Figure 1. The Cache River National Wildlife Refuge acquisition boundary
managed by the U.S. Fish and Wildlife Service.
5
A suitable tract of land within the refuge has been found by the AHTD
Environmental Division which is thought to be favorable for a mitigation bank, and will
be used to test the MiSiL procedure. This area will be used as a control because wetland
characteristics, such as hydric soils with poor drainage, low-lying slope, and the inclusion
of floodplains, are found at this site.
Lands with hydric soils that have been cleared for agriculture are considered ideal
mitigation sites by the AHTD Environmental Division because it indicates a past wetland
that has potential to maintain natural hydrology. A hydric soil is defined as “a soil that is
saturated, flooded, or ponded long enough during the growing season to develop
anaerobic conditions that favor the growth and regeneration of hydrophytic vegetation”
(Mitsch & Gosselink, 2000, p.756). The U.S. Army Corps of Engineers (2008) describes
hydrophytic vegetation as a plant species that is able to live in areas of saturated soil
conditions.
A digital soil classification layer developed by the Natural Resources
Conservation Service (NRCS, 2012) will be used to locate hydric soils. According to the
NRCS’s website, the soil layer was digitized at scales ranging from 1:12,000 to 1:63,360
and is described as the most detailed level of soil mapping prepared by the NRCS. The
soil layer contains attributes describing the hydric condition of each soil type, such as if
the soil is all hydric, partially hydric, or not hydric. Soils that are described as at least
partially hydric will be used in the MiSiL analysis. Also, this soil layer provides
information about the drainage characteristics, such as poorly drained or well drained, of
each soil type, and will be used as a criterion for the study. Poorly drained soils will keep

6
water present at a site longer than well-drained soils, which is why MiSiL will target soils
that are poorly drained.
A statewide land use/land cover dataset (Gorham, 2007) is used as an aid to
determine agricultural or cleared areas. This dataset was developed by the Center for
Advanced Spatial Technologies (CAST) from a combination of satellite imagery, river
gage data, and field inspections. The land use/land cover data is stored as a raster file
with each cell associated with a particular value that correlates to a land use category,
which includes urban, agricultural, and forested. In addition to the agricultural coverages,
Henry Langston of the Environmental Division has specified tree species found within
the land use/land cover layer that are good indicators of conditions favorable for a
wetland. Those categories include:
American Sycamore
Bald Cypress
Cherrybark Oak
Cottonwood
Gum
Mixed Ash
Mixed Hardwoods
Mixed Hickory
Mixed Oak
Nutall Oak
Overcup Oak
River Birch
Sugar Maple
Sugarberry
Sweetgum
Water Hickory
Water Tupelo
White Ash
Willow Oak
The statewide land use/land cover dataset includes these particular species and their
location can be determined because the attribute value for each of these tree types is
associated with the cells in the land use/land cover raster file.
A 5-meter digital elevation model (DEM) identifies regions that have a low and
uniform transition in slope where water would accumulate rather than run off. The
study’s slope analysis identifies areas most favorable for the creation of a new wetland by
7
depicting the lowest slopes, indicating areas of inundation. This is done by calculating
the percent slope of the entire study area and then a threshold value will be used to query
the percent values. The DEM is maintained by the Arkansas Geographic Information
Systems Board and is a secondary product derived from a statewide aerial imagery
acquisition project.
The National Wetlands Inventory (NWI) (USFWS, 2011) provides areas
designated as wetlands and will be used to identify existing wetland areas, which will
also outline non-wetland areas. The NWI is a system of wetlands classification
administered by the USFWS and is based on color-infrared photography, manual
photointerpretation, and field reconnaissance (Mitsch & Gosselink, 2000). If an area is
currently designated as a wetland within the NWI dataset, then this area will be avoided.
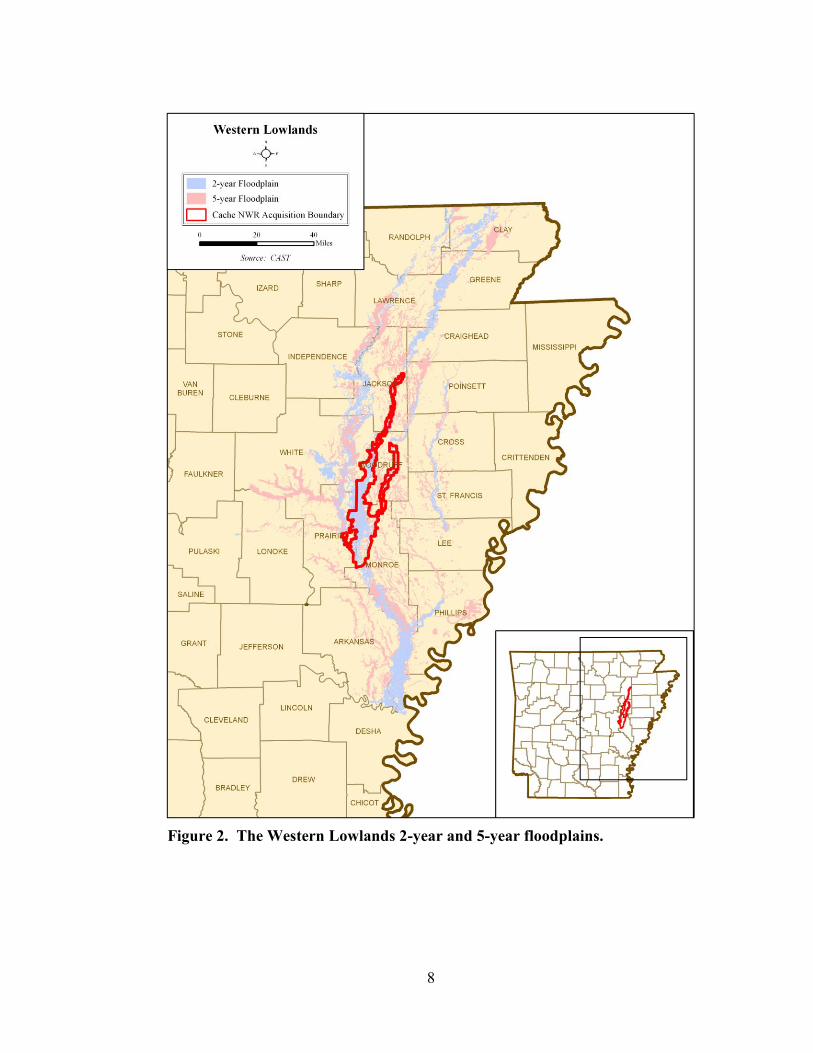
Using 2-year and 5-year floodplain classifications will identify land with regular
periods of inundation. The MiSiL model uses the Western Lowlands dataset provided
by CAST and classifies lands that fall within a 2-year and 5-year floodplain (CAST,
Figure 2). The Western Lowlands dataset stretches from northeastern Arkansas south to
Desha County and is named such due to its location west of Crowley’s Ridge. Flooded
areas which demonstrate the potential to hold water and keep an area inundated will be
indicative of a potential mitigation bank site location.
New mitigation bank sites have a minimum area requirement that must be met by
the AHTD Environmental Division, which is based on a current or projected need that the
Environmental Division determines by assessing potential impacts due to on-going or
future highway projects. In the case of Cache River National Wildlife Refuge the new
8
Figure 2. The Western Lowlands 2-year and 5-year floodplains.

9
site must be at least ten acres. Areas that meet this minimum area will be selected from
the entire set of results.
Once the different data layers have been compiled, queried, and extracted, the
results will be classified based on a tiered scale of conditions ranging from most optimal
to least favorable. Ideally the new mitigation bank site location would fall within the 2-
year floodplain, have all hydric soils, and have been cleared for timber or agriculture,
which would indicate no existing wetland. However, since the MiSiL procedure is able
to provide ranges of suitability, areas that are less than optimal will still be able to be
considered.
Objectives and Hypothesis
The MiSiL procedure will successfully locate potential areas for a mitigation bank,
categorizing each based on its relative suitability for wetland conditions. Success will be
tested by comparing results produced by the MiSiL procedure with a known viable site.
If MiSiL does not provide any level of suitability when evaluated against an area that has
been field inspected by the Environmental Division, then the procedure will be
considered unsuccessful.
The MiSiL procedure introduces a new contribution not only to the AHTD
Environmental division, but also to the realm of geographic information science, by
providing results that are based on suitability levels. Currently the process of finding a
suitable tract of land for a new mitigation bank involves consulting soil survey manuals
and an online imagery viewer such as Google Earth, and then relying on a field visit to
provide the bulk of the remaining information to determine if the area is acceptable.
10
Each component of the study is separate, and there is no use of a GIS. The MiSiL
procedure will drastically change this by providing a significant amount of information,
such as soils, land cover, topography, and existing conditions, in the early stage of the
selection process. Furthermore, the results will be classified according to suitability.
This is a major contribution to the geographic information sciences because the MiSiL
procedure not only provides spatial results of how the various geographic input layers
relate to each other but also rank areas for potential of success for the establishment of an
ecologically sustainable wetland. Another major contribution of the MiSiL procedure is
the practically limitless size of a study area which can be examined, as MiSiL could just
as easily perform an analysis of a potential new mitigation bank on a statewide level as it
could a much smaller area such as a watershed.
The goal of this study is to determine potential mitigation bank areas at the
earliest possible stage in the selection process. Before any work can be done for
acquiring property and converting the land into a wetland area, a suitable location has to
be found. The processes outlined in this study should provide multiple alternatives to
potential locations that can be used for the establishment of a wetland area. For AHTD,
the functionality of MiSiL is a significant step towards streamlining the current procedure,
facilitating a much faster development time from inquiry to results.
It is predicted that the study will yield positive results when performed. The
combination of input variables, such as hydric soils, existing wetlands, tree types, etc.,
that will be used in the study have the capability to determine and locate a suitable area
for a mitigation site. Also, as the input data is updated, the results can be updated as well.
The only foreseeable reason why MiSiL would not generate positive results is if there

11
were inaccuracies in the input layers. Fortunately, the agencies providing these layers are
a trustworthy source.
Based on the potential success of the MiSiL procedure, there is one primary
research question that will be answered: Is the study capable of providing accurate
results for an area of the Cache River National Wildlife Refuge acquisition boundary in
finding suitable mitigation bank property?
The study develops an automated method of selecting areas of land based on a set
of input variables and extracting these tracts of land as potential mitigation bank sites.
The accuracy addressed in the research question can be tested. A new site has already
been selected for the creation of a new mitigation bank. Since this area was determined
suitable before this study was established it can be used as control location. Theoretically,
the processes included in this study should provide this selected mitigation bank as a
suitable candidate. If this occurs, then the results of the study will be positive.

12
Chapter 2
REVIEW OF LITERATURE
Purpose
It has been estimated that the world has lost as much as fifty percent of its original
wetlands (Mitsch & Gosselink, 2000). Wetlands are important factors involved in the
global cycles of natural resources for their ability to reduce floods, recharge groundwater,
and increase dry season flows (Bullock & Acreman, 2003). A cost estimate analysis of
wetlands was performed by members of the Illinois Institute of Natural Resources. The
study determined that the replacement of services, such as fish production and flood
control, of a 770 hectare wetland found in northeastern Illinois would need $939,000 a
year to perform activities that the wetland was providing (Mitsch & Gosselink, 2000). To
avoid impacts on the overall contribution towards the environment that wetlands provide,
replacement property is acquired and maintained by the Environmental Division
whenever an existing wetland area will be disturbed.
Mitigation Banks
Mitigation banks allow for a tract of land to be set aside as a developed wetland
with the amount of acreage thus maintained to be used as credit toward areas where
existing wetlands are impacted due to man-made projects such as highway development.
A mitigation bank is a site where a wetland is restored, created, enhanced, or preserved
for the purpose of being prepared in advance for authorized impacts to an existing
wetland (Mitch & Gosselink, 2000). A preserved wetland is ecologically effective in that

13
it is already functioning. However, a preserved wetland is not offering any compensation
for the loss of another wetland since it is already in use. Restoration of a wetland not
only provides an area previously unused as a wetland as compensation to impacts to
another existing wetland, it has high potential to succeed as a wetland.
The characteristics of a mitigation bank ideally include hydric soils, non-sloping
or low-lying topography, no existing wetland, and the presence of water. To emphasize
the importance of these conditions, literature from the Washington State Department of
Transportation (WSDOT) was reviewed. The WSDOT describes two different wetlands
that are located within a proposed mitigation site study area in one of their technical
memos. Both wetlands have hydric soil conditions found within a 16-inch deep soil pit.
Also, the two wetlands are located in low-lying areas and both are outside of an existing
wetland. The mitigation site is located within a 100-year floodplain. If such conditions
are not present, artificial processes can be utilized to aid in restoration, such as excavation
to use a local water supply and planting desirable vegetation.
Locating soils with hydric conditions is the “foundation” by which determining
potential areas for mitigation bank sites is achieved (Tiner, 2002). Existing wetlands are
removed as potential sites and existing land use classifications are considered (Tiner,
2002). Since the focus of this study is to create a mitigation bank site from an area that is
not currently a wetland, existing wetlands are excluded.
Data Sources
The GIS Bureau of the Montana Department of Administration developed an
application to determine potential sites for wetland mitigation using the Natural Resource
14
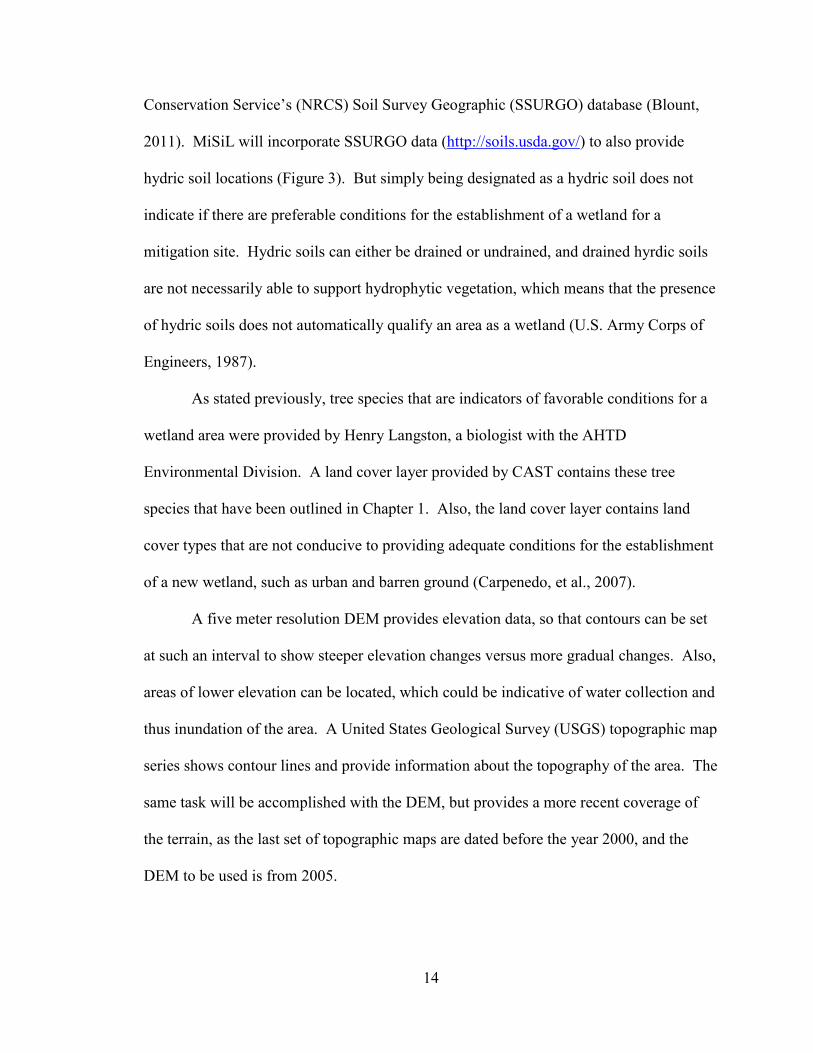
Conservation Service’s (NRCS) Soil Survey Geographic (SSURGO) database (Blount,
2011). MiSiL will incorporate SSURGO data (http://soils.usda.gov/) to also provide
hydric soil locations (Figure 3). But simply being designated as a hydric soil does not
indicate if there are preferable conditions for the establishment of a wetland for a
mitigation site. Hydric soils can either be drained or undrained, and drained hyrdic soils
are not necessarily able to support hydrophytic vegetation, which means that the presence
of hydric soils does not automatically qualify an area as a wetland (U.S. Army Corps of
Engineers, 1987).
As stated previously, tree species that are indicators of favorable conditions for a
wetland area were provided by Henry Langston, a biologist with the AHTD
Environmental Division. A land cover layer provided by CAST contains these tree
species that have been outlined in Chapter 1. Also, the land cover layer contains land
cover types that are not conducive to providing adequate conditions for the establishment
of a new wetland, such as urban and barren ground (Carpenedo, et al., 2007).
A five meter resolution DEM provides elevation data, so that contours can be set
at such an interval to show steeper elevation changes versus more gradual changes. Also,
areas of lower elevation can be located, which could be indicative of water collection and
thus inundation of the area. A United States Geological Survey (USGS) topographic map
series shows contour lines and provide information about the topography of the area. The
same task will be accomplished with the DEM, but provides a more recent coverage of
the terrain, as the last set of topographic maps are dated before the year 2000, and the
DEM to be used is from 2005.
15
Figure 3. Natural Resource Conservation Services digital soil database
for hydric and non-hydric soils.

16
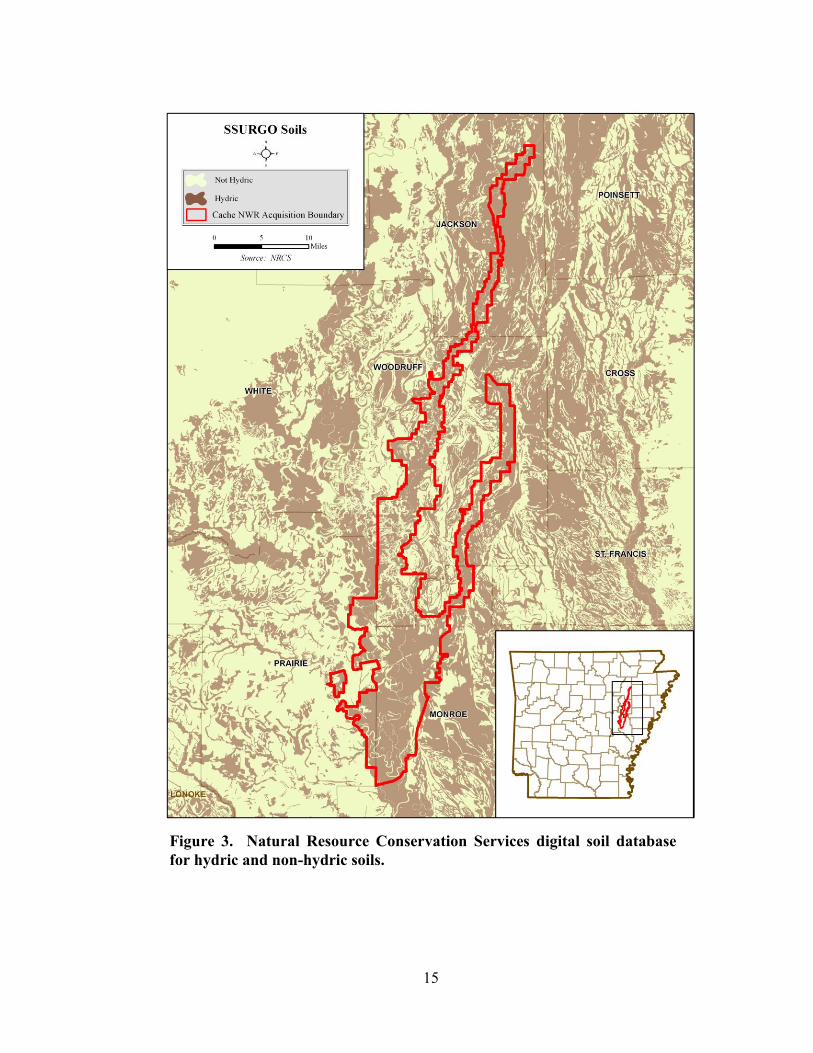
The NWI provides a digital dataset of wetlands which have been mapped in the
United States, and covers this study’s areas of interest within the Cache River National
Wildlife Refuge (Figure 4). The NWI is based on the Cowardin, et al. (1979)
classification scheme (Mitsch & Gosselink, 2000) and is described as having established
the principles of how the USFWS manages the NWI (Mitsch & Gosselink, 2000). This
classification scheme divides the potential wetland area into a series of systems, then
subsystems, and finally a class based on the system and subsystem the area falls under
(Cowardin, et al., 1979). The NWI will eliminate areas as potential mitigation site
locations due to the fact that a wetland area is already established at that location.
NWI spatial data is available on the USFWS National Wetlands Inventory
website (www.fws.gov/wetlands/Data/index.html). The data includes both polygons
categorized as either wetlands or swamps, which are based on USGS 1:100,000
topographic maps. According to the USFWS’s website (2012), the wetlands are digitized
based on high altitude aerial imagery, and are determined from the vegetation, hydrology,
and geography seen in the images.
Table 1 outlines all of the input data layers used in the MiSiL procedure. It
provides their source and the date of the last update.
Table 1. Data layers used for the MiSiL analysis.
17
Figure 4. The National Wetland Inventory database which outlines existing
wetlands.
18
Analyzing Wetlands Using GIS
A GIS’s ability to analyze the spatial relationships between multiple layers makes
it ideal to locate areas for potential conversion into wetlands to be used as a mitigation
bank site. The University of Chicago developed a GIS-based spatial modeling process
for the Argonne National Laboratory-East (ANL-E) site, which is located in southeast
DuPage County, Illinois, and will be used as a mitigation site (Van Lonkhuyzen, et al.,
2004). Variables used in the GIS analysis of the ANL-E included soils, vegetation
coverage, and land use, and the study area was determined to have a relatively level slope,
ranging from 2% to 5% (Van Lonkhuyzen, et al., 2004). Input variables will have to be
prioritized in order to rank an area based on its suitability as a wetland. Land use and
vegetative cover were assigned the highest weights for use in the ANL-E study (Van
Lonkhuyzen, et al., 2004), and this is likely due to the fact that the presence of an open
area not being used for urban development which has vegetation that may be hydrophytic
would indicate that the conditions are favorable for the establishment of a wetland. Soil
type was given a lower priority, although locations in the ANL-E where “hydric soils
occur would be better suited to wetland establishment” (Van Lonkhuyzen, et al., 2004).
Even though hydric soils are important for the creation of a new wetland, the lower
weight given to the soils layer was due to the fact that assigning the value of one layer
over another is subjective in its nature (Van Lonkhuyzen, et al., 2004). In this particular
study, many areas of hydric soils were found in portions of the site that currently did not
support many wetlands. This is an example of site specific knowledge being used in
conjunction with the data, since the users knew that hydric soils were not as reliable an
19
indicator for this particular study. The users of the GIS process have the responsibility of
deciding which factors are more suited for their purpose.
Each of the input variables for the ANL-E site was determined to be either
optimally suitable or not suitable and was overlaid onto the ANL-E site separately (Van
Lonkhuyzen, et al., 2004). The suitability of each variable was based on “professional
judgment, data availability, and site-specific knowledge” (Van Lonkhuyzen, et al., 2004).
Viewing the results of each variable independently makes it difficult to determine a
location suitable for a new wetland because an area may be well suited based on one
variable, but that same area may be poorly suited for another variable. The solution is to
overlay the results of all of the variables and then examine where the best suited areas are
found.
Another application developed to analyze wetland areas was created by the
National Oceanic and Atmospheric Administration’s (NOAA) Coastal Services Center
and was named the “Spatial Wetland Assessment for Management & Planning” or
“SWAMP” (Tiner, 2002). The focus of SWAMP is to quantify the wetland’s functions
as opposed to locating a new wetland area. However, the structure of the analyses can be
incorporated into the process of locating new mitigation sites. SWAMP also uses the
NWI dataset to provide wetland attributes that are “critical and form the starting point for
the assessment” (Tiner, 2002, p.64). SWAMP provides a ranked set of results that are
divided as exceptional significance, substantial significance, and beneficial significance.
These classifications are used instead of a numerical ranking because of current
limitations in the understanding of wetland functions. However, this classification
20
scheme still provides users with an idea of how an impact to the wetland will affect the
functions found there.
Suitability Modeling
Suitability modeling analyzes key input factors and then provides results as to
which areas are best suited for the intended use. An example of suitability modeling has
been implemented for use in Finland to analyze the habitats of threatened forest species
in order to protect them from any activity which may cause adverse impacts (Store &
Jokimäki, 2003). Both the actual habitat and the surrounding landscape were converted
to a raster file and attributed for use in a GIS. In order to accommodate for the
landscape’s characteristics a certain distance is applied around every pixel of the raster
file that represents the habitat (Store & Jokimäki, 2003).
A habitat model is then constructed and outlines the areas not suitable for the
species and the areas that are well suited for the species, referred to as the feasible area
(Store & Jokimäki, 2003). Since all of the inputs are maintained as a raster file, the
results are stored as such with the cell values ranging between 0 (unsuitable) to 1 (most
suitable) (Store & Jokimäki, 2003).
The principle of the suitability modeling exhibited by the habitat study can be
applied to determine a location for a mitigation bank site. Hydric soils, low-lying
topography, and no existing wetland are inputs that would lead to a feasible area. Also,
distance to wetland indicators such as the proper vegetation would be similar to the
landscape analysis.

21
Wetlands and Highway Management
Highways have contributed to the loss of over half of the original 230 million
acres of wetlands which have been destroyed since the arrival of the earliest settlers (Neal,
1999). Potential impacts to a wetland due to a proposed highway project are evaluated by
a state’s department of transportation. This step is preferably performed in the planning
phase of a project, a time when there are multiple alternatives that may be selected from
to minimize the impact to the wetland.
There may be times when a wetland will be impacted regardless of the highway
alternative selected. In these cases minimization of impact is the objective. The
SWAMP method can determine the highway alternative that has the least impact on the
wetland function (Tiner, 2002). Unlike other methods which attempt to find the least
amount of wetland acreage that will be impacted, SWAMP instead focuses on ranking a
wetland’s functions and determines which ones are most important. It is then these
criteria that dictate which highway alternative would be better suited to reduce the overall
impact of the highway project to the wetland area.
A study by the Montana Department of Natural Resources and Conservation
(DNRC) examined the idea of using state owned land adjacent to highways for the
creation of wetlands (Blount, 2011). The Montana DNRC uses the high cost of the
creation of a wetland as the reason for such a proposal. A state’s Department of
Transportation would not only have adequate funding to cover the cost of the
establishment of a new wetland, but would also need to provide replacement wetland
property for any that was impacted due to a highway project.
22
Summary
The literature focuses on one key concept: the variables input for a wetland site
selection need to be ranked on their level of suitability. The ANL-E study assigns
weighted values for the categories such as soils, vegetation, and land use, and SWAMP
prioritizes the functionality of the wetlands. MiSiL will accomplish this same task, by
producing a set of ranked results based on the suitability of an area to support a wetland
to be used as a mitigation bank site.

23
Chapter 3
METHODOLOGY
The MiSiL procedure separates potential areas to be used for mitigation bank sites
into ranked categories of suitability. This is accomplished by using datasets such as for
soils, land cover, floodplains, and slope in a variety of analyses that are discussed
throughout this chapter. The resulting products can then be placed in a tiered
classification system that assigns a suitability level.
Software Used
The GIS platform used for the analysis was Esri’s ArcGIS 10 (www.esri.com). In
addition, the add-on ET GeoWizards was used alongside ArcGIS 10. ET GeoWizards is a
set of tools that can be used within the ArcGIS desktop environment and is available at
www.ian-ko.com. Esri’s Spatial Analyst extension was also used.
Current Methodology
Before any preliminary analysis is performed, the Environmental Division at the
AHTD may either receive a referral from a realtor or by seeing a listing of land for sale
on a website such as Mossy Oak’s (www.mossyoakproperties.com) to be used as a
mitigation bank site. A realtor will typically be aware of areas of interest from the
Environmental Division’s perspective since they would have worked with the division on
past properties. The realtor will place a phone call to a staff member who works with the
division’s mitigation sites and provide them with a location of property for sale. Then,
24
the Environmental Division staff member will look on a site such as Google Earth to
view aerial imagery of the proposed property.
Once a prospective property has been located, the Environmental Division staff
will cross reference the soil types to determine if there are conditions favorable for a new
mitigation site. This can be accomplished by either looking through a printed copy of a
soil survey or more recently by adding a soil layer developed by the Natural Resources
Conservation Service (NRCS) into Google Earth which outlines the different soil
classifications and can be overlaid onto aerial imagery.
After the office research has been conducted, field visits to the potential site are
made, and characteristics such as vegetation, land cover, hydrology, and other ground
conditions are ascertained.
The current methodology is successful, but with the use of the MiSiL procedure a
significant amount of the information collected from multiple analyses can be
streamlined into one workflow. The MiSiL procedure provides instant access to soil
types, statewide land cover, slope values, aerial imagery, topographic maps, etc. Also, by
using the MiSiL procedure, acreage determinations can be made for the amount of land
within the proposed property and the surrounding area.
Data
According to the Standard GIS Methodology for Wetland Analysis manual (CAST
& MAWPT, 2012), which is the result of collaboration between CAST and the Multi-
Agency Wetland Planning Team (MAWPT), any form of point, line, polygon, or pixel
spatial element data within a study area is able to have a value placed on it by the use of a

25
GIS. The spatial elements that meet more of the search criteria will be provided with a
higher ranking than those who meet fewer of the criteria. The manual goes on to explain
that an example would be if a location had three of the search criteria, such as wetland
hydrology, soils, and vegetation, it would receive a higher ranking than an area that only
contained two of these criteria. The Environmental Division at the AHTD places more
emphasis on the soil type (hydric) and the land cover (forested or agricultural) than the
other criteria because these two factors are indicative of conditions found at previous
areas that were converted to mitigation sites.
The soils data layer used to determine hydric soils was developed by the Natural
Resources Conservation Service (NRCS) and is available for download for both
individual states and for the entire United States. This data layer is the Soil Survey
Geographic (SSURGO) Database, which is a digital version of previously printed soil
survey manuals that contains polygons for each soil type and was digitized at scales
ranging from 1:12,000 to approximately 1:64,000. One of the attributes available for all
of the soils is the HydrcRatng field, which classifies the soils as “All Hydric”, “Partially
Hydric”, or “Not Hydric”. Soil polygons were queried and separated into two sets as
“All Hydric” and “Partially Hydric”.
In addition to the hydric rating, only soils that are described as being poorly
drained will be included in the final outputs. These soils that fell within the refuge
boundary were queried based on their classification as poorly drained.
Statewide land use/land cover raster files were provided by CAST for the years
1999, 2004, and 2006. An Excel worksheet was also provided with the raster files as a
legend for the classification of the pixel values. Certain land cover categories were only

26
available from certain years, which lead to all three time periods of data to be used for
querying for forested and agriculture coverages. The forested areas were based on the
species listed in Chapter 1. The tree species found at these areas are indicative of
wetland conditions, and will be considered as areas that are already developed wetlands.
The Extract by Attributes tool from the Spatial Analyst toolset allowed the land
use/land cover raster files to be queried for select pixel values for both forested and
agricultural. Once these pixels were selected, the Raster to Polygon tool was used to
convert the pixels into polygons which would allow for them to be used easier in
conjunction with the other vector based layers. The forested polygons and the
agricultural polygons were kept as separate layers (Figure 5).
The DEM used by this study is a 5-meter resolution raster file published in 2007
by the Arkansas Geographic Information Systems Board (http://www.gis.state.ar.us/
GISB/gisb.html). Each DEM is available as a county mosaic and the counties included in
the download were Jackson, Monroe, Prairie, and Woodruff. The percent slope was
generated for each DEM in ArcGIS and ranged from 0% to 206.5%. The typical slope for
each county was very low, due to the fact that the study area lies within the Arkansas
Mississippi Alluvial Plain region of Arkansas. The higher slope values can be explained
by Figure 6, which illustrates that the upper end values, which are shown in reds and
yellows, are due to gullies that have a stream passing through them. A hillshaded U.S.
Geological Survey (USGS) topographic map is used to best depict the relief of the
topography.
A slope value of 15% or less was queried for each of the DEMs. This threshold
was based on a study (Haggard, et al., 2005) where surface runoff was measured on
27
Figure 5. Agricultural and forested land use/land cover.

28
Figure 6. A comparison between a hillshaded topographic map and the same
area as a slope generated raster file.
29
different slope increments by using a variable slope box. The variable slope box used
was 1.5-m wide by 3-m long, and was lined with a silt loam soil, gravel, and sand
(Haggard, et al., 2005). Artificial rainfall was produced and the amount of runoff was
measured at varying slopes. According to a figure in this study, from 0% to 15% slope
the surface runoff appeared fairly uniform, but slope values higher than that lead to an
approximate 25% increase in the amount of surface runoff (Haggard, et al., 2005). Each
DEM raster used in the MiSiL study was reclassified and all pixel values with a percent
slope of 15% or less were assigned an attribute of 1, and all pixels with a slope value
higher than 15% were assigned 0. The raster files with a value of 1 were converted to a
vector polygon.
The Western Lowlands floodplains were produced as a joint effort between CAST
and the Multi-Agency Wetland Planning Team (MAWPT). The Western Lowlands are
described on CAST’s website as a part of the White River watershed. The website goes
on to describe that the floodplains were derived from historic river gage station data. As
with the land use/land cover and the DEM raster files, the raster file for the Western
Lowlands floodplain was converted into vector polygons separated based on 2-year and
5-year groups.
Analysis of Data
The study area for this particular project is the Cache River National Wildlife
Refuge acquisition area. All of the data layers are clipped to this boundary. Most of the
data being used is at a statewide level, but only areas within the refuge boundary are of
interest.

30
The first step was to eliminate any area in the refuge that was already classified as
a wetland or swamp based on the NWI layer. The Erase tool from the ET GeoWizards
toolset subtracted the area of the refuge boundary that was inside the polygons for either
wetlands or swamps. This created refuge property that is not already a wetland type area
and has the potential for being suitable for the development of a mitigation bank.
Once polygons were created for areas within the refuge that were not already
wetlands, they were ready to be combined with the polygons for poorly drained soils,
agricultural land use/land cover (LULC), and slope. This was done by using the Clip
geoprocessing command within ArcGIS. Each layer was clipped based on its intersection
with each other. This resulting layer, named Base Layer, was used to compare with areas
of hydric soils and also of 2-year and 5-year floodplains. The Base Layer feature was
created first because all of the queries to be performed with the soils and floodplains
would all use this same base information: no existing wetland from the NWI, poorly
drained soil, the 15% or lower slope from the DEM, and the land use/land cover
categories.
The next step was to find areas of either all hydric or partially hydric soils that
were within the 2-year floodplain, the 5-year floodplain, or neither. The soil was to be at
least partially hydric since that would be better suited for the creation of a wetland area.
The Intersect tool found areas of coincidence among the input layers, and a breakdown of
the various inputs and results can be seen in Figure 7. This figure illustrates the different
input layers that created the Base Layer feature class, and then how the Base Layer
feature class was paired with the two soil classifications and the floodplains, all of which
lead to the six classifications.
31
Figure 7. A layout of the input data layers and the additional criteria that
leads to the MiSiL classification system.
32
The resulting layers generated from the intersection of all of the input data lead to
six categories: all hydric soils in the 2-year floodplain, all hydric soils in the 5-year
floodplain, partially hydric soils in the 2-year floodplain, partially hydric soils in the 5-
year floodplain, all hydric soils not within the 2 or 5-year floodplain, and partially hydric
soils not within the 2 or 5-year floodplain. All six of these different result layers were
exported from ArcGIS as a separate data layer.
Once these six different categories were ready, area calculations were performed
to find a contiguous tract of land that met a minimum area requirement. For this specific
study, the AHTD Environmental Division was looking at areas that were at least ten acres.
Since the intersection analyses created multiple separate polygons within each of the six
categories, the Dissolve geoprocessing tool was used to merge all touching polygons
together. A new field was created in the attribute table in each of the categories and the
acreages were calculated and added to this field. From this polygons of ten or more acres
could be queried from each of the categories.
Using the principle of spatial autocorrelation, the idea that areas that are near each
other geographically share the same characteristics, the forested land use/land cover layer
was used to further identify potential mitigation bank sites. The tree species found within
the forested land use/land cover layer are typically found within a wetland and thus
support the idea that wetland conditions are present. The resulting polygons selected for
being ten or more acres were further filtered if they were located within 250 feet of an
area forested with the tree species listed in Chapter 1. The 250-foot distance is used to
account for any gaps that may exist between the various datasets used. Ideally, only
areas touching the forested land use/land cover feature would be included, but the
33
datasets used were digitized independently from each other, and may contain gaps in their
coverages.
The steps outlined produced six output layers based on the combination of the
Base Layer, the soils, and the floodplains, and that they meet the minimum area
requirement and proximity to the forested areas. Once potential areas were selected
based on the aforementioned process, the results were ready to be classified based on
their suitability.
Classification
A six stage classification system was developed to rank potential areas from most
favorable to least favorable for a new mitigation bank site. The classification system
ranges from Level I (more suitable) to Level VI (less suitable) (Table 2). The Level I
classification includes the optimal conditions, which are all hydric soils, within the 2-year
floodplain, no existing wetland, poorly drained, 15% or less slope, within the desired land
use/land cover categories, 10 or more acres, and within 250 feet of a forested area. As
the levels increase, the conditions become less preferred, allowing for either only
partially hydric soils to be found or for the area to be outside of the floodplain.
Method of Application
The MiSiL study was performed by the author. This has lead to standard sets of
data that will be used in any project in the state, such as the hydric soils, LULC, slope,
and NWI. These layers have already been queried for select categories, which will not

34
Table 2. A detail of the six level MiSiL classification system.
35
have to be repeated in the future, whereas any updates to the datasets will simply
automatically overwrite the existing queries.
With each new project there is the potential of data that is available only for select
parts of the state which may or may not coincide with the proposed study area. This
determines that the best method of application is a standardized workflow to be followed
by a GIS specialist. However, a manual can be written to direct such a specialist through
the steps of the MiSiL procedure. Not only could this be shared within one agency
among GIS users, but could also be applied by other agencies.
Summary
MiSiL created standardized Base Layer and hydric soils combinations that can be
used in conjunction with any additional information available. In this particular study
these combinations were used alongside the 2-year and 5-year floodplain data. Also,
MiSiL is able to adjust for any minimum area requirement that is needed. These all
indicate a high level of flexibility of the procedure.
36
Chapter 4
RESULTS
Land Classification
The Cache National Wildlife Refuge acquisition boundary covers 184,686 acres.
The area covered by the different input data layers, both used within and generated by
MiSiL, as well as the classification levels can be seen in Table 3. The table shows that
many of the input layers on their own comprised a significant portion of the acquisition
boundary, with the smallest amount coming from the 5-year floodplain and still covering
approximately one-fifth of the boundary.
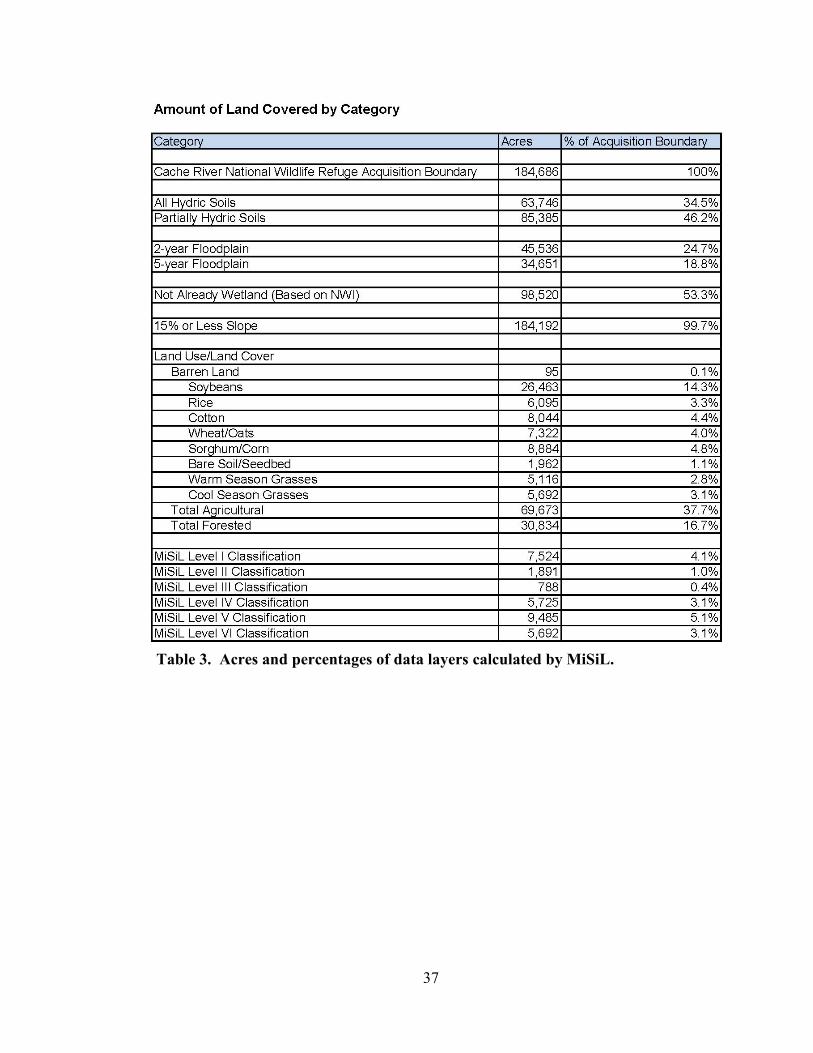
The amount of land covered by the different categories substantiates that the
acquisition boundary was very well suited for finding property to be converted into a new
wetland area. Eighty-one percent of the area was covered by either all or partially hydric
soils, with a little over half of the area not currently a wetland, and almost the entire site
below a 15% slope. Also, over one-third of the acquisition boundary fell within the
agricultural land use/land cover categories. However, when all of the criteria needed to
be met as devised by the six level classification systems, the chances of locating a new
area for a mitigation bank site diminished. The absence of all the input layers
overlapping is what has lead to the reduced percent coverage of the classification levels
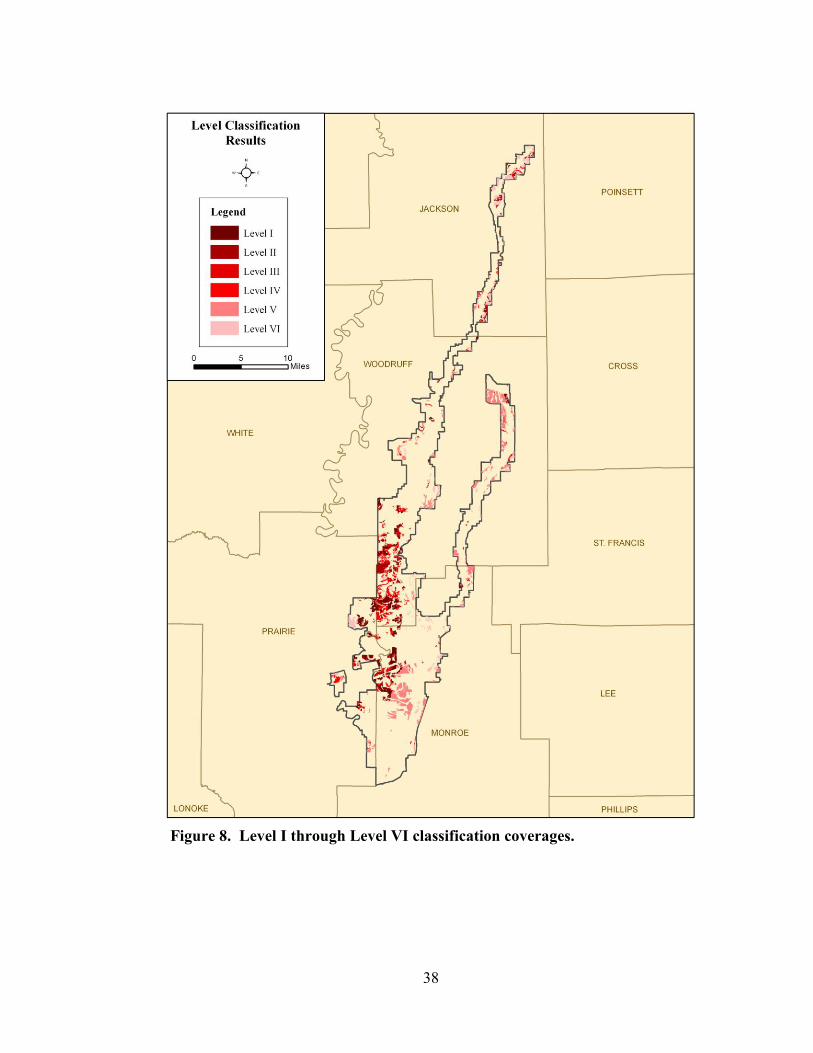
for the study area. The results of each level of classification can be seen in Figure 8.
37
Table 3. Acres and percentages of data layers calculated by MiSiL.
38
Figure 8. Level I through Level VI classification coverages.
39
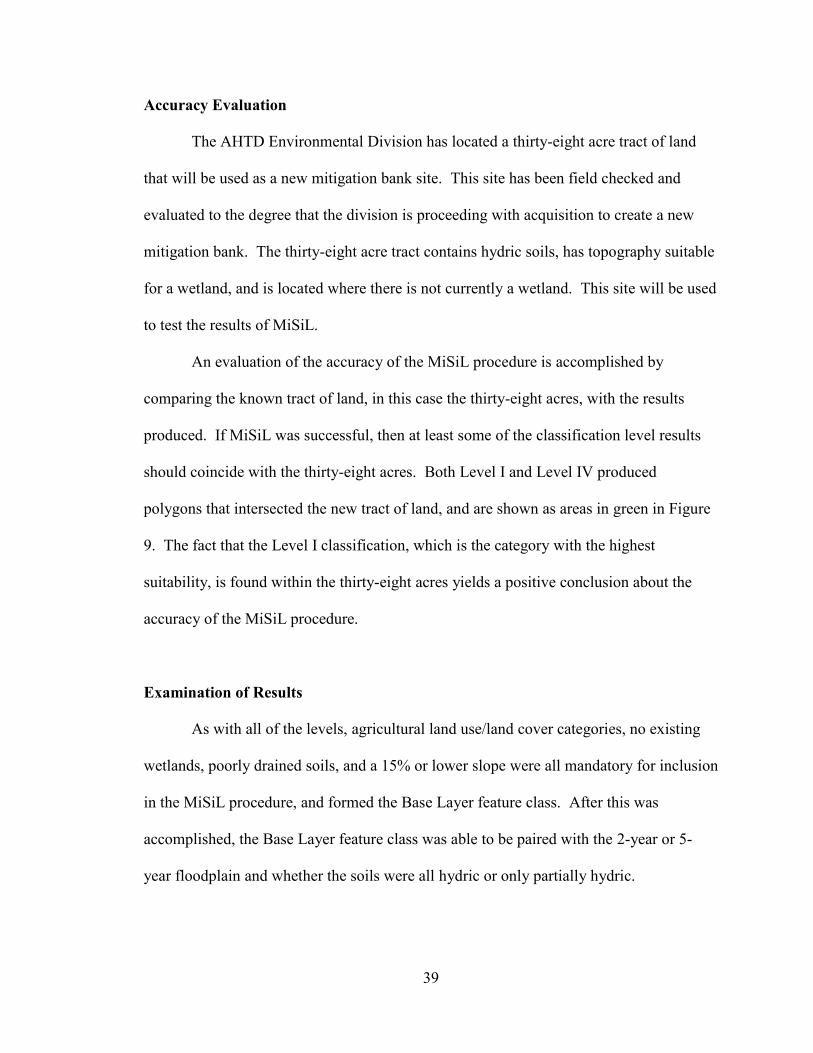
Accuracy Evaluation
The AHTD Environmental Division has located a thirty-eight acre tract of land
that will be used as a new mitigation bank site. This site has been field checked and
evaluated to the degree that the division is proceeding with acquisition to create a new
mitigation bank. The thirty-eight acre tract contains hydric soils, has topography suitable
for a wetland, and is located where there is not currently a wetland. This site will be used
to test the results of MiSiL.
An evaluation of the accuracy of the MiSiL procedure is accomplished by
comparing the known tract of land, in this case the thirty-eight acres, with the results
produced. If MiSiL was successful, then at least some of the classification level results
should coincide with the thirty-eight acres. Both Level I and Level IV produced
polygons that intersected the new tract of land, and are shown as areas in green in Figure
9. The fact that the Level I classification, which is the category with the highest
suitability, is found within the thirty-eight acres yields a positive conclusion about the
accuracy of the MiSiL procedure.
Examination of Results
As with all of the levels, agricultural land use/land cover categories, no existing
wetlands, poorly drained soils, and a 15% or lower slope were all mandatory for inclusion
in the MiSiL procedure, and formed the Base Layer feature class. After this was
accomplished, the Base Layer feature class was able to be paired with the 2-year or 5-
year floodplain and whether the soils were all hydric or only partially hydric.
40
Figure 9. Level I and Level IV suitability results of the MiSiL classification
system.

41
Approximately one-third of the thirty-eight acres intersects the 2-year floodplain.
This same area also has hydric soils in the form of Kobel silty clay loam. According to
the SSURGO database, Kobel is described as having a 0% to 1% slope. This type of
topography is ideal since low slope promotes ponding. Also, with the composition
consisting of silty clay loam, the permeability of the soil is low, leading to water slowly
seeping downward through the soil. These are the factors that lead to this portion of the
new tract of land being categorized as Level I suitability.
Half of the thirty-eight acres is categorized as Level IV suitability. The inclusion
of the 5-year floodplain and partially hydric soils is what comprises Level IV. The soils
present within this half of the tract are classified as Yancopin soils, and according to
SSURGO they are partially hydric. Yancopin soils have a 1% to 3% slope, which is
somewhat steeper than the Kobel soils. This causes more runoff of water, diminishing
the amount that is pooled on the surface as opposed to the Kobel series. More than likely
this is what leads to the Yancopin soils being categorized as only partially hydric.
Summary of Results
The breakdown among the six levels of classification yielded positive results,
with two of the six levels identifying a significant amount of the new thirty-eight acre
tract. The entire thirty-eight acres is included by either the Level I or Level IV results.
Since the suitability classifications are kept as separate results, a breakdown can be
performed to see exactly where the coverage of each level classification occurs. For
example, the Level I results for the thirty-eight acre tract can be seen separately from the
Level IV results, allowing restoration efforts to be focused in certain areas.
42
Reasons should be provided as to why the remaining levels did not have results
that intersected with the new tract. Level II produced mostly small polygons, with few
being contiguous to amount to at least ten acres. Level III’s polygons were scattered
throughout the refuge boundary, with no results being near the thirty-eight acre tract.
Level V produced a few polygons of significant size, but like Level III was not found
near the new tract. Level VI results were found mainly along the perimeter of the refuge
boundary, away from the thirty-eight acres.
Overall, MiSiL produced a set of suitability results for the entire Cache River
National Wildlife Refuge acquisition boundary. Categorizing the results into the six
classifications provides a streamlined breakdown of a potential area’s suitability.
43
Chapter 5
DISCUSSION
Application within the Environmental Division
With the Environmental division’s continuous acquisition of property to be used
as mitigation banks, the MiSiL procedure would most definitely be a useful application,
and could be implemented in various ways within the division.
One significant application would be that a realtor could e-mail a Google
Earth .kmz file to the division. This would allow the property’s boundary to be brought
directly into our GIS, and could then be analyzed via the MiSiL procedure to determine
the viability of the proposed property.
Another application is that the results of the procedure can be easily shared with
multiple staff within the division. Every computer in the Environmental Division has
some GIS capability, whether it is a license of ESRI’s ArcView or their free viewer
ArcExplorer. The output classifications of the MiSiL procedure could be provided to any
staff member working on the acquisition of property for a new mitigation bank site.
The most significant aspect of the application within the Environmental Division
is that the current procedure will be replaced with an updated methodology. Analyzing
characteristics for potential properties will no longer be performed through separate
actions, such as comparing a soil survey map alongside a topographic map. All of these
data sets will be brought into one comprehensive analysis, which will provide multiple
potential areas for a site as well as the suitability of these areas.
44
Benefits
Using MiSiL provides an analysis tool to narrow potential areas that may be
suitable for use. The Montana Department of Administration’s GIS Bureau stated, about
a procedure similar to MiSiL, that “the cost-benefit of using GIS technology in the
determination of suitable lands for wetlands mitigation is high” (Blount, 2011). By
ranking the areas that meet the criteria put forth, the location process will be much more
streamlined relative to the current system.
Another benefit of MiSiL is that it can aid in the avoidance of fragmented
wetlands, which are simply areas developed as wetlands but are small and isolated from
any other wetland area. Isolated, or “patch”, wetlands are the result of on-site
compensatory mitigation which leads to a wetland being created on the actual project site
to offset any impacts to existing wetlands, but are placed in an area that has no
connection to surrounding wetland ecosystems (Neal, 1999). MiSiL is able to provide
not only enough of a minimum acreage of a potential wetland to be used for a mitigation
bank site that it is able to support itself, but also can determine if there are any wetland
supporting factors in the surrounding area.
Limitations
In order for the MiSiL procedure to be most effective, the data being input must
be as current as possible. Any changes to the landscape of an area would affect its
involvement in the procedure. If an area that was previously agricultural became
urbanized, it would no longer be able to be considered for a potential site.

45
Another limitation could be the lack of additional data layers for the study area.
For the Cache River National Wildlife refuge the Western Lowlands provided two and
five year flood data. However, this type of information is not available at a statewide
level. Even though the base layers used in the MiSiL procedure are capable of
determining a new mitigation site, additional information would of course refine the
analysis.
46
Chapter 6
CONCLUSION
The Environmental Division at the AHTD is looking for a GIS based method of
locating potential areas for mitigation bank sites. MiSiL addresses this by providing a
locator analysis that is accomplished completely within a GIS and provides a set of
results based on suitability.
Based on the results discussed previously, MiSiL is ready for implementation
within the Environmental Division. When compared to a field tested site selected for use
as a mitigation bank, MiSiL produced suitability results that corresponded to that site.
The data layers that MiSiL uses for its analyses all combine to determine an area
that is not currently functioning as a wetland, but has the characteristics to be restored to
such. The soils data layer provides both hydric soil classifications as well as the drainage
type for each soil. The DEM depicts areas of slope that are conducive for a wetland. The
land use/land cover not only outlines areas that are not currently being used as a wetland,
such as agricultural, but also tree species that are indicative of wetland conditions.
Of course, there is always the potential of additional data for a particular area of
the state. That was the case for this study being conducted within the confines of the
Cache River National Wildlife Refuge boundary. The Western Lowlands flood plain
data provided areas prone to both two and five year flooding.
Any additional data is easily incorporated into MiSiL because of the level of
flexibility that it has when performing its analyses. MiSiL will always use certain base
layers, but can accommodate for site specific data. Even data generated by the
47
Environmental Division for a specific area can be added to the MiSiL procedure. The
addition of new data layers can also be reflected in the suitability classification levels. A
more elaborate breakdown between the varying levels can be performed with the
introduction of additional data.
MiSiL has the potential for further study. Smaller scale study areas could have
the land use/land cover updated by digitizing features from current high-resolution aerial
photography. A survey team could collect a more accurate terrain model to aid with the
hydrography analysis. MiSiL is not simply a static procedure that is only useful for the
Cache River National Wildlife Refuge, but is a dynamic analysis that can be utilized
anywhere in this state or others.
MiSiL provides something to the AHTD Environmental Division that has never
before been utilized. A locator analysis performed strictly through a GIS that is able to
take data layers specific to wetlands and provide potential viable areas for the restoration
of a wetland to be used as a mitigation bank is a major step towards streamlining within
the division.
48
Works Cited
Arkansas Geographic Information Systems Board. 2005. Digital Elevation Model
(DEM). <http://www.gis.state.ar.us/GISB/gisb.html>.
Blount, Keith. 2011. Wetland Mitigation Restoring Montana’s Wetlands. Montana
Department of Administration, Information Technology Service Division, GIS
Bureau. Helena, Montana.
<http://www.esri.com/mapmuseum/mapbook_gallery/state1/ mt1.html>.
Bullock, Andy and Mike Acreman. “The role of wetlands in the hydrological cycle.”
Hydrology and Earth System Sciences. 7. 3 (2003): 358-389.
Carpenedo, Stephen M., Elizabeth Kramer, Jason Lee, and Kevin Samples. “Using GIS
to Model the Effects of Potential Wetland Mitigation Sites on Water Quality in
Georgia.” Proceedings of the 2007 Georgia Water Resources Conference.
University of Georgia, March 2007.
Center for Advanced Spatial Technologies (CAST) and Multi-Agency Wetland Planning
Team (MAWPT). 2012. The Standard GIS Methodology for Wetland Analysis.
<http://cast. uark.edu/home/research/environmental-studies/analysis-of-arkansas-
wetland-planning-areas.html>.
Cowardin, Lewis M., Virginia Carter, Francis C. Golet, and Edward T. LaRoe. 1979.
Classification of Wetlands and Deepwater Habitats of the United States. U.S.
Department of the Interior, Fish and Wildlife Service, Washington D.C.
Jamestown, ND: Northern Prairie Wildlife Research Center Online.
<http://www.npwrc.usgs.gov/ resource/wetlands/classwet/index.htm>.

49
Environmental Protection Agency. “Federal Guidance for the Establishment, Use and
Operation of Mitigation Banks.” Federal Register 60. 228 (1995).
Environmental Protection Agency. 2012. Summary of the Clean Water Act.
Washington D.C. <http://www.epa.gov/lawsregs/laws/cwa.html>.
Gorham, Bruce. “Mapping the ever-changing landscape: Lessons from the Arkansas
land-use/land-cover mapping project.” RGIS Innovator (November 2007).
Distributed by the National Consortium for Rural Geospatial Innovations.
Haggard, B.E., P.A. Moore, Jr., and K.R. Brye. “Effects of Slope on Runoff from a
Small Variable Slope Box-Plot.” Journal of Environmental Hydrology 13, 25.
(2005)
Mitsch, William J., and James G. Gosselink. Wetlands 3rd
ed. New York: John Wiley
& Sons Inc., 2000.
Natural Resources Conservation Services. 2012. Soil Survey Geographic (SSURGO).
<http://soils.usda.gov/>.
Neal, Jennifer. Paving the Road to Wetlands Mitigation Banking. 27 B.C. Envtl. Aff. L.
Rev. 161 (1999). <http://lawdigitalcommons.bc.edu/ealr/vol27/iss1/6>.
Store, Ron and Jukka Jokimäki. “A GIS-based multi-scale approach to habitat
suitability modeling.” Ecological Modeling 169 (2003): 1-15.
Tiner, R.W. (compiler). 2002. Watershed-based Wetland Planning and Evaluation. A
Collection of Papers from the Wetland Millennium Event. (August 6-12, 2000;
Quebec City, Quebec, Canada). Distributed by the Association of State Wetland
Managers, Inc., Berne, NY. 141 pp.
50
U.S. Army Corps of Engineers. 1987. Corps of Engineers Wetlands Delineation
Manual. U.S. Department of Defense, Washington D.C.
<http://www.wetlands.com/regs/tlpge02e. htm>.
U.S. Army Corps. of Engineers and EPA. “Compensatory Mitigation for Losses of
Aquatic Resources.” Federal Register 73. 70. (2008): 19594-19705.
U.S. Fish and Wildlife Service. 2011. Clean Water Act Section 404. Department of the
Interior, Washington D.C. <http://www.fws.gov/habitatconservation/cwa.htm>.
U.S. Fish and Wildlife Service. 2011. National Wetlands Inventory (NWI).
<www.fws.gov/wetlands/Data/index.html>.
Van Lonkhuyzen, Robert A., Kirk E. Lagory, and James A. Kuiper. “Modeling the
Suitability of Potential Wetland Mitigation Sites with a Geographic Information
System.” Environmental Management 33. 3 (2004): 368-375.
WSDOT. SRXX: Happy St. Vicinity to Golucky Way (XL1111) Phase II Mitigation Site
Wetland Delineation. Technical Memo Example to the Washington State
Department of Transportation, Olympia, WA.
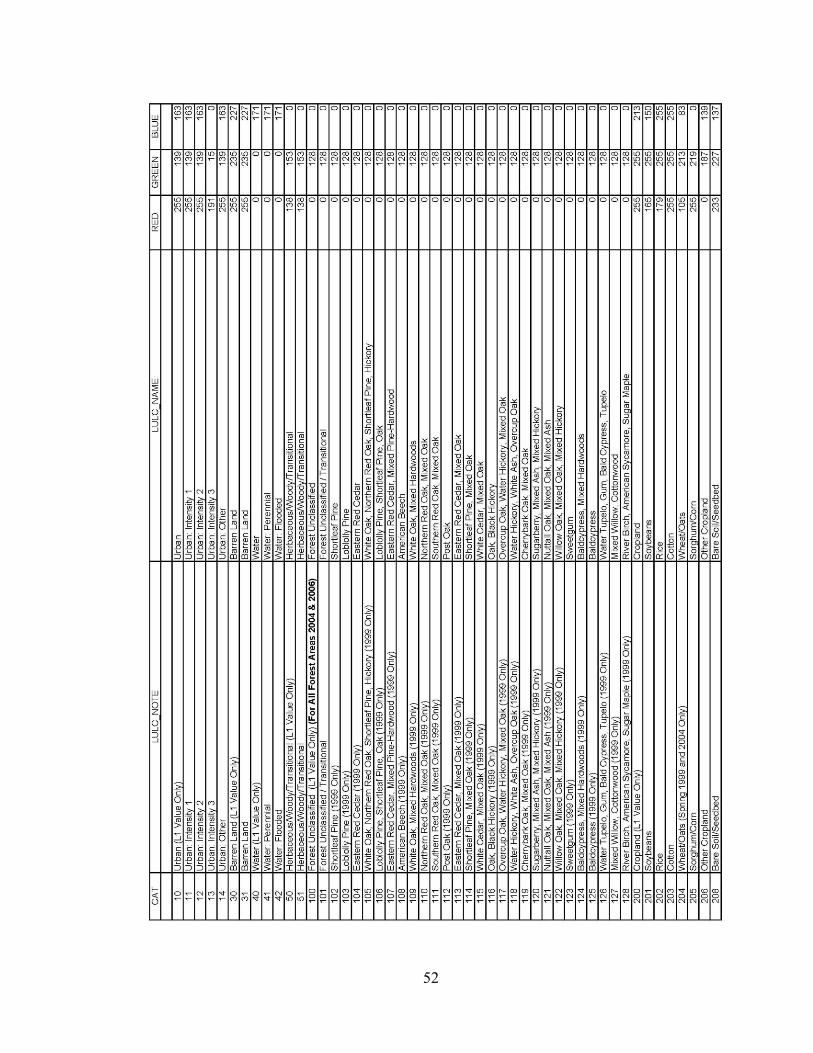
APPENDIX:
LAND USE/LAND COVER VALUES
A land use/land cover values table was provided along with the raster files from Bruce
Gorham from CAST. Specific values were extracted from this table to be used in this
study, but an overview of all the available values are provided in the table.
52

53