Local Government Finances - LGNSWlgnsw.org.au/files/imce-uploads/206/6.1 David Rawlings -...
19
Local Government Finances David Rawlings
Transcript of Local Government Finances - LGNSWlgnsw.org.au/files/imce-uploads/206/6.1 David Rawlings -...
Powerpoint Templates Powerpoint Templates
Local Government Finances David Rawlings
Powerpoint Templates
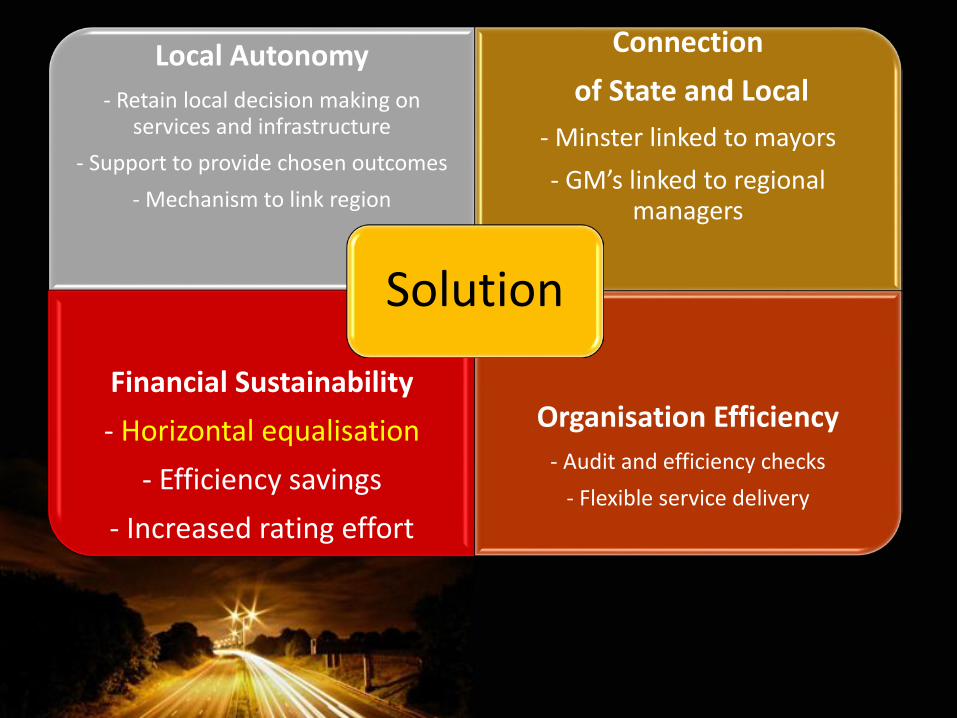
Local Autonomy - Retain local decision making on
services and infrastructure - Support to provide chosen outcomes
- Mechanism to link region
Connection of State and Local
- Minster linked to mayors - GM’s linked to regional
managers
Financial Sustainability - Horizontal equalisation
- Efficiency savings - Increased rating effort
Organisation Efficiency - Audit and efficiency checks
- Flexible service delivery
Solution
Powerpoint Templates Powerpoint Templates
DO WE REALLY KNOW THE PROBLEM?

Powerpoint Templates
Calculating Optimal Maintenance
R² = 0.5946
0
10
20
30
40
50
60
70
0 2,000 4,000 6,000 8,000 10,000
Mill
ions
Millions

Powerpoint Templates
What level should maintenance be at?
0.00%
0.20%
0.40%
0.60%
0.80%
1.00%
1.20%
1.40%
1.60%
1.80%
Metropolitan MetropolitanFringe
RegionalTown/City
Rural Large Rural Small
Powerpoint Templates
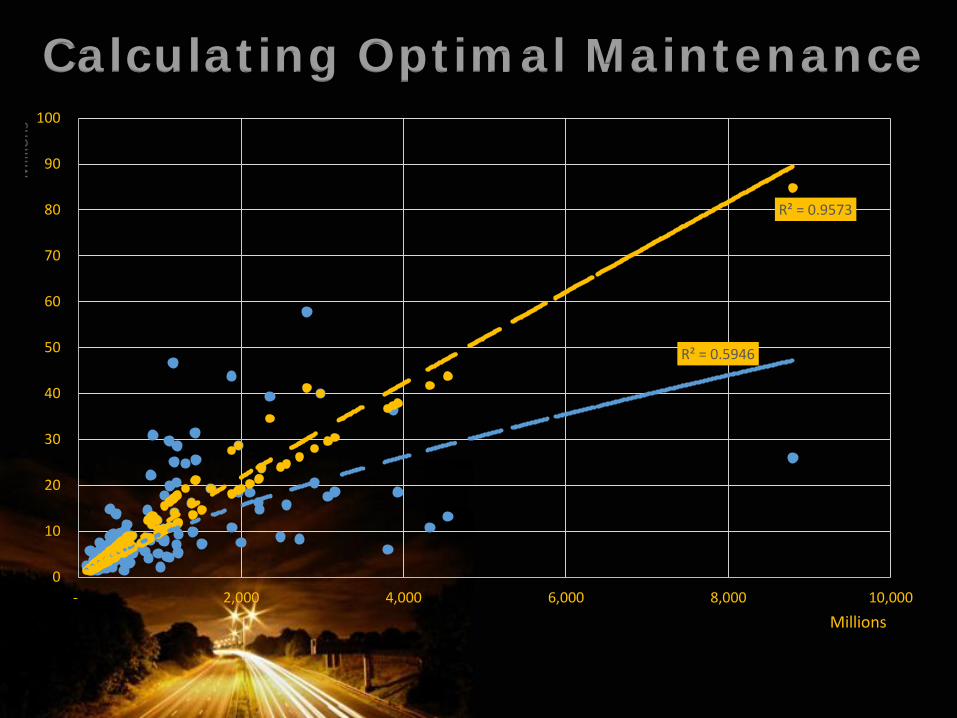
Calculating Optimal Maintenance
R² = 0.5946
R² = 0.9573
0
10
20
30
40
50
60
70
80
90
100
- 2,000 4,000 6,000 8,000 10,000
Mill
ions
Millions

Powerpoint Templates
Depreciation V Asset Value:
R² = 0.8272
0
100,000
200,000
300,000
400,000
500,000
600,000
- 1 2 3 4 5 6 7 8 9 10
Millions

Powerpoint Templates
Depreciation V Asset Value:
R² = 0.9063
0
10,000
20,000
30,000
40,000
50,000
60,000
70,000
0.0 0.5 1.0 1.5 2.0 2.5 3.0 3.5 4.0 4.5
Millions

Powerpoint Templates
Impact of analysis
81
26
0%
10%
20%
30%
40%
50%
60%
70%
80%
90%
100%
Operating PerformanceRatio
Actual
Positive Negative

Powerpoint Templates
Impact of analysis
81
26 39
0%
10%
20%
30%
40%
50%
60%
70%
80%
90%
100%
Operating PerformanceRatio
Actual Modified
Positive Negative

Powerpoint Templates Powerpoint Templates
WHAT ARE WE TRYING TO ACHIEVE?

Powerpoint Templates
Results from Model
-12.72%
-30.73%
-10.73%
-51.50%
-26.40%
-60.00%
-50.00%
-40.00%
-30.00%
-20.00%
-10.00%
0.00%
10.00%
2014 2015 2016 2017 2018 2019 2020 2021 2022 2023

Powerpoint Templates
Impact of Fixing Horizontal Disadvantage
81
26 38
9
0%
10%
20%
30%
40%
50%
60%
70%
80%
90%
100%
OperatingPerformance Ratio
Actual Modified After Equalisation
Positive Negative

Powerpoint Templates Powerpoint Templates
CAN WE ACHIEVE HORIZONTAL
EQUALISATION?

Powerpoint Templates
Can we achieve Horizontal Equalisation?
• Work as an industry • Industry Research and Development • Develop service level list that is state wide based to
underpin funding • FAG calculated around efficient service delivery • Adopt innovative service delivery models
Powerpoint Templates
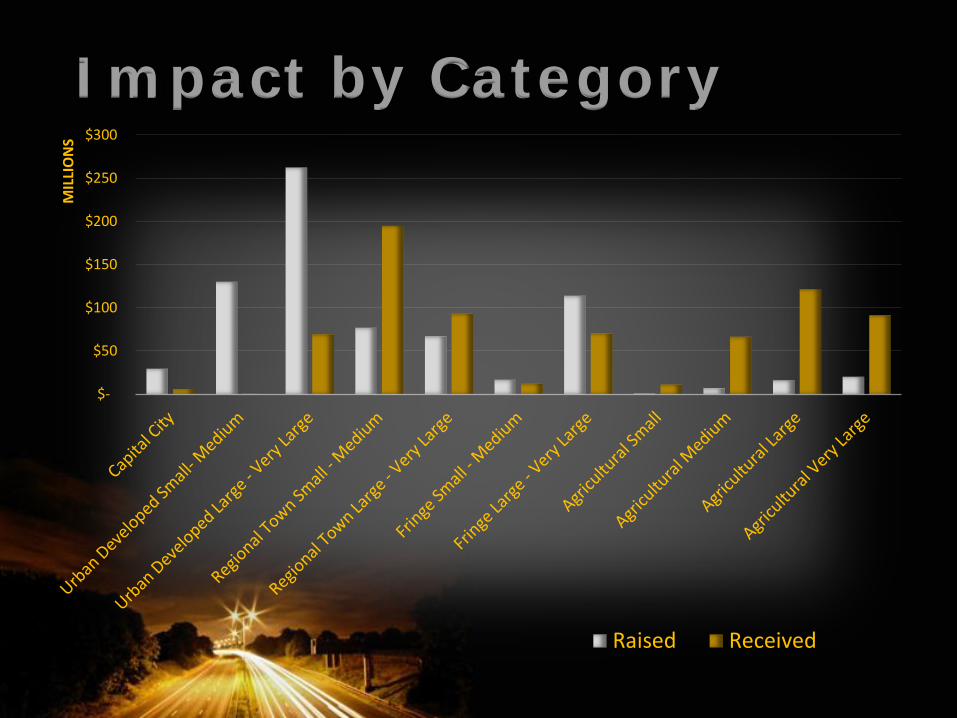
Impact by Category
$-
$50
$100
$150
$200
$250
$300
MIL
LIO
NS
Raised Received
Powerpoint Templates
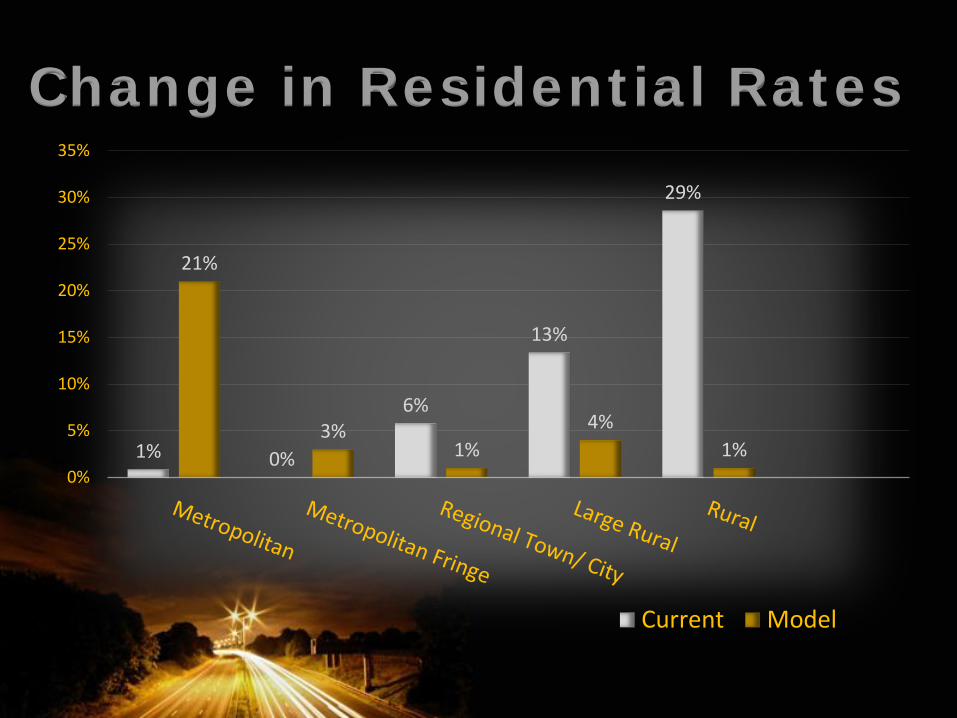
Change in Residential Rates
1% 0%
6%
13%
29%
21%
3% 1%
4% 1%
0%
5%
10%
15%
20%
25%
30%
35%
Current Model
Powerpoint Templates Powerpoint Templates
DO WE WANT TO ACHIEVE HORIZONTAL
EQUALISATION?

Powerpoint Templates
Residential Rates v Income
1.65%
2.23% 2.45%
1.95%
1.28%
1.97%
2.30% 2.35%
1.77%
1.02%
0.00%
0.50%
1.00%
1.50%
2.00%
2.50%
3.00%
Current Model