Local and Regional Contributions to Fine Particle...
14
Aerosol and Air Quality Research, 16: 1067–1080, 2016 Copyright © Taiwan Association for Aerosol Research ISSN: 1680-8584 print / 2071-1409 online doi: 10.4209/aaqr.2015.08.0496 Local and Regional Contributions to Fine Particle Pollution in Winter of the Yangtze River Delta, China Xiao Fu 1 , Zhen Cheng 2 , Shuxiao Wang 1,3* , Yang Hua 1 , Jia Xing 4 , Jiming Hao 1,3 1 State Key Joint Laboratory of Environment Simulation and Pollution Control, School of Environment, Tsinghua University, Beijing 100084, China 2 School of Environmental Science and Engineering, Shanghai Jiao Tong University, Shanghai 200240, China 3 State Environmental Protection Key Laboratory of Sources and Control of Air Pollution Complex, Beijing 100084, China 4 US Environmental Protection Agency, Research Triangle Park, NC, USA ABSTRACT The Yangtze River Delta (YRD) is one of the most developed and heavily polluted regions in China. Understanding the origin of fine particles is necessary for policy making on air pollution control in this region. However, the current studies on quantifying the contributions from different emission source regions are limited, especially for winter pollution. In this study, field observations and scenario analysis simulations were performed by using the Weather Research and Forecasting and Community Multi-scale Air Quality (WRF/CMAQ) model to quantify the impacts of local emissions and long-range regional transport in a winter period of 2011. The results indicated that the local contributions were dominant on average in the whole period, especially for slight or medium pollution hours. However, when particle pollution increased, the effects of long-range regional transport significantly increased. The inner-regional effects from Jiangsu and the outer- regional effects from the upwind adjacent province, Shandong, are crucial for the YRD region. The dominant contributor could be local accumulation or long-range regional transport, which usually depends on the weather conditions. This study provides a systematic analysis of the characteristics and origins of winter pollution in the YRD according to combined observations and modeling, which is helpful for understanding regional particle pollution formation and policy making on improving air quality in this region. Keywords: Fine particle pollution; YRD; Local accumulation; Regional contribution. INTRODUCTION Fine particle (PM 2.5 ) pollution in China is becoming increasingly severe because of rapid economic development as well as the rapid growth of vehicles population and energy consumption, and has been one of the most widely studied topics in recent years (Che et al., 2007; Fu et al., 2008; Wu et al., 2010; Fu et al., 2013a; Liu et al., 2013; Zheng et al., 2015). A large amount of particles suspending in the atmosphere is harmful to human health, visibility, the climate, and agriculture (Chameides et al., 1999; Quinn et al., 2003; Tie et al., 2009; Pope et al., 2011; Pui et al., 2014). To reduce particle concentration and improve air quality, the Chinese government issued new air quality standards in 2012 (http://kjs.mep.gov.cn/hjbhbz/bzwb/dqhjbh/dqhjzlbz/2012 03/t20120302_224165.htm), which included limits for * Corresponding author. Tel.: +86-10-62771466; Fax: +86-10-62773650 E-mail address: [email protected] PM 2.5 concentration for the first time. The limits, which are 35 μg m –3 for annual average concentration and 75 μg m –3 for daily average concentration, pose a challenge for many cities in China. The YRD is located in eastern China, which includes Shanghai as well as Jiangsu and Zhejiang provinces. It is one of the most developed and heavily polluted regions in China. In 2010, the emissions of SO 2 , NO x , PM 10 , PM 2.5 , NMVOC and NH 3 in the YRD region were 8.8%, 10.7%, 6.4%, 5.5%, 16.7%, and 7.9%, respectively, of those in China (Fu et al., 2013b; Zhao et al., 2013). A long-term monitoring data suggested that visibility declined 0.24 km per year during 1980–2010, and the number of hazy days in Nanjing, Hangzhou, and Suzhou increased from approximately 40, 50, and 20, respectively, in the 1980s to 140, 160, and 70 after 2001 (Che et al., 2009; Gao et al., 2011; Cheng et al., 2013). Many pollution events with high fine particle concentrations were reported and analyzed for this region in previous studies (Huang et al., 2012; Kang et al., 2013; Cheng et al., 2014; Fu et al., 2014; Gao et al., 2014). Aerosol pollution loading peaks and pollution occurs most frequently in winter (Cheng et al., 2013). During 2004–2008, the average visibility in
Transcript of Local and Regional Contributions to Fine Particle...
Aerosol and Air Quality Research, 16: 1067–1080, 2016 Copyright © Taiwan Association for Aerosol Research ISSN: 1680-8584 print / 2071-1409 online doi: 10.4209/aaqr.2015.08.0496 Local and Regional Contributions to Fine Particle Pollution in Winter of the Yangtze River Delta, China Xiao Fu1, Zhen Cheng2, Shuxiao Wang1,3*, Yang Hua1, Jia Xing4, Jiming Hao1,3 1 State Key Joint Laboratory of Environment Simulation and Pollution Control, School of Environment, Tsinghua University, Beijing 100084, China 2 School of Environmental Science and Engineering, Shanghai Jiao Tong University, Shanghai 200240, China 3 State Environmental Protection Key Laboratory of Sources and Control of Air Pollution Complex, Beijing 100084, China 4 US Environmental Protection Agency, Research Triangle Park, NC, USA ABSTRACT
The Yangtze River Delta (YRD) is one of the most developed and heavily polluted regions in China. Understanding the origin of fine particles is necessary for policy making on air pollution control in this region. However, the current studies on quantifying the contributions from different emission source regions are limited, especially for winter pollution. In this study, field observations and scenario analysis simulations were performed by using the Weather Research and Forecasting and Community Multi-scale Air Quality (WRF/CMAQ) model to quantify the impacts of local emissions and long-range regional transport in a winter period of 2011. The results indicated that the local contributions were dominant on average in the whole period, especially for slight or medium pollution hours. However, when particle pollution increased, the effects of long-range regional transport significantly increased. The inner-regional effects from Jiangsu and the outer-regional effects from the upwind adjacent province, Shandong, are crucial for the YRD region. The dominant contributor could be local accumulation or long-range regional transport, which usually depends on the weather conditions. This study provides a systematic analysis of the characteristics and origins of winter pollution in the YRD according to combined observations and modeling, which is helpful for understanding regional particle pollution formation and policy making on improving air quality in this region. Keywords: Fine particle pollution; YRD; Local accumulation; Regional contribution.
INTRODUCTION
Fine particle (PM2.5) pollution in China is becoming increasingly severe because of rapid economic development as well as the rapid growth of vehicles population and energy consumption, and has been one of the most widely studied topics in recent years (Che et al., 2007; Fu et al., 2008; Wu et al., 2010; Fu et al., 2013a; Liu et al., 2013; Zheng et al., 2015). A large amount of particles suspending in the atmosphere is harmful to human health, visibility, the climate, and agriculture (Chameides et al., 1999; Quinn et al., 2003; Tie et al., 2009; Pope et al., 2011; Pui et al., 2014). To reduce particle concentration and improve air quality, the Chinese government issued new air quality standards in 2012 (http://kjs.mep.gov.cn/hjbhbz/bzwb/dqhjbh/dqhjzlbz/201203/t20120302_224165.htm), which included limits for * Corresponding author.
Tel.: +86-10-62771466; Fax: +86-10-62773650 E-mail address: [email protected]
PM2.5 concentration for the first time. The limits, which are 35 µg m–3 for annual average concentration and 75 µg m–3 for daily average concentration, pose a challenge for many cities in China.
The YRD is located in eastern China, which includes Shanghai as well as Jiangsu and Zhejiang provinces. It is one of the most developed and heavily polluted regions in China. In 2010, the emissions of SO2, NOx, PM10, PM2.5, NMVOC and NH3 in the YRD region were 8.8%, 10.7%, 6.4%, 5.5%, 16.7%, and 7.9%, respectively, of those in China (Fu et al., 2013b; Zhao et al., 2013). A long-term monitoring data suggested that visibility declined 0.24 km per year during 1980–2010, and the number of hazy days in Nanjing, Hangzhou, and Suzhou increased from approximately 40, 50, and 20, respectively, in the 1980s to 140, 160, and 70 after 2001 (Che et al., 2009; Gao et al., 2011; Cheng et al., 2013). Many pollution events with high fine particle concentrations were reported and analyzed for this region in previous studies (Huang et al., 2012; Kang et al., 2013; Cheng et al., 2014; Fu et al., 2014; Gao et al., 2014). Aerosol pollution loading peaks and pollution occurs most frequently in winter (Cheng et al., 2013). During 2004–2008, the average visibility in
Fu et al., Aerosol and Air Quality Research, 16: 1067–1080, 2016 1068
winter was 6.5 km, which was 1.1–1.9 km less than that in the other seasons (Lin et al., 2014).
Pollution events in winter are usually associated with specific weather conditions rather than specific emission sources such as biomass burning or photochemical reactions. In general, local accumulation and regional transport are two major formation mechanisms for winter pollution; which of these is dominant depends on weather conditions. On the basis of the field measurements, Zhou et al. (2013) investigated the characteristics of a severe pollution event in January 2013 in Shanghai, a city in the YRD. The authors demonstrated that strong temperature inversion and low wind speed caused the local accumulation of fine particles. Similar weather conditions and formation mechanism were identified for another pollution event in December 2013 (Wang et al., 2015). However, these studies were mostly based on limited observation data and provided qualitative analysis rather than quantitative results. In addition, Wang et al. (2008) confirmed that the northwest wind prevailed in the YRD region in winter. Because the YRD region is downwind of the North China Plain (NCP), the most polluted region in China, the effects of long-range transport cannot be ignored. Wang et al. (2014) and Kang et al. (2013) affirmed the importance of regional and long-range regional transport on air quality during autumn in Shanghai and Nanjing. However, few studies focus on quantifying local and regional contributions in winter. Moreover, most such studies have been limited to one city rather than the entire YRD region.
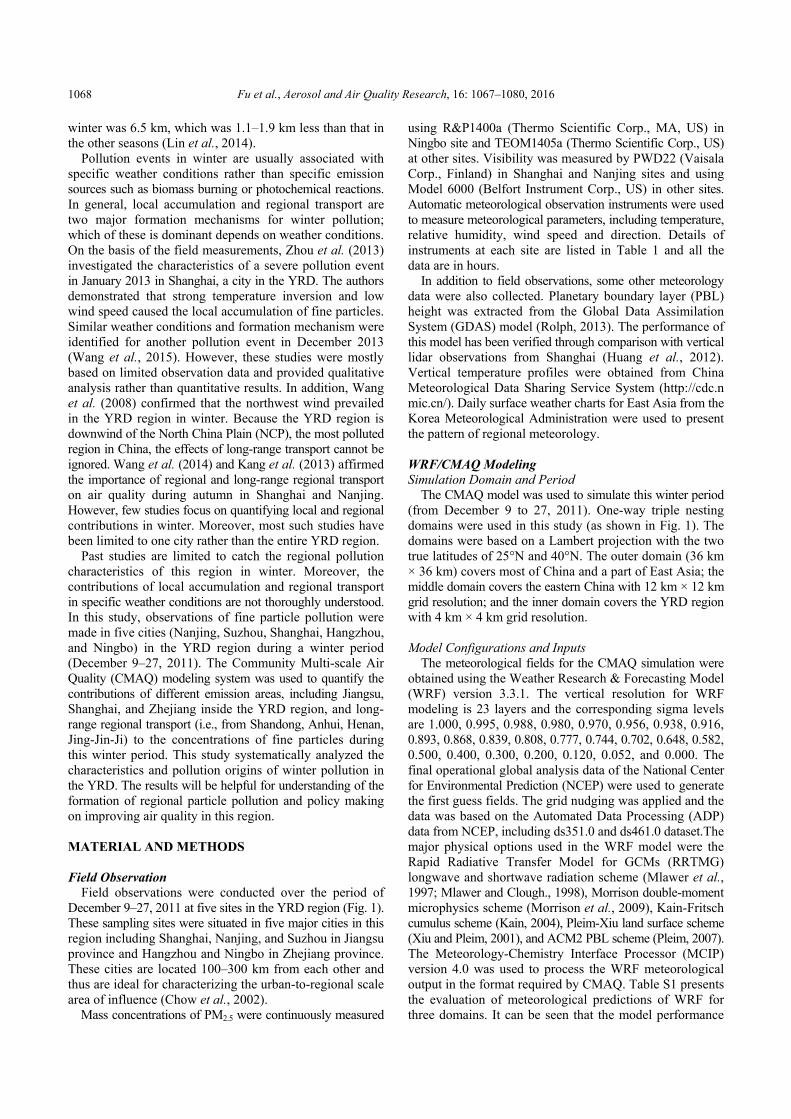
Past studies are limited to catch the regional pollution characteristics of this region in winter. Moreover, the contributions of local accumulation and regional transport in specific weather conditions are not thoroughly understood. In this study, observations of fine particle pollution were made in five cities (Nanjing, Suzhou, Shanghai, Hangzhou, and Ningbo) in the YRD region during a winter period (December 9–27, 2011). The Community Multi-scale Air Quality (CMAQ) modeling system was used to quantify the contributions of different emission areas, including Jiangsu, Shanghai, and Zhejiang inside the YRD region, and long-range regional transport (i.e., from Shandong, Anhui, Henan, Jing-Jin-Ji) to the concentrations of fine particles during this winter period. This study systematically analyzed the characteristics and pollution origins of winter pollution in the YRD. The results will be helpful for understanding of the formation of regional particle pollution and policy making on improving air quality in this region. MATERIAL AND METHODS Field Observation
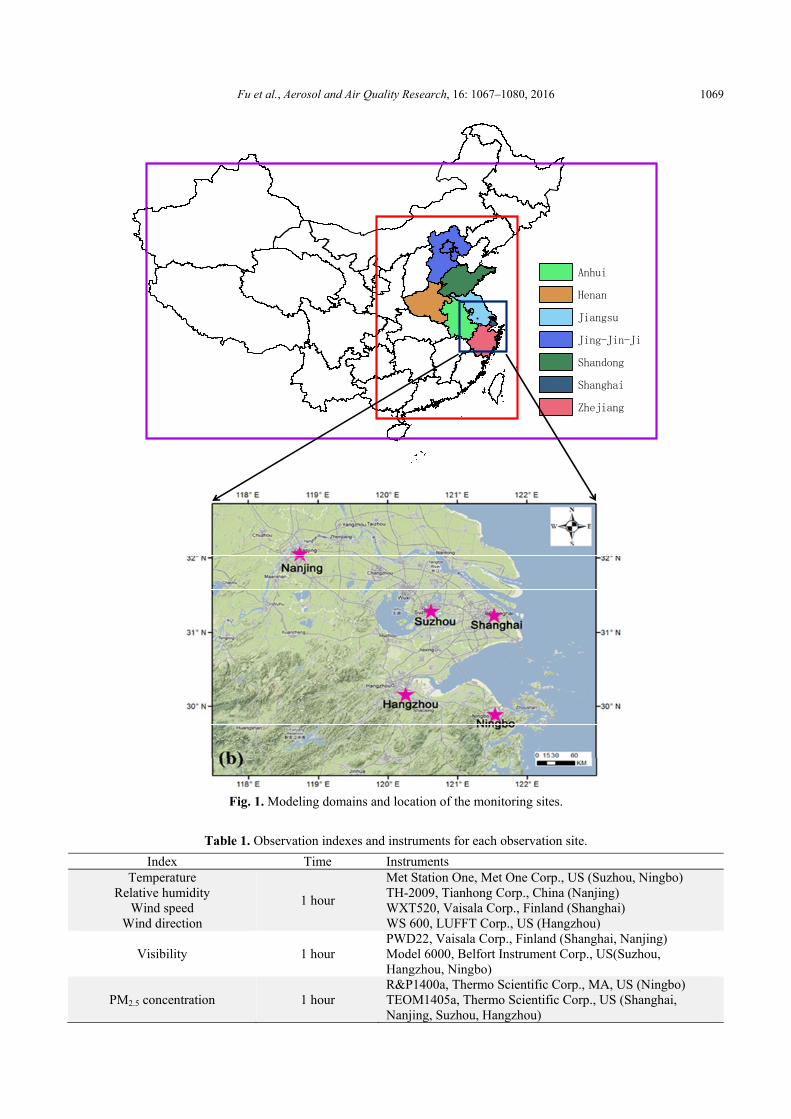
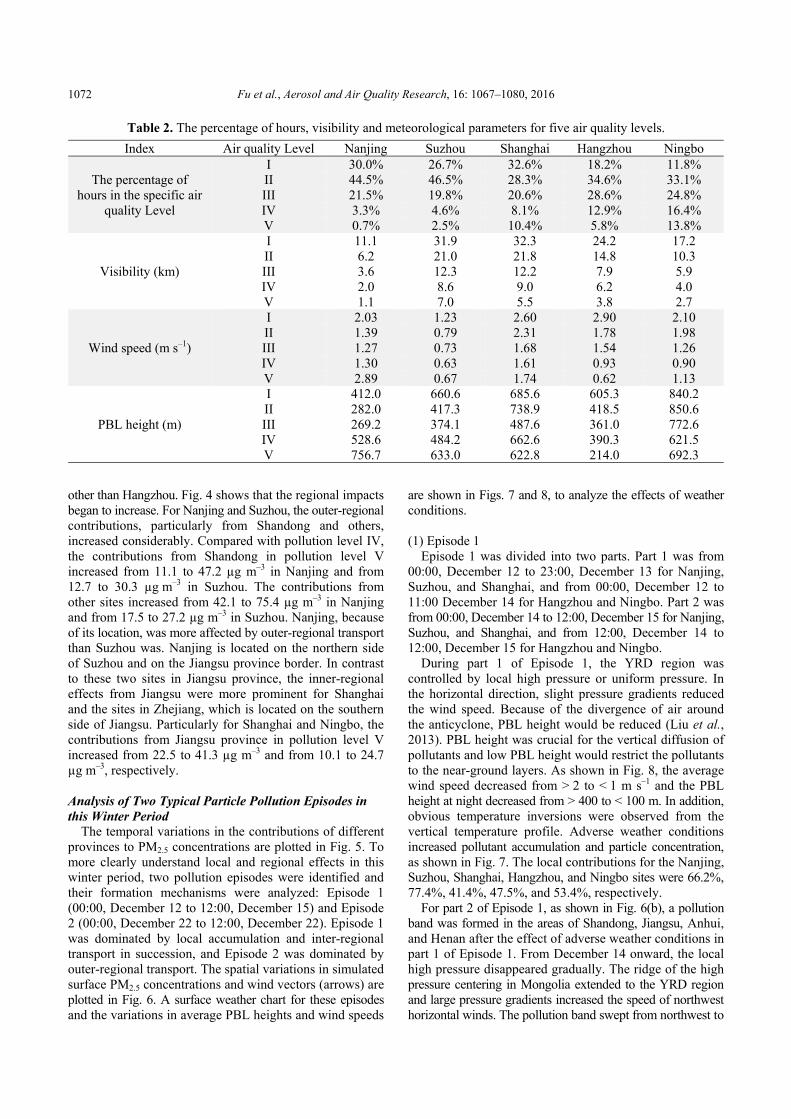
Field observations were conducted over the period of December 9–27, 2011 at five sites in the YRD region (Fig. 1). These sampling sites were situated in five major cities in this region including Shanghai, Nanjing, and Suzhou in Jiangsu province and Hangzhou and Ningbo in Zhejiang province. These cities are located 100–300 km from each other and thus are ideal for characterizing the urban-to-regional scale area of influence (Chow et al., 2002).
Mass concentrations of PM2.5 were continuously measured
using R&P1400a (Thermo Scientific Corp., MA, US) in Ningbo site and TEOM1405a (Thermo Scientific Corp., US) at other sites. Visibility was measured by PWD22 (Vaisala Corp., Finland) in Shanghai and Nanjing sites and using Model 6000 (Belfort Instrument Corp., US) in other sites. Automatic meteorological observation instruments were used to measure meteorological parameters, including temperature, relative humidity, wind speed and direction. Details of instruments at each site are listed in Table 1 and all the data are in hours.
In addition to field observations, some other meteorology data were also collected. Planetary boundary layer (PBL) height was extracted from the Global Data Assimilation System (GDAS) model (Rolph, 2013). The performance of this model has been verified through comparison with vertical lidar observations from Shanghai (Huang et al., 2012). Vertical temperature profiles were obtained from China Meteorological Data Sharing Service System (http://cdc.n mic.cn/). Daily surface weather charts for East Asia from the Korea Meteorological Administration were used to present the pattern of regional meteorology.
WRF/CMAQ Modeling Simulation Domain and Period
The CMAQ model was used to simulate this winter period (from December 9 to 27, 2011). One-way triple nesting domains were used in this study (as shown in Fig. 1). The domains were based on a Lambert projection with the two true latitudes of 25°N and 40°N. The outer domain (36 km × 36 km) covers most of China and a part of East Asia; the middle domain covers the eastern China with 12 km × 12 km grid resolution; and the inner domain covers the YRD region with 4 km × 4 km grid resolution.
Model Configurations and Inputs
The meteorological fields for the CMAQ simulation were obtained using the Weather Research & Forecasting Model (WRF) version 3.3.1. The vertical resolution for WRF modeling is 23 layers and the corresponding sigma levels are 1.000, 0.995, 0.988, 0.980, 0.970, 0.956, 0.938, 0.916, 0.893, 0.868, 0.839, 0.808, 0.777, 0.744, 0.702, 0.648, 0.582, 0.500, 0.400, 0.300, 0.200, 0.120, 0.052, and 0.000. The final operational global analysis data of the National Center for Environmental Prediction (NCEP) were used to generate the first guess fields. The grid nudging was applied and the data was based on the Automated Data Processing (ADP) data from NCEP, including ds351.0 and ds461.0 dataset.The major physical options used in the WRF model were the Rapid Radiative Transfer Model for GCMs (RRTMG) longwave and shortwave radiation scheme (Mlawer et al., 1997; Mlawer and Clough., 1998), Morrison double-moment microphysics scheme (Morrison et al., 2009), Kain-Fritsch cumulus scheme (Kain, 2004), Pleim-Xiu land surface scheme (Xiu and Pleim, 2001), and ACM2 PBL scheme (Pleim, 2007). The Meteorology-Chemistry Interface Processor (MCIP) version 4.0 was used to process the WRF meteorological output in the format required by CMAQ. Table S1 presents the evaluation of meteorological predictions of WRF for three domains. It can be seen that the model performance
Fu et al., Aerosol and Air Quality Research, 16: 1067–1080, 2016 1069
Anhui
Henan
Jiangsu
Jing-Jin-Ji
Shandong
Shanghai
Zhejiang
Fig. 1. Modeling domains and location of the monitoring sites.
Table 1. Observation indexes and instruments for each observation site.
Index Time Instruments Temperature
Relative humidity Wind speed
Wind direction
1 hour
Met Station One, Met One Corp., US (Suzhou, Ningbo) TH-2009, Tianhong Corp., China (Nanjing) WXT520, Vaisala Corp., Finland (Shanghai) WS 600, LUFFT Corp., US (Hangzhou)
Visibility 1 hour PWD22, Vaisala Corp., Finland (Shanghai, Nanjing) Model 6000, Belfort Instrument Corp., US(Suzhou, Hangzhou, Ningbo)
PM2.5 concentration 1 hour R&P1400a, Thermo Scientific Corp., MA, US (Ningbo) TEOM1405a, Thermo Scientific Corp., US (Shanghai, Nanjing, Suzhou, Hangzhou)
Fu et al., Aerosol and Air Quality Research, 16: 1067–1080, 2016 1070
is reasonably acceptable. The CMAQ version 4.7.1 was used in this study. The
vertical resolution is 14 layers and the corresponding sigma levels are 1.000, 0.995, 0.990, 0.980, 0.960, 0.940, 0.910, 0.860, 0.800, 0.740, 0.650, 0.550, 0.400, 0.200, and 0.000. The CB05 chemical mechanism and the AERO5 model were used for the gas-phase chemistry and aerosol modules, respectively. These options were chosen and evaluated in other studies (Streets et al., 2007; Wang et al., 2011a; Zhao et al., 2013).
A coupled anthropogenic emission inventory was generated from the study of Fu et al. (2013b) for the YRD region and that of Zhao et al. (2013) for the whole of China. This inventory was used and evaluated for the same domain in other episodes (Cheng et al., 2014; Fu et al., 2014). Natural biogenic emissions were generated using the Model of Emissions of Gases and Aerosols from Nature (MEGAN) (Guenther et al., 2006).
Scenarios and Contribution Analysis
Scenarios analysis simulations were performed to quantify the pollution contributions from different regions. These analyzed regions included Shanghai, Jiangsu, Zhejiang, Anhui, Shandong, Henan, Jing-Jin-Ji (Beijing-Tianjin-Hebei) and others representing all remaining parts in domain1, which are shown in Fig. 1. The contribution from one region was calculated by the differences between the base case and the zero-out case with no anthropogenic emissions in that region. This methodology has been used in previous studies (Streets et al., 2007; Wang et al., 2012). RESULTS AND DISCUSSION Observed PM2.5 Mass Concentration
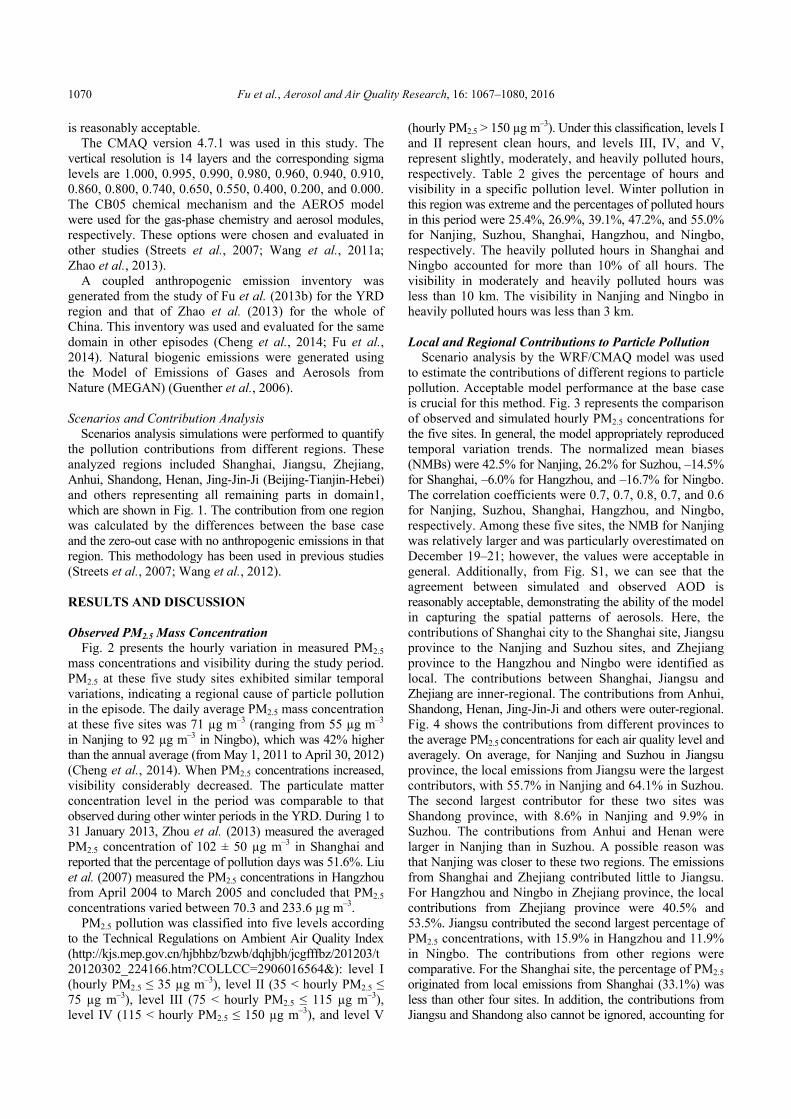
Fig. 2 presents the hourly variation in measured PM2.5 mass concentrations and visibility during the study period. PM2.5 at these five study sites exhibited similar temporal variations, indicating a regional cause of particle pollution in the episode. The daily average PM2.5 mass concentration at these five sites was 71 µg m–3 (ranging from 55 µg m–3 in Nanjing to 92 µg m–3 in Ningbo), which was 42% higher than the annual average (from May 1, 2011 to April 30, 2012) (Cheng et al., 2014). When PM2.5 concentrations increased, visibility considerably decreased. The particulate matter concentration level in the period was comparable to that observed during other winter periods in the YRD. During 1 to 31 January 2013, Zhou et al. (2013) measured the averaged PM2.5 concentration of 102 ± 50 µg m–3 in Shanghai and reported that the percentage of pollution days was 51.6%. Liu et al. (2007) measured the PM2.5 concentrations in Hangzhou from April 2004 to March 2005 and concluded that PM2.5
concentrations varied between 70.3 and 233.6 µg m–3. PM2.5 pollution was classified into five levels according
to the Technical Regulations on Ambient Air Quality Index (http://kjs.mep.gov.cn/hjbhbz/bzwb/dqhjbh/jcgfffbz/201203/t20120302_224166.htm?COLLCC=2906016564&): level I (hourly PM2.5 ≤ 35 µg m–3), level II (35 < hourly PM2.5 ≤ 75 µg m–3), level III (75 < hourly PM2.5 ≤ 115 µg m–3), level IV (115 < hourly PM2.5 ≤ 150 µg m–3), and level V
(hourly PM2.5 > 150 µg m–3). Under this classification, levels I and II represent clean hours, and levels III, IV, and V, represent slightly, moderately, and heavily polluted hours, respectively. Table 2 gives the percentage of hours and visibility in a specific pollution level. Winter pollution in this region was extreme and the percentages of polluted hours in this period were 25.4%, 26.9%, 39.1%, 47.2%, and 55.0% for Nanjing, Suzhou, Shanghai, Hangzhou, and Ningbo, respectively. The heavily polluted hours in Shanghai and Ningbo accounted for more than 10% of all hours. The visibility in moderately and heavily polluted hours was less than 10 km. The visibility in Nanjing and Ningbo in heavily polluted hours was less than 3 km.
Local and Regional Contributions to Particle Pollution
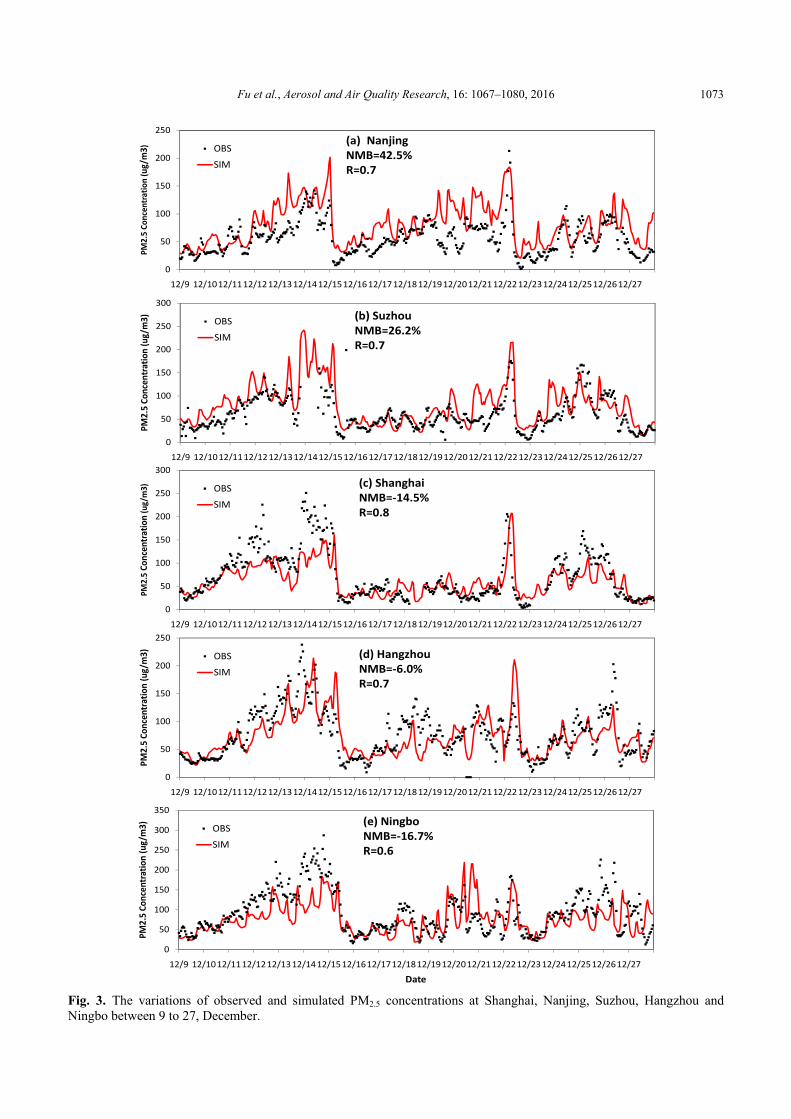
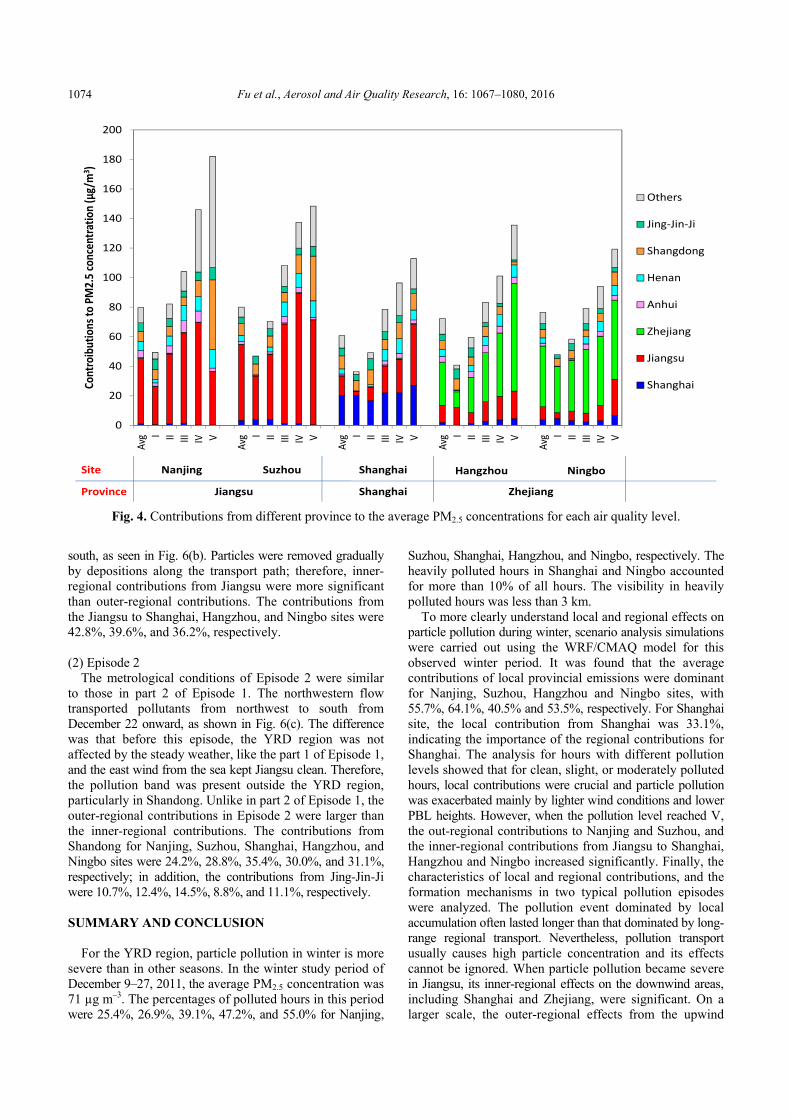
Scenario analysis by the WRF/CMAQ model was used to estimate the contributions of different regions to particle pollution. Acceptable model performance at the base case is crucial for this method. Fig. 3 represents the comparison of observed and simulated hourly PM2.5 concentrations for the five sites. In general, the model appropriately reproduced temporal variation trends. The normalized mean biases (NMBs) were 42.5% for Nanjing, 26.2% for Suzhou, –14.5% for Shanghai, –6.0% for Hangzhou, and –16.7% for Ningbo. The correlation coefficients were 0.7, 0.7, 0.8, 0.7, and 0.6 for Nanjing, Suzhou, Shanghai, Hangzhou, and Ningbo, respectively. Among these five sites, the NMB for Nanjing was relatively larger and was particularly overestimated on December 19–21; however, the values were acceptable in general. Additionally, from Fig. S1, we can see that the agreement between simulated and observed AOD is reasonably acceptable, demonstrating the ability of the model in capturing the spatial patterns of aerosols. Here, the contributions of Shanghai city to the Shanghai site, Jiangsu province to the Nanjing and Suzhou sites, and Zhejiang province to the Hangzhou and Ningbo were identified as local. The contributions between Shanghai, Jiangsu and Zhejiang are inner-regional. The contributions from Anhui, Shandong, Henan, Jing-Jin-Ji and others were outer-regional. Fig. 4 shows the contributions from different provinces to the average PM2.5 concentrations for each air quality level and averagely. On average, for Nanjing and Suzhou in Jiangsu province, the local emissions from Jiangsu were the largest contributors, with 55.7% in Nanjing and 64.1% in Suzhou. The second largest contributor for these two sites was Shandong province, with 8.6% in Nanjing and 9.9% in Suzhou. The contributions from Anhui and Henan were larger in Nanjing than in Suzhou. A possible reason was that Nanjing was closer to these two regions. The emissions from Shanghai and Zhejiang contributed little to Jiangsu. For Hangzhou and Ningbo in Zhejiang province, the local contributions from Zhejiang province were 40.5% and 53.5%. Jiangsu contributed the second largest percentage of PM2.5 concentrations, with 15.9% in Hangzhou and 11.9% in Ningbo. The contributions from other regions were comparative. For the Shanghai site, the percentage of PM2.5
originated from local emissions from Shanghai (33.1%) was less than other four sites. In addition, the contributions from Jiangsu and Shandong also cannot be ignored, accounting for
Fu et al., Aerosol and Air Quality Research, 16: 1067–1080, 2016 1071
0
5
10
15
20
25
0
50
100
150
200
250
12/9 12/10 12/11 12/12 12/13 12/14 12/15 12/16 12/17 12/18 12/19 12/20 12/21 12/22 12/23 12/24 12/25 12/26 12/27
Visibility (km
)
PM2.5Co
ncen
trations (ug/m3)
PM25 PM1 visibility
0
10
20
30
40
50
60
0
50
100
150
200
250
12/9 12/10 12/11 12/12 12/13 12/14 12/15 12/16 12/17 12/18 12/19 12/20 12/21 12/22 12/23 12/24 12/25 12/26 12/27
Visibility (km)
PM2.5Co
ncentrations (ug/m3)
PM25 PM1 visibility
0
10
20
30
40
50
60
0
50
100
150
200
250
12/9 12/10 12/11 12/12 12/13 12/14 12/15 12/16 12/17 12/18 12/19 12/20 12/21 12/22 12/23 12/24 12/25 12/26 12/27
Visibility (km
)
PM2.5Co
ncentrations (ug/m3)
PM25 visibility
0
10
20
30
40
0
50
100
150
200
250
12/9 12/10 12/11 12/12 12/13 12/14 12/15 12/16 12/17 12/18 12/19 12/20 12/21 12/22 12/23 12/24 12/25 12/26 12/27Visibility (km)
PM2.5Co
ncentrations (ug/m3)
PM25 visibility
0
5
10
15
20
25
30
0
50
100
150
200
250
12/9 12/10 12/11 12/12 12/13 12/14 12/15 12/16 12/17 12/18 12/19 12/20 12/21 12/22 12/23 12/24 12/25 12/26 12/27
Visibility (km
)
PM2.5Co
ncen
trations (ug/m3)
PM25 visibility
(a) Nanjing
(b) Suzhou
(c) Shanghai
(d) Hangzhou
(e) Ningbo
Fig. 2. The variations of PM2.5 concentration and visibility from 9 to 27 December.
21.8% and 14.4%, respectively. These results indicated the importance of regional contributions to the pollution in Shanghai.
The effects of local accumulation and regional transport can be observed more clearly by examining the contribution distributions for each specific pollution level. From pollution level I to IV, local contributions were crucial and exhibited
an increasing trend for all sites. This was associated with adverse weather conditions. As shown in Table 2, the average wind speed presented a decreasing trend from 1.23–2.90 m s–1 to 0.63–1.27 m s–1. Hourly PBL heights with pollution level III and IV were lower than those with pollution level I and II. However, the characteristics differed for pollution level V. Wind speed and PBL heights were higher for sites
Fu et al., Aerosol and Air Quality Research, 16: 1067–1080, 2016 1072
Table 2. The percentage of hours, visibility and meteorological parameters for five air quality levels.
Index Air quality Level Nanjing Suzhou Shanghai Hangzhou Ningbo
The percentage of hours in the specific air
quality Level
I 30.0% 26.7% 32.6% 18.2% 11.8% II 44.5% 46.5% 28.3% 34.6% 33.1% III 21.5% 19.8% 20.6% 28.6% 24.8% IV 3.3% 4.6% 8.1% 12.9% 16.4% V 0.7% 2.5% 10.4% 5.8% 13.8%
Visibility (km)
I 11.1 31.9 32.3 24.2 17.2 II 6.2 21.0 21.8 14.8 10.3 III 3.6 12.3 12.2 7.9 5.9 IV 2.0 8.6 9.0 6.2 4.0 V 1.1 7.0 5.5 3.8 2.7
Wind speed (m s–1)
I 2.03 1.23 2.60 2.90 2.10 II 1.39 0.79 2.31 1.78 1.98 III 1.27 0.73 1.68 1.54 1.26 IV 1.30 0.63 1.61 0.93 0.90 V 2.89 0.67 1.74 0.62 1.13
PBL height (m)
I 412.0 660.6 685.6 605.3 840.2 II 282.0 417.3 738.9 418.5 850.6 III 269.2 374.1 487.6 361.0 772.6 IV 528.6 484.2 662.6 390.3 621.5 V 756.7 633.0 622.8 214.0 692.3
other than Hangzhou. Fig. 4 shows that the regional impacts began to increase. For Nanjing and Suzhou, the outer-regional contributions, particularly from Shandong and others, increased considerably. Compared with pollution level IV, the contributions from Shandong in pollution level V increased from 11.1 to 47.2 µg m–3 in Nanjing and from 12.7 to 30.3 µg m–3 in Suzhou. The contributions from other sites increased from 42.1 to 75.4 µg m–3 in Nanjing and from 17.5 to 27.2 µg m–3 in Suzhou. Nanjing, because of its location, was more affected by outer-regional transport than Suzhou was. Nanjing is located on the northern side of Suzhou and on the Jiangsu province border. In contrast to these two sites in Jiangsu province, the inner-regional effects from Jiangsu were more prominent for Shanghai and the sites in Zhejiang, which is located on the southern side of Jiangsu. Particularly for Shanghai and Ningbo, the contributions from Jiangsu province in pollution level V increased from 22.5 to 41.3 µg m–3 and from 10.1 to 24.7 µg m–3, respectively. Analysis of Two Typical Particle Pollution Episodes in this Winter Period
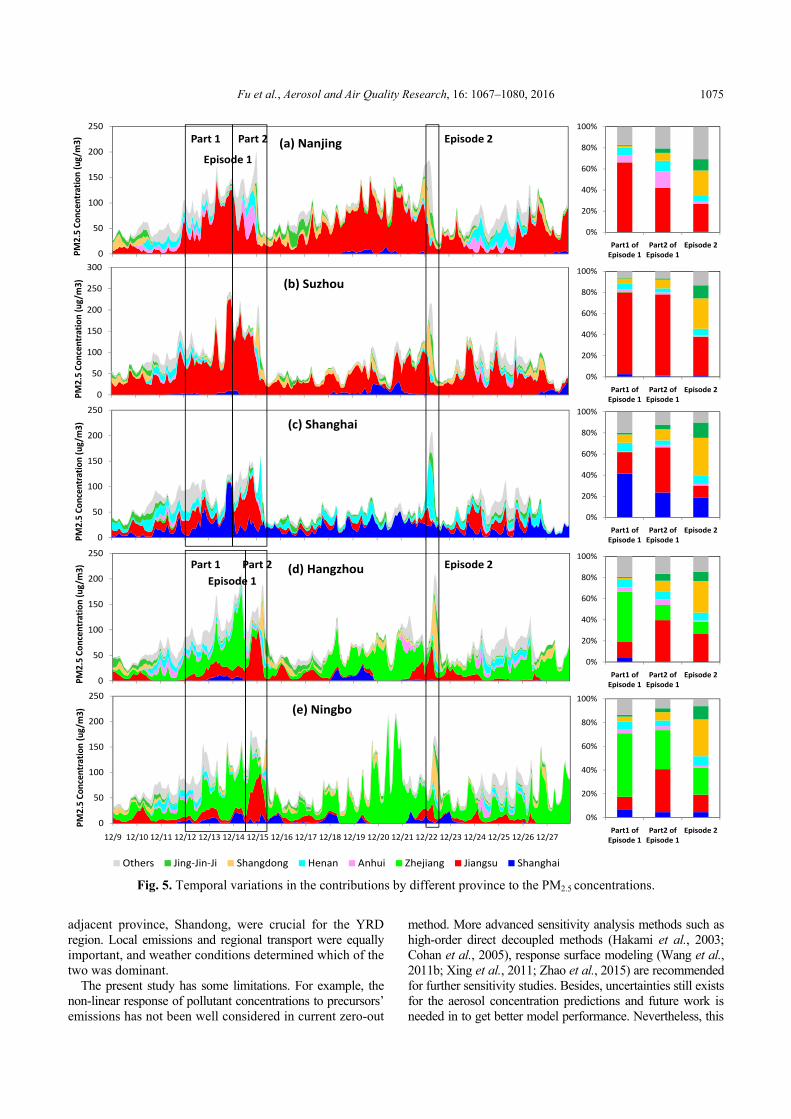
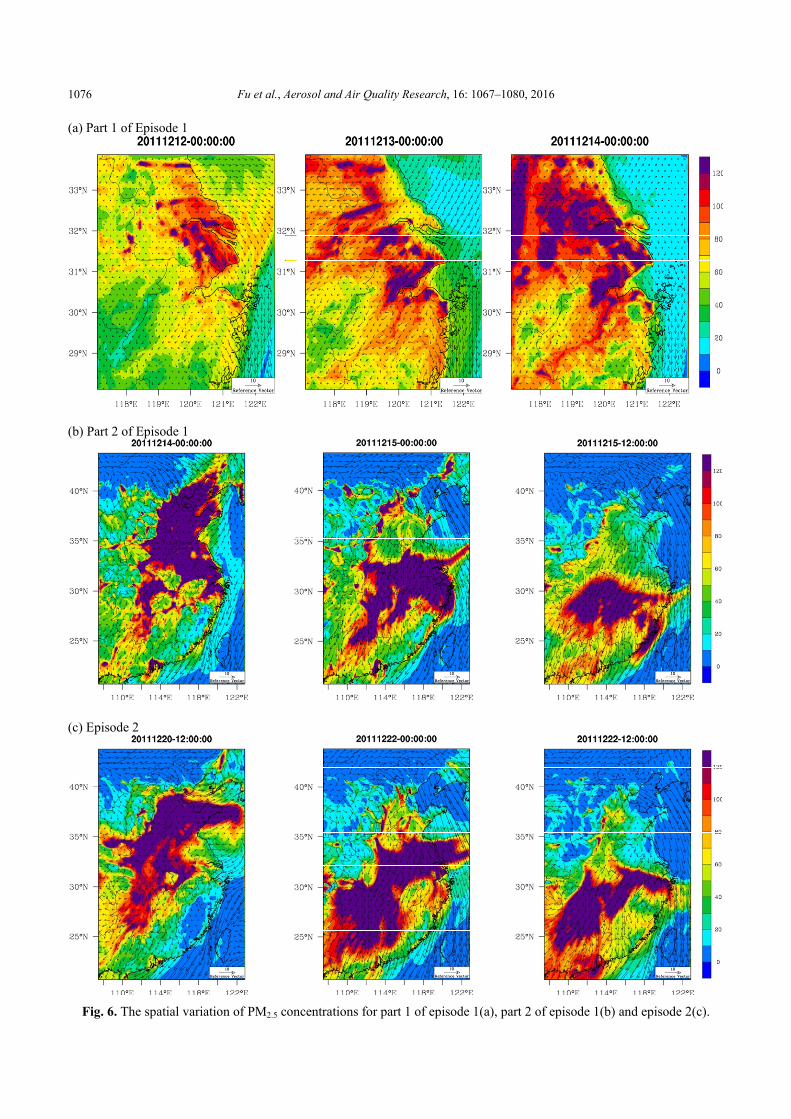
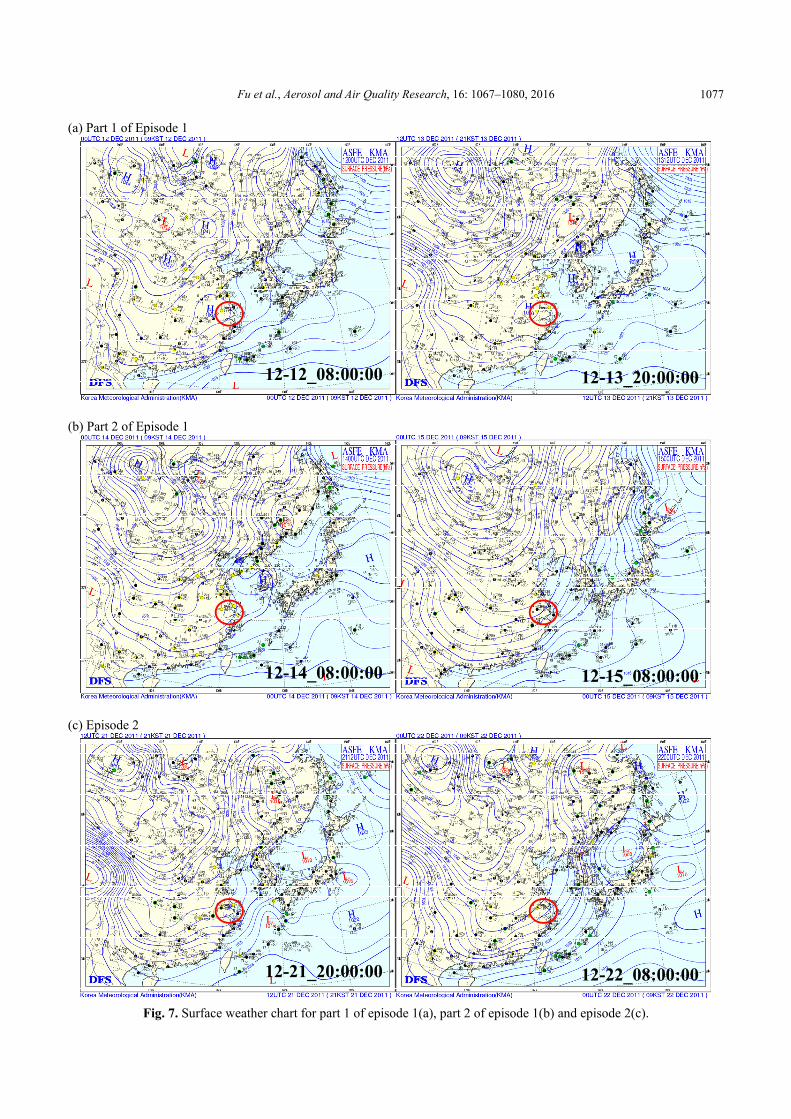
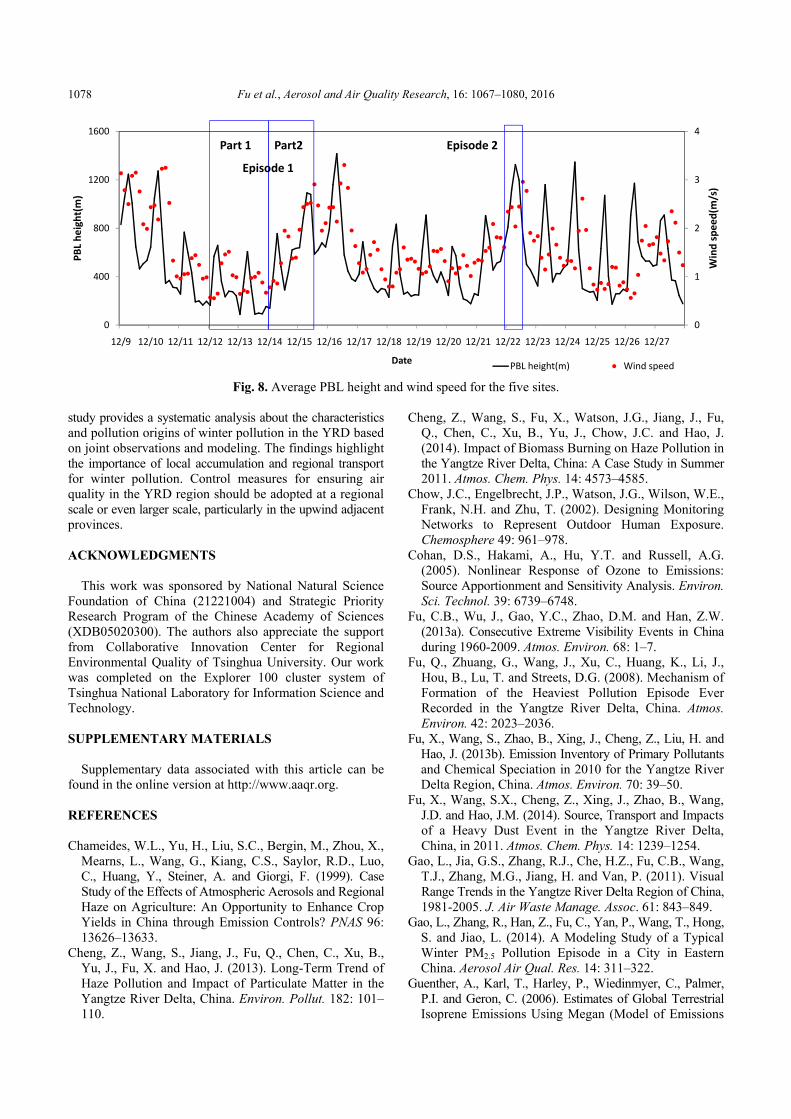
The temporal variations in the contributions of different provinces to PM2.5 concentrations are plotted in Fig. 5. To more clearly understand local and regional effects in this winter period, two pollution episodes were identified and their formation mechanisms were analyzed: Episode 1 (00:00, December 12 to 12:00, December 15) and Episode 2 (00:00, December 22 to 12:00, December 22). Episode 1 was dominated by local accumulation and inter-regional transport in succession, and Episode 2 was dominated by outer-regional transport. The spatial variations in simulated surface PM2.5 concentrations and wind vectors (arrows) are plotted in Fig. 6. A surface weather chart for these episodes and the variations in average PBL heights and wind speeds
are shown in Figs. 7 and 8, to analyze the effects of weather conditions. (1) Episode 1
Episode 1 was divided into two parts. Part 1 was from 00:00, December 12 to 23:00, December 13 for Nanjing, Suzhou, and Shanghai, and from 00:00, December 12 to 11:00 December 14 for Hangzhou and Ningbo. Part 2 was from 00:00, December 14 to 12:00, December 15 for Nanjing, Suzhou, and Shanghai, and from 12:00, December 14 to 12:00, December 15 for Hangzhou and Ningbo.
During part 1 of Episode 1, the YRD region was controlled by local high pressure or uniform pressure. In the horizontal direction, slight pressure gradients reduced the wind speed. Because of the divergence of air around the anticyclone, PBL height would be reduced (Liu et al., 2013). PBL height was crucial for the vertical diffusion of pollutants and low PBL height would restrict the pollutants to the near-ground layers. As shown in Fig. 8, the average wind speed decreased from > 2 to < 1 m s–1 and the PBL height at night decreased from > 400 to < 100 m. In addition, obvious temperature inversions were observed from the vertical temperature profile. Adverse weather conditions increased pollutant accumulation and particle concentration, as shown in Fig. 7. The local contributions for the Nanjing, Suzhou, Shanghai, Hangzhou, and Ningbo sites were 66.2%, 77.4%, 41.4%, 47.5%, and 53.4%, respectively.
For part 2 of Episode 1, as shown in Fig. 6(b), a pollution band was formed in the areas of Shandong, Jiangsu, Anhui, and Henan after the effect of adverse weather conditions in part 1 of Episode 1. From December 14 onward, the local high pressure disappeared gradually. The ridge of the high pressure centering in Mongolia extended to the YRD region and large pressure gradients increased the speed of northwest horizontal winds. The pollution band swept from northwest to
Fu et al., Aerosol and Air Quality Research, 16: 1067–1080, 2016 1073
0
50
100
150
200
250
12/9 12/1012/1112/1212/1312/1412/1512/1612/1712/1812/1912/2012/2112/2212/2312/2412/2512/2612/27
PM2.5 Concentration (ug/m3)
Date
OBS
SIM
0
50
100
150
200
250
300
12/9 12/1012/1112/1212/1312/1412/1512/1612/1712/1812/1912/2012/2112/2212/2312/2412/2512/2612/27
PM2.5 Concentration (ug/m3)
Date
OBS
SIM
0
50
100
150
200
250
300
12/9 12/1012/1112/1212/1312/1412/1512/1612/1712/1812/1912/2012/2112/2212/2312/2412/2512/2612/27
PM2.5 Concentration(ug/m3)
Date
OBS
SIM
0
50
100
150
200
250
12/9 12/1012/1112/1212/1312/1412/1512/1612/1712/1812/1912/2012/2112/2212/2312/2412/2512/2612/27
PM2.5 Concentration (ug/m3)
Date
OBS
SIM
0
50
100
150
200
250
300
350
12/9 12/1012/1112/1212/1312/1412/1512/1612/1712/1812/1912/2012/2112/2212/2312/2412/2512/2612/27
PM2.5 Concentration (ug/m3)
Date
OBS
SIM
(a) NanjingNMB=42.5%R=0.7
(b) SuzhouNMB=26.2%R=0.7
(c) ShanghaiNMB=‐14.5%R=0.8
(d) HangzhouNMB=‐6.0%R=0.7
(e) NingboNMB=‐16.7%R=0.6
Fig. 3. The variations of observed and simulated PM2.5 concentrations at Shanghai, Nanjing, Suzhou, Hangzhou and Ningbo between 9 to 27, December.
Fu et al., Aerosol and Air Quality Research, 16: 1067–1080, 2016 1074
Suzhou ShanghaiNanjing Hangzhou Ningbo
Jiangsu ZhejiangShanghai
Site
Province
0
20
40
60
80
100
120
140
160
180
200Avg I II III IV V
Avg I II III IV V
Avg I II III IV V
Avg I II III IV V
Avg I II III IV V
Controibutions to
PM2.5 concen
tration (µg/m
3 )
Others
Jing‐Jin‐Ji
Shangdong
Henan
Anhui
Zhejiang
Jiangsu
Shanghai
Fig. 4. Contributions from different province to the average PM2.5 concentrations for each air quality level.
south, as seen in Fig. 6(b). Particles were removed gradually by depositions along the transport path; therefore, inner-regional contributions from Jiangsu were more significant than outer-regional contributions. The contributions from the Jiangsu to Shanghai, Hangzhou, and Ningbo sites were 42.8%, 39.6%, and 36.2%, respectively. (2) Episode 2
The metrological conditions of Episode 2 were similar to those in part 2 of Episode 1. The northwestern flow transported pollutants from northwest to south from December 22 onward, as shown in Fig. 6(c). The difference was that before this episode, the YRD region was not affected by the steady weather, like the part 1 of Episode 1, and the east wind from the sea kept Jiangsu clean. Therefore, the pollution band was present outside the YRD region, particularly in Shandong. Unlike in part 2 of Episode 1, the outer-regional contributions in Episode 2 were larger than the inner-regional contributions. The contributions from Shandong for Nanjing, Suzhou, Shanghai, Hangzhou, and Ningbo sites were 24.2%, 28.8%, 35.4%, 30.0%, and 31.1%, respectively; in addition, the contributions from Jing-Jin-Ji were 10.7%, 12.4%, 14.5%, 8.8%, and 11.1%, respectively.
SUMMARY AND CONCLUSION
For the YRD region, particle pollution in winter is more severe than in other seasons. In the winter study period of December 9–27, 2011, the average PM2.5 concentration was 71 µg m–3. The percentages of polluted hours in this period were 25.4%, 26.9%, 39.1%, 47.2%, and 55.0% for Nanjing,
Suzhou, Shanghai, Hangzhou, and Ningbo, respectively. The heavily polluted hours in Shanghai and Ningbo accounted for more than 10% of all hours. The visibility in heavily polluted hours was less than 3 km.
To more clearly understand local and regional effects on particle pollution during winter, scenario analysis simulations were carried out using the WRF/CMAQ model for this observed winter period. It was found that the average contributions of local provincial emissions were dominant for Nanjing, Suzhou, Hangzhou and Ningbo sites, with 55.7%, 64.1%, 40.5% and 53.5%, respectively. For Shanghai site, the local contribution from Shanghai was 33.1%, indicating the importance of the regional contributions for Shanghai. The analysis for hours with different pollution levels showed that for clean, slight, or moderately polluted hours, local contributions were crucial and particle pollution was exacerbated mainly by lighter wind conditions and lower PBL heights. However, when the pollution level reached V, the out-regional contributions to Nanjing and Suzhou, and the inner-regional contributions from Jiangsu to Shanghai, Hangzhou and Ningbo increased significantly. Finally, the characteristics of local and regional contributions, and the formation mechanisms in two typical pollution episodes were analyzed. The pollution event dominated by local accumulation often lasted longer than that dominated by long-range regional transport. Nevertheless, pollution transport usually causes high particle concentration and its effects cannot be ignored. When particle pollution became severe in Jiangsu, its inner-regional effects on the downwind areas, including Shanghai and Zhejiang, were significant. On a larger scale, the outer-regional effects from the upwind
Fu et al., Aerosol and Air Quality Research, 16: 1067–1080, 2016 1075
0
50
100
150
200
250
1/1 1/25 2/18 3/13 4/6 4/30 5/24 6/17 7/11 8/4 8/28 9/21 10/15 11/8 12/2 12/26 1/19 2/12 3/8
PM2.5 Concentration (ug/m3)
Others Jing‐Jin‐Ji Shangdong Henan Anhui Zhejiang Jiangsu Shanghai
Part 2
Episode 1
Episode 2
0
50
100
150
200
250
300
1/1 1/25 2/18 3/13 4/6 4/30 5/24 6/17 7/11 8/4 8/28 9/21 10/15 11/8 12/2 12/26 1/19 2/12 3/8
PM2.5 Concentration (ug/m3)
Others Jing‐Jin‐Ji Shangdong Henan Anhui Zhejiang Jiangsu Shanghai
0
50
100
150
200
250
12/9 12/10 12/11 12/12 12/13 12/14 12/15 12/16 12/17 12/18 12/19 12/20 12/21 12/22 12/23 12/24 12/25 12/26 12/27
PM2.5 Concentration (ug/m3)
Others Jing‐Jin‐Ji Shangdong Henan Anhui Zhejiang Jiangsu Shanghai
0
50
100
150
200
250
1/1 1/25 2/18 3/13 4/6 4/30 5/24 6/17 7/11 8/4 8/28 9/21 10/15 11/8 12/2 12/26 1/19 2/12 3/8
PM2.5 Concentration (ug/m3)
Others Jing‐Jin‐Ji Shangdong Henan Anhui Zhejiang Jiangsu Shanghai
0
50
100
150
200
250
12/9 12/10 12/11 12/12 12/13 12/14 12/15 12/16 12/17 12/18 12/19 12/20 12/21 12/22 12/23 12/24 12/25 12/26 12/27
PM2.5 Concentration (ug/m3)
Others Jing‐Jin‐Ji Shangdong Henan Anhui Zhejiang Jiangsu Shanghai
(a) Nanjing
(b) Suzhou
(c) Shanghai
(d) Hangzhou
(e) Ningbo
Part 1
0%
20%
40%
60%
80%
100%
Part1 ofEpisode 1
Part2 ofEpisode 1
Episode 2
0%
20%
40%
60%
80%
100%
Part1 ofEpisode 1
Part2 ofEpisode 1
Episode 2
0%
20%
40%
60%
80%
100%
Part1 ofEpisode 1
Part2 ofEpisode 1
Episode 2
0%
20%
40%
60%
80%
100%
Part1 ofEpisode 1
Part2 ofEpisode 1
Episode 2
0%
20%
40%
60%
80%
100%
Part1 ofEpisode 1
Part2 ofEpisode 1
Episode 2
Part 1 Part 2
Episode 1
Episode 2
Fig. 5. Temporal variations in the contributions by different province to the PM2.5 concentrations.
adjacent province, Shandong, were crucial for the YRD region. Local emissions and regional transport were equally important, and weather conditions determined which of the two was dominant.
The present study has some limitations. For example, the non-linear response of pollutant concentrations to precursors’ emissions has not been well considered in current zero-out
method. More advanced sensitivity analysis methods such as high-order direct decoupled methods (Hakami et al., 2003; Cohan et al., 2005), response surface modeling (Wang et al., 2011b; Xing et al., 2011; Zhao et al., 2015) are recommended for further sensitivity studies. Besides, uncertainties still exists for the aerosol concentration predictions and future work is needed in to get better model performance. Nevertheless, this
Fu et al., Aerosol and Air Quality Research, 16: 1067–1080, 2016 1076
(a) Part 1 of Episode 1
(b) Part 2 of Episode 1
(c) Episode 2
Fig. 6. The spatial variation of PM2.5 concentrations for part 1 of episode 1(a), part 2 of episode 1(b) and episode 2(c).
Fu et al., Aerosol and Air Quality Research, 16: 1067–1080, 2016 1077
(a) Part 1 of Episode 1
12-13_20:00:0012-12_08:00:00
(b) Part 2 of Episode 1
12-15_08:00:0012-14_08:00:00
(c) Episode 2
12-22_08:00:0012-21_20:00:00
Fig. 7. Surface weather chart for part 1 of episode 1(a), part 2 of episode 1(b) and episode 2(c).
Fu et al., Aerosol and Air Quality Research, 16: 1067–1080, 2016 1078
0
1
2
3
4
0
400
800
1200
1600
12/9 12/10 12/11 12/12 12/13 12/14 12/15 12/16 12/17 12/18 12/19 12/20 12/21 12/22 12/23 12/24 12/25 12/26 12/27
Wind speed(m
/s)
PBL height(m)
DatePBL height(m) Wind speed
Part 1 Part2
Episode 1
Episode 2
Fig. 8. Average PBL height and wind speed for the five sites.
study provides a systematic analysis about the characteristics and pollution origins of winter pollution in the YRD based on joint observations and modeling. The findings highlight the importance of local accumulation and regional transport for winter pollution. Control measures for ensuring air quality in the YRD region should be adopted at a regional scale or even larger scale, particularly in the upwind adjacent provinces.
ACKNOWLEDGMENTS
This work was sponsored by National Natural Science Foundation of China (21221004) and Strategic Priority Research Program of the Chinese Academy of Sciences (XDB05020300). The authors also appreciate the support from Collaborative Innovation Center for Regional Environmental Quality of Tsinghua University. Our work was completed on the Explorer 100 cluster system of Tsinghua National Laboratory for Information Science and Technology. SUPPLEMENTARY MATERIALS
Supplementary data associated with this article can be found in the online version at http://www.aaqr.org. REFERENCES Chameides, W.L., Yu, H., Liu, S.C., Bergin, M., Zhou, X.,
Mearns, L., Wang, G., Kiang, C.S., Saylor, R.D., Luo, C., Huang, Y., Steiner, A. and Giorgi, F. (1999). Case Study of the Effects of Atmospheric Aerosols and Regional Haze on Agriculture: An Opportunity to Enhance Crop Yields in China through Emission Controls? PNAS 96: 13626–13633.
Cheng, Z., Wang, S., Jiang, J., Fu, Q., Chen, C., Xu, B., Yu, J., Fu, X. and Hao, J. (2013). Long-Term Trend of Haze Pollution and Impact of Particulate Matter in the Yangtze River Delta, China. Environ. Pollut. 182: 101–110.
Cheng, Z., Wang, S., Fu, X., Watson, J.G., Jiang, J., Fu, Q., Chen, C., Xu, B., Yu, J., Chow, J.C. and Hao, J. (2014). Impact of Biomass Burning on Haze Pollution in the Yangtze River Delta, China: A Case Study in Summer 2011. Atmos. Chem. Phys. 14: 4573–4585.
Chow, J.C., Engelbrecht, J.P., Watson, J.G., Wilson, W.E., Frank, N.H. and Zhu, T. (2002). Designing Monitoring Networks to Represent Outdoor Human Exposure. Chemosphere 49: 961–978.
Cohan, D.S., Hakami, A., Hu, Y.T. and Russell, A.G. (2005). Nonlinear Response of Ozone to Emissions: Source Apportionment and Sensitivity Analysis. Environ. Sci. Technol. 39: 6739–6748.
Fu, C.B., Wu, J., Gao, Y.C., Zhao, D.M. and Han, Z.W. (2013a). Consecutive Extreme Visibility Events in China during 1960-2009. Atmos. Environ. 68: 1–7.
Fu, Q., Zhuang, G., Wang, J., Xu, C., Huang, K., Li, J., Hou, B., Lu, T. and Streets, D.G. (2008). Mechanism of Formation of the Heaviest Pollution Episode Ever Recorded in the Yangtze River Delta, China. Atmos. Environ. 42: 2023–2036.
Fu, X., Wang, S., Zhao, B., Xing, J., Cheng, Z., Liu, H. and Hao, J. (2013b). Emission Inventory of Primary Pollutants and Chemical Speciation in 2010 for the Yangtze River Delta Region, China. Atmos. Environ. 70: 39–50.
Fu, X., Wang, S.X., Cheng, Z., Xing, J., Zhao, B., Wang, J.D. and Hao, J.M. (2014). Source, Transport and Impacts of a Heavy Dust Event in the Yangtze River Delta, China, in 2011. Atmos. Chem. Phys. 14: 1239–1254.
Gao, L., Jia, G.S., Zhang, R.J., Che, H.Z., Fu, C.B., Wang, T.J., Zhang, M.G., Jiang, H. and Van, P. (2011). Visual Range Trends in the Yangtze River Delta Region of China, 1981-2005. J. Air Waste Manage. Assoc. 61: 843–849.
Gao, L., Zhang, R., Han, Z., Fu, C., Yan, P., Wang, T., Hong, S. and Jiao, L. (2014). A Modeling Study of a Typical Winter PM2.5 Pollution Episode in a City in Eastern China. Aerosol Air Qual. Res. 14: 311–322.
Guenther, A., Karl, T., Harley, P., Wiedinmyer, C., Palmer, P.I. and Geron, C. (2006). Estimates of Global Terrestrial Isoprene Emissions Using Megan (Model of Emissions
Fu et al., Aerosol and Air Quality Research, 16: 1067–1080, 2016 1079
of Gases and Aerosols from Nature). Atmos. Chem. Phys. 6: 3181–3210.
Hakami, A., Odman, M.T., and Russell, A.G. (2003). High-order, Direct Sensitivity Analysis of Multidimensional Air Quality Models. Environ. Sci. Technol. 37: 2442–2452.
Huang, K., Zhuang, G., Lin, Y., Fu, J.S., Wang, Q., Liu, T., Zhang, R., Jiang, Y., Deng, C., Fu, Q., Hsu, N.C. and Cao, B. (2012). Typical Types and Formation Mechanisms of Haze in an Eastern Asia Megacity, Shanghai. Atmos. Chem. Phys. 12: 105–124.
Huizheng, C., Xiaoye, Z., Yang, L., Zijiang, Z. and Qu, J.J. (2007). Horizontal Visibility Trends in China 1981- 2005. Geophys. Res. Lett. 34: L24706, doi: 10.1029/2007GL031450.
Huizheng, C., Xiaoye, Z., Yang, L., Zijiang, Z., Qu, J.J. and Xianjun, H. (2009). Haze Trends over the Capital Cities of 31 Provinces in China, 1981-2005. Theor. Appl. Climatol. 97: 235–242.
Kain, J.S. (2004). The Kain-Fritsch Convective Parameterization: An Update. J. Appl. Meteorol. 43: 170–181.
Kang, H., Zhu, B., Su, J., Wang, H., Zhang, Q. and Wang, F. (2013). Analysis of a Long-Lasting Haze Episode in Nanjing, China. Atmos. Res. 120: 78–87.
Li, J., Wang, Z.F., Huang, H.L., Hu, M., Meng, F., Sun, Y.L., Wang, X.Q., Wang, Y.S. and Wang, Q. (2013). Assessing the Effects of Trans-Boundary Aerosol Transport between Various City Clusters on Regional Haze Episodes in Spring over East China. Tellus Ser. B 65: 20052.
Liu, X.G., Li, J., Qu, Y., Han, T., Hou, L., Gu, J., Chen, C., Yang, Y., Liu, X., Yang, T., Zhang, Y., Tian, H. and Hu, M. (2013). Formation and Evolution Mechanism of Regional Haze: A Case Study in the Megacity Beijing, China. Atmos. Chem. Phys. 13: 4501–4514.
Mlawer, E.J. and Clough, S.A. In the 8th Atmospheric Radiation Measurement (ARM) Science Team Meeting, 1998, Tucson, Arizona, USA.
Mlawer, E.J., Taubman, S.J., Brown, P.D., Iacono, M.J. and Clough, S.A. (1997). Radiative Transfer for Inhomogeneous Atmospheres: RRTM, a Validated Correlated-k Model for the Longwave. J. Geophys. Res. 102: 16663–16682.
Morrison, H., Thompson, G. and Tatarskii, V. (2009). Impact of Cloud Microphysics on the Development of Trailing Stratiform Precipitation in a Simulated Squall Line: Comparison of One- and Two-Moment Schemes. Mon. Weather Rev. 137: 991–1007.
Pleim, J.E. (2007). A Combined Local and Nonlocal Closure Model for the Atmospheric Boundary Layer. Part I: Model Description and Testing. J. Appl. Meteorol. Clim. 46: 1383–1395.
Pope, C.A., Burnett, R.T., Turner, M.C., Cohen, A., Krewski, D., Jerrett, M., Gapstur, S.M. and Thun, M.J. (2011). Lung Cancer and Cardiovascular Disease Mortality Associated with Ambient Air Pollution and Cigarette Smoke: Shape of the Exposure-Response Relationships. Environ. Health Perspect. 119: 1616–1621.
Pui, D.Y.H., Chen, S.C. and Zuo, Z. (2014). PM2.5 in China: Measurements, Sources, Visibility and Health Effects, and Mitigation. Particuology 13: 1–26.
Quinn, P.K. and Bates, T.S. (2003). North American, Asian, and Indian Haze: Similar Regional Impacts on Climate? Geophys. Res. Lett. 30: 1555.
Rolph, G.D. (2013). Real-time Environmental Applications and Display System (READY) Website: 25 http://ready. arl.noaa.gov, NOAA Air Resources Laboratory, Silver Spring, MD.
Streets, D.G., Fu, J.S., Jang, C.J., Hao, J.M., He, K.B., Tang, X.Y., Zhang, Y.H., Wang, Z.F., Li, Z.P., Zhang, Q., Wang, L.T., Wang, B.Y. and Yu, C. (2007). Air Quality during the 2008 Beijing Olympic Games. Atmos. Environ. 41: 480–492.
Tie, X., Wu, D. and Brasseur, G. (2009). Lung Cancer Mortality and Exposure to Atmospheric Aerosol Particles in Guangzhou, China. Atmos. Environ. 43: 2375–2377.
Wang, L., Xu, J., Yang, J., Zhao, X., Wei, W., Cheng, D., Pan, X. and Su, J. (2012). Understanding Haze Pollution over the Southern Hebei Area of China Using the CMAQ Model. Atmos. Environ. 56: 69–79.
Wang, M., Cao, C., Li, G. and Singh, R.P. (2015). Analysis of a Severe Prolonged Regional Haze Episode in the Yangtze River Delta, China. Atmos. Environ. 102: 112–121.
Wang, S., Xing, J., Chatani, S., Hao, J., Klimont, Z., Cofala, J. and Amann, M. (2011a). Verification of Anthropogenic Emissions of China by Satellite and Ground Observations. Atmos. Environ. 45: 6347–6358.
Wang, S., Xing, J., Jang, C., Zhu, Y., Fu, J.S. and Hao, J. (2011b). Impact Assessment of Ammonia Emissions on Inorganic aerosols in East China using Response Surface Modeling Technique. Environ. Sci. Technol. 45: 9293–9300.
Wang, Y., Li, L., Chen, C., Huang, C., Huang, H., Feng, J., Wang, S., Wang, H., Zhang, G., Zhou, M., Cheng, P., Wu, M., Sheng, G., Fu, J., Hu, Y., Russell, A.G. and Wumaer, A. (2014). Source Apportionment of Fine Particulate Matter during Autumn Haze Episodes in Shanghai, China. J. Geophys. Res. 119: 1903–1914.
Wu, D., Wu, X., Li, F., Tan, H., Chen, J., Cao, Z., Sun, X., Chen, H. and Li, H. (2010). Temporal and Spatial Variation of Haze during 1951-2005 in Chinese Mainland. Acta. Meteorol. Sin. 68: 680–688.
Xing, J., Wang, S. X., Jang, C., Zhu, Y. and Hao, J.M. (2011). Nonlinear Response of Ozone to Precursor Emission Changes in China: A Modeling Study Using Response Surface Methodology. Atmos. Chem. Phys. 11: 5027–5044.
Xiu, A.J. and Pleim, J.E. (2001). Development of a Land Surface Model. Part I: Application in a Mesoscale Meteorological Model. J. Appl. Meteorol. 40: 192–209.
Yan, W., Fahe, C., Houfeng, L.I.U. and Yonghong, W. (2008). Analysis on the Characteristics of Horizontal Transport of the Atmospheric Pollutant over the Yangtze Delta. Res. Environ. Sci. 21: 22–29.
Zhao, B., Wang, S.X., Wang, J.D., Fu, J.S., Liu, T.H., Xu, J.Y., Fu, X. and Hao, J.M. (2013). Impact of National NOx and SO2 Control Policies on Particulate Matter
Fu et al., Aerosol and Air Quality Research, 16: 1067–1080, 2016 1080
Pollution in China. Atmos. Environ. 77: 453–463. Zhao, B., Wang, S.X., Xing, J., Fu, K., Fu, J.S., Jang, C.,
Zhu, Y., Dong, X.Y., Gao, Y., Wu, W.J., Wang, J.D. and Hao, J.M. (2015). Assessing the Nonlinear Response of Fine Particles to Precursor Emissions: Development and Application of an Extended Response Surface Modeling Technique v1.0. Geosci. Model Dev. 8: 115–128.
Zheng, G.J., Duan, F.K., Su, H., Ma, Y.L., Cheng, Y., Zheng, B., Zhang, Q., Huang, T., Kimoto, T., Chang, D., Poeschl, U., Cheng, Y.F. and He, K.B. (2015). Exploring the Severe Winter Haze in Beijing: The Impact of Synoptic Weather, Regional Transport and Heterogeneous
Reactions. Atmos. Chem. Phys. 15: 2969–2983. Zhou, M., Chen, C., Qiao, L., Lou, S., Wang, H., Huang,
H., Wang, Q., Chen, M., Chen, Y., Li, L., Huang, C., Zou, L., Mu, Y. and Zhang, G. (2013). The Chemical Characteristics of Particulate Matters in Shanghai uuring Heavy Air Pollution Episode in Central and Eastern China in January 2013. Acta Sci. Circum. 33: 3118–3126.
Received for review, August 10, 2015 Revised, November 2, 2015
Accepted, December 27, 2015


![[SnS4]4- clusters modified MgAl-LDH composites for mercury ...air.sjtu.edu.cn/Assets/userfiles/sys_eb538c1c-65ff... · The MgAl-LDH in the nitrate form was synthesized using a co-precipitation](https://static.fdocuments.in/doc/165x107/5e9098ef39d7a16aed6cb1ad/sns44-clusters-modified-mgal-ldh-composites-for-mercury-airsjtueducnassetsuserfilessyseb538c1c-65ff.jpg)