Living abroad: migration between Britain and the EU8 abroad migration between... · Short-term...
28
Page 1 of 28 Next release: 27 July 2017 Release date: 10 July 2017 Contact: Melissa Randall [email protected] +44(0)1329 444661 Article Living abroad: migration between Britain and the EU8 This report is the second in a series being published to provide more information on British citizens living in the European Union (EU), and EU citizens living in the UK. Correction 10 July 2017 A correction has been made to Section 4: What are EU8 citizens living in the UK doing? This was due to a small error when rounding the data. You can see the original content in the superseded version. We apologise for any inconvenience.
-
Upload
nguyenngoc -
Category
Documents
-
view
216 -
download
2
Transcript of Living abroad: migration between Britain and the EU8 abroad migration between... · Short-term...

Page 1 of 28
Next release: 27 July 2017
Release date: 10 July 2017
Contact: Melissa Randall [email protected] +44(0)1329 444661
Article
Living abroad: migration between Britain and the EU8This report is the second in a series being published to provide more information on British citizens living in the European Union (EU), and EU citizens living in the UK.
Correction
10 July 2017
A correction has been made to Section 4: What are EU8 citizens living in the UK doing?
This was due to a small error when rounding the data. You can see the original content in the superseded version. We apologise for any inconvenience.

Page 2 of 28
Table of contents
1. Main points
2. Introduction
3. EU8 citizens living in the UK
4. What are EU8 citizens living in the UK doing?
5. 1-12 month Short-term Migration to England and Wales by citizens of EU8 countries'
6. EU8 Citizens visiting the UK for less than 28 days
7. UK citizens living in EU8 Countries
8. Pensions claimed in EU8 Countries
9. 1 to 12 month short-term migration to EU8 countries, by UK citizens, from England and Wales, for the year to June 2015
10. British citizens visiting to EU8 countries for less than 28 days
11. Appendix 1: More information on how the data were compiled

Page 3 of 28
1 . Main points
Around 1.3 million EU8 citizens live in the UK. The biggest component of this is Polish citizens, which is estimated at 813,700 (average for the years 2013 to 2015).
The distribution, hotels and restaurants industry was the most common employer for the EU8 workforce, employing 225,400 EU8 citizens, 4.4% of all workers in this industry
There were 186,500 EU8 citizens working in the manufacturing industry, accounting for 6.7% of the workforce.
The number of UK citizens living in the EU8 countries in 2016 is relatively small – 14,100 – and these people are predominantly aged 15- to 64-years old (72%).
There are more than 33,000 under 15-year-olds living in the EU8 countries (particularly Poland, Hungary, Slovenia, Latvia and Lithuania), who were born in the UK. In comparison there are about 1,000 under 15-year-old British citizens living in EU8 countries.
2 . Introduction
This report is the second in a series being published to provide more information on British citizens living in the European Union (EU), and EU citizens living in the UK. This series has been created in response to an increased user need for data about the people who may be most likely to be affected by the UK's decision to leave the EU.
It presents the available statistics that estimate the numbers of British people living in EU8 countries – those that joined the European Union at the same time and share characteristics: Poland, Lithuania, Czech Republic, Hungary, Slovakia, Slovenia, Estonia and Latvia. The report also considers citizens of EU8 countries living in the UK.

Page 4 of 28
Figure 1: EU groupings used within UK migration statistics, 2017
We previously published on this topic. Now, more up-to-date data How many British citizens live in Europe?'about British citizens living in the EU is available, and more detailed analysis has been conducted using data from the 2011 round of European censuses. In addition, we have combined the Annual Population Survey into a 3-year-average data set, allowing a robust analysis of European citizens living in the UK. Additional analyses of short-term migration and visits of less than 28 days are also included in this report. Together, these sources provide a more complete picture of how many UK and EU citizens are “living abroad”, how many are staying abroad for shorter periods of time, and what they are doing while there.
There are three “types” of migrant discussed in this report:

Page 5 of 28
Long-term resident; those people who have lived abroad for one year or longer, or intend to live there for one year or longer. However, because this doesn’t include those spending part of the year abroad, two further “types” are considered.
Short-term migrant; those spending 1 to 12 months living abroad. This can be for any reason, and would include those who spend part of the year living abroad (for example, summer in EU8 countries and winter in UK).
Visitor; those spending up to 28 days abroad. This group is largely holidaymakers, and will include, for example, those who repeatedly spend time in EU8 countries.
All of the statistics in this report use a citizenship definition to identify migrants, as this is considered to be the most useful in identifying those who may be most likely to be affected by the UK's decision to leave the EU.
This is particularly the case when compared to the use of a “country of birth” definition of a migrant, which can miss some groups of citizens. Differences in the use of these two definitions are fully explained in the January 2017 report, .What information is there on British migrants living in Europe?’
Citizenship can change over time, and multiple citizenships can be held. The way that multiple citizenships are dealt with is different between the different data sources in this report. For more information, please see Appendix 1.
3 . EU8 citizens living in the UK
There were 1.4 million EU8 citizens living in the UK in 2015, according to the Population by country of birth and estimates, based on one year of data from the Annual Population Survey (APS).nationality
For more detailed analysis it is necessary to use the 3-year pooled APS dataset, which provides a larger sample than annual data. It is an average for the years January 2013 to December 2015.
It is estimated that 1.3 million EU8 citizens live in the UK (Annual Population Survey, 2013 to 2015). The biggest component of this is Polish citizens, which for 2013 to 2015 was estimated at 813,700. This is the largest number of citizens resident in the UK of any country outside of the UK.
Figure 2 shows the age of EU8 citizens living in the UK. 74% are aged 15- to 49-years-old.

Page 6 of 28
1.
Figure 2: Age of EU8 citizens living in the UK, 2013 to 2015
Source: ONS Annual Population Survey, pooled data, 2013 to 2015
Notes:
Estonia, Latvia, and Slovenia are combined due to disclosure control.
A dependency ratio shows the relationship between what is roughly defined as “most likely to be working age”, or 15 to 64-year-old, population and the population under 15 years and over 64-years-old.
The APS data for 2013 to 2015 show that the UK population of UK citizens has 1.8 people that are aged 15 to 64 years, for every one person that is not (Table 1), 2.7 for the EU14 (pre-2004 EU countries) and 3.9 for EU8 citizens.
Page 7 of 28
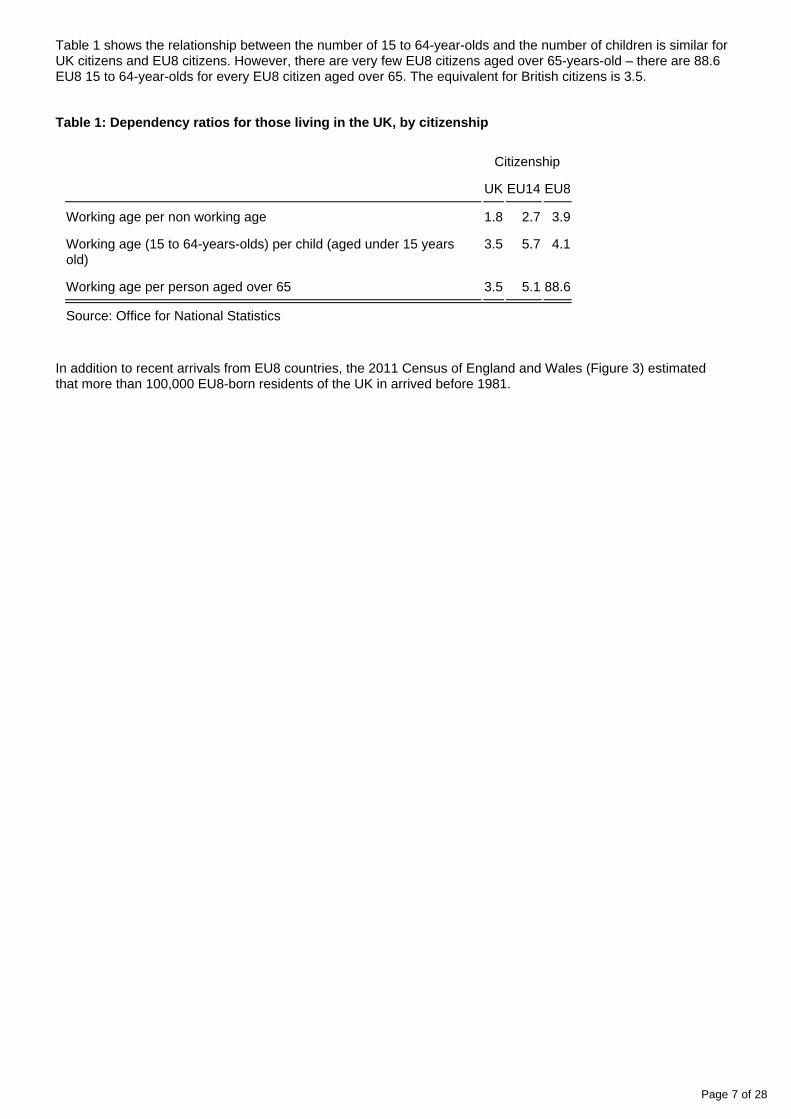
Table 1 shows the relationship between the number of 15 to 64-year-olds and the number of children is similar for UK citizens and EU8 citizens. However, there are very few EU8 citizens aged over 65-years-old – there are 88.6 EU8 15 to 64-year-olds for every EU8 citizen aged over 65. The equivalent for British citizens is 3.5.
Table 1: Dependency ratios for those living in the UK, by citizenship
Citizenship
UK EU14 EU8
Working age per non working age 1.8 2.7 3.9
Working age (15 to 64-years-olds) per child (aged under 15 years old)
3.5 5.7 4.1
Working age per person aged over 65 3.5 5.1 88.6
Source: Office for National Statistics
In addition to recent arrivals from EU8 countries, the 2011 Census of England and Wales (Figure 3) estimated that more than 100,000 EU8-born residents of the UK in arrived before 1981.
Page 8 of 28
1.
Figure 3: Year of arrival for non-UK born residents of England and Wales, 2011
Source: Office for National Statistics, 2011 Census
Notes:
Census table DC2804EWr was used to produce figure 3.
The vast majority of EU8 citizens maintain their EU8 citizenship – in 2016 there were around 7,000 grants of (about 0.5% of the most recent estimate of British citizenship to those from EU8 countries 1.4m EU8 citizens APS
2015).

Page 9 of 28
Notes for EU8 citizens in living in the UK
Annual Population Survey (APS) data is collected from individuals in households, but does not include most communal establishments (managed accommodation such as halls of residence, hostels and care homes); this means that students living in communal establishments will only be included in APS estimates if their parents (resident in a household) are sampled and include the absent student. Students living in non-communal establishments will be captured in APS sampling.
The APS will include long-term migrants and some short-term migrants although it is unlikely to include short-term migrants living in the UK for very short periods of time.
These factors could have a disproportionate effect on certain categories of overseas nationals.
The APS 3-year pooled dataset Jan 2013 to Dec 2015 is less sensitive to more volatile trends than 1-year datasets as this dataset encompasses 3 years
4 . What are EU8 citizens living in the UK doing?
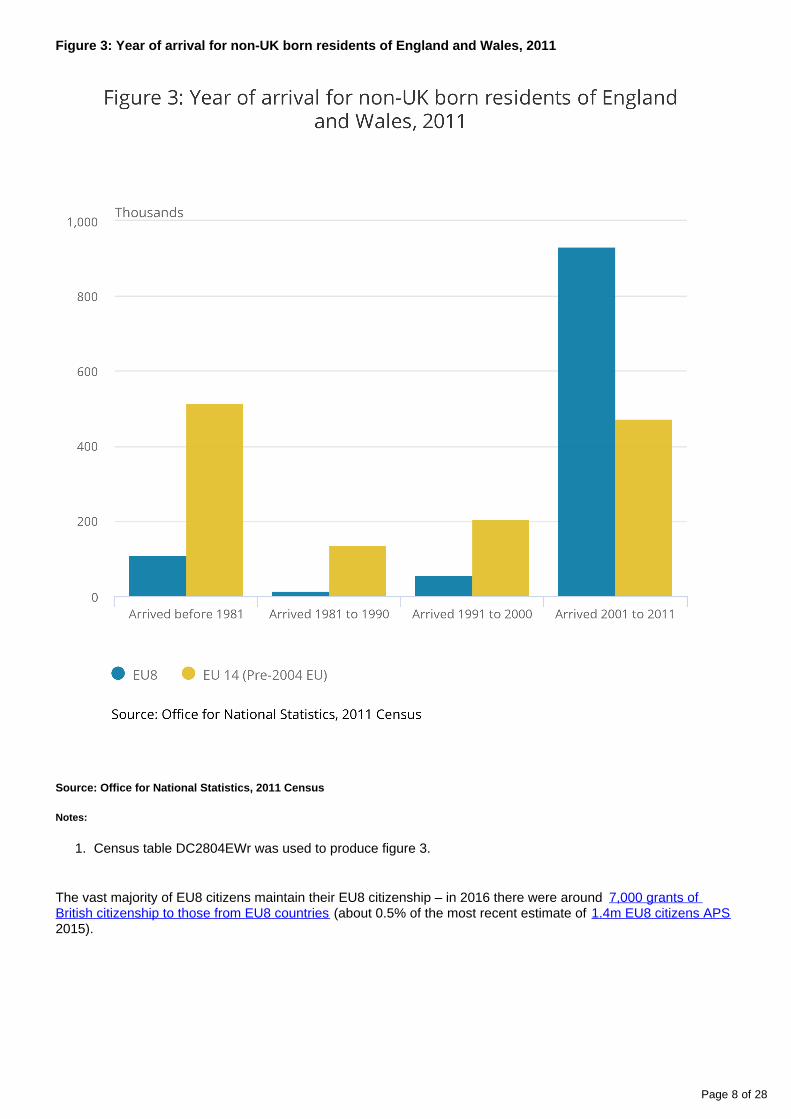
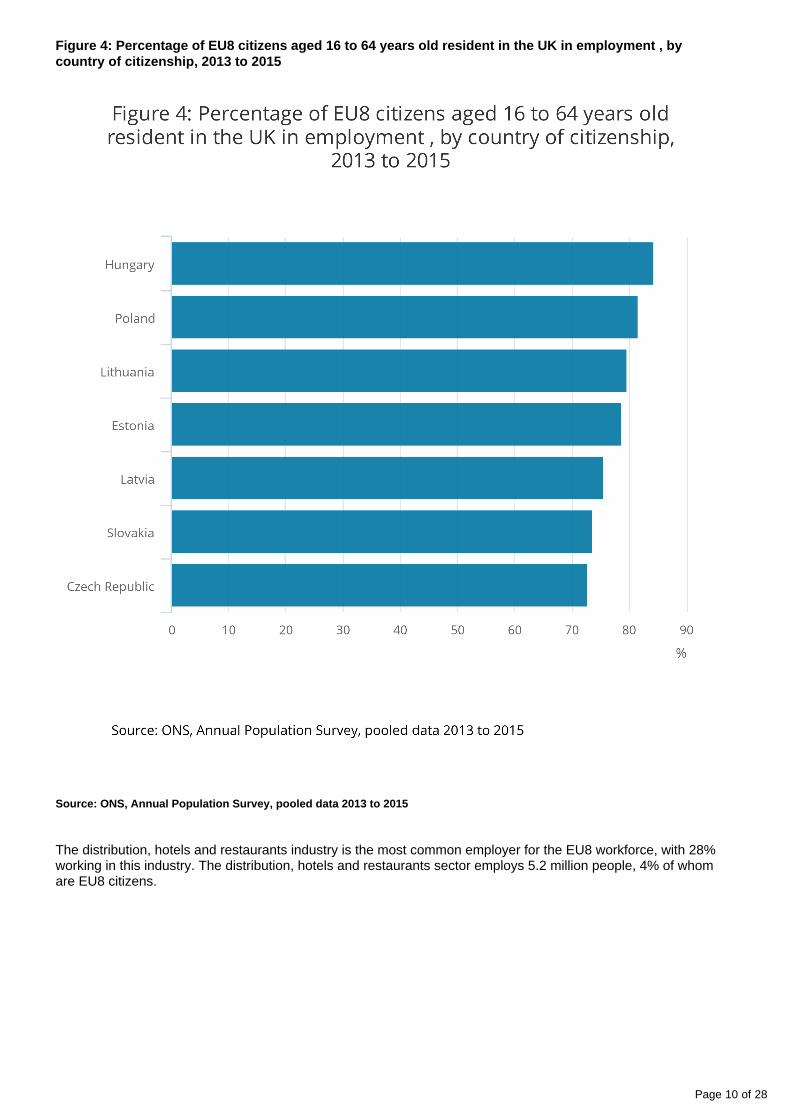
Figure 4 shows that on average, 80% (820,000) of EU8 citizens aged 16 to 64 years and resident in the UK were employed at the point they were surveyed in 2013 to 2015. EU8 citizens made up 3% of all those employed in 2013 to 2015.
Page 10 of 28
Figure 4: Percentage of EU8 citizens aged 16 to 64 years old resident in the UK in employment , by country of citizenship, 2013 to 2015
Source: ONS, Annual Population Survey, pooled data 2013 to 2015
The distribution, hotels and restaurants industry is the most common employer for the EU8 workforce, with 28% working in this industry. The distribution, hotels and restaurants sector employs 5.2 million people, 4% of whom are EU8 citizens.
Page 11 of 28
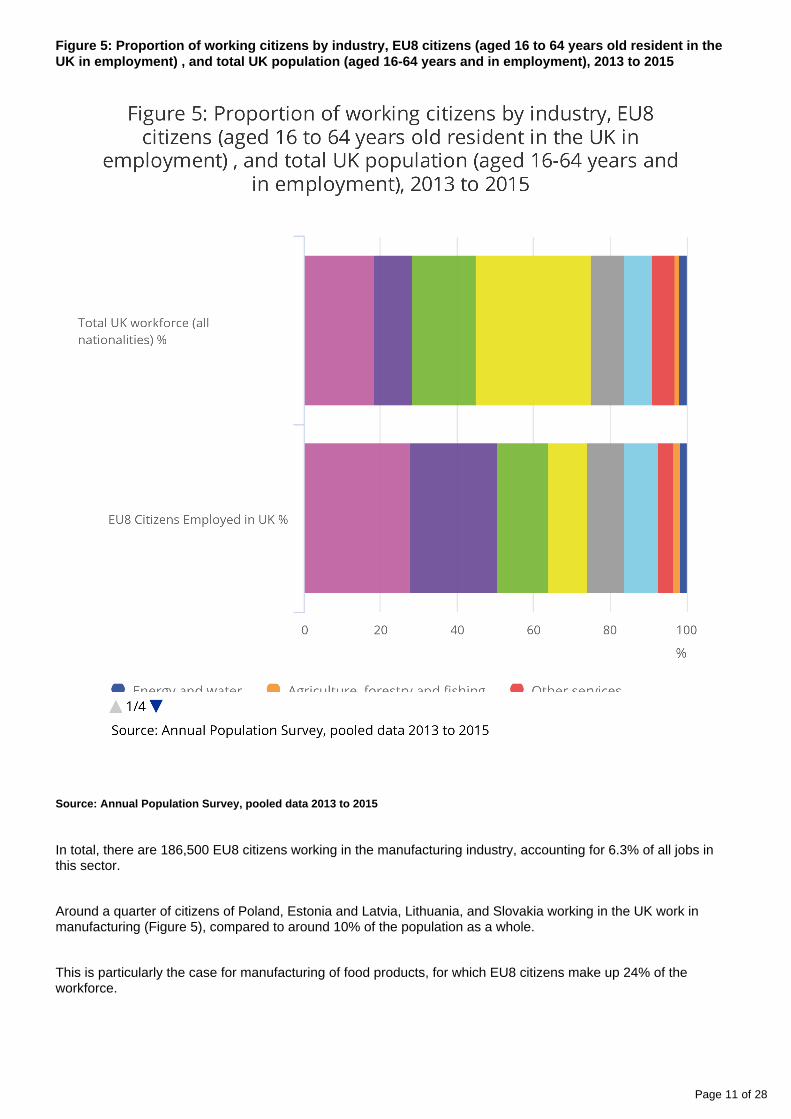
Figure 5: Proportion of working citizens by industry, EU8 citizens (aged 16 to 64 years old resident in the UK in employment) , and total UK population (aged 16-64 years and in employment), 2013 to 2015
Source: Annual Population Survey, pooled data 2013 to 2015
In total, there are 186,500 EU8 citizens working in the manufacturing industry, accounting for 6.3% of all jobs in this sector.
Around a quarter of citizens of Poland, Estonia and Latvia, Lithuania, and Slovakia working in the UK work in manufacturing (Figure 5), compared to around 10% of the population as a whole.
This is particularly the case for manufacturing of food products, for which EU8 citizens make up 24% of the workforce.

Page 12 of 28
The banking and finance industry is particularly popular for citizens of the Czech Republic, 31% of those working in the UK work in this Industry.
83,200 EU8 citizens worked in the public administration, education and health sector in 2013 to 2015.
This includes 25,100 EU8 citizens in human health activities (1.1% of all workers in this sector), 22,300 in education (0.7%), and 19, 300 in residential care (2.2%).
This compares to 189,100 EU14 citizens work in public administration, education and health, with 51,000 in human health (2.3% of all workers in this sector), 82,900 in education (2.6%) and 13,900 in residential care (1.5%).
Note that the industry sector does not necessarily reflect job content – for example, people working in the manufacturing industry occupy a variety of jobs, such as managerial, operative and cleaning.

Page 13 of 28
Figure 6: EU8 citizens by industry, 2013 to 2015
Source: Annual Population Survey, pooled data 2013 to 2015
Notes:
1.Estonia and Latvia are combined and Slovenia is omitted due to disclosure control.
2.The other category contains the ‘Agriculture, Forestry and Fishing’, ‘Energy and water’, ‘Construction’, and ‘Other Services’ industries.
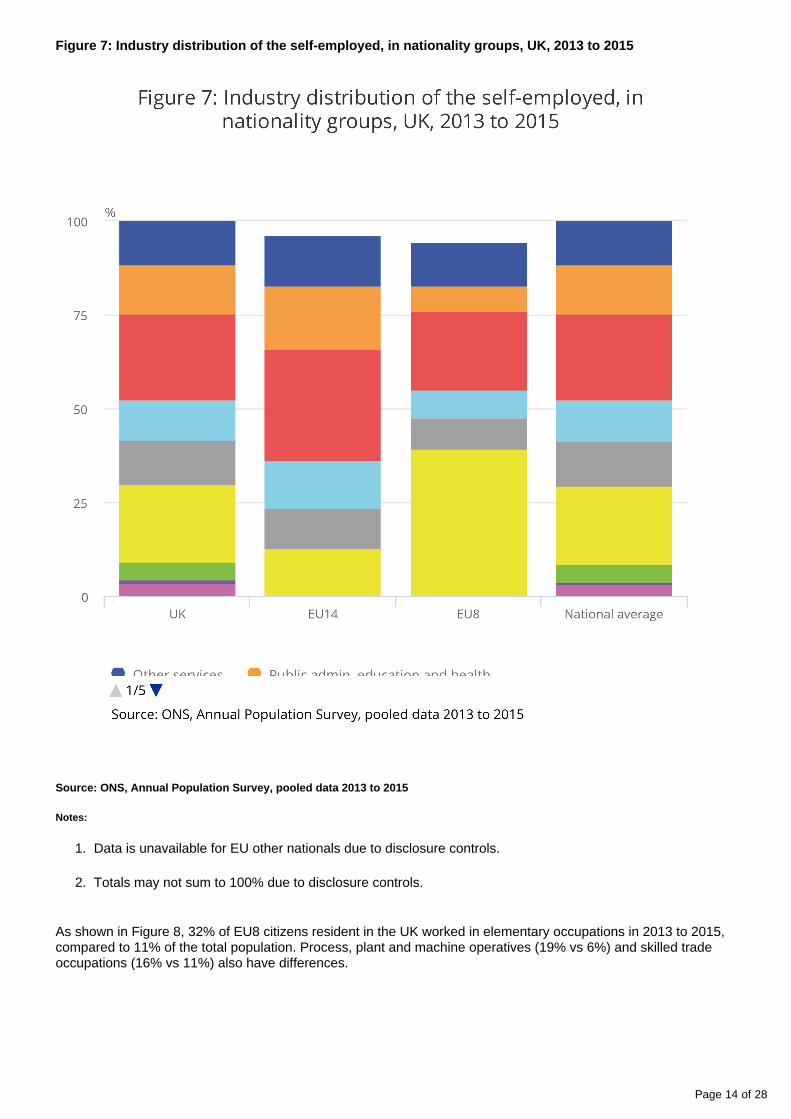
Overall levels of self-employment amongst EU8 citizens are similar to that of UK citizens (14% vs 15%). Figure 7 shows the proportion of self-employed workers by the industry sector they worked in. 39% of EU8 citizens were self-employed in the “Construction” sector.
Page 14 of 28
1.
2.
Figure 7: Industry distribution of the self-employed, in nationality groups, UK, 2013 to 2015
Source: ONS, Annual Population Survey, pooled data 2013 to 2015
Notes:
Data is unavailable for EU other nationals due to disclosure controls.
Totals may not sum to 100% due to disclosure controls.
As shown in Figure 8, 32% of EU8 citizens resident in the UK worked in elementary occupations in 2013 to 2015, compared to 11% of the total population. Process, plant and machine operatives (19% vs 6%) and skilled trade occupations (16% vs 11%) also have differences.

Page 15 of 28
Professional occupations are those that require a degree or equivalent qualification, postgraduate qualifications and/or a formal period of experience-related training. Elementary occupations require a minimum general level of education (that is, that which is acquired by the end of the period of compulsory education). Examples of elementary jobs include office cleaners, freight handlers, garden labourers, and kitchen assistants.
Figure 8: Proportion of those working by occupation, EU8 citizens and total UK population, 2013 to 2015
Source: ONS, Annual Population Survey, pooled data 2013 to 2015
Previous analysis has shown that .40% of EU8 nationals are over-educated for the job they are working in
Our report provides more information on the number and International Migration in the Labour Marketcharacteristics of migrants in the labour market.

Page 16 of 28
5 . 1-12 month Short-term Migration to England and Wales by citizens of EU8 countries'
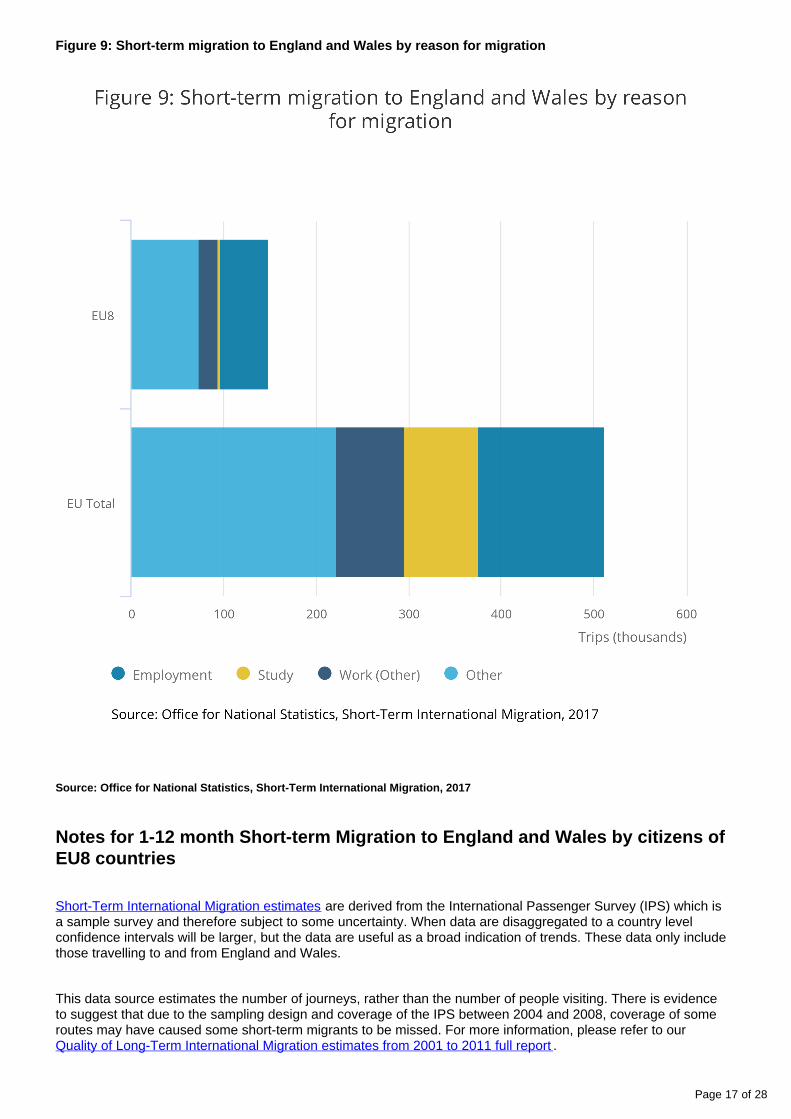
There were 147,000 short term visits to England and Wales by EU8 citizens in the year to mid-2015.
“Other” reasons (74,000) were the most common reason for visit. In these data, “Other” reasons include holidays and travelling; visiting or accompanying family and friends; working holidays; medical treatment; and religious pilgrimage.
35% of short-term migrants with EU8 citizenship visited England and Wales for employment, in comparison with 27% of short-term migrants with any EU citizenship, or 14% of total short-term migrants to England and Wales. Employment”is defined as migration to work, paid in the new country in which the migrant works and ”work (other)is defined as self-employment and visiting on business for their existing employer. This would include migrants travelling for seasonal agricultural work.
Study includes all formal higher and further education but excludes evening and informal tuition.
1% of short-term migrants with EU8 citizenship visited England and Wales for study, in comparison to 15% of short-term migrants with any EU citizenship, or 17% of all short-term migrants.
Page 17 of 28
Figure 9: Short-term migration to England and Wales by reason for migration
Source: Office for National Statistics, Short-Term International Migration, 2017
Notes for 1-12 month Short-term Migration to England and Wales by citizens of EU8 countries
Short-Term International Migration estimates are derived from the International Passenger Survey (IPS) which is a sample survey and therefore subject to some uncertainty. When data are disaggregated to a country level confidence intervals will be larger, but the data are useful as a broad indication of trends. These data only include those travelling to and from England and Wales.
This data source estimates the number of journeys, rather than the number of people visiting. There is evidence to suggest that due to the sampling design and coverage of the IPS between 2004 and 2008, coverage of some routes may have caused some short-term migrants to be missed. For more information, please refer to our
.Quality of Long-Term International Migration estimates from 2001 to 2011 full report

Page 18 of 28
6 . EU8 Citizens visiting the UK for less than 28 days
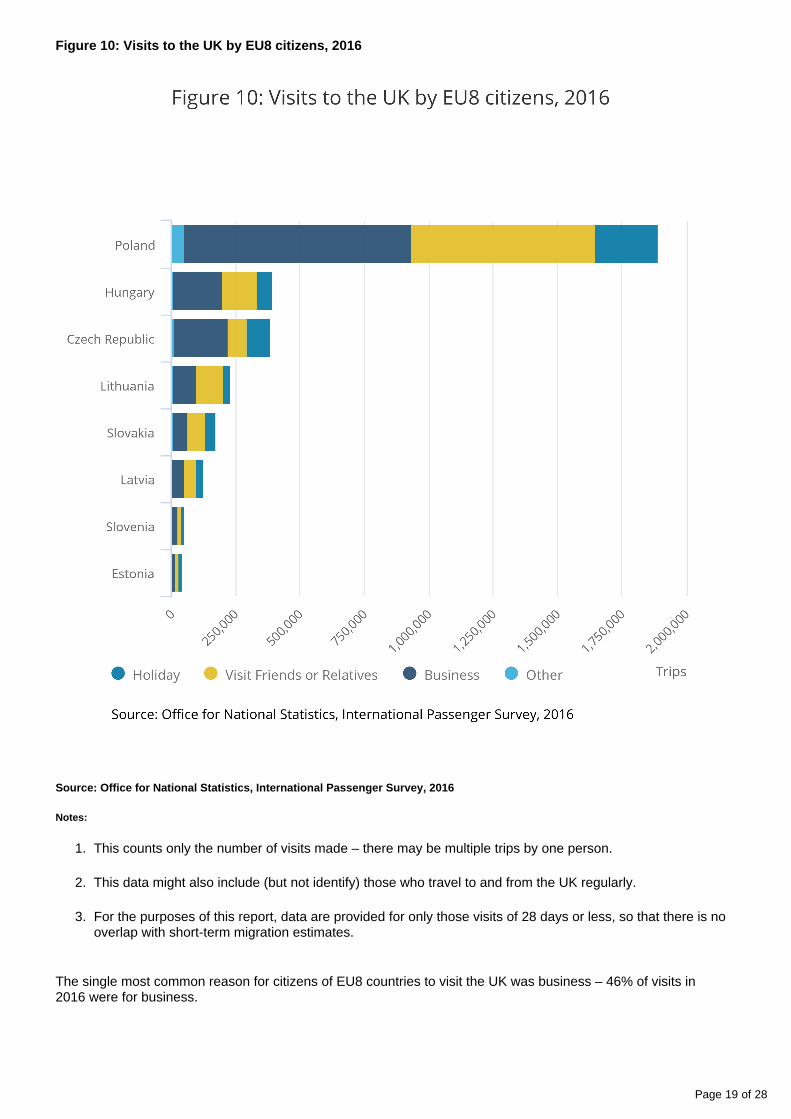
There were 3.3 million visits to the UK by citizens of EU8 countries in 2016. Citizens of Poland (1,889,400) made the most visits to the UK of any EU8 country in 2016. Short holidays and visits to family and friends together made up about 51% of visits.
Page 19 of 28
1.
2.
3.
Figure 10: Visits to the UK by EU8 citizens, 2016
Source: Office for National Statistics, International Passenger Survey, 2016
Notes:
This counts only the number of visits made – there may be multiple trips by one person.
This data might also include (but not identify) those who travel to and from the UK regularly.
For the purposes of this report, data are provided for only those visits of 28 days or less, so that there is no overlap with short-term migration estimates.
The single most common reason for citizens of EU8 countries to visit the UK was business – 46% of visits in 2016 were for business.

Page 20 of 28
There were 7,237,000 business visits of less than a month to the UK by EU citizens. Polish citizens made the most visits for business reasons, with 879,000, followed by French citizens (762,000) and German citizens (759,000).
7 . UK citizens living in EU8 Countries
The number of UK citizens living in EU8 countries is 14,100. British migrants living in these countries are predominantly 15 to 64 years old (72%). Of the British citizens resident in EU8 countries, 42% are resident in the Czech Republic.
Figure 11: Age of British citizens living in EU8 countries, 2016
Source: European Labour Force Surveys, 2016, as collated by Eurostat
Page 21 of 28
1.
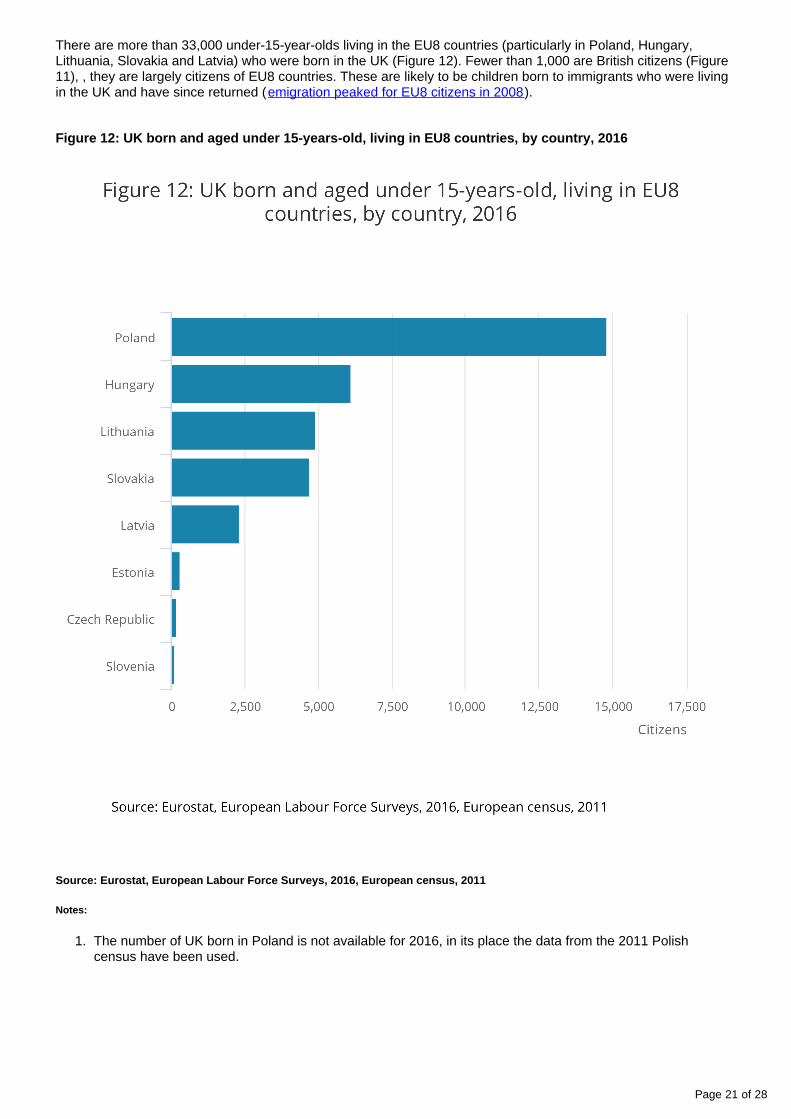
There are more than 33,000 under-15-year-olds living in the EU8 countries (particularly in Poland, Hungary, Lithuania, Slovakia and Latvia) who were born in the UK (Figure 12). Fewer than 1,000 are British citizens (Figure 11), , they are largely citizens of EU8 countries. These are likely to be children born to immigrants who were living in the UK and have since returned ( ).emigration peaked for EU8 citizens in 2008
Figure 12: UK born and aged under 15-years-old, living in EU8 countries, by country, 2016
Source: Eurostat, European Labour Force Surveys, 2016, European census, 2011
Notes:
The number of UK born in Poland is not available for 2016, in its place the data from the 2011 Polish census have been used.
Page 22 of 28
8 . Pensions claimed in EU8 Countries
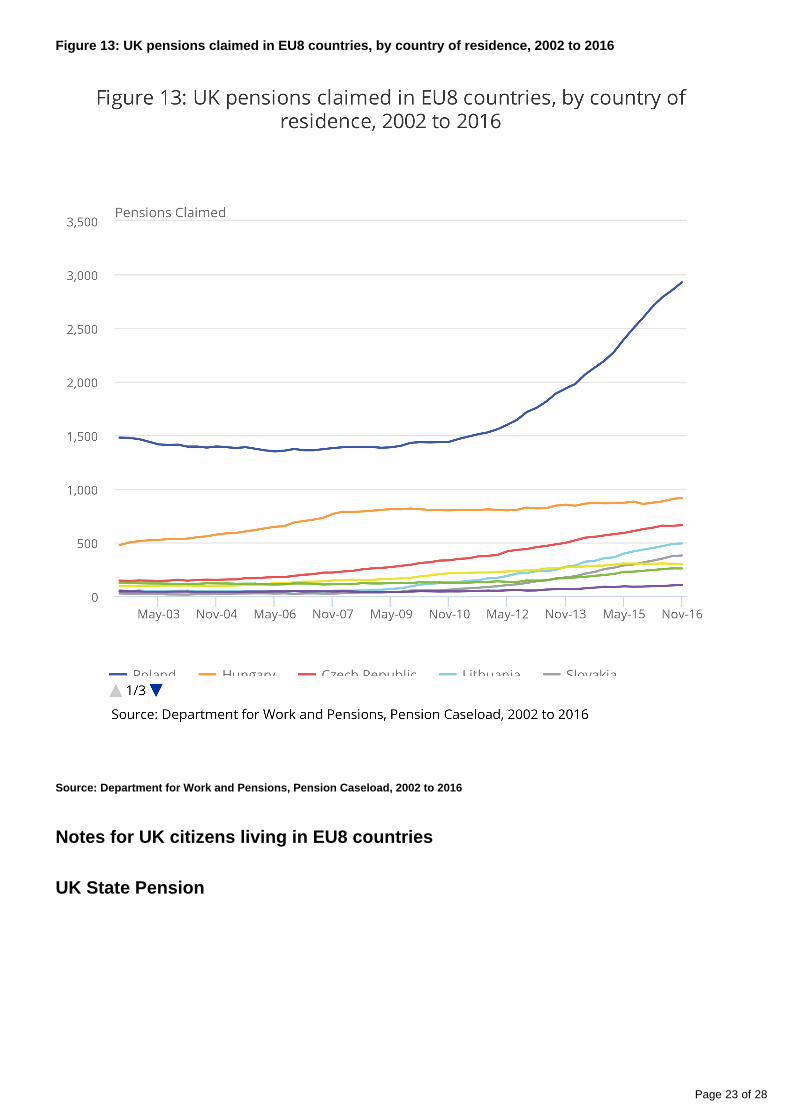
The Department for Work and Pensions (DWP) report (from ) shows that there were around administrative data6,000 individuals in receipt of a UK State Pension at November 2016 in EU8 countries.
Figure 13 shows that the number of UK State Pension recipients living in EU8 countries has increased most dramatically in Poland. Around 2,900 UK State Pension recipients lived in Poland at November 2016, twice the number compared to November 2010.
Anybody with qualifying National Insurance contributions and/or credits can receive the UK State Pension, so recipients are not necessarily British. Registering an address of an EU8 country is not confirmation that the recipient is a long-term resident of an EU8 country.
As there is not a corresponding rise in the number of British citizens aged over 65 years living in EU8 countries, it is likely that the increase is due to EU8 migrants returning home and claiming the State Pension they are eligible for by working in the UK.
Page 23 of 28
Figure 13: UK pensions claimed in EU8 countries, by country of residence, 2002 to 2016
Source: Department for Work and Pensions, Pension Caseload, 2002 to 2016
Notes for UK citizens living in EU8 countries
UK State Pension
Page 24 of 28
1.
2.
These data on State Pension recipients include both British citizens and non-British citizens who qualify for a UK State Pension. The data are for people who have notified the Department for Work and Pensions (DWP) that they are resident overseas. People are required to inform DWP about any change in their circumstances, including a change of address.
The Eurostat 2016 data is based on data about the population of each country on January 1 submitted to Eurostat by each country. This refers to the usually resident population and is either based upon population registers, or the last population census of that country adjusted according to population change figures. Both population estimates and census data records those long-term migrants who have lived or intend to live in EU8 countries for more than a year. It doesn’t estimate those who live in EU8 countries for shorter periods of time, or who split their time between EU8 countries and the UK. Totals may not sum due to rounding.
9 . 1 to 12 month short-term migration to EU8 countries, by UK citizens, from England and Wales, for the year to June 2015
British citizens made 27,000 visits of 1 to 12 months (with a confidence interval of plus or minus 11,000) to EU8 countries in the year to June 2015. Most (23,000) were for “Other” reasons. “Other” reasons include: holidays and travelling; visiting or accompanying family and friends; working holidays; medical treatment; and religious pilgrimage.
The majority of visits were to Poland (19,000), for other reasons (17,000).
10 . British citizens visiting to EU8 countries for less than 28 days
There were 1,517,300 visits to EU8 countries by UK residents in 2016. 66% of these were for holidays (Figure 14). The most common country for visits was Poland, mostly for visits to friends or relatives.
Estonia received the fewest visits from UK citizens in 2016.

Page 25 of 28
1.
2.
3.
Figure 14: British citizens visits to EU8 countries, for less than 28 days, by reason, 2016
Source: Office for National Statistics, International Passenger Survey, 2016
Notes:
This estimates only the number of visits made – there may be multiple trips by one person.
This data might also include (but not identify) those who travel to and from EU8 countries regularly.
For the purposes of this report, data are provided for only those visits of 28 days or less, so that there is no overlap with short-term migration estimates.

Page 26 of 28
Notes for British citizens travelling to EU8 countries for less than 28 days
This estimates only the number of visits made – there may be multiple trips by one person. This data might also include (but not identify) those who travel to and from EU8 countries regularly. For the purposes of this report, data are provided for only those visits of 28 days or less, so that there is no overlap with short-term migration estimates.
11 . Appendix 1: More information on how the data were compiled
This report provides updated figures to those previously published in January 2017 the report, What information is .there on British migrants living in Europe?'
The January 2017 report established the resident population of citizens as the most useful statistics for identifying who may be affected by the UK's decision to leave the EU. This is particularly the case when compared to the use of a “country of birth” definition of a migrant, which can miss some groups of citizens. It should be noted that people can change their citizenship and some people hold multiple citizenships.
This report uses a variety of additional data sources to provide more up-to-date data on the resident populations and the number of short-term migration events and visits by British citizens to the EU (and by EU citizens to the UK), which may be affected by the UK's decision to leave the EU.
These data sources are not always comparable (see table 2 below for the definitional differences between them). For example, the sources used to identify British citizens in EU8 countries are on a different basis to the sources used to identify EU8 citizens in the UK. However, they have been selected as the best available date to indicate the number of citizens in the UK and the EU8 countries.

Page 27 of 28
Table 2: Comparison of definitions between the data sources used in this report
Type of migrant Source Citizenship Migrant definition
Long-term residents
British citizens in EU countries
Labour Force Survey estimates from EU8 national statistical institutions, collated by Eurostat
Yes, estimates are by citizenship.
"A person who moves from their country of usual residence for a period of at least 12 months"
UK state pensions claimed abroad, DWP
Does not provide estimates by citizenship
No definition is applied, although it is assumed that those claiming pension in another country will be a long-term resident
EU8 citizens in UK
Annual Population Survey, ONS
Yes, estimates are by citizenship. Citizenship is a response to ‘What nationality do you hold?’
The APS will include long-term migrants and some short-term migrants although it is unlikely to include short-term migrants living in the UK for very short periods of time
Short-term migrants
British citizens in EU8 countries EU8 citizens in UK
Short-term migration estimates, ONS
Yes, estimates are by citizenship. Citizenship is collected as “passport held” and migrant usually shows passport to the interviewer.
Those that migrate between 1 to 12 months for all reasons
Visitors British citizens in EU8 Countries EU8 citezens in UK
Visitor estimates, ONS
Yes, estimates are by citizenship. Citizenship is collected as ‘passport held’ and migrant usually shows passport to the interviewer.
Visits abroad. For the purposes of this report, data is provided for only those visits of 28 days or less, so that there is no overlap with short-term migration estimates.
Source: Office for National Statistics
Limitations of this research
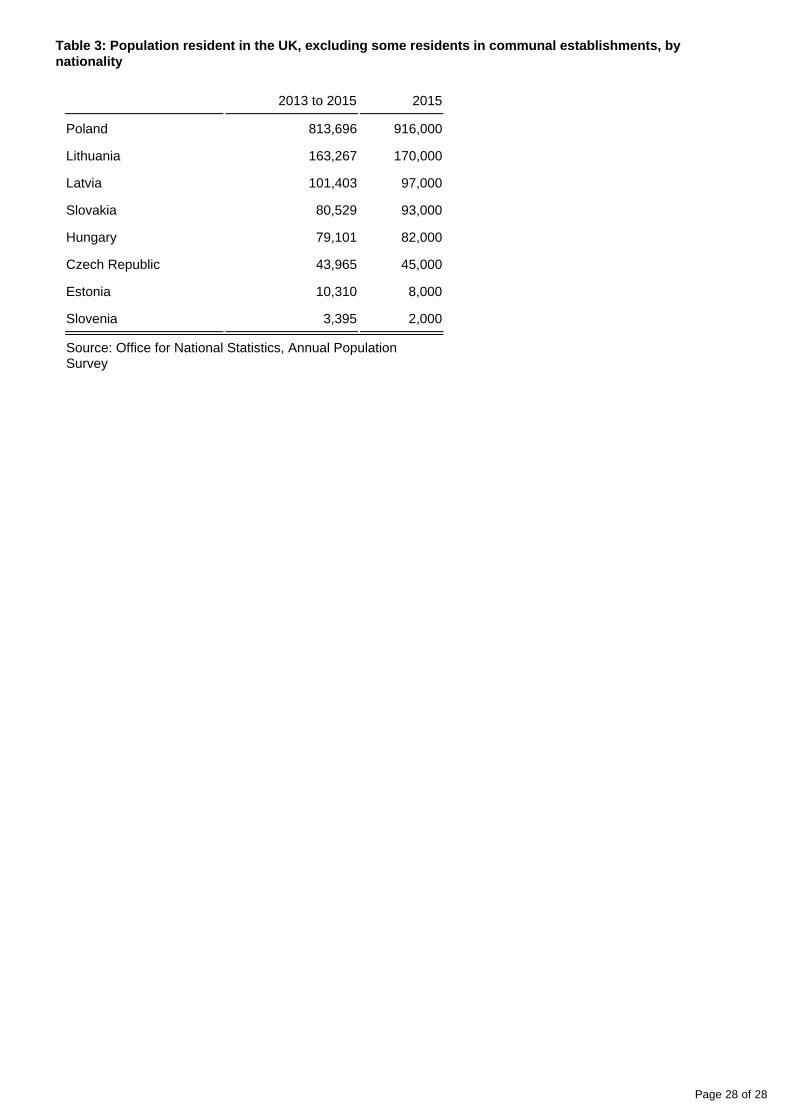
In order to provide detailed information on the characteristics of individual nationality groups living in the UK, which is robust, it is necessary to average data over a 3-year time period, from 2013 to 2015. When considering EU8 nationals, there is an impact, because the resident population from EU8 countries has increased in this time period. These differences have been quantified in Table 3.
Page 28 of 28
Table 3: Population resident in the UK, excluding some residents in communal establishments, by nationality
2013 to 2015 2015
Poland 813,696 916,000
Lithuania 163,267 170,000
Latvia 101,403 97,000
Slovakia 80,529 93,000
Hungary 79,101 82,000
Czech Republic 43,965 45,000
Estonia 10,310 8,000
Slovenia 3,395 2,000
Source: Office for National Statistics, Annual Population Survey