List of Supplementary Tables
60
1 Supplementary information for Sources of Inaccuracy in the Measurement of Adult Patients’ Resting Blood Pressure in Clinical Settings: A Systematic Review List of Supplementary Tables Patient-related sources of inaccuracy 3 Supplementary Table 1. Studies examining the effect of acute meal ingestion 3 Supplementary Table 2. Studies examining the effect of acute alcohol use 4 Supplementary Table 3. Studies examining the effect of acute caffeine use 7 Supplementary Table 4. Studies examining the effect of acute nicotine use or exposure 11 Supplementary Table 5. Studies examining the effect of bladder distension 15 Supplementary Table 6. Studies examining the effect of cold exposure 16 Supplementary Table 7. Studies examining the effect of measuring blood pressure from a paretic arm 18 Supplementary Table 8. Studies examining the white-coat effect 19 Device-related sources of inaccuracy 25 Supplementary Table 9A. Studies examining the accuracy of mercury devices (vs. invasive criterion) 25 Supplementary Table 9B. Studies examining the accuracy of aneroid devices (vs. invasive criterion) 26 Supplementary Table 9C. Studies examining the accuracy of aneroid devices (vs. non-invasive criterion) 27 Supplementary Table 9D. Studies examining the accuracy of automated devices (vs. invasive criterion) 28 Supplementary Table 9E. Studies examining the accuracy of automated device models (vs. non-invasive criterion) 30 Supplementary Table 10A. Studies examining the calibration accuracy of mercury devices in clinical use 34 Supplementary Table 10B. Studies examining the calibration accuracy of aneroid devices in clinical use 35 Supplementary Table 10C. Studies examining the calibration accuracy of automated devices in clinical use 36 Procedure-related sources of inaccuracy 37 Supplementary Table 11. Studies examining the effect of rest period 37
Transcript of List of Supplementary Tables

1
Supplementary information for
Sources of Inaccuracy in the Measurement of Adult Patients’ Resting Blood Pressure in Clinical Settings:
A Systematic Review
List of Supplementary Tables
Patient-related sources of inaccuracy 3
Supplementary Table 1. Studies examining the effect of acute meal ingestion 3
Supplementary Table 2. Studies examining the effect of acute alcohol use 4
Supplementary Table 3. Studies examining the effect of acute caffeine use 7
Supplementary Table 4. Studies examining the effect of acute nicotine use or exposure 11
Supplementary Table 5. Studies examining the effect of bladder distension 15
Supplementary Table 6. Studies examining the effect of cold exposure 16
Supplementary Table 7. Studies examining the effect of measuring blood pressure from a paretic arm 18
Supplementary Table 8. Studies examining the white-coat effect 19
Device-related sources of inaccuracy 25
Supplementary Table 9A. Studies examining the accuracy of mercury devices (vs. invasive criterion)
25
Supplementary Table 9B. Studies examining the accuracy of aneroid devices (vs. invasive criterion)
26
Supplementary Table 9C. Studies examining the accuracy of aneroid devices (vs. non-invasive criterion)
27
Supplementary Table 9D. Studies examining the accuracy of automated devices (vs. invasive criterion)
28
Supplementary Table 9E. Studies examining the accuracy of automated device models (vs. non-invasive criterion)
30
Supplementary Table 10A. Studies examining the calibration accuracy of mercury devices in clinical use 34
Supplementary Table 10B. Studies examining the calibration accuracy of aneroid devices in clinical use
35
Supplementary Table 10C. Studies examining the calibration accuracy of automated devices in clinical use 36
Procedure-related sources of inaccuracy 37
Supplementary Table 11. Studies examining the effect of rest period 37

2
Supplementary Table 12. Studies examining the effect of body position (vs. sitting) 38
Supplementary Table 13. Studies examining the effect of legs crossed at knees 40
Supplementary Table 14. Studies examining the effect of unsupported back 41
Supplementary Table 15. Studies examining the effect of unsupported arm 42
Supplementary Table 16. Studies examining the effect of arm height 43
Supplementary Table 17. Studies examining the effect of cuff size 45
Supplementary Table 18. Studies examining the effect of cuff placed over clothing 46
Supplementary Table 19. Studies examining the effect of placing the stethoscope under the cuff 47
Supplementary Table 20. Studies examining the effect of talking during measurement 48
Supplementary Table 21. Studies examining the effect of using the stethoscope bell (vs. diaphragm)
49
Supplementary Table 22. Studies examining the effect of pressure placed on the stethoscope head 50
Supplementary Table 23. Studies examining the effect of fast deflation rate 51
Supplementary Table 24. Studies examining the effect of the interval between measurements 52
Supplementary Table 25. Studies examining variability between subsequent measurements in a single session 53
Supplementary Table 26. Studies examining the effect of inter-arm variability 54
Observer-related sources of inaccuracy 56
Supplementary Table 27. Studies examining the effect of observer hearing deficit 56
Supplementary Table 28. Studies examining the effect of determining DBP from Korotkoff Phase IV (vs. V) 57
Supplementary Table 29. Studies examining the prevalence of terminal digit bias for zero 58

3
For all tables: NR = Not Reported in publication, LoA = Limits of agreement, SBP= Systolic blood pressure, DBP = Diastolic blood pressure, M/F = number of males/number of females in study
Patient-related sources of inaccuracy
Supplementary Table 1. Studies examining the effect of acute meal ingestion
Reference Country Participants N Age in y M±SD (range)
M/F Ingested food Measurement period
SBP effect in mmHg
Sig. DBP effect in mmHg
Sig. Study quality (%)
Major limitations
Ahuja et al. 200916 Australia adult volunteers
35 57±13 NR light breakfast meal with 350mL water
mean of measurements every 15min for 120min after ingestion
−0.8 ns −1.9 <.05 90 participants not sufficiently described
Taylor et al. 201417 USA healthy young adults
17 29±2 9/8
mixed meal (supplying 40% of daily resting energy expenditure)
60min after ingestion
+2 ns −2 ns
90 recruitment not sufficiently described
180min after ingestion −6 <.05 −5 <.05

4
Supplementary Table 2. Studies examining the effect of acute alcohol use
Reference Country Participants N Age in y ±SD (range)
M/F Dose Measurement period
SBP effect in mmHg
Sig. DBP effect in mmHg
Sig. Study quality (%)
Major limitations
Barden et al. 201318 Australia healthy drinkers 24 (20–65) 24/0 41g
4 hours after ingestion
−4.7 <.001 −3.9 <.001 100 no major limitations
Carter et al. 201119 USA
adult volunteers 15 23±1 12/3 1.0g/kg 30min after drink +4 <.05 +5 <.05
86
recruitment procedure not sufficiently described; random allocation procedure not sufficiently described; partial blinding of investigators reported; small sample size
adult volunteers 15 25±1 11/4 Placebo 30min after drink +5 <.05 +7 <.05
Hering et al. 201120
USA, Poland
adult normotensives 11 43±2 6/5
1.0g/kg 10min after drink +2 ns +4 ns
82
recruitment procedure not sufficiently described; randomisation method not sufficiently described; investigator blinding not reported; small sample size 13 44±2 8/5 +24 <.001 +15 <.001
Mahmud et al. 200221 Ireland
healthy normotensives
8 (21–40) 3/5 0.8g/kg
30min after drink −2 <.05 −1 <.05
86
recruitment method not sufficiently described; randomisation procedure not sufficiently described; blinding of investigators not sufficiently described; small sample size
60min after drink −3 <.05 −4 <.05
90min after drink −6 <.05 −6 <.05
Hashimoto et al. 200122 Japan healthy adults 11 34±1 11/0
0.8g/kg (Japanese vodka)
30min after drink 0 ns NR NR
81
recruitment procedure not sufficiently described; randomisation procedure not sufficiently described; blinding of investigators not reported; small sample size
120min after drink
−6 ns NR NR
0.8g/kg (red wine)
30min after drink −4 ns NR NR
120min after drink
+2 ns NR NR
Iwase et al. 199523 Japan
healthy young adult volunteers
7 25.0 ±4.7 (21–34) 6/1 0.6g/kg
5min after drink ~+5 <.05 ~+3 <.05
79
randomisation of condition (control/experimental) order was not reported; blinding of investigators was not reported; quantified results not reported in text (estimated from graph); small sample size
10min after drink ~+3 <.01 ~+2 <.05
further than 10min after drink
no effect ns no effect ns
McDougle et al. 199524 USA healthy adults 12
30.7±8.1 (22–49) 7/5 1.1ml/kg 40min after drink ~+5
<.003 vs. placebo
NR NR 82
recruitment method not sufficiently described; random order of conditions not reported; small sample size; potential order effects not controlled for
Perkins et al. 199525 USA adult smokers 18 22.3±0.7 9/9 0.5g/kg
up to 120min after drink
~+2.5 ns ~+2.5 ns 75
recruitment method not sufficiently described; randomisation procedure not sufficiently described; investigator blinding not reported; small sample size; results not reported in quantified form (had to be estimated based on figure)
Kojima et al. 199326 Japan hypertensive drinkers 21
56.5±11.8 (33–73) 21/0 1.0ml/kg
2 hours after ingestion
−21 <.001 −14 <.001 95 recruitment method not sufficiently described
Kawano et al. 199227 Japan hypertensive drinkers 16
55.2±3.3 (22–70) 16/0 1.0ml/kg
3–4 hours after ingestion −23.6 <.05 vs.
placebo −11.8 <.05 95 recruitment method not sufficiently described
Potter et al. 199128 UK
normotensive low to moderate drinkers
16 37±16.7 (20–66)
16/0
0.75g/kg maximum effect up to 3 hours after drink
+9 <.01 +16 <.01
95 no control condition hypertensive low to moderate drinkers
18 18/0 +12 <.01 +6 <.01
5
Reference Country Participants N Age in y ±SD (range)
M/F Dose Measurement period
SBP effect in mmHg
Sig. DBP effect in mmHg
Sig. Study quality (%)
Major limitations
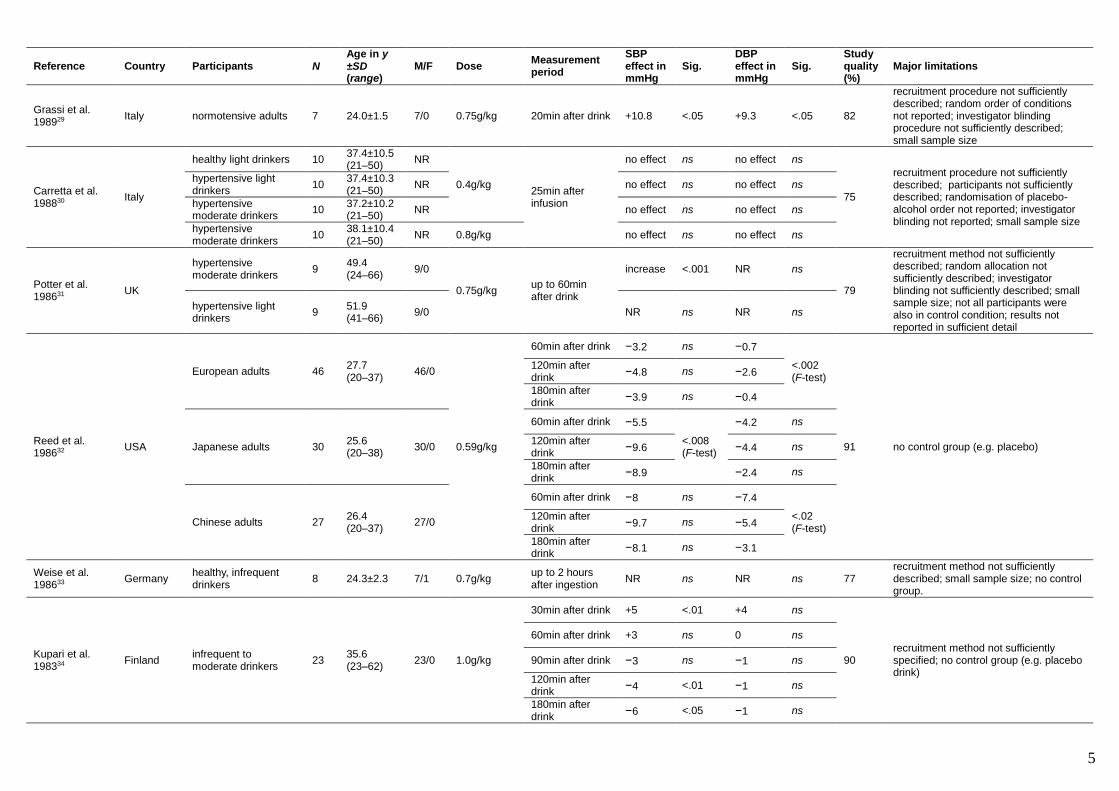
Grassi et al. 198929 Italy normotensive adults 7 24.0±1.5 7/0 0.75g/kg 20min after drink +10.8 <.05 +9.3 <.05 82
recruitment procedure not sufficiently described; random order of conditions not reported; investigator blinding procedure not sufficiently described; small sample size
Carretta et al. 198830 Italy
healthy light drinkers 10 37.4±10.5 (21–50) NR
0.4g/kg 25min after infusion
no effect ns no effect ns
75
recruitment procedure not sufficiently described; participants not sufficiently described; randomisation of placebo-alcohol order not reported; investigator blinding not reported; small sample size
hypertensive light drinkers
10 37.4±10.3 (21–50) NR no effect ns no effect ns
hypertensive moderate drinkers
10 37.2±10.2 (21–50) NR no effect ns no effect ns
hypertensive moderate drinkers
10 38.1±10.4 (21–50) NR 0.8g/kg no effect ns no effect ns
Potter et al. 198631 UK
hypertensive moderate drinkers
9 49.4 (24–66) 9/0
0.75g/kg up to 60min after drink
increase <.001 NR ns
79
recruitment method not sufficiently described; random allocation not sufficiently described; investigator blinding not sufficiently described; small sample size; not all participants were also in control condition; results not reported in sufficient detail
hypertensive light drinkers
9 51.9 (41–66) 9/0 NR ns NR ns
Reed et al. 198632 USA
European adults 46 27.7 (20–37) 46/0
0.59g/kg
60min after drink −3.2 ns −0.7
<.002 (F-test)
91 no control group (e.g. placebo)
120min after drink
−4.8 ns −2.6
180min after drink
−3.9 ns −0.4
Japanese adults 30 25.6 (20–38) 30/0
60min after drink −5.5
<.008 (F-test)
−4.2 ns
120min after drink
−9.6 −4.4 ns
180min after drink
−8.9 −2.4 ns
Chinese adults 27 26.4 (20–37) 27/0
60min after drink −8 ns −7.4
<.02 (F-test)
120min after drink
−9.7 ns −5.4
180min after drink
−8.1 ns −3.1
Weise et al. 198633 Germany
healthy, infrequent drinkers
8 24.3±2.3 7/1 0.7g/kg up to 2 hours after ingestion
NR ns NR ns 77 recruitment method not sufficiently described; small sample size; no control group.
Kupari et al. 198334 Finland
infrequent to moderate drinkers
23 35.6 (23–62) 23/0 1.0g/kg
30min after drink +5 <.01 +4 ns
90 recruitment method not sufficiently specified; no control group (e.g. placebo drink)
60min after drink +3 ns 0 ns
90min after drink −3 ns −1 ns
120min after drink
−4 <.01 −1 ns
180min after drink
−6 <.05 −1 ns
6
Reference Country Participants N Age in y ±SD (range)
M/F Dose Measurement period
SBP effect in mmHg
Sig. DBP effect in mmHg
Sig. Study quality (%)
Major limitations
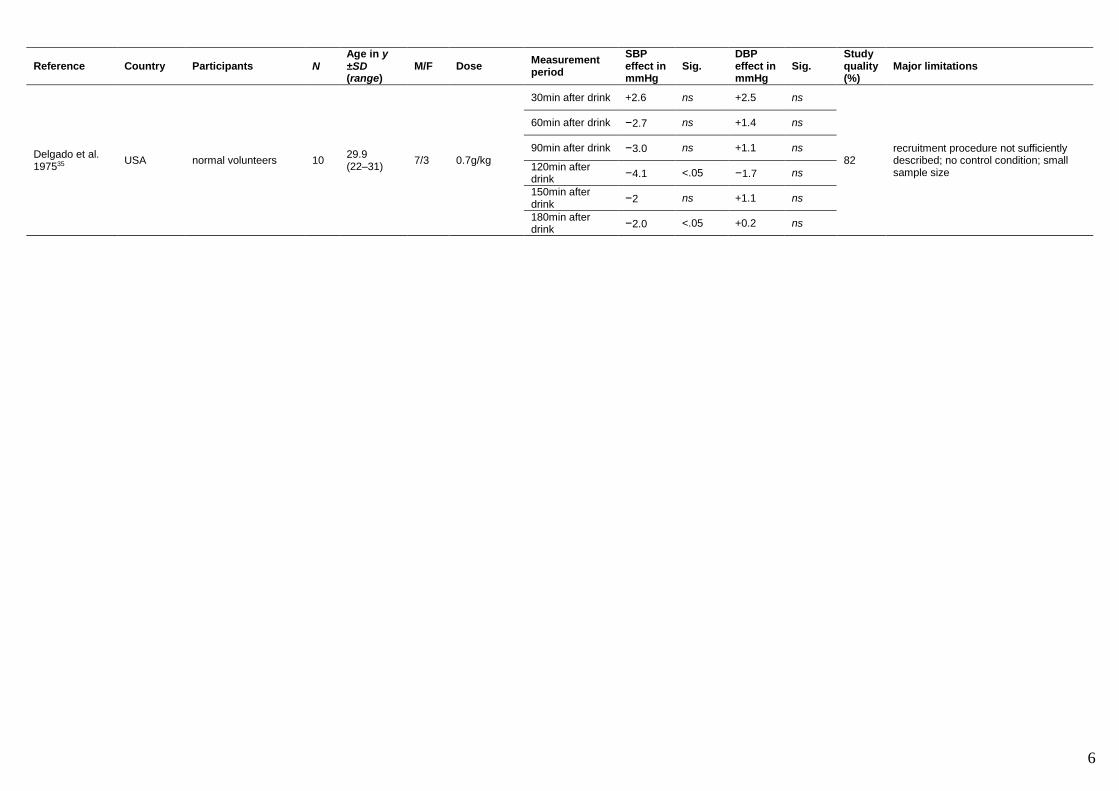
Delgado et al. 197535 USA normal volunteers 10
29.9 (22–31) 7/3 0.7g/kg
30min after drink +2.6 ns +2.5 ns
82 recruitment procedure not sufficiently described; no control condition; small sample size
60min after drink −2.7 ns +1.4 ns
90min after drink −3.0 ns +1.1 ns
120min after drink
−4.1 <.05 −1.7 ns
150min after drink
−2 ns +1.1 ns
180min after drink
−2.0 <.05 +0.2 ns

7
Supplementary Table 3. Studies examining the effect of acute caffeine use
Reference Country Participants N Age in y M±SD (range)
M/F Dosage Measurement period (after ingestion)
SBP effect in mmHg
Sig. DBP effect in mmHg
Sig. Study quality (%)
Major limitations
Grasser et al.40 Switzerland healthy young adults 25
22.5±0.6 (20–31) 13/12 114mg
mean of measurements over 120min
+3.3 <.005 +4.1 <.005 86 subjects not blinded; investigator blinding not reported
Buscemi et al. 201141 Italy adult volunteers 40 21–49 19/21 130mg
30min +5 <.05 +4 <.001 100 no major limitations
60min +4 <.05 +3 <.001
McMullen et al. 201142 UK
participants in supine position
12 36±7.8 (25–57) 2/10
67mg
mean of measurements 30min and 60min
+8.9 <.05 +1.1 ns
93
randomisation procedure not sufficiently described; investigator blinding procedure not sufficiently described
133mg +10.8 <.05 +2.2 ns
200mg +5.5 ns +1.3 ns
participants in upright position
67mg +8.0 <.05 +2.8 <.05
133mg +10.7 <.05 +5.1 <.01
200mg +5.2 ns +2.4 ns
Buscemi et al. 201043 Italy
healthy adult volunteers
20 31±2 (21–49) 10/10 130mg
30min +3 <.05 +4 <.05 100 no major limitations
60min +3 <.05 +4 <.05
Arciero et al. 200944 USA
older healthy moderate caffeine consumers
10 55.0±5 (50–67) 0/10
5mg/kg (fat free mass)
15–90min
+4 <.05 +3 <.05
89
recruitment procedure not sufficiently described; randomisation procedure not sufficiently described; investigator blinding procedure not sufficiently described
younger healthy moderate caffeine consumers
10 19.0±1.5 (18–22) 0/10 no effect ns +3 <.05
Ozkan et al. 200845 Turkey healthy adults 23 27.69±6.27 13/10 300mg 60min +4.78 ns +0.87 ns 86
recruitment procedure not described; randomisation procedure not sufficiently described; Investigator blinding procedure not sufficiently described
Hodgson et al. 200546 Australia
adults with history of coronary artery disease
20 62.1 ± 6.2 NR 150mg 30min +9.4 <.05 +3.0 <.05 100 no major limitations
Karatzis et al. 200547 Greece
healthy adult nonsmoking caffeine users
16 29±3.2 (24–38) 8/8 80mg
60min no effect ns ~+4 <.01
86
recruitment not described; randomisation procedure not sufficiently described; investigator blinding procedure not sufficiently described
90min no effect ns ~+4 <.05
Vlachopo-ulos et al. 200248
Greece treated hypertensive 10 62±7 NR 250mg 30–180min +11.4 <.05 +7.7 <.05 82
recruitment not described; participants not sufficiently described; randomisation procedure not described; small sample size
Watson et al. 200249 UK
caffeine naive 14 23–38 7/7 200mg 30min
+8.7 <.05 +5.5 <.05 86
recruitment not sufficiently described; randomisation and blinding procedures not sufficiently described caffeine repletes +4.5 <.05 +1.1 NR

8
Reference Country Participants N Age in y M±SD (range)
M/F Dosage Measurement period (after ingestion)
SBP effect in mmHg
Sig. DBP effect in mmHg
Sig. Study quality (%)
Major limitations
Mahmud et al. 200150 Ireland healthy adults 7 26±2.6 3/4 150mg
30min ~+9 ns ~+7 <.05
81
recruitment procedure not described; randomisation procedure not sufficiently described; Investigator blinding not sufficiently described; values of results not stated in text (estimated from graph)
60min ~+7 ns ~+6 <.05
90min ~+9 ns ~+8 <.05
Shepard et al. 200051 USA
high risk of hypertensions
11 24±0.5 11/0 3.3mg/kg
0–300min +3 <.05 +3 <.05
86
recruitment not sufficiently described; participants not sufficiently described; no mention of randomisation
low risk of hypertension
20 24±0.6 20/0 3.3mg/kg +5 <.05 +4 <.05
Hodgson et al. 199952 Australia
healthy adult nonsmokers
20 56.2±1.1 (35–73) 20/0 180mg
30min +6.6 <.05 +3.5 <.05 100 no major limitations
60min +6.7 <.05 +4.7 <.05
Bender et al. 199753 USA normotensives 12
23.6±1.4 (21–26) 6/6 5mg/kg
90min +2 ns 0 ns
93
recruitment method not sufficiently described; randomisation process not sufficiently described
180min +7 ns +4 ns
270min +9 ns +2 ns
Lovallo et al. 199654 USA
borderline hypertensives 24 28±0.9 24/0
placebo
40min
+1 ns +1 ns
89 no random allocation; recruitment not sufficiently described
3.3mg/kg +6 <.05 +4 <.05
normotensives 24 30±1.2 24/0 placebo +2 ns −1 ns
3.3mg/kg +11 <.05 +8 <.05
Pincomb et al. 199655 USA
normotensives (protocol 1)
23
20–39
23/0
3.3mg/kg 40min
+7 <.0001 +5 <.0001
89
randomisation of placebo / caffeine order not reported; investigator blinding procedure not sufficiently described
normotensives (protocol 2)
+7 <.0001 +4 <.0001
borderline hypertensives (protocol 1)
24 24/0
+10 <.0001 +9 <.0001
borderline hypertensives (protocol 2)
+8 <.0001 +8 <.0001
Hasenfratz et al. 199456 Switzerland
nonsmoking coffee drinkers
20 33.4 ± 7.0 (23–44) 0/20
1.5mg/kg
>30min
~+10 <.001 ~+7 <.01
85 investigator blinding not reported; subject blinding not reported
3.0mg/kg ~+8 <.01 ~+7 <.05
6.0mg/kg ~+5 ns ~+4 ns
Sung et al. 199457 USA
normotensive 12 30–45 12/0 3.3mg/kg
30–180min +9 <.001 +8 <.001
86
recruitment not sufficiently described; participants not sufficiently described; no mention of randomisation hypertensive 18 24±0.6 18/0 3.3mg/kg +12 <.001 +11 <.001
Haigh et al. 199358 UK
normotensives supine
8 73.8±6.0 (67–82) 4/4
250mg vs. placebo
90min +12.1 .008 +7.4 <.001
82
recruitment not sufficiently described; randomisation and blinding processes not described; small sample size
normotensives standing
+9.7 .038 +8 .013
Casiglia et al. 199159 Italy
normotensive non-coffee drinkers
15 24–30 4/11 200mg
30min +0.5 ns +0.6 ns
86
randomisation procedure not explained; blinding procedures not explained; investigator blinding not apparent
60min +2.5 ns +2.1 <.05
90min −2.5 ns +4.4 <.05
120min −5 ns +6.7 <.05
9
Reference Country Participants N Age in y M±SD (range)
M/F Dosage Measurement period (after ingestion)
SBP effect in mmHg
Sig. DBP effect in mmHg
Sig. Study quality (%)
Major limitations
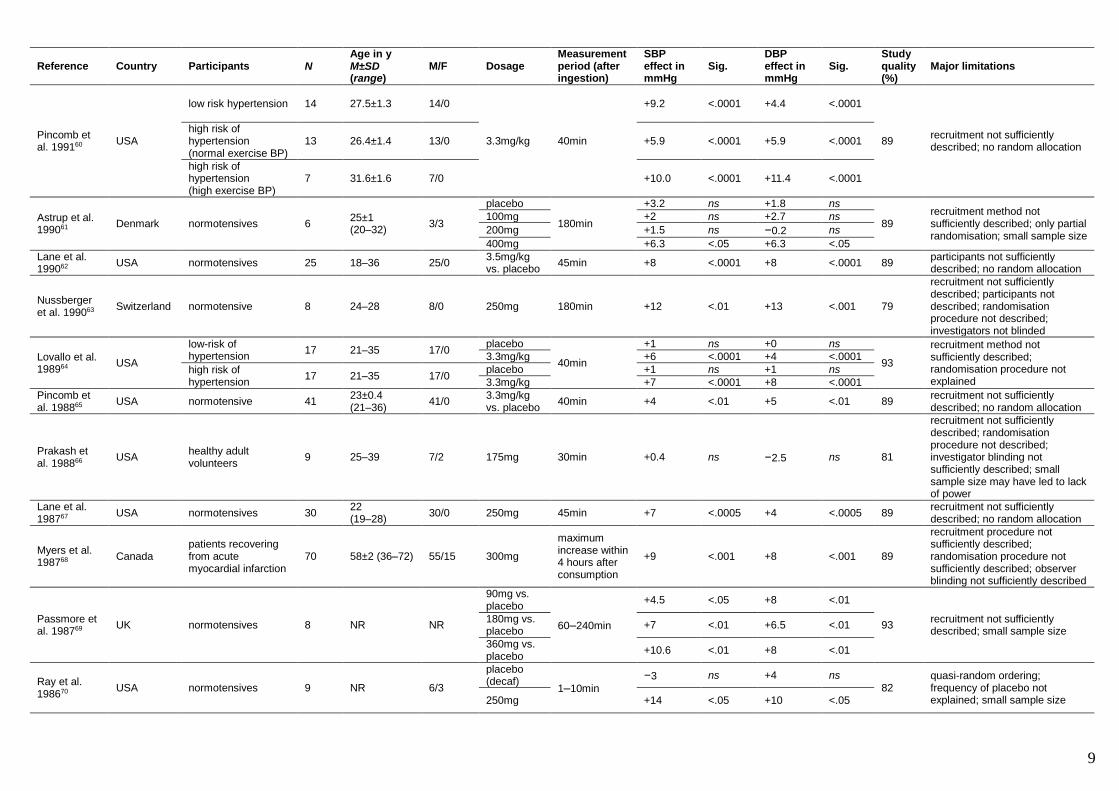
Pincomb et al. 199160 USA
low risk hypertension 14 27.5±1.3 14/0
3.3mg/kg 40min
+9.2 <.0001 +4.4 <.0001
89 recruitment not sufficiently described; no random allocation
high risk of hypertension (normal exercise BP)
13 26.4±1.4 13/0 +5.9 <.0001 +5.9 <.0001
high risk of hypertension (high exercise BP)
7 31.6±1.6 7/0 +10.0 <.0001 +11.4 <.0001
Astrup et al. 199061 Denmark normotensives 6
25±1 (20–32) 3/3
placebo
180min
+3.2 ns +1.8 ns
89 recruitment method not sufficiently described; only partial randomisation; small sample size
100mg +2 ns +2.7 ns
200mg +1.5 ns −0.2 ns
400mg +6.3 <.05 +6.3 <.05
Lane et al. 199062 USA normotensives 25 18–36 25/0
3.5mg/kg vs. placebo
45min +8 <.0001 +8 <.0001 89 participants not sufficiently described; no random allocation
Nussberger et al. 199063 Switzerland normotensive 8 24–28 8/0 250mg 180min +12 <.01 +13 <.001 79
recruitment not sufficiently described; participants not described; randomisation procedure not described; investigators not blinded
Lovallo et al. 198964 USA
low-risk of hypertension
17 21–35 17/0 placebo
40min
+1 ns +0 ns
93
recruitment method not sufficiently described; randomisation procedure not explained
3.3mg/kg +6 <.0001 +4 <.0001
high risk of hypertension
17 21–35 17/0 placebo +1 ns +1 ns
3.3mg/kg +7 <.0001 +8 <.0001
Pincomb et al. 198865 USA normotensive 41
23±0.4 (21–36) 41/0
3.3mg/kg vs. placebo 40min +4 <.01 +5 <.01 89
recruitment not sufficiently described; no random allocation
Prakash et al. 198866 USA
healthy adult volunteers
9 25–39 7/2 175mg 30min +0.4 ns −2.5 ns 81
recruitment not sufficiently described; randomisation procedure not described; investigator blinding not sufficiently described; small sample size may have led to lack of power
Lane et al. 198767 USA normotensives 30
22 (19–28) 30/0 250mg 45min +7 <.0005 +4 <.0005 89
recruitment not sufficiently described; no random allocation
Myers et al. 198768 Canada
patients recovering from acute myocardial infarction
70 58±2 (36–72) 55/15 300mg
maximum increase within 4 hours after consumption
+9 <.001 +8 <.001 89
recruitment procedure not sufficiently described; randomisation procedure not sufficiently described; observer blinding not sufficiently described
Passmore et al. 198769 UK normotensives 8 NR NR
90mg vs. placebo
60–240min
+4.5 <.05 +8 <.01
93 recruitment not sufficiently described; small sample size
180mg vs. placebo
+7 <.01 +6.5 <.01
360mg vs. placebo
+10.6 <.01 +8 <.01
Ray et al. 198670 USA normotensives 9 NR 6/3
placebo (decaf)
1–10min −3 ns +4 ns
82 quasi-random ordering; frequency of placebo not explained; small sample size 250mg +14 <.05 +10 <.05
10
Reference Country Participants N Age in y M±SD (range)
M/F Dosage Measurement period (after ingestion)
SBP effect in mmHg
Sig. DBP effect in mmHg
Sig. Study quality (%)
Major limitations
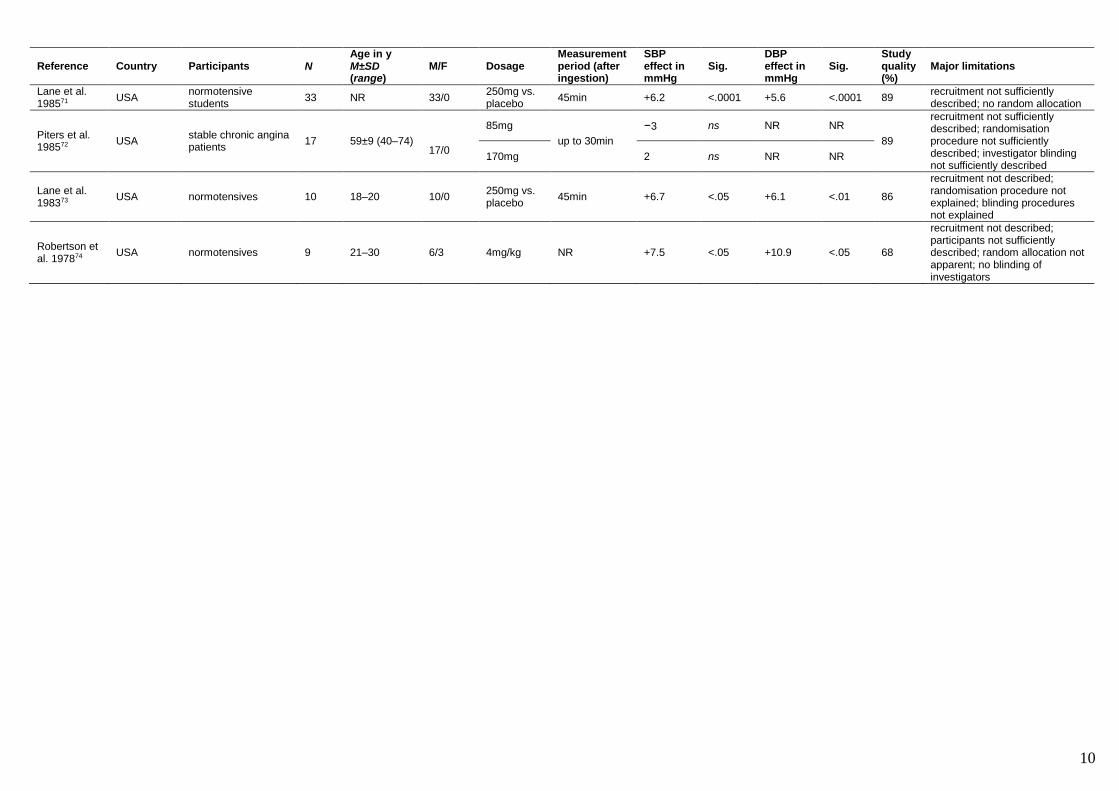
Lane et al. 198571 USA
normotensive students
33 NR 33/0 250mg vs. placebo
45min +6.2 <.0001 +5.6 <.0001 89 recruitment not sufficiently described; no random allocation
Piters et al. 198572 USA
stable chronic angina patients
17 59±9 (40–74) 17/0
85mg
up to 30min
−3 ns NR NR
89
recruitment not sufficiently described; randomisation procedure not sufficiently described; investigator blinding not sufficiently described
170mg 2 ns NR NR
Lane et al. 198373 USA normotensives 10 18–20 10/0
250mg vs. placebo
45min +6.7 <.05 +6.1 <.01 86
recruitment not described; randomisation procedure not explained; blinding procedures not explained
Robertson et al. 197874 USA normotensives 9 21–30 6/3 4mg/kg NR +7.5 <.05 +10.9 <.05 68
recruitment not described; participants not sufficiently described; random allocation not apparent; no blinding of investigators
11
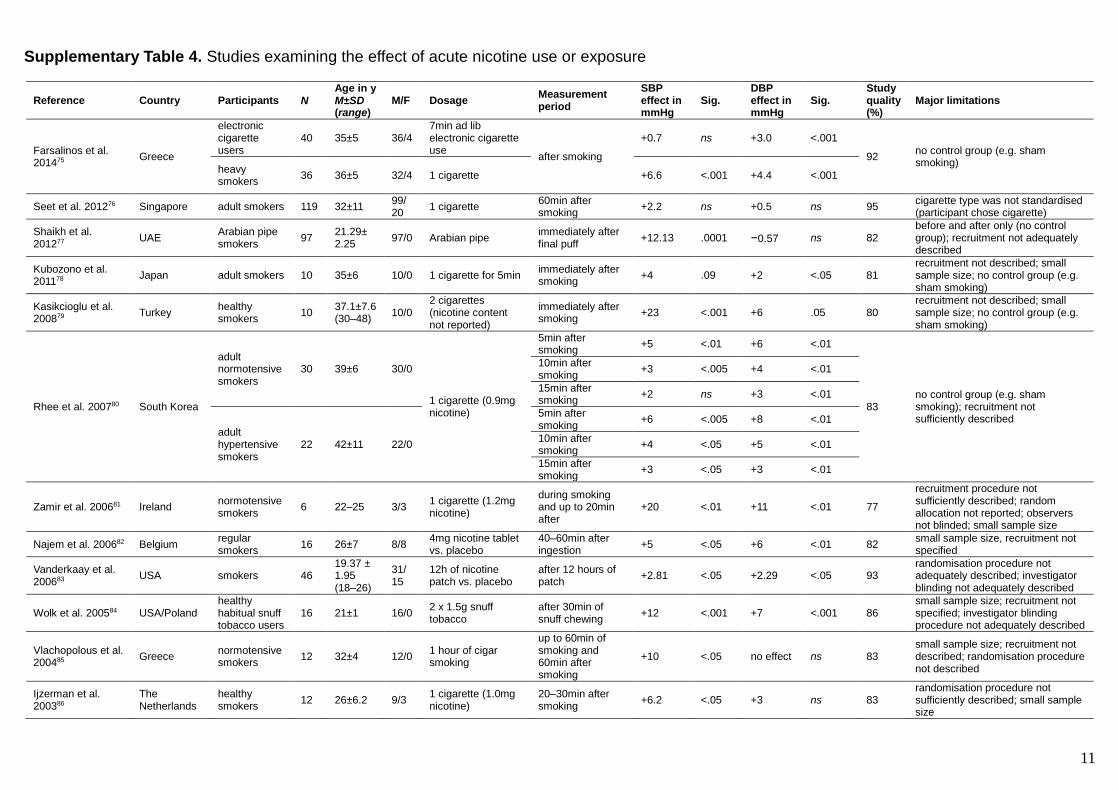
Supplementary Table 4. Studies examining the effect of acute nicotine use or exposure
Reference Country Participants N Age in y M±SD (range)
M/F Dosage Measurement period
SBP effect in mmHg
Sig. DBP effect in mmHg
Sig. Study quality (%)
Major limitations
Farsalinos et al. 201475 Greece
electronic cigarette users
40 35±5 36/4 7min ad lib electronic cigarette use
after smoking
+0.7 ns +3.0 <.001
92 no control group (e.g. sham smoking)
heavy smokers
36 36±5 32/4 1 cigarette +6.6 <.001 +4.4 <.001
Seet et al. 201276 Singapore adult smokers 119 32±11 99/ 20
1 cigarette 60min after smoking
+2.2 ns +0.5 ns 95 cigarette type was not standardised (participant chose cigarette)
Shaikh et al. 201277 UAE
Arabian pipe smokers
97 21.29± 2.25
97/0 Arabian pipe immediately after final puff
+12.13 .0001 −0.57 ns 82 before and after only (no control group); recruitment not adequately described
Kubozono et al. 201178 Japan adult smokers 10 35±6 10/0 1 cigarette for 5min
immediately after smoking
+4 .09 +2 <.05 81 recruitment not described; small sample size; no control group (e.g. sham smoking)
Kasikcioglu et al. 200879 Turkey
healthy smokers
10 37.1±7.6 (30–48) 10/0
2 cigarettes (nicotine content not reported)
immediately after smoking
+23 <.001 +6 .05 80 recruitment not described; small sample size; no control group (e.g. sham smoking)
Rhee et al. 200780 South Korea
adult normotensive smokers
30 39±6 30/0
1 cigarette (0.9mg nicotine)
5min after smoking
+5 <.01 +6 <.01
83 no control group (e.g. sham smoking); recruitment not sufficiently described
10min after smoking
+3 <.005 +4 <.01
15min after smoking
+2 ns +3 <.01
adult hypertensive smokers
22 42±11 22/0
5min after smoking
+6 <.005 +8 <.01
10min after smoking
+4 <.05 +5 <.01
15min after smoking
+3 <.05 +3 <.01
Zamir et al. 200681 Ireland normotensive smokers
6 22–25 3/3 1 cigarette (1.2mg nicotine)
during smoking and up to 20min after
+20 <.01 +11 <.01 77
recruitment procedure not sufficiently described; random allocation not reported; observers not blinded; small sample size
Najem et al. 200682 Belgium regular smokers
16 26±7 8/8 4mg nicotine tablet vs. placebo
40–60min after ingestion +5 <.05 +6 <.01 82
small sample size, recruitment not specified
Vanderkaay et al. 200683 USA smokers 46
19.37 ± 1.95 (18–26)
31/ 15
12h of nicotine patch vs. placebo
after 12 hours of patch
+2.81 <.05 +2.29 <.05 93 randomisation procedure not adequately described; investigator blinding not adequately described
Wolk et al. 200584 USA/Poland healthy habitual snuff tobacco users
16 21±1 16/0 2 x 1.5g snuff tobacco
after 30min of snuff chewing
+12 <.001 +7 <.001 86 small sample size; recruitment not specified; investigator blinding procedure not adequately described
Vlachopolous et al. 200485 Greece
normotensive smokers
12 32±4 12/0 1 hour of cigar smoking
up to 60min of smoking and 60min after smoking
+10 <.05 no effect ns 83 small sample size; recruitment not described; randomisation procedure not described
Ijzerman et al. 200386
The Netherlands
healthy smokers
12 26±6.2 9/3 1 cigarette (1.0mg nicotine)
20–30min after smoking +6.2 <.05 +3 ns 83
randomisation procedure not sufficiently described; small sample size

12
Reference Country Participants N Age in y M±SD (range)
M/F Dosage Measurement period
SBP effect in mmHg
Sig. DBP effect in mmHg
Sig. Study quality (%)
Major limitations
Mahmud et al. 200387 Ireland
nonsmokers 17 22±4 8/9
1 cigarette (1.2mg nicotine)
5min after smoking
~+8
<.001 (F-test)
~+6
<.001 (F-test)
75
recruitment not described; allocation to control (sham-smoking) group not described; only small subset participated in sham smoking; results not reported in adequate detail, data only presented in figure
10min after smoking
~+5 ~+4
15min after smoking
~+2 ~+4
smokers 11 22±4 6/5
5min after smoking
~+9
<.001 (F-test)
~+5
<.001 (F-test)
10min after smoking
~+4 ~+4
15min after smoking
~+4 ~+2
Malson et al. 200288 USA
adult smokers
12 22 (19–26) 3/9
unfiltered bidi cigarette (4.0mg nicotine) immediately after
smoking
+6.7 ns +7.5 ns
95 small sample size conventional cigarette (13mg nicotine)
+5.4 ns +7.3 <.025
Halimi et al. 200089 France healthy nonsmokers
10 26±4 NR nicotine gum (4mg nicotine)
during to 60min of chewing
+7 <.05 +8 <.05 71
recruitment not sufficiently described; participants not adequately described; small sample size; randomisation procedure not sufficiently described; investigators not blinded; participants not blinded
Freestone et al. 199590 UK
untreated hypertensives
8 40±3.6 6/2 2 cigarettes (3.4mg nicotine)
15min after smoking
+10 NR +8 NR
82 small sample size, recruitment not specified, results lacking detail treated
hypertensives
8 57±4.6 5/3 2 cigarettes (3.4mg nicotine)
+10 NR +8 NR
Efstratopoulos et al. 199391 Greece
normotensive smokers
20 26–47 12/8 1 cigarette (1.1mg nicotine) every 20min for 1 hour
during smoking period
+4.8 <.01 +3.47 <.01
82 recruitment procedure not described; no control group (e.g. sham smoking)
hypertensive smokers
18 40–50 10/8 +15 <.01 +10.5 <.01
Kool et al. 199392 The Netherlands
smokers 12 37 (25–55) 9/3
1 cigarette (1.3mg nicotine)
immediately after smoking
+6 <.001 +4 <.001 86 recruitment not described; no control group (e.g. sham smoking)
Brunel et al. 199293 France normotensive nonsmokers
6
26±5 (19–36) 6/0
2 cigarettes (2.68mg nicotine)
10min after smoking
+10 <.001 +7 <.001 73
recruitment not described; small sample size; order of conditions (sham smoking and tobacco smoking) not controlled
Groppelli et al. 199294 Italy
smokers (20+ per day)
10 33.4±1.3 (25–45) NR
4 cigarettes over one hour
60min of smoking +20.8 <.01 +7.4 <.01 82 inadequate sample size, recruitment not specified, results lacking detail
Kyriakides et al. 199295 Greece
coronary heart disease patients
20 (29–67) 19/1
1 cigarette (1.35mg nicotine)
immediately after smoking
+14 .005 +10 .006
95 recruitment not adequately described
healthy adults
20 (23–63) 20/0 +25 <.0001 +7 .01

13
Reference Country Participants N Age in y M±SD (range)
M/F Dosage Measurement period
SBP effect in mmHg
Sig. DBP effect in mmHg
Sig. Study quality (%)
Major limitations
Ray et al. 198670 USA
regular smokers and coffee drinkers
9 NR 6/3 1 cigarette 1–10min after smoking +3.9 <.05 +11.5 <.05 86
small sample size, participants not described adequately
Benowitz et al. 198496 USA
adult smokers
10 39 (21–63) 6/4
high nicotine cigarette (2.5mg nicotine)
5min after smoking
+9.9 <.05 +4.8 ns
86 small sample size, recruitment not specified
low nicotine cigarette (0.4mg nicotine)
+2.1 ns +1.9 ns
usual cigarette (unknown nicotine content)
+10.1 <.05 +7.7 <.05
Pijpers et al. 198497
The Netherlands
pregnant smokers
9 NR 0/9 1 cigarette (1.0mg nicotine)
5min after smoking
+4.8 <.05 +4.4 ns
83
recruitment not adequately described; participants not adequately described; randomisation procedure not sufficiently described; small sample size
10min after smoking
+3.5 <.05 +2.9 ns
15min after smoking
+3.5 <.05 +1.5 ns
20min after smoking
+1.6 ns +0.8 ns
25min after smoking
+0.4 ns +0.8 ns
30min after smoking
+1.2 ns −1.2 ns
Rabinowitz et al. 197998 USA
adult volunteers
16 (18–35) 10/6
10 puffs of high nicotine cigarette (2.5mg nicotine) within 2min of last
puff
+11 <.001 +9 <.001
82
recruitment not sufficiently described; randomisation procedure not sufficiently described; small sample size
10 puffs of low nicotine cigarette (0<0.02mg nicotine)
+5 <.001 +6 <.001
Diamond et al. 197199 USA
nonsmokers 10
(19–44) 8/12 4cm of 1 cigarette (2.22mg nicotine)
immediately after smoking
+5.4 ns +4.9 ns
82 recruitment procedure not described; no control group (e.g. sham smoking)
moderate smokers
10 −5.6 ns +3.4 ns
heavy smokers
10 +8.1 <.001 +7.4 <.005
Yarlioglues et al. 2010100 Turkey
healthy nonsmokers
39 26±5 0/30 passive smoking after 30min of exposure
+22 <.05 +18 <.05 82
recruitment not sufficiently described; no control group without smoke exposure (only before and after)
Argacha et al. 2008101 Belgium
healthy nonsmokers
11 24.6±3 11/0 1 hour passive exposure to tobacco smoke
during and immediately after exposure
no effect ns no effect ns 79
recruitment procedure not described; investigators not blinded; randomisation procedure not sufficiently described
Flouris et al. 2008102 Greece
male adults 14 26.46 ±4.4
14/0 1 hour passive smoking exposure
5min after exposure
+3.13 ns +1.33 ns 96
recruitment procedure not sufficiently described
female adults 14 0/14 +0.07 ns −0.67 ns
14
Reference Country Participants N Age in y M±SD (range)
M/F Dosage Measurement period
SBP effect in mmHg
Sig. DBP effect in mmHg
Sig. Study quality (%)
Major limitations
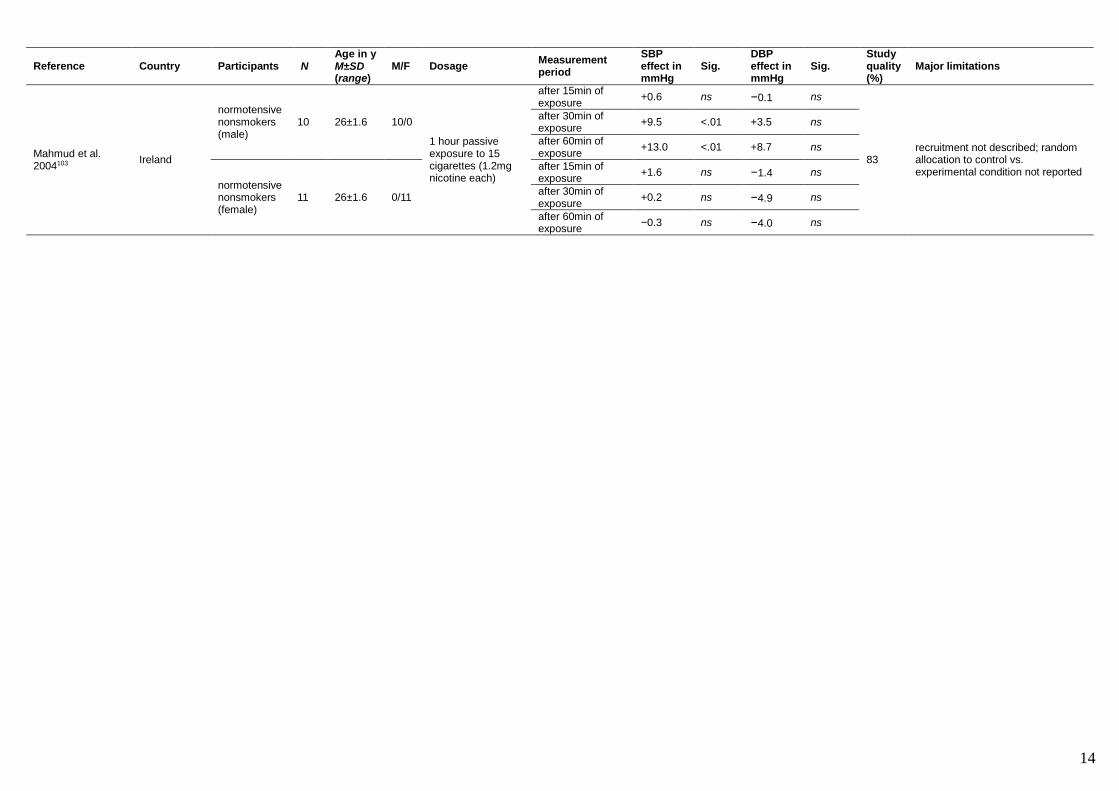
Mahmud et al. 2004103 Ireland
normotensive nonsmokers (male)
10 26±1.6 10/0
1 hour passive exposure to 15 cigarettes (1.2mg nicotine each)
after 15min of exposure
+0.6 ns −0.1 ns
83 recruitment not described; random allocation to control vs. experimental condition not reported
after 30min of exposure
+9.5 <.01 +3.5 ns
after 60min of exposure
+13.0 <.01 +8.7 ns
normotensive nonsmokers (female)
11 26±1.6 0/11
after 15min of exposure
+1.6 ns −1.4 ns
after 30min of exposure
+0.2 ns −4.9 ns
after 60min of exposure
−0.3 ns −4.0 ns
15
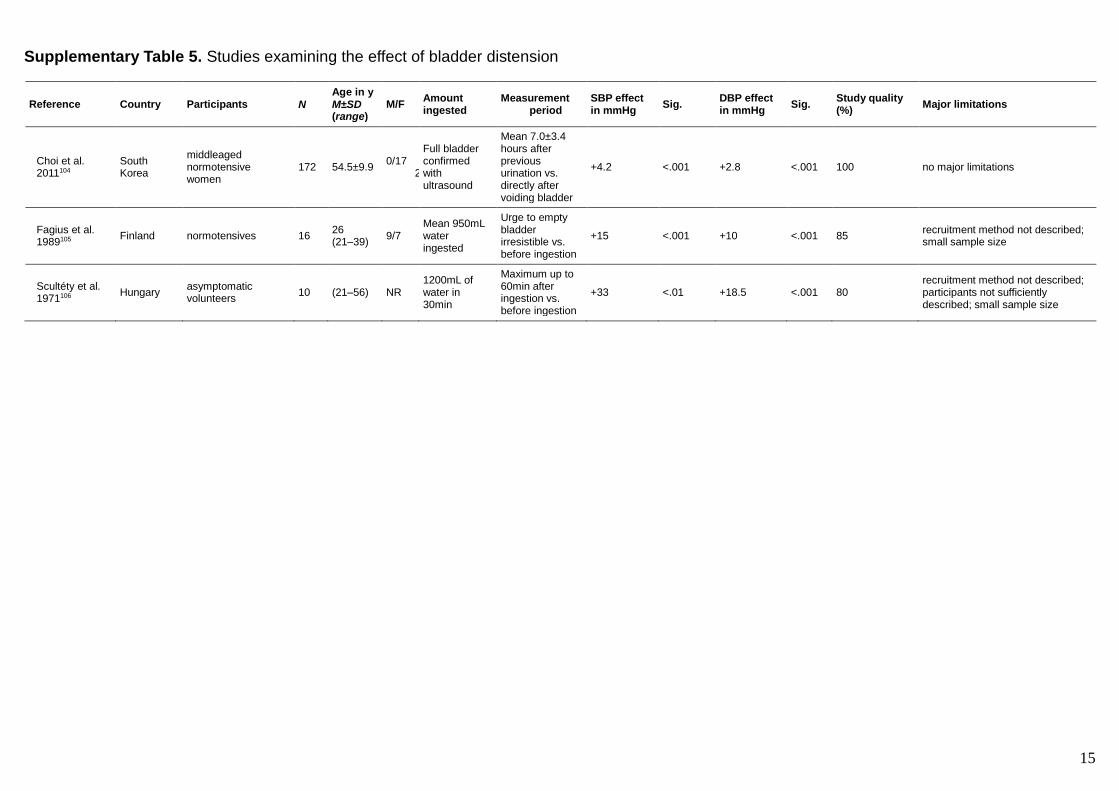
Supplementary Table 5. Studies examining the effect of bladder distension
Reference Country Participants N Age in y M±SD (range)
M/F Amount ingested
Measurement period
SBP effect in mmHg
Sig. DBP effect in mmHg
Sig. Study quality (%)
Major limitations
Choi et al. 2011104
South Korea
middleaged normotensive women
172 54.5±9.9 0/17
2
Full bladder confirmed with ultrasound
Mean 7.0±3.4 hours after previous urination vs. directly after voiding bladder
+4.2 <.001 +2.8 <.001 100 no major limitations
Fagius et al. 1989105 Finland normotensives 16
26 (21–39) 9/7
Mean 950mL water ingested
Urge to empty bladder irresistible vs. before ingestion
+15 <.001 +10 <.001 85 recruitment method not described; small sample size
Scultéty et al. 1971106 Hungary
asymptomatic volunteers
10 (21–56) NR 1200mL of water in 30min
Maximum up to 60min after ingestion vs. before ingestion
+33 <.01 +18.5 <.001 80 recruitment method not described; participants not sufficiently described; small sample size
16
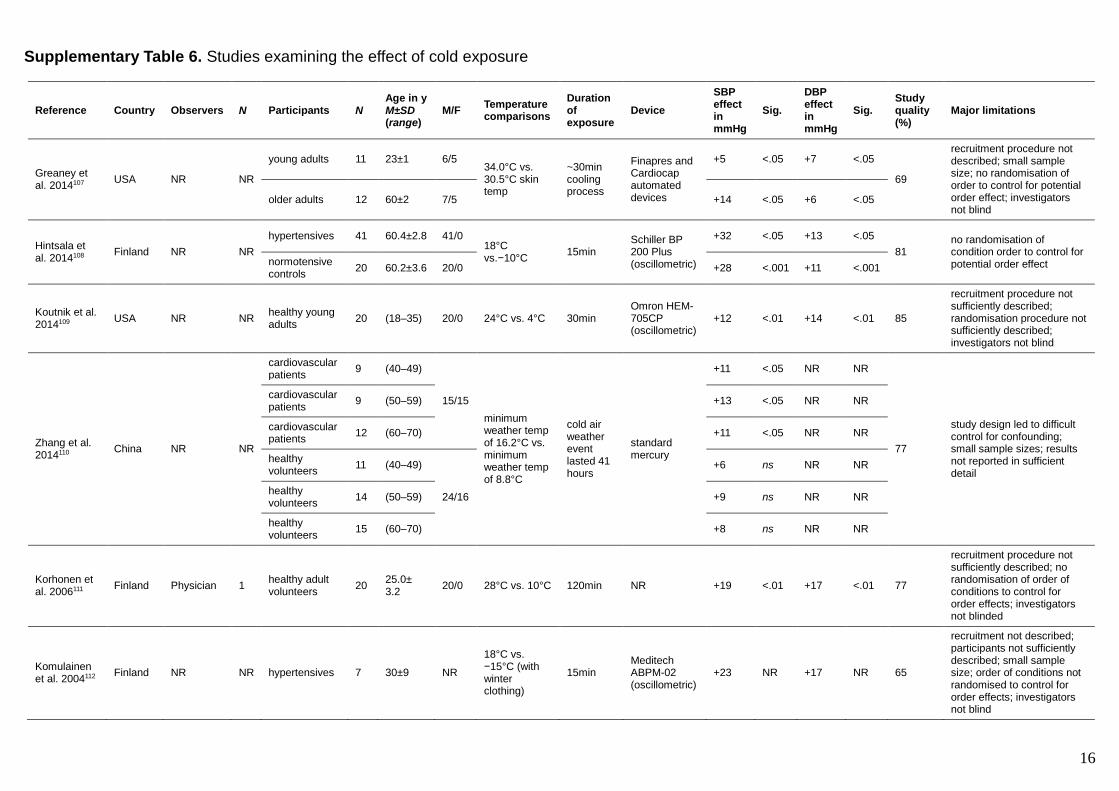
Supplementary Table 6. Studies examining the effect of cold exposure
Reference Country Observers N Participants N Age in y M±SD (range)
M/F Temperature comparisons
Duration of exposure
Device
SBP effect in mmHg
Sig.
DBP effect in mmHg
Sig. Study quality (%)
Major limitations
Greaney et al. 2014107 USA NR NR
young adults 11 23±1 6/5 34.0°C vs. 30.5°C skin temp
~30min cooling process
Finapres and Cardiocap automated devices
+5 <.05 +7 <.05
69
recruitment procedure not described; small sample size; no randomisation of order to control for potential order effect; investigators not blind
older adults 12 60±2 7/5 +14 <.05 +6 <.05
Hintsala et al. 2014108 Finland NR NR
hypertensives 41 60.4±2.8 41/0 18°C vs.−10°C 15min
Schiller BP 200 Plus (oscillometric)
+32 <.05 +13 <.05
81 no randomisation of condition order to control for potential order effect normotensive
controls 20 60.2±3.6 20/0 +28 <.001 +11 <.001
Koutnik et al. 2014109 USA NR NR
healthy young adults
20 (18–35) 20/0 24°C vs. 4°C 30min Omron HEM-705CP (oscillometric)
+12 <.01 +14 <.01 85
recruitment procedure not sufficiently described; randomisation procedure not sufficiently described; investigators not blind
Zhang et al. 2014110 China NR NR
cardiovascular patients
9 (40–49)
15/15
minimum weather temp of 16.2°C vs. minimum weather temp of 8.8°C
cold air weather event lasted 41 hours
standard mercury
+11 <.05 NR NR
77
study design led to difficult control for confounding; small sample sizes; results not reported in sufficient detail
cardiovascular patients
9 (50–59) +13 <.05 NR NR
cardiovascular patients
12 (60–70) +11 <.05 NR NR
healthy volunteers
11 (40–49)
24/16
+6 ns NR NR
healthy volunteers
14 (50–59) +9 ns NR NR
healthy volunteers
15 (60–70) +8 ns NR NR
Korhonen et al. 2006111 Finland Physician 1
healthy adult volunteers
20 25.0± 3.2
20/0 28°C vs. 10°C 120min NR +19 <.01 +17 <.01 77
recruitment procedure not sufficiently described; no randomisation of order of conditions to control for order effects; investigators not blinded
Komulainen et al. 2004112 Finland NR NR hypertensives 7 30±9 NR
18°C vs. −15°C (with winter clothing)
15min Meditech ABPM-02 (oscillometric)
+23 NR +17 NR 65
recruitment not described; participants not sufficiently described; small sample size; order of conditions not randomised to control for order effects; investigators not blind

17
Reference Country Observers N Participants N Age in y M±SD (range)
M/F Temperature comparisons
Duration of exposure
Device
SBP effect in mmHg
Sig.
DBP effect in mmHg
Sig. Study quality (%)
Major limitations
Komulainen et al. 2000113 Finland NR NR
hypertensives 10 27±8 8/2 18°C vs. −15°C (with winter clothing)
15min Meditech ABPM-02 (oscillometric)
+27 (peak)
<.001 +21 (peak)
<.001
77
small sample size; order of conditions not randomised to control for order effects; investigators not blind to normotensives 12 24±3 7/5
+26 (peak)
<.001 +23 (peak)
<.001
Kawahara et al. 1989114 Japan NR NR
healthy volunteers
10 33.3±5.3 10/0 12.2°C vs. 24.4°C room temperature
180min unspecified automated
+14.3 <.05 +14.8 <.001 75
recruitment not specified; no randomisation to control for order effects; small sample size
Scriven et al. 1984115 UK NR NR
healthy volunteers
6 27±4
6/0
exposed to 4–5°C vs. under blankets in same temperature
5min
Roche Arteriosonde
+6 <.05 +4 <.05
65
recruitment not specified; observers not blind; small sample size; order not randomised
10min +9 <.02 +5 ns
15min +10 <.01 +7 <.01
20min +12 <.01 +7 <.05
25min +11 <.01 +8 <.01
30min +11 <.01 +9 <.01

18
Supplementary Table 7. Studies examining the effect of measuring blood pressure from a paretic arm
Reference Country Observers N Participants N Age in y M±SD (range)
M/F Measures per condition
Device SBP difference (mmHg)
Sig. DBP difference (mmHg)
Sig. Study quality (%)
Major limitations
Dewar et al. 1992116 UK NR NR stroke patients 103 77 (55–95) 38/65 3
random-zero mercury
−1.1 ns −1.1 ns 92 investigators not blinded
Yagi et al. 1986117 Japan NR NR stroke patients 47 58±2 NR ≥3 Takeda
UA-254 +2 .01 +5 .001 71
recruitment not specified; participant description insufficient; observers not blind

19
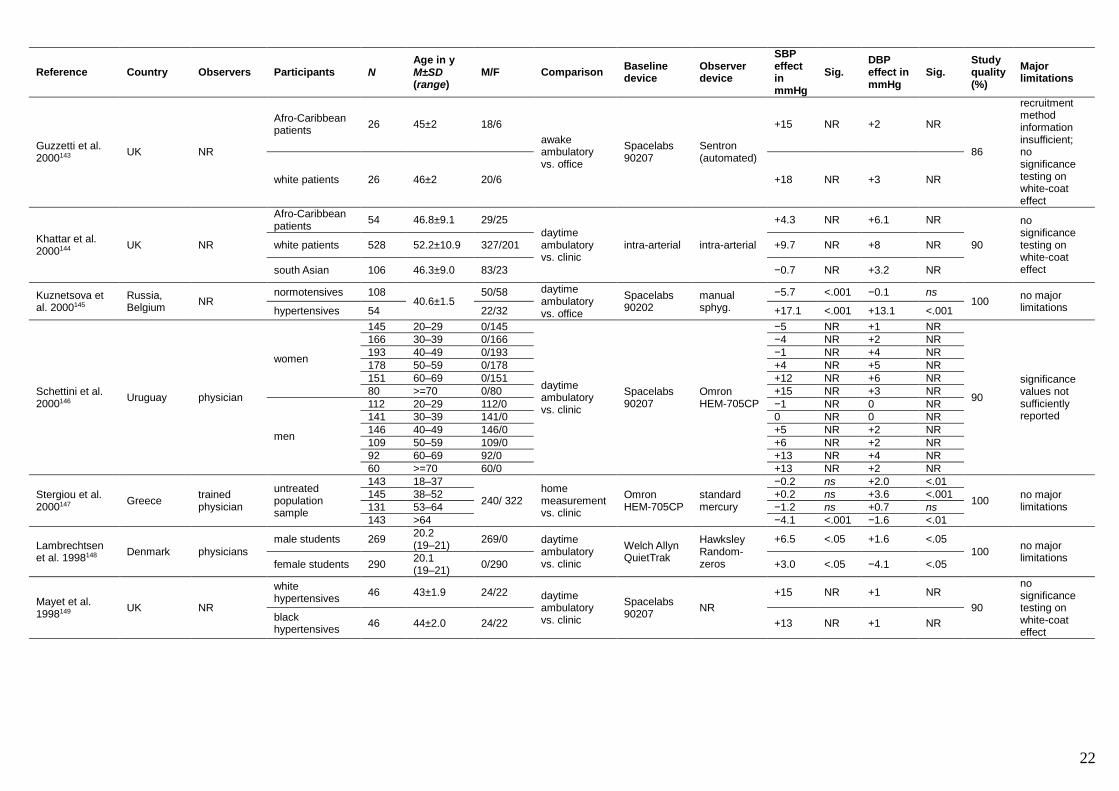
Supplementary Table 8. Studies examining the white-coat effect
Reference Country Observers Participants N Age in y M±SD (range)
M/F Comparison Baseline device
Observer device
SBP effect in mmHg
Sig. DBP effect in mmHg
Sig. Study quality (%)
Major limitations
Schmieder et al. 2014120 Germany Physicians hypertensives 2722 64
1489/ 1233
daytime ambulatory vs. office
standard German ambulatory devices
standard German oscillometric devices
+5.2 NR +2.6 NR 90
no significance testing on white-coat effect
Agarwal et al. 2013121 USA NR Type-2 diabetics 187 59.1±9.9 122/65
daytime ambulatory vs. clinic
Spacelabs 90207
Omron HEM-705CP
+10.4 NR +3.7 NR 90
no significance testing on white-coat effect
Saladini et al. 2012122 Italy doctor normotensives 73 29.5±9.1 63/10
baseline rest period vs. doctor visit
Finapres Finometer
Finapres Finometer
+12.1 NR +5.9 NR 90
no significance testing on white-coat effect
Yoon et al. 2012123
South Korea
nurses treated hypertensive outpatients
1087
57±10 522/ 565
home vs. clinic
Omron HEM-747
Omron HEM-747
+7.8 NR +3.8 NR
90
no significance testing on white-coat effect
doctors +9.8 NR +3.8 NR
doctors patients not at goal BP
64 +35 NR +9 NR
O'Shaughnessy et al. 2011124 Ireland NR hypertensives 80 55.1±16.7 45/35
awake vs. office
VSM Medtech BpTRU
Welch Allyn Vital Signs Monitor
+10.1 <.001 +2.8 .02 100 no major limitations
Sabater-Hernández et al. 2011125
Spain pharmacist community pharmacy visitors
169 56.4±10.6 68/101
daytime ambulatory vs. community pharmacy
Spacelabs 90207-5Q
Omron M10-IT
−0.4 ns +3.4 <.05
100 no major limitations home
measurement vs. community pharmacy
Omron M10-IT
Omron M10-IT
+1.2 ns +0.1 ns
Scherpbier-de Haan et al. 2011126
The Netherlands
NR general patients 83 62.1±10.7 32/51 rest vs. doctor-visit
IEM Mobil-O-Graph NG
IEM Mobil-O-Graph NG
+7.6 <.05 +2.5 <.05 100 no major limitations
Sendra-Lillo et al. 2011127 Spain
doctors treated hypertensives
70 61.8±12.4 39/31
home vs. clinic
Omron M10-IT
Omron M10-IT
+13.3 <.05 +2.4 ns
100 no major limitations
pharmacists home vs. pharmacy
Omron M10-IT
Omron M10-IT
+1.4 ns −1.1 ns
Pierdomenico et al. 2008128 Italy physician
patients with prehypertension
471 50±15 209/ 262 daytime
ambulatory vs. clinic
Spacelabs 90207
standard mercury
+5 NR −2 NR
90
no significance testing on white-coat effect
patients with masked hypertension
120 50±16 68/52 +3 NR −3 NR

20
Reference Country Observers Participants N Age in y M±SD (range)
M/F Comparison Baseline device
Observer device
SBP effect in mmHg
Sig. DBP effect in mmHg
Sig. Study quality (%)
Major limitations
Blanco et al. 2006129 Spain physician
men 132 73.4±6.3 132/0 daytime ambulatory vs. office
Spacelabs 90207
standard mercury
+13 NR +5 NR
90
no significance testing on white-coat effect
women 160 71.9±5.3 0/160 +20 NR +9 NR
Gerin et al. 2006130 USA doctors
normotensives 101 46.7±14.0 28/73
awake ambulatory vs. office
Spacelabs 90207
standard mercury
−6.1 NR −1 NR
86
recruitment method information insufficient; no significance testing on white-coat effect
unmedicated hypertensives
52 60.8±11.6 43/9 +6.6 NR +4.9 NR
Niiranen et al. 2006131 Finland nurses
normotensives 918 56.4±8.5 395/ 523
home vs. office
Omron HEM-722C
standard mercury
+7.7 NR +3.4 NR
90
no significance testing on white-coat effect
treated hypertensives
464 53.7±7.6 203/ 261
+7.3 NR +2.1 NR
untreated hypertensives
669 57.4±8.8 354/ 315
+12.7 NR +5.8 NR
Botomino et al. 2005132 Switzerland NR
medicated and unmedicated patients
50 53.7±14.0 (27–83) 21/29
home vs. pharmacy
Ambulatory standard mercury
+4.6 NR +2.9 NR 91
recruitment information insufficient; participant information insufficient
Goldstein et al. 2004133 USA NR
older men 65 overall 66.4±5.8
65/0 daytime ambulatory vs. clinic
Suntech Accutracker II
standard mercury
−4.6 NR +0.3 NR
90
no significance testing on white-coat effect
older women 92 0/92 −7.9 NR −3.4 NR
Stergiou et al. 2004134 Greece NR
untreated hypertensives
138
55.9±9.6
NR awake ambulatory vs. office
SpaceLabs 90207
standard mercury
+5.2 NR +3.5 NR
90
no significance testing on white-coat effect
treated hypertensives
138 NR +3.4 NR +1.7 NR
Tachibana et al. 2004135 Japan physician
population sample of >50 year olds
101 66.7±5.2 14/87 home vs. office
unspecified automated device
Omron HEM-705CP
+3.7 NR +2.1 NR 90
no significance testing on white-coat effect
Tsai et al. 2003136 Taiwan nurses
white-coat hypertensives
12 47.5±11.2 NR
awake ambulatory vs. office
unspecified ambulatory monitor
SpaceLabs automated oscillometric
+9.4 NR NR NR
86
recruitment method not described; no significance testing on white-coat effect
non-white-coat hypertensives
15 38.5±12.1 NR −0.57 NR NR NR
reverse white-coat effects
14 42.6±11.7 NR −8.5 NR NR NR
21
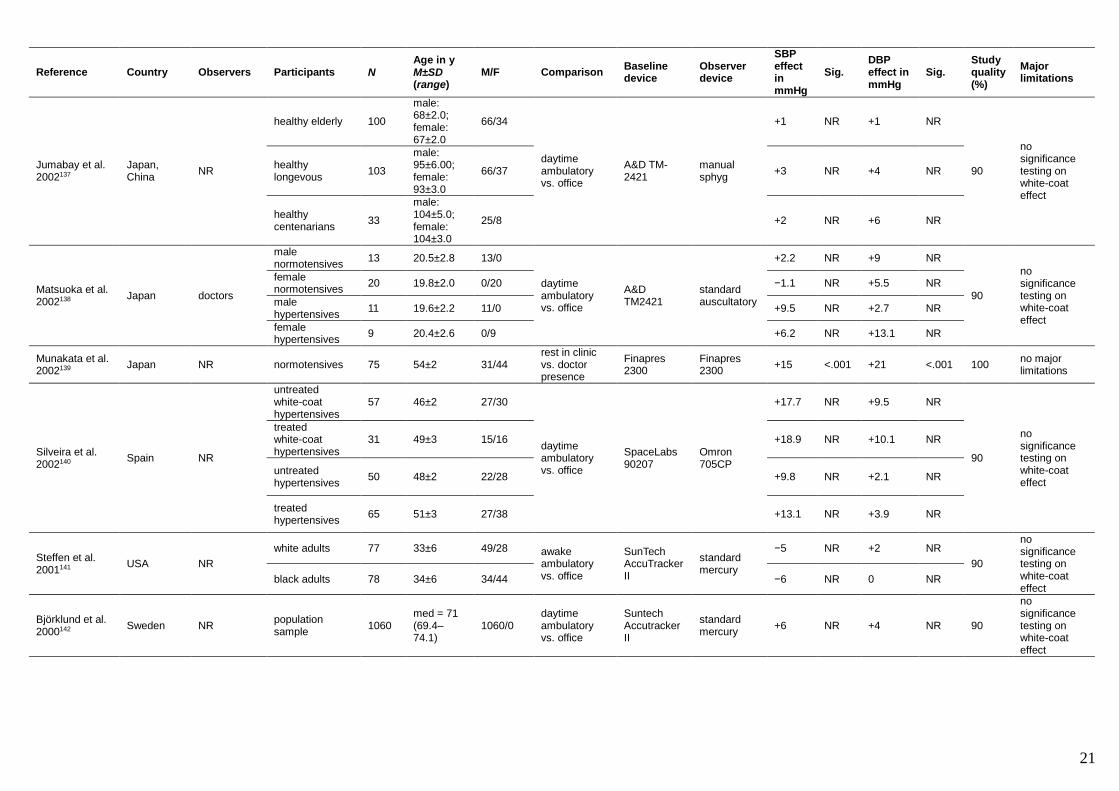
Reference Country Observers Participants N Age in y M±SD (range)
M/F Comparison Baseline device
Observer device
SBP effect in mmHg
Sig. DBP effect in mmHg
Sig. Study quality (%)
Major limitations
Jumabay et al. 2002137
Japan, China
NR
healthy elderly 100
male: 68±2.0; female: 67±2.0
66/34
daytime ambulatory vs. office
A&D TM-2421
manual sphyg
+1 NR +1 NR
90
no significance testing on white-coat effect
healthy longevous
103
male: 95±6.00; female: 93±3.0
66/37 +3 NR +4 NR
healthy centenarians
33
male: 104±5.0; female: 104±3.0
25/8 +2 NR +6 NR
Matsuoka et al. 2002138 Japan doctors
male normotensives
13 20.5±2.8 13/0
daytime ambulatory vs. office
A&D TM2421
standard auscultatory
+2.2 NR +9 NR
90
no significance testing on white-coat effect
female normotensives
20 19.8±2.0 0/20 −1.1 NR +5.5 NR
male hypertensives 11 19.6±2.2 11/0 +9.5 NR +2.7 NR
female hypertensives
9 20.4±2.6 0/9 +6.2 NR +13.1 NR
Munakata et al. 2002139 Japan NR normotensives 75 54±2 31/44
rest in clinic vs. doctor presence
Finapres 2300
Finapres 2300
+15 <.001 +21 <.001 100 no major limitations
Silveira et al. 2002140 Spain NR
untreated white-coat hypertensives
57 46±2 27/30
daytime ambulatory vs. office
SpaceLabs 90207
Omron 705CP
+17.7 NR +9.5 NR
90
no significance testing on white-coat effect
treated white-coat hypertensives
31 49±3 15/16 +18.9 NR +10.1 NR
untreated hypertensives
50 48±2 22/28 +9.8 NR +2.1 NR
treated hypertensives
65 51±3 27/38 +13.1 NR +3.9 NR
Steffen et al. 2001141 USA NR
white adults 77 33±6 49/28 awake ambulatory vs. office
SunTech AccuTracker II
standard mercury
−5 NR +2 NR
90
no significance testing on white-coat effect
black adults 78 34±6 34/44 −6 NR 0 NR
Björklund et al. 2000142 Sweden NR
population sample
1060 med = 71 (69.4–74.1)
1060/0 daytime ambulatory vs. office
Suntech Accutracker II
standard mercury
+6 NR +4 NR 90
no significance testing on white-coat effect
22
Reference Country Observers Participants N Age in y M±SD (range)
M/F Comparison Baseline device
Observer device
SBP effect in mmHg
Sig. DBP effect in mmHg
Sig. Study quality (%)
Major limitations
Guzzetti et al. 2000143 UK NR
Afro-Caribbean patients
26 45±2 18/6
awake ambulatory vs. office
Spacelabs 90207
Sentron (automated)
+15 NR +2 NR
86
recruitment method information insufficient; no significance testing on white-coat effect
white patients 26 46±2 20/6 +18 NR +3 NR
Khattar et al. 2000144 UK NR
Afro-Caribbean patients
54 46.8±9.1 29/25
daytime ambulatory vs. clinic
intra-arterial intra-arterial
+4.3 NR +6.1 NR
90
no significance testing on white-coat effect
white patients 528 52.2±10.9 327/201 +9.7 NR +8 NR
south Asian 106 46.3±9.0 83/23 −0.7 NR +3.2 NR
Kuznetsova et al. 2000145
Russia, Belgium
NR normotensives 108
40.6±1.5 50/58 daytime
ambulatory vs. office
Spacelabs 90202
manual sphyg.
−5.7 <.001 −0.1 ns 100
no major limitations hypertensives 54 22/32 +17.1 <.001 +13.1 <.001
Schettini et al. 2000146 Uruguay physician
women
145 20–29 0/145
daytime ambulatory vs. clinic
Spacelabs 90207
Omron HEM-705CP
−5 NR +1 NR
90
significance values not sufficiently reported
166 30–39 0/166 −4 NR +2 NR
193 40–49 0/193 −1 NR +4 NR
178 50–59 0/178 +4 NR +5 NR
151 60–69 0/151 +12 NR +6 NR
80 >=70 0/80 +15 NR +3 NR
men
112 20–29 112/0 −1 NR 0 NR
141 30–39 141/0 0 NR 0 NR
146 40–49 146/0 +5 NR +2 NR
109 50–59 109/0 +6 NR +2 NR
92 60–69 92/0 +13 NR +4 NR
60 >=70 60/0 +13 NR +2 NR
Stergiou et al. 2000147 Greece
trained physician
untreated population sample
143 18–37
240/ 322 home measurement vs. clinic
Omron HEM-705CP
standard mercury
−0.2 ns +2.0 <.01
100 no major limitations
145 38–52 +0.2 ns +3.6 <.001
131 53–64 −1.2 ns +0.7 ns
143 >64 −4.1 <.001 −1.6 <.01
Lambrechtsen et al. 1998148 Denmark physicians
male students 269 20.2 (19–21) 269/0 daytime
ambulatory vs. clinic
Welch Allyn QuietTrak
Hawksley Random-zeros
+6.5 <.05 +1.6 <.05
100 no major limitations
female students 290 20.1 (19–21) 0/290 +3.0 <.05 −4.1 <.05
Mayet et al. 1998149 UK NR
white hypertensives
46 43±1.9 24/22 daytime ambulatory vs. clinic
Spacelabs 90207
NR
+15 NR +1 NR
90
no significance testing on white-coat effect
black hypertensives
46 44±2.0 24/22 +13 NR +1 NR

23
Reference Country Observers Participants N Age in y M±SD (range)
M/F Comparison Baseline device
Observer device
SBP effect in mmHg
Sig. DBP effect in mmHg
Sig. Study quality (%)
Major limitations
Chase et al. 1997150 USA NR
Anglo females 28 22.0±0.70 0/28
awake ambulatory vs. office
Spacelabs 90207
standard mercury
−7 NR −3 NR
86
participants not sufficiently described; no significance testing on white-coat effect
African-American females
16 20.6±0.86 0/16 −5 NR +2 NR
African-American males
20 20.7±1.03 20/0 −6 NR +0 NR
Anglo males 22 22.9±0.80 22/0 −6 NR +4 NR
Hispanic females
18 21.1±0.79 0/18 −1 NR +3 NR
Hispanic males 14 20.6±0.91 14/0 −2 NR +8 NR
Sega et al. 1997151 Italy
trained physicians
males from population sample
128
69.0±2.3
128/0
daytime ambulatory vs. clinic
Spacelabs 90207
standard mercury
+20.1 <.01 +5.3 <.01
100 no major limitations
self-measured vs. clinic
Philips HP 5331
+7.8 <.01 +4.7 <.01
females from population sample
120 0/120
daytime ambulatory vs. clinic
Spacelabs 90207
+19.9 <.01 +6.9 <.01
self-measured vs. clinic
Philips HP 5331
+11.7 <.01 +5.4 <.01
Acharya et al. 1996152 UK NR
black women 25 NR 0/25
daytime ambulatory vs. clinic
intra-arterial not specified
+1 NR +2 NR
90
no significance testing on white-coat effect
black men 31 NR 31/0 −2 NR +3 NR
white women 218 NR 0/218 +9 NR +6 NR
white men 344 NR 344/0 +4 NR +6 NR
Asian women 22 NR 0/22 −3 NR +3 NR
Asian men 83 NR 83/0 −4 NR +1 NR
Nystrom et al. 1996153 Sweden
trained nurses
untreated population sample (men)
47 20–44 47/0
daytime ambulatory vs. clinic
Spacelabs 90202 and Spacelabs 90207
standard mercury
−6 NR −1 NR
90
no significance testing on white-coat effect
53 45–70 53/0 0 NR +2 NR
untreated population sample (women)
48 20–44 0/48 −7 NR −2 NR
52 45–70 0/52 +1 NR +1 NR
Shapiro et al. 1996154 USA NR
European-American college students
85 20.7±2.4
72/70 awake ambulatory vs. laboratory
Suntech Accutracker II
NR
−4.5 NR 0 NR
86
participant demographics not sufficiently described; no significance testing on white-coat effect
African-American college students
57 21.4±2.7 −1.6 NR +1.9 NR

24
Reference Country Observers Participants N Age in y M±SD (range)
M/F Comparison Baseline device
Observer device
SBP effect in mmHg
Sig. DBP effect in mmHg
Sig. Study quality (%)
Major limitations
Mancia et al. 1995155 Italy
trained physicians
population sample
1438 46.4±11.9 708/ 730
daytime ambulatory vs. clinic
Spacelabs 90207
standard mercury
+4.4 <.001 +3.6 <.001
100 no major limitations home self-
measurement vs. clinic
Philips HP 5331
+8.2 <.001 +7.6 <.001
Verdecchia et al. 1995156 Italy NR
normotensives 178 43±13 78/ 100
awake ambulatory vs. office
SpaceLabs 5200; 90202; 90207
standard mercury
+2 NR 0 NR
90
no significance testing on white-coat effect
white-coat hypertensives
252 49±12 124/ 128
+20 NR +13 NR
Hypertensives 1081 51±12 519/ 562
+12 NR +5 NR
Gretler et al. 1994157 USA
trained technicians
black males 122 50.1±1.3 (22–78) 122/0
awake ambulatory vs. office
Suntech Accutracker II
standard mercury
+9.7 NR +12.5 NR
86
recruitment method not sufficiently described; no significance testing on white-coat effect
black females 153 50.4±1.3 (20–78) 0/153 +16.4 NR +12.5 NR
white males 140 48.0±1.3 (20–78) 140/0 +4.6 NR +9.1 NR
white females 106 49.6±1.5 (23–79) 0/106 +17.7 NR +13.2 NR
Pearce et al. 1992158 USA NR
treated hypertensive patients
16
62.7±5.9
16/0 awake ambulatory vs. clinic
Spacelabs 90207
random-zero mercury sphyg
−12.7 <.001 −8.2 <.001
100 no major limitations normotensive/
untreated patients
34 34/0 −10.9 <.001 −7.6 <.001
Enstrom et al. 1991159 Sweden Physician
normotensives 48 50.3±7.9 48/0
daytime ambulatory vs. clinic
Spacelabs ICR 5200
standard mercury
+3 NR 0 NR
90
no significance testing on white-coat effect
borderline hypertensives 81 52.8±8.1 81/0 +15 NR +3 NR
hypertensives 35 52.8±7.7 35/0 +23 NR +6 NR
Mancia et al. 1983160 Italy Doctors hospital patients 48 17–67 25/23
doctor-absent vs. doctor-present
intra-arterial intra-arterial +26.7 <.001 +14.9 <.001 95
recruitment method not sufficiently described; participants not sufficiently described

25
Device-related sources of inaccuracy
Supplementary Table 9A. Studies examining the accuracy of mercury devices (vs. invasive criterion)
Device model Reference Country Observers N Participants N Age in y M±SD (range)
M/F No of Measurements
SBP mean bias (95% LoA) in mmHg
Sig. DBP mean bias (95% LoA) in mmHg
Sig. Study quality (%)
Major limitations
standard mercury Ochiai et al. 1997167 Japan
trained physicians
NR untreated hypertensives and normotensives
34 48 (30–73) 24/10 1 set per patient
−10.6 (−26.8; +5.6) <.001
+3.7 (−9.3; +16.7)
<.01 100 no major limitations
standard mercury White et al. 1990168 USA, Norway clinicians 2 hypertensive patients
58 NR NR NR −4 (−22; +14) <.05
+4 (−2; +10)
<.05 96 DBP effect value not stated; participants not sufficiently described
standard mercury Cohn et al. 1967169 USA NR NR shock patients 39 NR NR NR −33.1 (NR) NR
NR (NR)
NR 82
participants not described; results not reported in sufficient detail
Hawksley Random Zero Manometer (mercury)
Bos et al. 1992170 The Netherlands
trained observers
2 surgery patients; healthy volunteers
76 NR NR NR −6.0 (−19.0; +7.0)
<.05 +1.9 (−9.3; +13.1)
<.05 88 no mention of blinding observers; participants not sufficiently described

26
Supplementary Table 9B. Studies examining the accuracy of aneroid devices (vs. invasive criterion)
Device model Reference Country Observers N Participants N Age in y M±SD (range)
M/F No of Measurements
SBP mean bias (95% LoA) in mmHg
Sig. DBP mean bias (95% LoA) in mmHg
Sig. Study quality (%)
Major limitations
McCoy Econosphyg (aneroid)
Araghi et al. 2006162 USA investigator 1
overweight critically ill adults
54 57±3 23/24 NR −6.7 (−15.3;+1.9) NR
+11.4 (+6.8;+16.0)
NR 91 no mention whether observer was blinded to invasive measurement
Speidel+Keller aneroid Turjanmaa et al. 1989172 Finland trained nurse 1 volunteers 24
39.4±4.95 (35–45) 23/1 1 set per patient
−4.0 (−18.88;+10.88)
<.015 +2.0 (−7.38; +11.38)
ns 100 no major limitations
Welch Allyn DuraShock DS44
Ribezzo et al. 2014171 Italy
critical care nurses
3 ICU patients 50 (18–92) 18/31 2 per patient −9.7 (−36.8; +17.4) <.0001
+5.1 (−8.8; +19.1)
<.0001 96 only partial blinding of investigators

27
Supplementary Table 9C. Studies examining the accuracy of aneroid devices (vs. non-invasive criterion)
Device model Reference Country Observers N Partici-pants
N Age in y M±SD (range) M/F
No of measures
Criterion device
SBP mean bias (95% LoA) in mmHg
Sig. DBP mean bias (95% LoA) in mmHg
Sig. Study quality (%)
Major limitations
Heine Gamma XXL-LF
Dorigatti et al. 2007177 Italy NR NR volunteers 33 51±21 18/15 NR
standard mercury
−0.3 (−7.7;+7.1)
NR −1 (−6.2;+4.2)
NR 86 recruitment method not described; participants not sufficiently described
Heine Gamma G7
Dorigatti et al. 2007177 Italy NR NR volunteers 33 51±21 18/15 NR
standard mercury
−0.4 (−7.0;+6.2)
NR −0.5 (−5.7;+4.7)
NR 86 recruitment method not described; participants not sufficiently described
Missouri aneroid
Ferreira et al. 2010174 Brazil
trained observers
3 cancer patients
33 57.63±13.03 (31–80) 15/18 14
standard mercury
+0.62 (−8.44;+9.68)
NR +0.06 (−13.08;+13.2)
NR 100 no major limitations
Prestige Medical CEO-120
Nelson et al. 2008176 USA
trained investigators
4 volunteers 27 (18–21) NR 1 standard mercury
+1.85 (−15.23; +18.93)
ns −1.7 (−11.60; +8.20)
<.01 96 participants not sufficiently described
Prestige Medical CEO-120
Nelson et al. 2008176 USA
trained investigators
4 volunteers 18 (21–24.5) NR 1 standard mercury
+0.78 (−17.32; +18.88)
ns −2.00 (−17.64; +13.64)
ns 96 participants not sufficiently described
Prestige Medical CEO-120
Nelson et al. 2008176 USA
trained investigators
4 volunteers 16 (24.5–50) NR 1 standard mercury
+0.88 (−17.06; +18.82)
ns +0.75 (−9.47; +10.97)
ns 96 participants not sufficiently described
Prestige Medical CEO-120
Nelson et al. 2008176 USA
trained investigators
4 volunteers 22 (50–92) NR 1 standard mercury
−3.45 (−28.45; +21.55)
ns −1.59 (−13.75; +10.57)
ns 96 participants not sufficiently described
Welch Allyn Tycos 767 mobile
Saxena et al. 2012173 India
experienced observer
1 volunteers 83 (18–40) NR 2 standard mercury
−3.60 (−13.36; +6.16)
ns −2.34 (−9.56; +4.88)
ns 96 participants not sufficiently described
Welch Allyn Tycos 767 mobile
Ma et al. 2009175 USA
trained technicians
NR clinic patients
997
NR NR 2 standard mercury
−0.8 (−7.2; +5.6)
<.0001 −0.1 (−8.3; +8.1)
ns 96 participants not sufficiently described
Welch Allyn Maxi-Stabil 3
Reinders et al. 2003178
UK trained observers
2 hospital staff and patients
85 54±15.7 38/47 NR standard mercury (sequent.)
−0.6 (−9.8;+8.6)
NR −1.3 (−8.3;+5.7)
NR 95 recruitment method not sufficiently described
Welch Allyn MaxiStabil 3
Reinders et al. 2003178
UK trained observers
2 hospital staff and patients
85 54±15.7 38/47 NR standard mercury (simultan.)
−1.3 (−5.7;+3.1)
NR −1.9 (−7.3;+3.5)
NR 95 recruitment method not sufficiently described
Welch Allyn Vital Signs Monitor 52000
Braam et al. 2002179
The Nether-lands
trained observers
2 internal medicine out-patients
85 48±18 31/54 NR standard mercury
+5.3 (−8.1;+18.7)
NR NR NR 100 no major limitations
Welch Allyn Vital Signs Monitor 52000
Braam et al. 2002179
The Nether-lands
trained observers
2 internal medicine out-patients
85 51±16 33/52 NR standard mercury
NR NR +7.5 (−6.7;+21.7)
NR 100 no major limitations
28
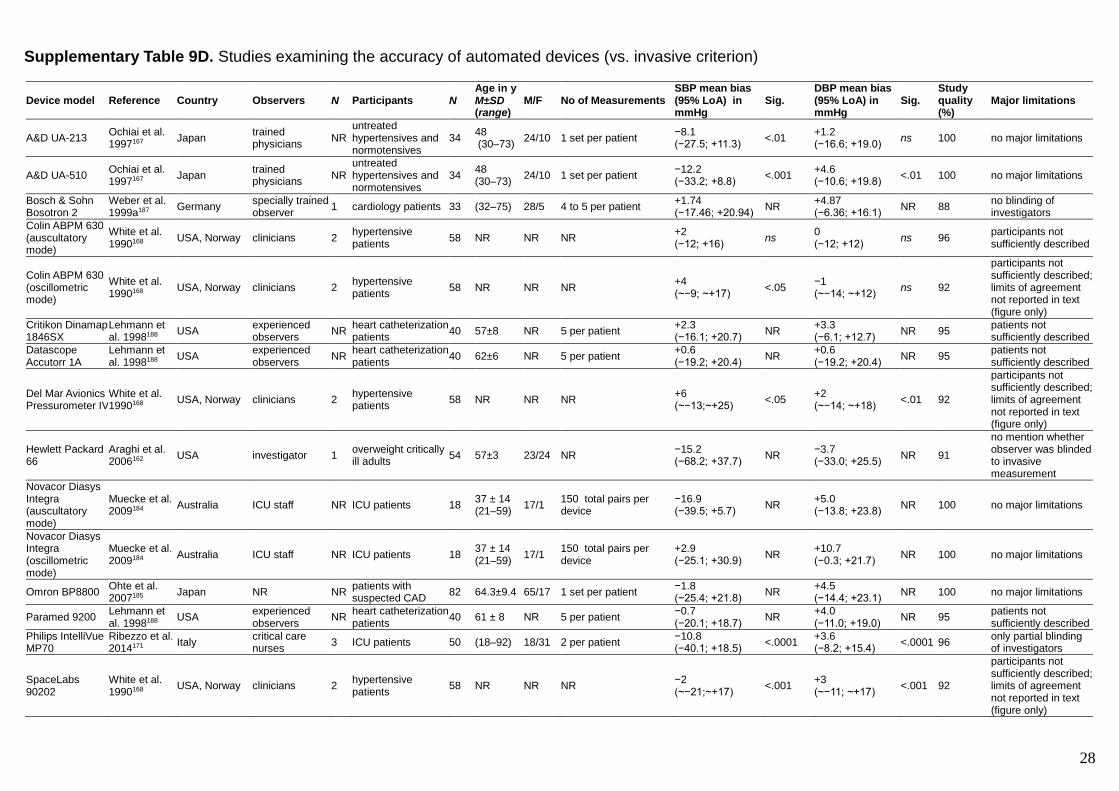
Supplementary Table 9D. Studies examining the accuracy of automated devices (vs. invasive criterion)
Device model Reference Country Observers N Participants N Age in y M±SD (range)
M/F No of Measurements SBP mean bias (95% LoA) in mmHg
Sig. DBP mean bias (95% LoA) in mmHg
Sig. Study quality (%)
Major limitations
A&D UA-213 Ochiai et al. 1997167 Japan
trained physicians
NR untreated hypertensives and normotensives
34 48 (30–73) 24/10 1 set per patient
−8.1 (−27.5; +11.3)
<.01 +1.2 (−16.6; +19.0)
ns 100 no major limitations
A&D UA-510 Ochiai et al. 1997167 Japan
trained physicians
NR untreated hypertensives and normotensives
34 48 (30–73) 24/10 1 set per patient
−12.2 (−33.2; +8.8)
<.001 +4.6 (−10.6; +19.8)
<.01 100 no major limitations
Bosch & Sohn Bosotron 2
Weber et al. 1999a187 Germany
specially trained observer
1 cardiology patients 33 (32–75) 28/5 4 to 5 per patient +1.74 (−17.46; +20.94)
NR +4.87 (−6.36; +16.1)
NR 88 no blinding of investigators
Colin ABPM 630 (auscultatory mode)
White et al. 1990168 USA, Norway clinicians 2
hypertensive patients
58 NR NR NR +2 (−12; +16)
ns 0 (−12; +12)
ns 96 participants not sufficiently described
Colin ABPM 630 (oscillometric mode)
White et al. 1990168 USA, Norway clinicians 2
hypertensive patients
58 NR NR NR +4 (~−9; ~+17)
<.05 −1 (~−14; ~+12)
ns 92
participants not sufficiently described; limits of agreement not reported in text (figure only)
Critikon Dinamap 1846SX
Lehmann et al. 1998188 USA
experienced observers
NR heart catheterization patients
40 57±8 NR 5 per patient +2.3 (−16.1; +20.7)
NR +3.3 (−6.1; +12.7)
NR 95 patients not sufficiently described
Datascope Accutorr 1A
Lehmann et al. 1998188 USA
experienced observers
NR heart catheterization patients
40 62±6 NR 5 per patient +0.6 (−19.2; +20.4)
NR +0.6 (−19.2; +20.4)
NR 95 patients not sufficiently described
Del Mar Avionics Pressurometer IV
White et al. 1990168 USA, Norway clinicians 2
hypertensive patients
58 NR NR NR +6 (~−13;~+25)
<.05 +2 (~−14; ~+18)
<.01 92
participants not sufficiently described; limits of agreement not reported in text (figure only)
Hewlett Packard 66
Araghi et al. 2006162 USA investigator 1
overweight critically ill adults
54 57±3 23/24 NR −15.2 (−68.2; +37.7)
NR −3.7 (−33.0; +25.5)
NR 91
no mention whether observer was blinded to invasive measurement
Novacor Diasys Integra (auscultatory mode)
Muecke et al. 2009184 Australia ICU staff NR ICU patients 18
37 ± 14 (21–59) 17/1
150 total pairs per device
−16.9 (−39.5; +5.7)
NR +5.0 (−13.8; +23.8)
NR 100 no major limitations
Novacor Diasys Integra (oscillometric mode)
Muecke et al. 2009184 Australia ICU staff NR ICU patients 18
37 ± 14 (21–59) 17/1
150 total pairs per device
+2.9 (−25.1; +30.9)
NR +10.7 (−0.3; +21.7)
NR 100 no major limitations
Omron BP8800 Ohte et al. 2007185 Japan NR NR
patients with suspected CAD
82 64.3±9.4 65/17 1 set per patient −1.8 (−25.4; +21.8)
NR +4.5 (−14.4; +23.1)
NR 100 no major limitations
Paramed 9200 Lehmann et al. 1998188 USA
experienced observers
NR heart catheterization patients
40 61 ± 8 NR 5 per patient −0.7 (−20.1; +18.7)
NR +4.0 (−11.0; +19.0)
NR 95 patients not sufficiently described
Philips IntelliVue MP70
Ribezzo et al. 2014171 Italy
critical care nurses
3 ICU patients 50 (18–92) 18/31 2 per patient −10.8 (−40.1; +18.5)
<.0001 +3.6 (−8.2; +15.4)
<.0001 96 only partial blinding of investigators
SpaceLabs 90202
White et al. 1990168 USA, Norway clinicians 2
hypertensive patients
58 NR NR NR −2 (~−21;~+17)
<.001 +3 (~−11; ~+17)
<.001 92
participants not sufficiently described; limits of agreement not reported in text (figure only)

29
Device model Reference Country Observers N Participants N Age in y M±SD (range)
M/F No of Measurements SBP mean bias (95% LoA) in mmHg
Sig. DBP mean bias (95% LoA) in mmHg
Sig. Study quality (%)
Major limitations
SpaceLabs 90209
Manios et al. 2007186 Greece NR NR
hyperacute stroke patients
51 73.8±9.5 30/21 Average over 24 hours −9.7 (~−31.4;~+12)
<.001 +5.6 ( ~−8;~+19)
<.001 92 limits of agreement not reported in text (figure only)
Suntech Medical Accutracker II
Muecke et al. 2009184 Australia ICU staff NR ICU patients 18
37 ± 14 (21–59) 17/1 150 pairs per device
−10.6 (−36.4; +15.2)
NR +1.6 (−13.4; +16.6)
NR 100 no major limitations
Suntech Medical Accutracker II
White et al. 1990168 USA, Norway clinicians 2
hypertensive patients
58 NR NR NR +1 (−19; +11)
ns −3 (−11; +5)
<.05 96 participants not sufficiently described
Suntech Medical Oscar 2
Muecke et al. 2009184 Australia ICU staff NR ICU patients 18
37 ± 14 (21–59) 17/1 150 pairs per device
−9.2 (−34.0; +15.6)
NR +7.0 (−3.0; +17.0)
NR 100 no major limitations
Takeda TM-2420 Russell et al. 1989189 Australia
unspecified observers
2 ischaemic heart disease patients
26 NR NR 5 sets per patient −23 (−47; +1)
<.05 +5 (−3; +13)
<.05 95 participants not sufficiently described
unspecified automated devices
McMahon et al. 2012182 UK NR NR critical care patients 56 NR NR NR
−3.7 (−37.3; +30.0)
NR NR NR 85 participants not described; DBP effect not reported
unspecified automated devices
Mireles et al. 2009183 USA NR NR
adult neurosurgery patients
11 NR NR 301 total pairs +3.8 (−9.8; +17.4)
ns +2.4 (−7.6; +12.4)
ns 95
small sample size of participants, however, large number of measurements

30
Supplementary Table 9E. Studies examining the accuracy of automated device models (vs. non-invasive criterion)
Device model
Reference Country Observers N Participants N Age in y M±SD (range)
M/F No of measures
Criterion device model
SBP mean bias (95% LoA) in mmHg
Sig. DBP mean bias (95% LoA) in mmHg
Sig. Study quality (%)
Major limitations
A&D UA-213
Ochiai et al. 1997167 Japan
trained physicians
NR untreated hypertensives; normotensives
29; 5
47.4 (18–71); 48.0 (30–73)
20/9; 4/1
1 standard mercury
+1.5 (−7.0; +10.0)
NR −1.5 (−15.0; +12.0)
NR 100 no major limitations
A&D UA-510
Ochiai et al. 1997167 Japan
trained physicians
NR untreated hypertensives; normotensives
29; 5
47.4 (18–71); 48.0 (30–73)
20/9; 4/1
1 standard mercury
−3.95(−18.5; +10.6) NR
+3.9 (−10.0; +17.8)
NR 100 no major limitations
A&D UA-751
Jamieson et al. 1990a222
UK experienced observer
1
hypertensive and non-hypertensives grp 1
50 NR NR 2 Hawksley random zero
−0.9 (−13.1;+11.3) ns
+1.3 (−8.9;+11.5)
ns 82 method of recruitment not described; participant demographics not described
A&D UA-751
Jamieson et al. 1990a222
UK experienced observer
1
hypertensive and non-hypertensives grp 2
50 NR NR 2 Hawksley random zero
+0.2 (−9;+9.4) ns −0.3 (−11.1;+10.5)
ns 82 method of recruitment not described; participant demographics not described
A&D UA-751
Jamieson et al. 1990a222
UK experienced observer
1
hypertensive and non-hypertensives grp 3
50 NR NR 2 Hawksley random zero
+0.6 (−19;+20.2) ns −0.6 (−6.4;+5.2)
ns 82 method of recruitment not described; participant demographics not described
A&D UA-751
Jamieson et al. 1990a222
UK experienced observer
1
hypertensive and non-hypertensives grp 4
50 NR NR 2 Hawksley random zero
+1.4 (−14.2;+17)
ns −0.2 (−6.8;+6.4)
ns 82 method of recruitment not described; participant demographics not described
A&D UA-767PC
Lim et al. 2014190
South Korea
trained nurses
2 volunteers 454 50.7±15.4 (20–95)
214/ 240
3 standard mercury
−1.9 (−15.9; +12.1)
NR −3.1 (−14.1; +7.9)
NR 100 no major limitations
A&D UA-777
Shahriari et al. 2003204 Denmark investigator 1 outpatients 72 NR NR NR
standard mercury
−5.5 (−22.1;+11.1)
NR −6.8 (−20.4;+6.8)
NR 100 no major limitations
Accutor Plus Monitor
White et al. 2003205 USA
experienced observers
2 patients 109 47±13 56/53 5 standard mercury
+0.13 (−14.89; +15.15)
NR −2.54 (−12.96; +7.88)
NR 100 no major limitations
BpTRU Lamarre-Cliché et al. 2011194
Canada qualified nurse
NR hypertensives 101 58.2± 11.5 54/47 3 for criterion; 5 for test
standard mercury
−1.45 (−16.63; +13.73)
ns −0.84 (−16.02; +14.34)
ns 100 no major limitations
BpTRU Graves et al. 2003203 USA nurses NR
BP monitored patients
106 62.8±13.3 57/49 3 Welch Allyn Tycos aneroid
−1.8 (−12;+8.4)
<.001 +4.8 (−5.4; +15.0)
<.001 100 no major limitations
BpTRU BPM-100
Wright et al. 2001213 Canada NR NR
BP clinic patients
85 43.1±15.6 (18–83) 44/41 NR
standard mercury
−0.16 (−10.42;+10.1)
NR
−1.41 (−10.75;+7.93)
NR
100 no major limitations
BpTRU BPM-100beta
Mattu et al. 2001211 Canada nurses 2 adults 85
43.1±15.6 (18–83) 44/41 5
standard mercury
−0.62 (−14.54;+13.3)
NR −1.48 (−11.08;+8.12)
NR 100 no major limitations
31
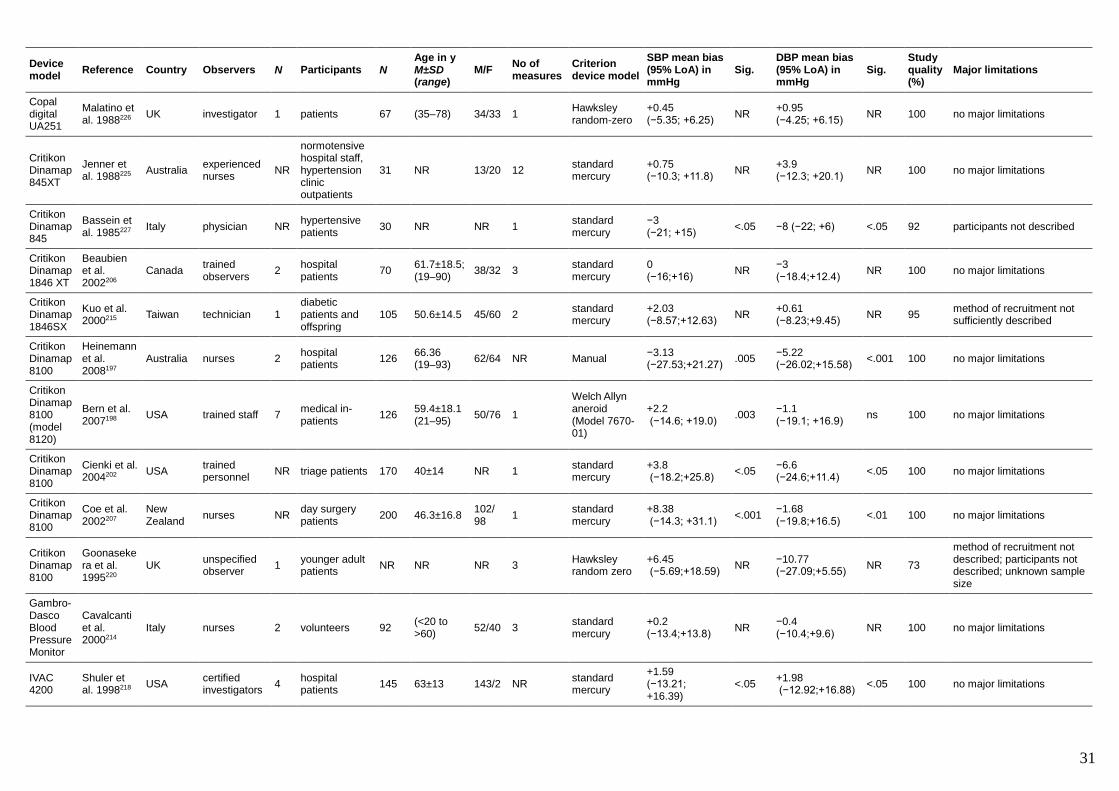
Device model
Reference Country Observers N Participants N Age in y M±SD (range)
M/F No of measures
Criterion device model
SBP mean bias (95% LoA) in mmHg
Sig. DBP mean bias (95% LoA) in mmHg
Sig. Study quality (%)
Major limitations
Copal digital UA251
Malatino et al. 1988226 UK investigator 1 patients 67 (35–78) 34/33 1
Hawksley random-zero
+0.45 (−5.35; +6.25)
NR +0.95 (−4.25; +6.15)
NR 100 no major limitations
Critikon Dinamap 845XT
Jenner et al. 1988225 Australia
experienced nurses
NR
normotensive hospital staff, hypertension clinic outpatients
31 NR 13/20 12 standard mercury
+0.75 (−10.3; +11.8)
NR +3.9 (−12.3; +20.1)
NR 100 no major limitations
Critikon Dinamap 845
Bassein et al. 1985227 Italy physician NR
hypertensive patients 30 NR NR 1
standard mercury
−3 (−21; +15)
<.05 −8 (−22; +6) <.05 92 participants not described
Critikon Dinamap 1846 XT
Beaubien et al. 2002206
Canada trained observers
2 hospital patients
70 61.7±18.5; (19–90) 38/32 3
standard mercury
0 (−16;+16)
NR −3 (−18.4;+12.4)
NR 100 no major limitations
Critikon Dinamap 1846SX
Kuo et al. 2000215 Taiwan technician 1
diabetic patients and offspring
105 50.6±14.5 45/60 2 standard mercury
+2.03 (−8.57;+12.63)
NR +0.61 (−8.23;+9.45)
NR 95 method of recruitment not sufficiently described
Critikon Dinamap 8100
Heinemann et al. 2008197
Australia nurses 2 hospital patients
126 66.36 (19–93) 62/64 NR Manual
−3.13 (−27.53;+21.27)
.005 −5.22 (−26.02;+15.58)
<.001 100 no major limitations
Critikon Dinamap 8100 (model 8120)
Bern et al. 2007198 USA trained staff 7
medical in-patients
126 59.4±18.1 (21–95) 50/76 1
Welch Allyn aneroid (Model 7670-01)
+2.2 (−14.6; +19.0) .003
−1.1 (−19.1; +16.9)
ns 100 no major limitations
Critikon Dinamap 8100
Cienki et al. 2004202 USA
trained personnel
NR triage patients 170 40±14 NR 1 standard mercury
+3.8 (−18.2;+25.8) <.05
−6.6 (−24.6;+11.4)
<.05 100 no major limitations
Critikon Dinamap 8100
Coe et al. 2002207
New Zealand
nurses NR day surgery patients
200 46.3±16.8 102/ 98
1 standard mercury
+8.38 (−14.3; +31.1) <.001
−1.68 (−19.8;+16.5)
<.01 100 no major limitations
Critikon Dinamap 8100
Goonasekera et al. 1995220
UK unspecified observer
1 younger adult patients
NR NR NR 3 Hawksley random zero
+6.45 (−5.69;+18.59) NR
−10.77 (−27.09;+5.55)
NR 73
method of recruitment not described; participants not described; unknown sample size
Gambro-Dasco Blood Pressure Monitor
Cavalcanti et al. 2000214
Italy nurses 2 volunteers 92 (<20 to >60)
52/40 3 standard mercury
+0.2 (−13.4;+13.8)
NR −0.4 (−10.4;+9.6)
NR 100 no major limitations
IVAC 4200
Shuler et al. 1998218 USA
certified investigators
4 hospital patients
145 63±13 143/2 NR standard mercury
+1.59 (−13.21; +16.39)
<.05 +1.98 (−12.92;+16.88) <.05 100 no major limitations

32
Device model
Reference Country Observers N Participants N Age in y M±SD (range)
M/F No of measures
Criterion device model
SBP mean bias (95% LoA) in mmHg
Sig. DBP mean bias (95% LoA) in mmHg
Sig. Study quality (%)
Major limitations
MicroLife BP 3BTO-A
Cuckson et al. 2002208 UK
trained observers
2 hospital staff and patients
85 median=44 (22–90) 34/51 NR
standard mercury
−1.7 (−16.5;+13.1)
NR −2.1 (−14.7;+10.5)
NR 100 no major limitations
Nissei D-175 Digital Monitor
Dawson et al. 1989223 UK NR NR
pregnant women
41 NR 0/41 ~3
London School of Hygiene blind-reading mercury
+16.53 (−9.13;+42.19)
<.001 +9.71 (−16.97;+36.39)
<.001 95 participants not sufficiently described
Omron HEM-705 CP
Vera-Cala et al. 2011195
Columbia / USA
trained observers
2 random sample
1084 42.5 372/ 712
2 standard mercury
+1.8 (−10.1; +13.7)
<.001 −1.6 (−12.8 +9.6)
<.001 100 no major limitations
Omron HEM-711AC
Nelson et al. 2008176 USA
trained investigators
4 volunteers 27 (19–21) NR 1 standard mercury
+5.70 (−14.42; +25.82)
<.01 +0.93 (−11.81; +13.67)
ns 96 participants not sufficiently described
Omron HEM-711AC
Nelson et al. 2008176 USA
trained investigators
4 volunteers 18 (21–24.5) NR 1 standard mercury
+8.33 (−4.85; +21.51)
<.001 +3.39 (−7.95; +14.73)
<.05 96 participants not sufficiently described
Omron HEM-711AC
Nelson et al. 2008176 USA
trained investigators
4 volunteers 16 (24.5–50) NR 1 standard mercury
+6.94 (−12.30; +26.18)
<.05 +3.13 (−12.67; +18.93)
ns 96 participants not sufficiently described
Omron HEM-711AC
Nelson et al. 2008176 USA
trained investigators
4 volunteers 22 (51–90) NR 1 standard mercury
+15.50 (−20.4; +51.4)
<.01 +3.05 (−19.47; +25.57)
ns 96 participants not sufficiently described
Omron HEM-737
Anwar et al. 1998216 USA NR 2
general population
90 58±16 (24–84) 38/52 NR
standard mercury
−0.76 (−13.86; +12.34)
NR −1.0 (−11.1;+9.1)
NR 95 observers not described
Omron HEM-759-E (705IT)
Coleman et al. 2006199 UK hospital staff
3 or 4
outpatients 85 47.2±14.9 (24–85) 38/47 NR
standard mercury
+0.6 (−11.4;+12.6)
NR −3.15 (−16.35;+10.05)
NR 100 no major limitations
Omron HEM-907XL
Ostchega et al. 2010196
USA trained observers
8 younger adults 134 (20–49) NR 3 standard mercury
−0.74 (−12.62; +11.14)
ns −1.87 (−15.01; +11.27)
<.0001 100 no major limitations
Omron HEM-907XL
Ostchega et al. 2010196
USA trained observers
8 older adults 283 (>50) NR 3 standard mercury
−2.37 (−15.05; +10.31)
<.0001 −1.50 (−13.38; +10.38)
<.0001 100 no major limitations
Omron HEM-907
Semret et al. 2005200 USA
trained observers
2 hemodialysis patients 20 56±12.2 18/2
56 pairs total
standard mercury
+2.7 (−15.9; +21.3)
.049 +0.4 (−13.6; +14.4)
ns 96 control participants not sufficiently described
Omron HEM-907
Semret et al. 2005200 USA
trained observers
2 normal controls
20 31±8.5 NR 56 pairs total
standard mercury
+4.3 (−13.5; +22.1)
<.0001 +0.6 (−16.8; +18.0)
ns 96 control participants not sufficiently described
Omron HEM-907
El Assaad et al. 2002209
France trained physicians
2 NR 33 51±13.9 19/14 NR standard mercury
−1 (−15;+13)
NR −5 (−17;+7)
NR 91 method of recruitment not described

33
Device model
Reference Country Observers N Participants N Age in y M±SD (range)
M/F No of measures
Criterion device model
SBP mean bias (95% LoA) in mmHg
Sig. DBP mean bias (95% LoA) in mmHg
Sig. Study quality (%)
Major limitations
Omron HEM-907
White et al. 2001212 USA NR NR patients 100 56±17 45/55 3
standard mercury
+1.56 (−7.28;+10.4)
NR +3.49 (−5.73;+12.71)
NR 91 method of recruitment not described
Omron HEM-5001
Eguchi et al. 2011193 USA doctors NR hypertensives 56 60±14 32/24 3
standard mercury
+2.4 (−5.4;+10.2)
<.001 −1.3 (−9.3;+6.7)
.02 59 method of recruitment not sufficiently described
Omron M4
Shahriari et al. 2003204 Denmark investigator 1 outpatients 72 NR NR NR
standard mercury
−5.5 (−22.5;+11.5)
NR −3 (−14.8;+8.8)
NR 100 no major limitations
Omron-MIT
Golara et al. 2002210 UK
experienced observers
2 patients 85 Med=51 (21–88) 49/36 3 or 4
standard mercury
+2.1 (−12.1;+16.3)
NR +2.4 (−9.2;+14)
NR 91 method of recruitment not described
Pharma-Smart PS-2000
Alpert et al. 2004201 USA clinicians 2 Volunteers 85
40 (18–74) 44/41 5
standard mercury
+0.07 (−13.9; +14.07)
NR −0.3 (−13.5; +12.9)
NR 100 no major limitations
Spacelab Ultraview SL
Collins et al. 2013191 USA nurses 4
hospitalised patients 57
79.77 (42–97) 34/23 1
Welch Allyn mounted aneroid sphyg
+2.00 (−12.66;+16.6)
.043 +6.18 (−9.94;+22.3)
<.001 100 no major limitations
Takeda UA-731
Cartwright et al. 1996219
UK trained observers
2 general population
71 med=59 0/71 NR standard mercury
−3.7 (−16.7;+9.3)
<.05 −2.3 (−11.3;+6.7)
<.05 100 no major limitations
Takeda UA-731
Cartwright et al. 1996219
UK trained observers
2 general population
71 med=50 0/71 NR standard mercury
−1.8 (−14.2;+10.6)
<.05 −1.8 (−10.6;+7)
<.05 100 no major limitations
Takeda UA-751
Johnston et al. 1989224 UK experimenter NR volunteers 10 (20–50) NR 3
Hawksley random-zero mercury
+0.85 (−7.1; +8.8)
ns +1.7 (−5.5; +8.9)
ns 91 recruitment not described
Terumo ES-H51
Imai et al. 1994221 Japan doctors 2 subjects 64
57.6±10.4; (25–76) 26/64 NR
standard mercury
+0.7 (−5.1;+6.5)
NR +0.3 (−4.9;+5.5)
NR 91 method of recruitment not described
Terumo ES-H51
Kwek et al. 1998217 Singapore
registrar-grade clinicians
2 antenatal unit patients
87 30 (19–41) 0/87 3
standard mercury
−3.4 (−8.6; +1.8)
NR −2.0 (−5.8; +1.8)
NR 100 no major limitations
WatchBP Office
Ishikawa et al. 2012192
Greece, Japan, USA
doctors, nurses
NR hypertensives 75 56.1±13.8 41/34 3 standard mercury
−1.6 (~−17.2+14.0
ns −0.8 (~−8.5; ~+10.1)
ns 86 method of recruitment not sufficiently described; did not control for confounds

34
Supplementary Table 10A. Studies examining the calibration accuracy of mercury devices in clinical use
Reference Country N (devices tested) Criterion device
Accuracy threshold in mmHg
Test Pressure(s) in mmHg
Devices exceeding threshold (%)
Study quality (%) Major limitations
A'Court et al. 2011229 UK 75 Scandmed pressure meter 950831-2; Omron PA-350
±3 50–250 5 100 no major limitations
de Greeff et al. 2010230 UK 18 DPI 610 electronic gauge ±3 0–200 6 95 inadequate sample size
Coleman et al. 2005231 UK 83 DPI 610 electronic gauge ±3 0–250 13.3 100 no major limitations
Shah et al. 2004232 Australia 238 accurate mercury sphygmomanometer ±4
0 0
100 no major limitations
80 0.4
90 0.4
100 0.4
140 0.4
150 0.4
160 0.4
Waugh et al. 2002233 UK 36 mercury column ±3 varying pressures 28 100 no major limitations
Ashworth et al. 2001234 UK 130 accurate mercury sphygmomanometer ±3 50–220 2.3 100 no major limitations
Knight et al. 2001235 UK 356 Unspecified calibration device ±3 0–250 61.8 100 no major limitations
Jones et al. 1987236 USA 8 accurate mercury sphygmomanometer ±4 60–240 0 95 inadequate sample size
Burke et al. 1982237 Ireland 160 accurate mercury sphygmomanometer ±3 90 6 95 only tested at one pressure level
Shaw et al. 1979238 UK 32 accurate mercury sphygmomanometer ±3 60–150 34.4 89 selection of devices not described; description of devices not sufficient
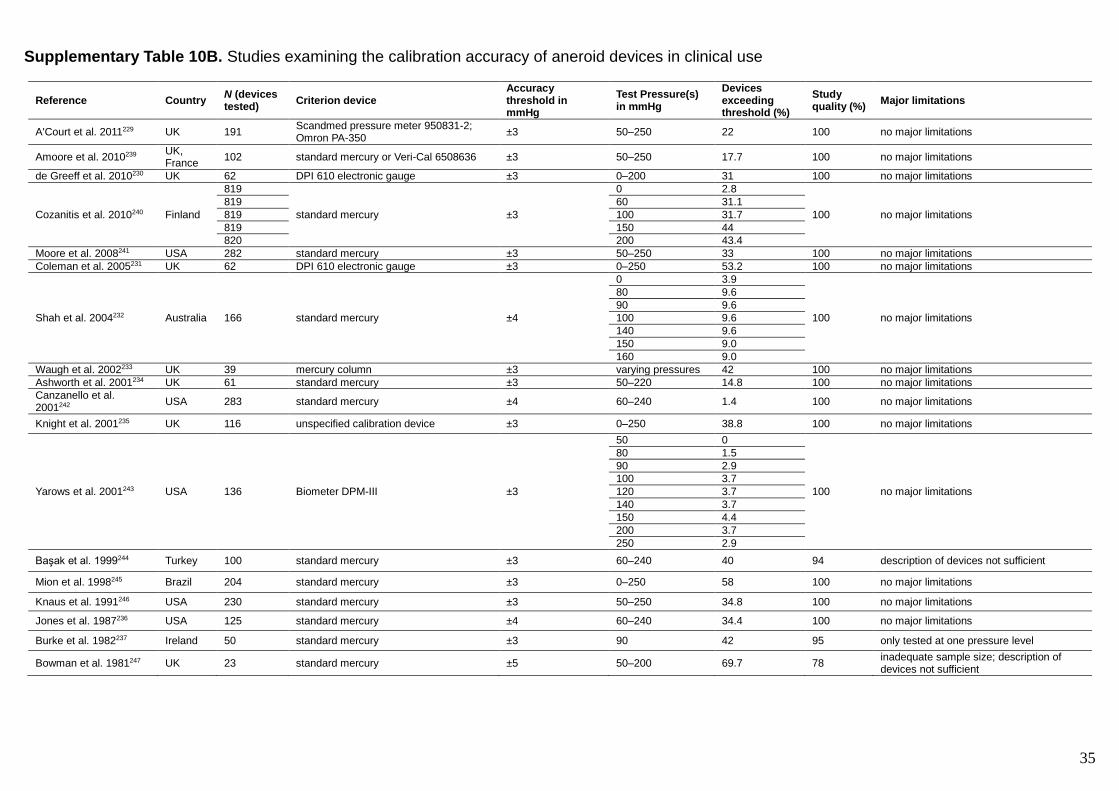
35
Supplementary Table 10B. Studies examining the calibration accuracy of aneroid devices in clinical use
Reference Country N (devices tested) Criterion device
Accuracy threshold in mmHg
Test Pressure(s) in mmHg
Devices exceeding threshold (%)
Study quality (%)
Major limitations
A'Court et al. 2011229 UK 191 Scandmed pressure meter 950831-2; Omron PA-350
±3 50–250 22 100 no major limitations
Amoore et al. 2010239 UK, France
102 standard mercury or Veri-Cal 6508636 ±3 50–250 17.7 100 no major limitations
de Greeff et al. 2010230 UK 62 DPI 610 electronic gauge ±3 0–200 31 100 no major limitations
Cozanitis et al. 2010240 Finland
819
standard mercury ±3
0 2.8
100 no major limitations
819 60 31.1
819 100 31.7
819 150 44
820 200 43.4
Moore et al. 2008241 USA 282 standard mercury ±3 50–250 33 100 no major limitations
Coleman et al. 2005231 UK 62 DPI 610 electronic gauge ±3 0–250 53.2 100 no major limitations
Shah et al. 2004232 Australia 166 standard mercury ±4
0 3.9
100 no major limitations
80 9.6
90 9.6
100 9.6
140 9.6
150 9.0
160 9.0
Waugh et al. 2002233 UK 39 mercury column ±3 varying pressures 42 100 no major limitations
Ashworth et al. 2001234 UK 61 standard mercury ±3 50–220 14.8 100 no major limitations
Canzanello et al. 2001242 USA 283 standard mercury ±4 60–240 1.4 100 no major limitations
Knight et al. 2001235 UK 116 unspecified calibration device ±3 0–250 38.8 100 no major limitations
Yarows et al. 2001243 USA 136 Biometer DPM-III ±3
50 0
100 no major limitations
80 1.5
90 2.9
100 3.7
120 3.7
140 3.7
150 4.4
200 3.7
250 2.9
Başak et al. 1999244 Turkey 100 standard mercury ±3 60–240 40 94 description of devices not sufficient
Mion et al. 1998245 Brazil 204 standard mercury ±3 0–250 58 100 no major limitations
Knaus et al. 1991246 USA 230 standard mercury ±3 50–250 34.8 100 no major limitations
Jones et al. 1987236 USA 125 standard mercury ±4 60–240 34.4 100 no major limitations
Burke et al. 1982237 Ireland 50 standard mercury ±3 90 42 95 only tested at one pressure level
Bowman et al. 1981247 UK 23 standard mercury ±5 50–200 69.7 78 inadequate sample size; description of devices not sufficient
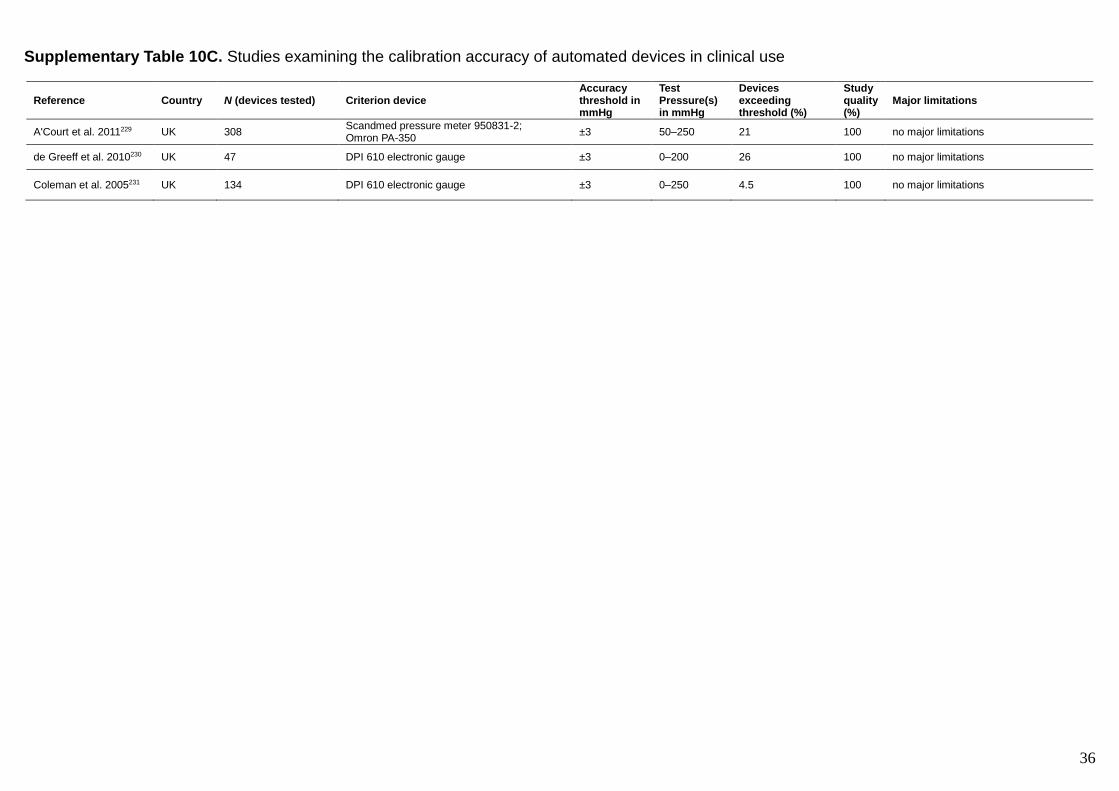
36
Supplementary Table 10C. Studies examining the calibration accuracy of automated devices in clinical use
Reference Country N (devices tested) Criterion device Accuracy threshold in mmHg
Test Pressure(s) in mmHg
Devices exceeding threshold (%)
Study quality (%)
Major limitations
A'Court et al. 2011229 UK 308 Scandmed pressure meter 950831-2; Omron PA-350
±3 50–250 21 100 no major limitations
de Greeff et al. 2010230 UK 47 DPI 610 electronic gauge ±3 0–200 26 100 no major limitations
Coleman et al. 2005231 UK 134 DPI 610 electronic gauge ±3 0–250 4.5 100 no major limitations

37
Procedure-related sources of inaccuracy
Supplementary Table 11. Studies examining the effect of rest period
Reference Country Observers N Participants N Age in y M±SD (range)
M/F Length of rest
Device SBP effect in mmHg
Sig. DBP effect in mmHg
Sig. Study quality (%)
Major limitations
Nikolic et al. 2014249 Australia NR NR
treated hypertensives
250 64±8 130/120 5min vs. 10min
Omron HEM-907
+4.2 <.001 +1.8 0.041 100 no major limitations
Sala et al. 2006250 Italy
trained operators
2 untreated hypertensives
55 46.3±1.7 (19–71) 35/20
0min vs. 16min
standard mercury
+11.6 <.05 +4.3 <.05 92 investigators not blinded

38
Supplementary Table 12. Studies examining the effect of body position (vs. sitting)
Reference Country Observers N Participants N Age in y M±SD (range)
M/F Measures per condition
Posture comparison (arm position)
Device(s) SBP effect in mmHg
Sig.
DBP effect in mmHg
Sig. Study quality (%)
Major limitations
Eşer et al. 2007252 Turkey researcher 1
healthy students
157 18–24 0/ 157
NR
standing (arm supported at heart level) v. sitting (arm on heart level chair rest)
Bosomat; Boso oscillomat
−2.9 <.05 +0.3 ns
77
randomisation not described; observers not blinded; did not control for order effects supine (not
specified) v. sitting (arm on heart level chair rest)
+5.1 <.05 +1.2 ns
Zachariah et al. 1990251
USA NR NR hypertensive clinic patients
168 51±9 (30–67)
116/ 52
2
standing (not specified) v. sitting (not specified) standard
mercury
+5 <.0001 +7 <.0001
73
recruitment not detailed; order not randomised; observers not blinded
supine (not specified) v. sitting (not specified)
+2 ns −5 <.0001
Cicolini et al. 2011253 Italy researcher 1
diagnosed hypertensives
250 66.3±13.4 111/ 139
NR
supine (arm on heart level pillow) v. sitting (arm on heart level table)
Omron HEM-7221-E; Omron M2 Basic
+2.02 <.001 −2.88 <.001 92 observers not blinded
Cicolini et al. 2010254 Italy researcher
1 male patients 79
23.7±4.8 (19–44)
79/0
NR
supine (arm on heart level pillow) v. sitting (arm on heart level table)
Omron HEM-4011C-E Mod. M1 Plus
−10.7 <.001 −13 <.001
73
recruitment not detailed; randomisation not described, observers not blinded; did not control for order effects
1 female patients 146 0/146 −9.2 <.001 −13.4 <.001
Netea et al. 2003255
The Nether-lands
NR NR hypertensives 57 55±12 29/26 3
supine (arm on heart level pillow) v. sitting (arm supported at heart level)
Hawksley random zero
+9.5 <.001 +4.8 <.001
88
recruitment information lacked detail; observers not blinded Bosomat +5.6 <.001 +5.1 <.001
Netea et al. 1998256
The Nether-lands
NR NR hypertensives, normotensives
245 NR 118/ 127
3
supine (arm on bed) v. sitting (arm on armrest)
Hawksley random zero
0 ns −5.2 .0001
88
recruitment information lacked detail; observers not blinded
Bosomat; Boso oscillomat
−1 ns −2.4 .0001
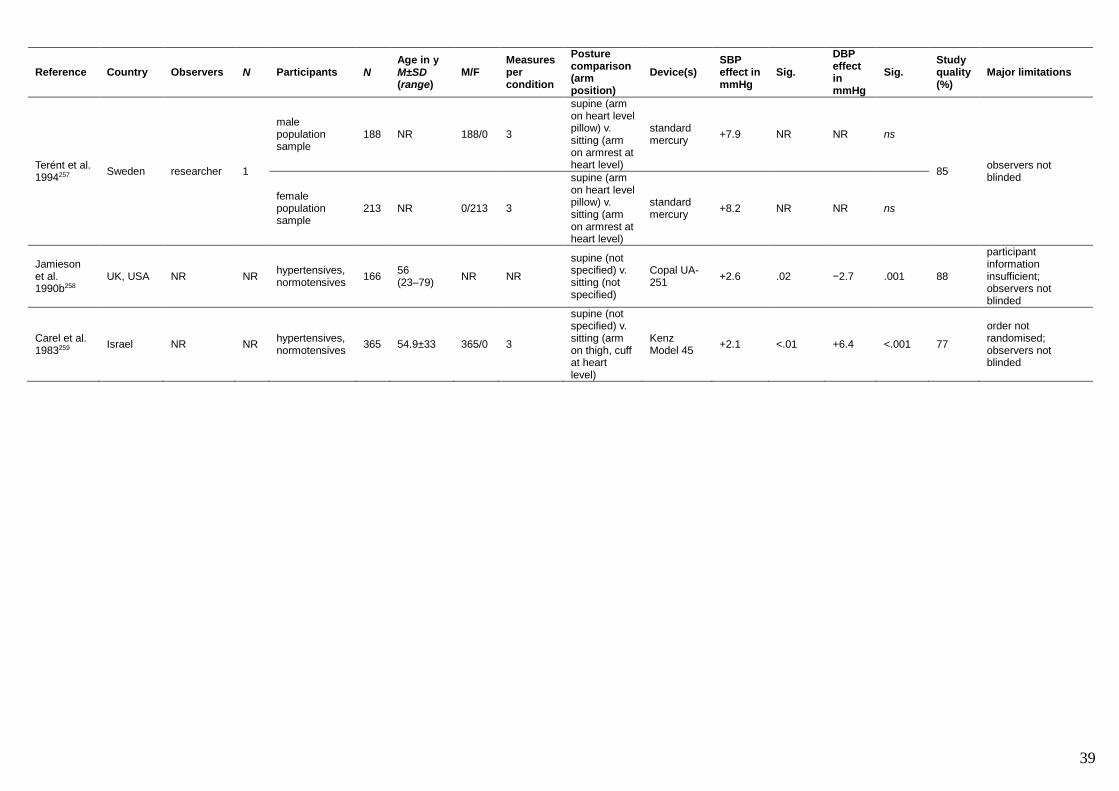
39
Reference Country Observers N Participants N Age in y M±SD (range)
M/F Measures per condition
Posture comparison (arm position)
Device(s) SBP effect in mmHg
Sig.
DBP effect in mmHg
Sig. Study quality (%)
Major limitations
Terént et al. 1994257 Sweden researcher 1
male population sample
188 NR 188/0 3
supine (arm on heart level pillow) v. sitting (arm on armrest at heart level)
standard mercury
+7.9 NR NR ns
85 observers not blinded
female population sample
213 NR 0/213 3
supine (arm on heart level pillow) v. sitting (arm on armrest at heart level)
standard mercury
+8.2 NR NR ns
Jamieson et al. 1990b258
UK, USA NR NR hypertensives, normotensives
166 56 (23–79) NR NR
supine (not specified) v. sitting (not specified)
Copal UA-251
+2.6 .02 −2.7 .001 88
participant information insufficient; observers not blinded
Carel et al. 1983259 Israel NR NR
hypertensives, normotensives
365 54.9±33 365/0 3
supine (not specified) v. sitting (arm on thigh, cuff at heart level)
Kenz Model 45
+2.1 <.01 +6.4 <.001 77
order not randomised; observers not blinded

40
Supplementary Table 13. Studies examining the effect of legs crossed at knees
Reference Country Observers N Participants N Age in y M±SD (range)
M/F Measures per condition
Device
SBP effect in mmHg
Sig.
DBP effect in mmHg
Sig. Study quality (%)
Major limitations
Pinar et al. 2010a260 Turkey
Experienced nurses
3 patients 283 58.1±11.8 (30–85) 121/162 2 standard mercury +14.89 <.001 +10.81 <.001 85
partial blinding; no random allocation
Adiyaman et al. 2007261
The Netherlands
trained investigator
1
treated hypertensives, treated diabetics, normotensives
111 52± 17 (19–80) 51/60 2–3 Omron 705CP +5.7 <.05 +1.4 <.05 85
recruitment not sufficiently described; random allocation process not described; observers not blinded
Pinar et al. 2004262 Turkey
trained nurse
1 hypertensives (treated and untreated)
238 56.1±8.7 138/10 1 standard mercury +8.49 <.001 +5.71 <.001 81 no random allocation; observers were not blinded
Avvampato et al. 2001263
USA nurse researcher
1 treated hypertensives
89 25–89 70–80% /20–30% 1
Vital-Check Vital Signs Measurement System 4200
+1.9 ns +0.6 ns 92 observers not blinded
Keele-Smith et al. 2001264
USA, Mexico
registered nurses
6
seniors (49 treated for hypertension, 54 not)
103 70.8 (50–92) 51/52 1
unspecified aneroid devices
+5.92 <.001 +2.98 <.001 92 observers not blinded
Foster-Fitzpatrick et al. 1999265
USA clinical nurses
2 hypertensives 84 31–81 84/0 1
Vital-Check Vital Signs Measurement System 4200
+9.07 <.0001 +3.96 <.0001
85 no random allocation; observers not blinded
Peters et al. 1999266 Canada
doctor (blinded)
1
normotensives 50 25.1±3.7 23/27
1 Omron HEM-706
+2.5 <.05 −0.1 ns
96 random allocation process not described
hypertensives 53 53.4± 12.7
22/31 +8.1 <.05 +4.5 <.05
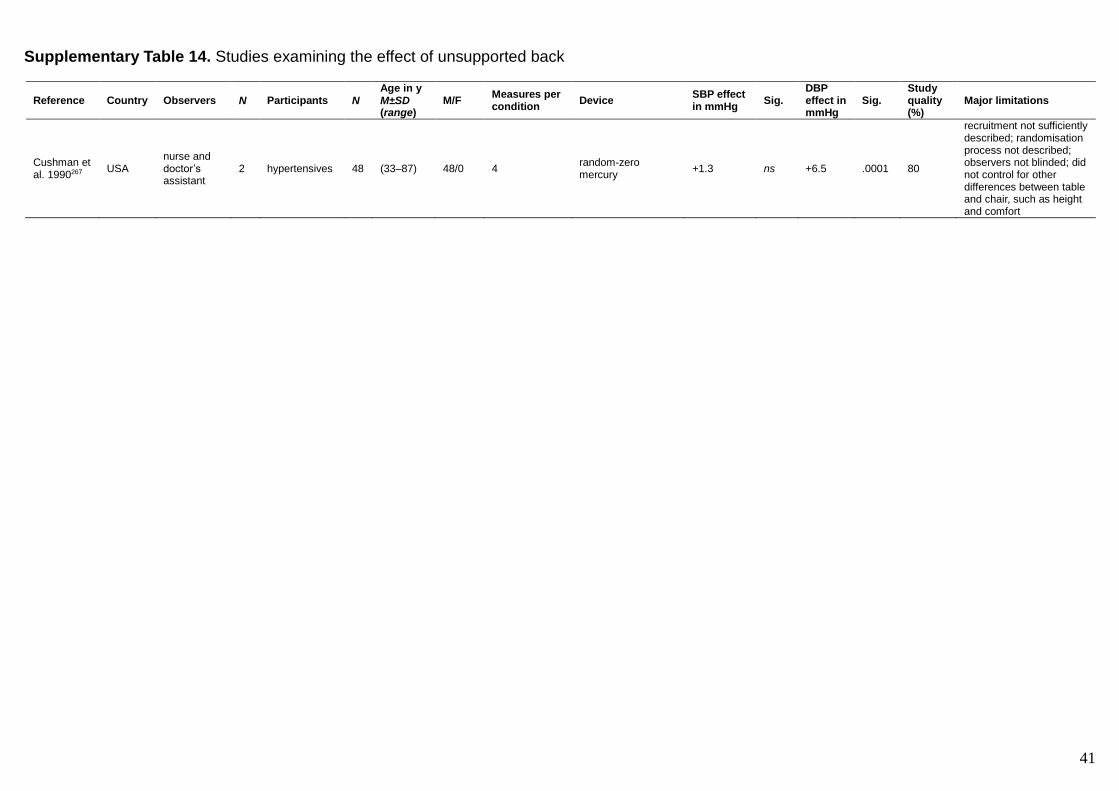
41
Supplementary Table 14. Studies examining the effect of unsupported back
Reference Country Observers N Participants N Age in y M±SD (range)
M/F Measures per condition
Device SBP effect in mmHg
Sig. DBP effect in mmHg
Sig. Study quality (%)
Major limitations
Cushman et al. 1990267 USA
nurse and doctor’s assistant
2 hypertensives 48 (33–87) 48/0 4 random-zero mercury
+1.3 ns +6.5 .0001 80
recruitment not sufficiently described; randomisation process not described; observers not blinded; did not control for other differences between table and chair, such as height and comfort
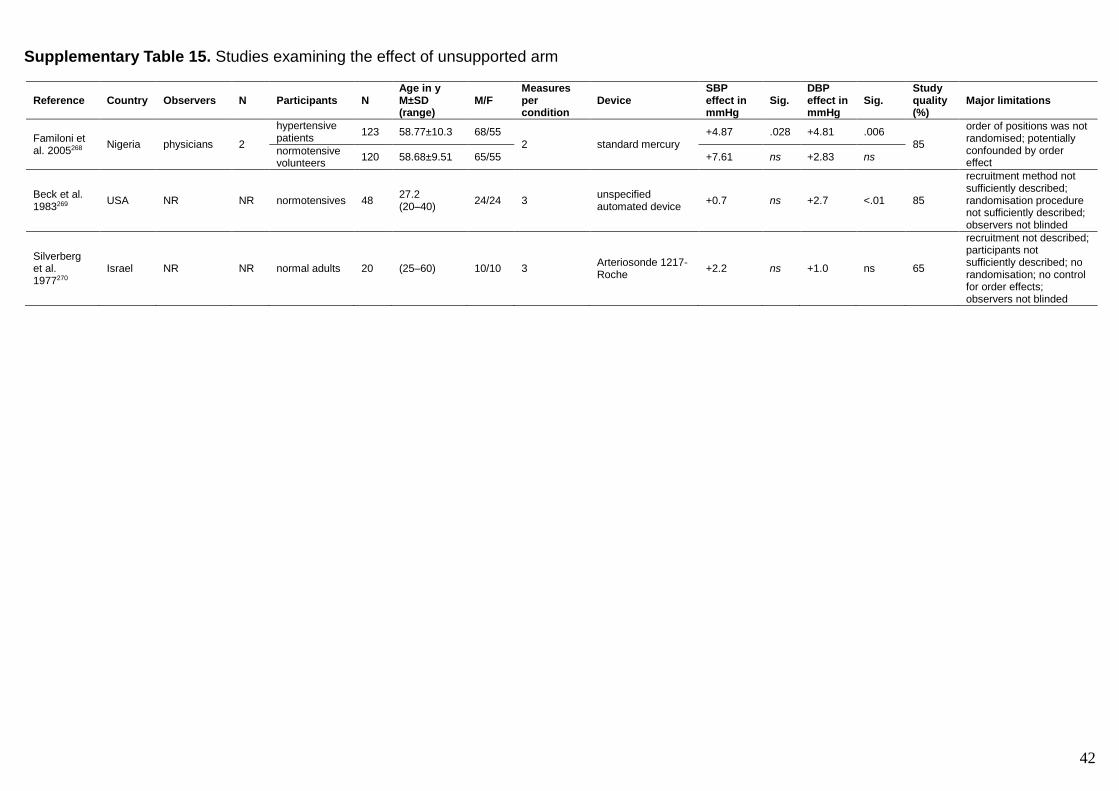
42
Supplementary Table 15. Studies examining the effect of unsupported arm
Reference Country Observers N Participants N Age in y M±SD (range)
M/F Measures per condition
Device SBP effect in mmHg
Sig. DBP effect in mmHg
Sig. Study quality (%)
Major limitations
Familoni et al. 2005268 Nigeria physicians 2
hypertensive patients
123 58.77±10.3 68/55 2 standard mercury
+4.87 .028 +4.81 .006 85
order of positions was not randomised; potentially confounded by order effect
normotensive volunteers
120 58.68±9.51 65/55 +7.61 ns +2.83 ns
Beck et al. 1983269 USA NR NR normotensives 48
27.2 (20–40) 24/24 3
unspecified automated device +0.7 ns +2.7 <.01 85
recruitment method not sufficiently described; randomisation procedure not sufficiently described; observers not blinded
Silverberg et al. 1977270
Israel NR NR normal adults 20 (25–60) 10/10 3 Arteriosonde 1217-Roche +2.2 ns +1.0 ns 65
recruitment not described; participants not sufficiently described; no randomisation; no control for order effects; observers not blinded
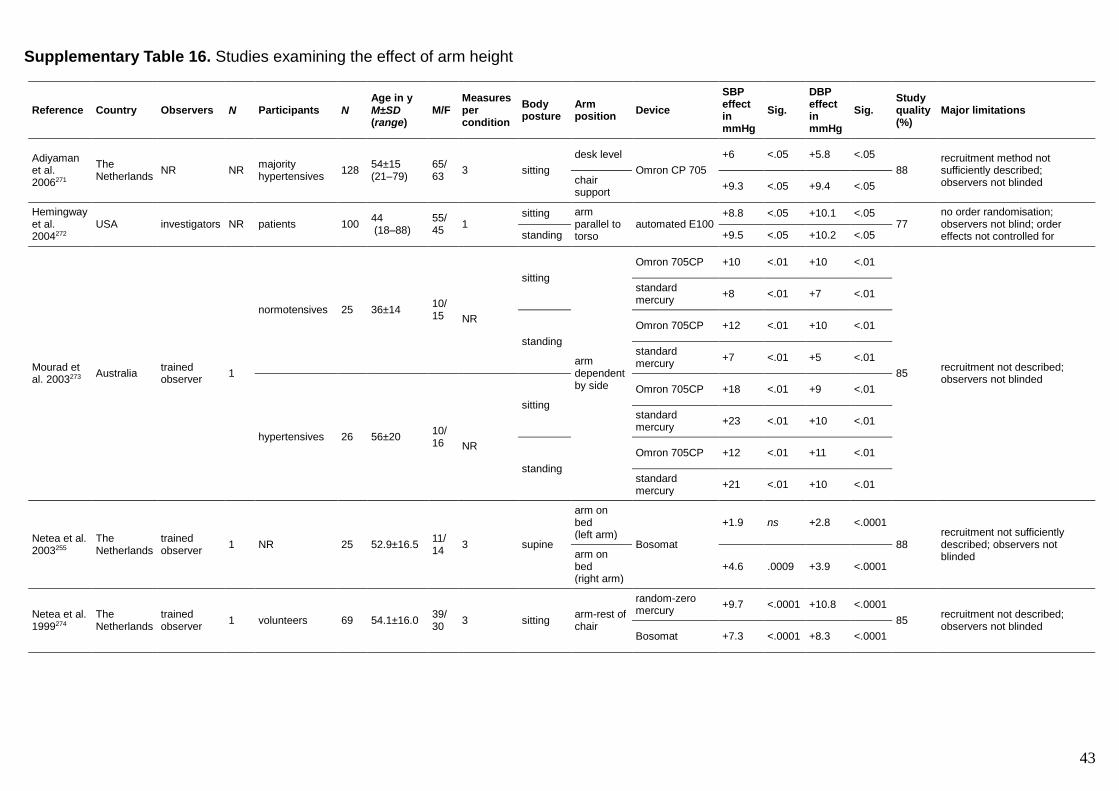
43
Supplementary Table 16. Studies examining the effect of arm height
Reference Country Observers N Participants N Age in y M±SD (range)
M/F Measures per condition
Body posture
Arm position
Device
SBP effect in mmHg
Sig.
DBP effect in mmHg
Sig. Study quality (%)
Major limitations
Adiyaman et al. 2006271
The Netherlands
NR NR majority hypertensives
128 54±15 (21–79)
65/ 63
3 sitting
desk level
Omron CP 705
+6 <.05 +5.8 <.05
88 recruitment method not sufficiently described; observers not blinded chair
support +9.3 <.05 +9.4 <.05
Hemingway et al. 2004272
USA investigators NR patients 100 44 (18–88)
55/ 45
1 sitting arm
parallel to torso
automated E100 +8.8 <.05 +10.1 <.05
77 no order randomisation; observers not blind; order effects not controlled for standing +9.5 <.05 +10.2 <.05
Mourad et al. 2003273 Australia
trained observer
1
normotensives 25 36±14 10/ 15
NR
sitting
arm dependent by side
Omron 705CP +10 <.01 +10 <.01
85 recruitment not described; observers not blinded
standard mercury
+8 <.01 +7 <.01
standing
Omron 705CP +12 <.01 +10 <.01
standard mercury
+7 <.01 +5 <.01
hypertensives 26 56±20 10/ 16
NR
sitting
Omron 705CP +18 <.01 +9 <.01
standard mercury
+23 <.01 +10 <.01
standing
Omron 705CP +12 <.01 +11 <.01
standard mercury
+21 <.01 +10 <.01
Netea et al. 2003255
The Netherlands
trained observer
1 NR 25 52.9±16.5 11/ 14
3 supine
arm on bed (left arm)
Bosomat
+1.9 ns +2.8 <.0001
88 recruitment not sufficiently described; observers not blinded arm on
bed (right arm)
+4.6 .0009 +3.9 <.0001
Netea et al. 1999274
The Netherlands
trained observer
1 volunteers 69 54.1±16.0 39/ 30
3 sitting arm-rest of chair
random-zero mercury
+9.7 <.0001 +10.8 <.0001
85 recruitment not described; observers not blinded
Bosomat +7.3 <.0001 +8.3 <.0001
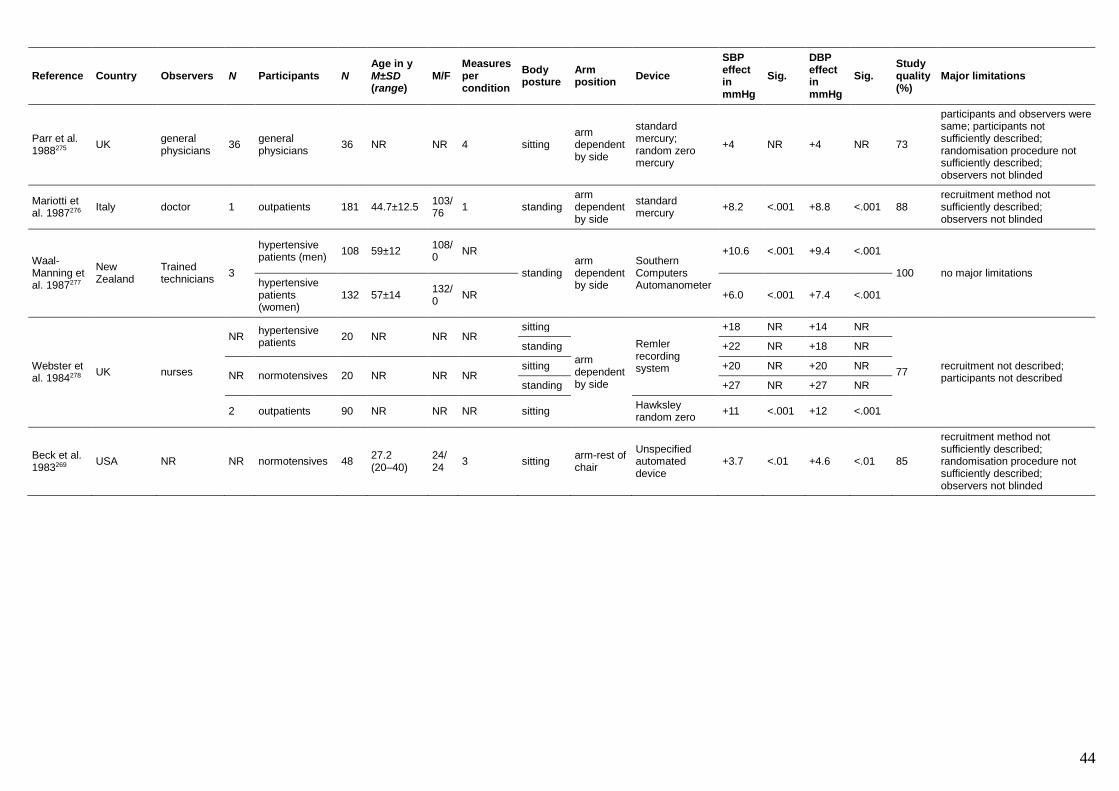
44
Reference Country Observers N Participants N Age in y M±SD (range)
M/F Measures per condition
Body posture
Arm position
Device
SBP effect in mmHg
Sig.
DBP effect in mmHg
Sig. Study quality (%)
Major limitations
Parr et al. 1988275 UK
general physicians
36 general physicians
36 NR NR 4 sitting arm dependent by side
standard mercury; random zero mercury
+4 NR +4 NR 73
participants and observers were same; participants not sufficiently described; randomisation procedure not sufficiently described; observers not blinded
Mariotti et al. 1987276 Italy doctor 1 outpatients 181 44.7±12.5
103/76
1 standing arm dependent by side
standard mercury
+8.2 <.001 +8.8 <.001 88 recruitment method not sufficiently described; observers not blinded
Waal-Manning et al. 1987277
New Zealand
Trained technicians 3
hypertensive patients (men)
108 59±12 108/0
NR
standing arm dependent by side
Southern Computers Automanometer
+10.6 <.001 +9.4 <.001
100 no major limitations hypertensive patients (women)
132 57±14 132/0
NR +6.0 <.001 +7.4 <.001
Webster et al. 1984278 UK nurses
NR hypertensive patients
20 NR NR NR sitting
arm dependent by side
Remler recording system
+18 NR +14 NR
77 recruitment not described; participants not described
standing +22 NR +18 NR
NR normotensives 20 NR NR NR sitting +20 NR +20 NR
standing +27 NR +27 NR
2 outpatients 90 NR NR NR sitting Hawksley random zero
+11 <.001 +12 <.001
Beck et al. 1983269 USA NR NR normotensives 48
27.2 (20–40)
24/ 24
3 sitting arm-rest of chair
Unspecified automated device
+3.7 <.01 +4.6 <.01 85
recruitment method not sufficiently described; randomisation procedure not sufficiently described; observers not blinded
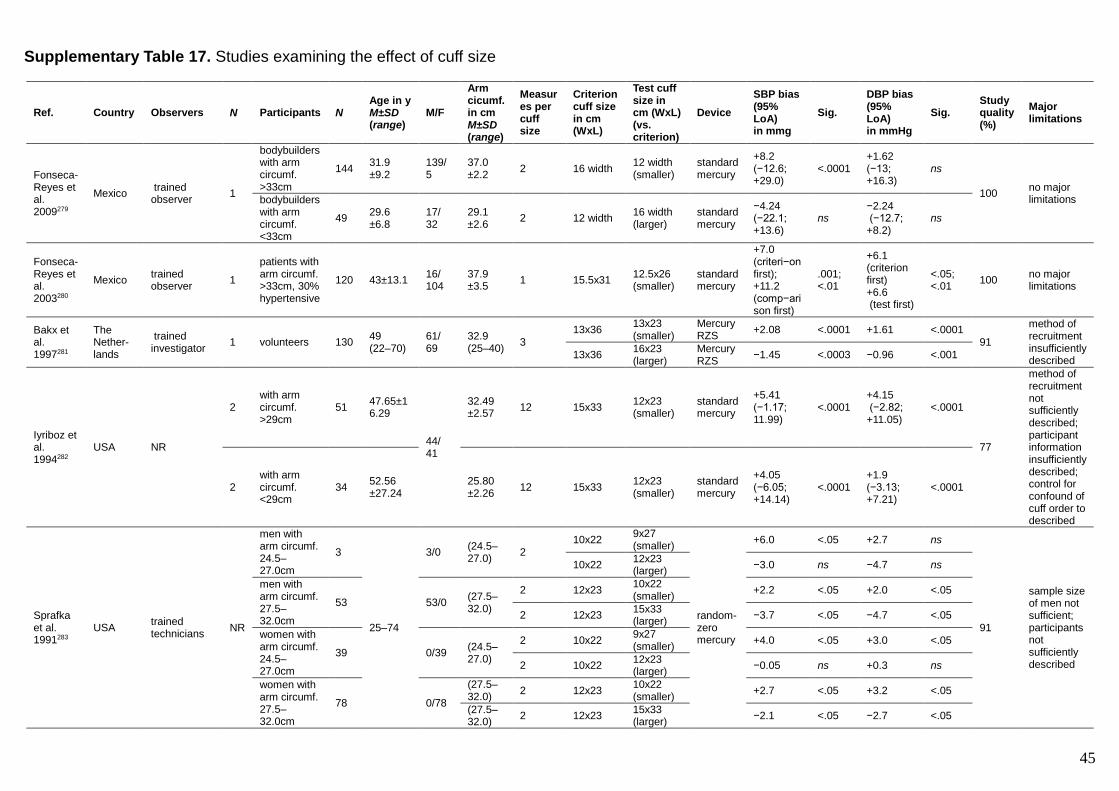
45
Supplementary Table 17. Studies examining the effect of cuff size
Ref. Country Observers N Participants N Age in y M±SD (range)
M/F
Arm cicumf. in cm M±SD (range)
Measures per cuff size
Criterion cuff size in cm (WxL)
Test cuff size in cm (WxL) (vs. criterion)
Device
SBP bias (95% LoA) in mmg
Sig.
DBP bias (95% LoA) in mmHg
Sig. Study quality (%)
Major limitations
Fonseca-Reyes et al. 2009279
Mexico trained observer 1
bodybuilders with arm circumf. >33cm
144 31.9 ±9.2
139/ 5
37.0 ±2.2 2 16 width
12 width (smaller)
standard mercury
+8.2 (−12.6; +29.0)
<.0001 +1.62 (−13; +16.3)
ns
100 no major limitations bodybuilders
with arm circumf. <33cm
49 29.6 ±6.8
17/ 32
29.1 ±2.6 2 12 width
16 width (larger)
standard mercury
−4.24 (−22.1; +13.6)
ns −2.24 (−12.7; +8.2)
ns
Fonseca-Reyes et al. 2003280
Mexico trained observer
1
patients with arm circumf. >33cm, 30% hypertensive
120 43±13.1 16/ 104
37.9 ±3.5
1 15.5x31 12.5x26 (smaller)
standard mercury
+7.0 (criteri−on first); +11.2 (comp−arison first)
.001; <.01
+6.1 (criterion first) +6.6 (test first)
<.05; <.01
100 no major limitations
Bakx et al. 1997281
The Nether-lands
trained investigator 1 volunteers 130
49 (22–70)
61/ 69
32.9 (25–40) 3
13x36 13x23 (smaller)
Mercury RZS
+2.08 <.0001 +1.61 <.0001 91
method of recruitment insufficiently described
13x36 16x23 (larger)
Mercury RZS
−1.45 <.0003 −0.96 <.001
Iyriboz et al. 1994282
USA NR
2 with arm circumf. >29cm
51 47.65±16.29
44/ 41
32.49 ±2.57 12 15x33
12x23 (smaller)
standard mercury
+5.41 (−1.17; 11.99)
<.0001 +4.15 (−2.82; +11.05)
<.0001
77
method of recruitment not sufficiently described; participant information insufficiently described; control for confound of cuff order to described
2 with arm circumf. <29cm
34 52.56 ±27.24
25.80 ±2.26 12 15x33
12x23 (smaller)
standard mercury
+4.05 (−6.05; +14.14)
<.0001 +1.9 (−3.13; +7.21)
<.0001
Sprafka et al. 1991283
USA trained technicians
NR
men with arm circumf. 24.5–27.0cm
3
25–74
3/0 (24.5–27.0) 2
10x22 9x27 (smaller)
random-zero mercury
+6.0 <.05 +2.7 ns
91
sample size of men not sufficient; participants not sufficiently described
10x22 12x23 (larger)
−3.0 ns −4.7 ns
men with arm circumf. 27.5–32.0cm
53 53/0 (27.5–32.0)
2 12x23 10x22 (smaller)
+2.2 <.05 +2.0 <.05
2 12x23 15x33 (larger)
−3.7 <.05 −4.7 <.05
women with arm circumf. 24.5–27.0cm
39 0/39 (24.5–27.0)
2 10x22 9x27 (smaller)
+4.0 <.05 +3.0 <.05
2 10x22 12x23 (larger)
−0.05 ns +0.3 ns
women with arm circumf. 27.5–32.0cm
78 0/78
(27.5–32.0) 2 12x23
10x22 (smaller)
+2.7 <.05 +3.2 <.05
(27.5–32.0) 2 12x23
15x33 (larger)
−2.1 <.05 −2.7 <.05

46
Supplementary Table 18. Studies examining the effect of cuff placed over clothing
Reference Country Observers N Participants N Age in y M±SD (range)
M/F Measures per condition
Device
SBP effect in mmHg
Sig. DBP effect in mmHg
Sig. Study quality (%)
Major limitations
Pinar et al. 2010b284 Turkey nurses 3
hypertensive patients
258 61.7±11.6 (33–85) 122/136 2
standard mercury
−0.44 ns −0.25 ns 73
recruitment not sufficiently described; no random allocation or control for order effects; observers not blinded
Liebl et a 2004285 Germany
experienced observer
1 hypertensives and normotensives
201 45.5±23.7 101/100 1
standard mercury
+1.0 ns +0.8 ns
96 recruitment not sufficiently described Boso Medicus
Prestige +1.1 ns +0.8 ns
Kahan et al. 2003286 Israel physician 1 medical patients 201 46 68/133 3 A&D UA-767 −0.54 ns +0.56 ns 81
recruitment not described; random allocation process not described; observers not blinded
Holleman et al. 1993287
USA NR NR smokers and medical patients
36 43.8±13.8 21/15 3 Dinamap 1846sx
−1.7 ns −2.2 ns 69
recruitment method not specific; did not control for order effect; observers not blinded; small sample size
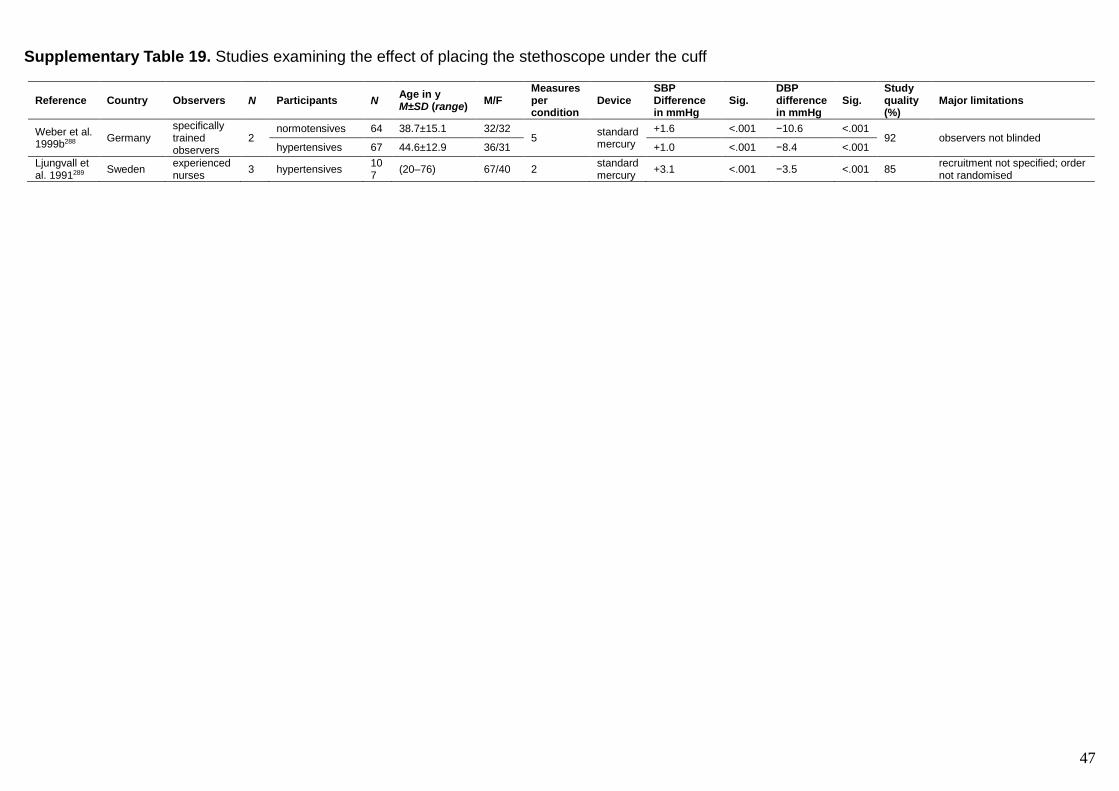
47
Supplementary Table 19. Studies examining the effect of placing the stethoscope under the cuff
Reference Country Observers N Participants N Age in y M±SD (range) M/F
Measures per condition
Device SBP Difference in mmHg
Sig. DBP difference in mmHg
Sig. Study quality (%)
Major limitations
Weber et al. 1999b288 Germany
specifically trained observers
2 normotensives 64 38.7±15.1 32/32
5 standard mercury
+1.6 <.001 −10.6 <.001 92 observers not blinded
hypertensives 67 44.6±12.9 36/31 +1.0 <.001 −8.4 <.001
Ljungvall et al. 1991289 Sweden
experienced nurses
3 hypertensives 107
(20–76) 67/40 2 standard mercury
+3.1 <.001 −3.5 <.001 85 recruitment not specified; order not randomised

48
Supplementary Table 20. Studies examining the effect of talking during measurement
Reference Country Observers N Participants N Age in y M±SD (range)
M/F Speech content
Measures per condition
Device SBP effect in mmHg
Sig. DBP effect in mmHg
Sig. Study quality (%)
Major limitations
Zheng et al. 2012290 UK
trained observer
1 patients 111 46±16 55/56 counting numbers
3 Accoson Green- light 300
+5.3 <.001 +6.2 <.001 77
recruitment not sufficiently described, random allocation process not described, investigators not blinded, results lacked detail
Le Pailleur et al. 2001291
France doctor 1 hypertensives 64 59±1.50 (25–84) 33/31
stressful (hyper-tension history) 10
Novacor Diasys 200 R
+19 <.0001 +13.3 <.0001
81
recruitment not described sufficiently, random allocation process not described, observers not blinded
counting numbers
+4 <.0001 +5 <.0001
Le Pailleur et al. 1996292
France doctor 1 hypertensives 42 57.5±1.94 (19–86) 24/18
stressful (hyper-tension history)
10 Novacor Diasys 200 R
+19 <.0001 +13 <.0001
81
recruitment not described sufficiently, random allocation process not described, observers not blinded
relaxed (favourite activities etc.)
+12 <.0001 +10 <.0001
Liehr et al. 1992293 USA
research assistant
1 volunteers 109 41.7±10.9 (21–67) 54/55
Non-stressful (daily activities)
2 Dinamap 845
+9 <.001 +9 <.001 92 observers not blinded
Hellmann et al. 1984294
USA NR NR non-medicated hypertensives
48 (27–69) 46/2 reading out-loud
3 standard mercury
NR NR +8.25 <.01 85
participant characteristics not sufficiently described, observers not blinded
Malinow et al. 1982295 USA
experimenter
1 normotensives 20 (21–81) 5/15
described occupation
2 Dinamap 845
+8.4 <.01 +10 <.01 73
no random allocation, observers not blinded, small sample size
hypertensives 20 (27–63) 12/8 +13.6 <.01 +14.3 <.01
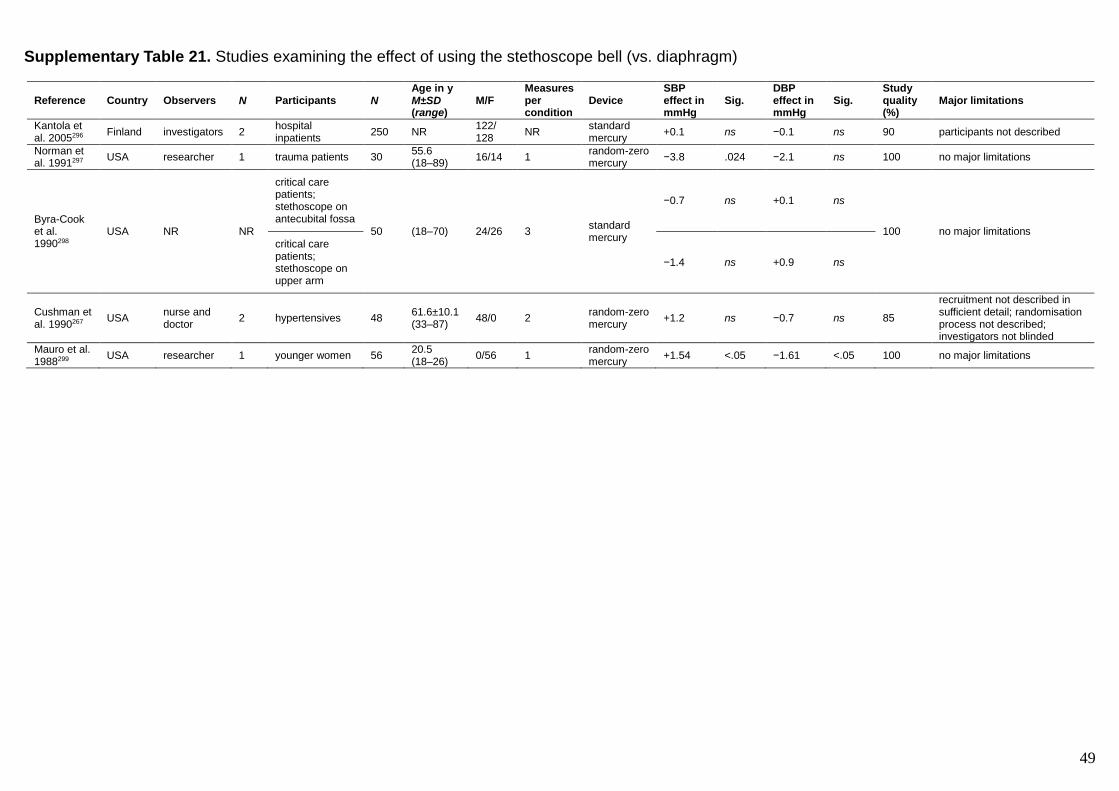
49
Supplementary Table 21. Studies examining the effect of using the stethoscope bell (vs. diaphragm)
Reference Country Observers N Participants N Age in y M±SD (range)
M/F Measures per condition
Device SBP effect in mmHg
Sig. DBP effect in mmHg
Sig. Study quality (%)
Major limitations
Kantola et al. 2005296 Finland investigators 2
hospital inpatients
250 NR 122/ 128
NR standard mercury
+0.1 ns −0.1 ns 90 participants not described
Norman et al. 1991297 USA researcher 1 trauma patients 30
55.6 (18–89) 16/14 1
random-zero mercury
−3.8 .024 −2.1 ns 100 no major limitations
Byra-Cook et al. 1990298
USA NR NR
critical care patients; stethoscope on antecubital fossa
50 (18–70) 24/26 3 standard mercury
−0.7 ns +0.1 ns
100 no major limitations
critical care patients; stethoscope on upper arm
−1.4 ns +0.9 ns
Cushman et al. 1990267 USA
nurse and doctor
2 hypertensives 48 61.6±10.1 (33–87) 48/0 2
random-zero mercury
+1.2 ns −0.7 ns 85
recruitment not described in sufficient detail; randomisation process not described; investigators not blinded
Mauro et al. 1988299 USA researcher 1 younger women 56
20.5 (18–26) 0/56 1
random-zero mercury
+1.54 <.05 −1.61 <.05 100 no major limitations
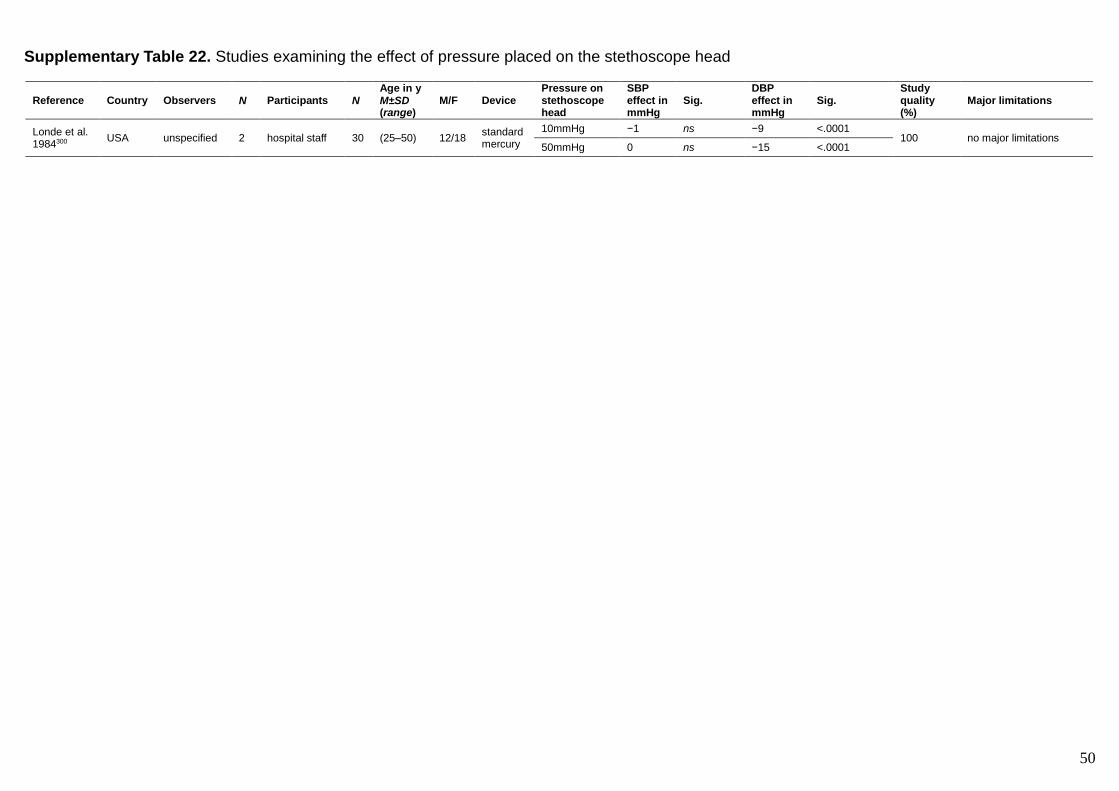
50
Supplementary Table 22. Studies examining the effect of pressure placed on the stethoscope head
Reference Country Observers N Participants N Age in y M±SD (range)
M/F Device Pressure on stethoscope head
SBP effect in mmHg
Sig. DBP effect in mmHg
Sig. Study quality (%)
Major limitations
Londe et al. 1984300 USA unspecified 2 hospital staff 30 (25–50) 12/18
standard mercury
10mmHg −1 ns −9 <.0001 100 no major limitations
50mmHg 0 ns −15 <.0001

51
Supplementary Table 23. Studies examining the effect of fast deflation rate
Reference Country Observers N Participants N No of measurements
Comparisons Device SBP effect (mmHg)
Sig. DBP effect (mmHg)
Sig. Study quality (%)
Major limitations
Zheng et al. 2011301 UK
trained observers
2 recorded waveforms from 75 people
4725 2 per patient 1x to 7x recorded rate
Accoson Greenlight 300
−2.6 to −7.1 <.05 +2.1 to +6.3 <.05 95 recruitment method not described
Reinders et al. 2006302
Netherlands, Australia
NR NR
antenatal or recently delivered women
98 4 per patient >5mmHg/s vs. <2mmHg/s
Hawksley random-zero
−9 <.001 +2 ns 100 no major limitations
Yong et al. 1987303 USA N/A N/A
computer simulation
N/A N/A
5mmHg/s; 3mmHg/s; 3mmHg/heart beat; 2mmHg/heart beat
N/A −2.4 to −7.1 NR +2.4 to +7.1 NR 100 no major limitations

52
Supplementary Table 24. Studies examining the effect of the interval between measurements
Reference Country Observers N Participants N Age in y M±SD (range)
M/F Device Interval A
Interval B
Measures per condition
SBP difference in mmHg (A−B)
Sig.
DBP difference in mmHg (A−B)
Sig. Study quality (%)
Major limitations
Myers et al. 2008304 Canada NR NR Clinic patients 50 NR NR BpTRU 1min 2min 5 +2 ns −1 ns 85
participants not sufficiently described
Yarows et al. 2001305 USA NR NR
normotensives and hypertensives
50 50±17 (18–77) 28/22
Omron HEM-705CP
15s 1min 3 +1.1 ns 0.0 ns 100 no major limitations
Koehler et al. 2002306 Brazil Investigator 1 clinic patients
92 21–86 16/76 standard mercury
no interval
1min 2
1.33 less variation
.019 0.47 less variation
ns
90
smaller sample sizes (less power) for the automated devices cf. mercury
19 27–82 5/14 Datascope 2NEL
1.86 greater variation
ns 0.65 less variation
ns
32 18–75 9/23
Nihum Seimitsu Sokk DS-91
2.59 greater variation
ns 0.7 greater variation
ns
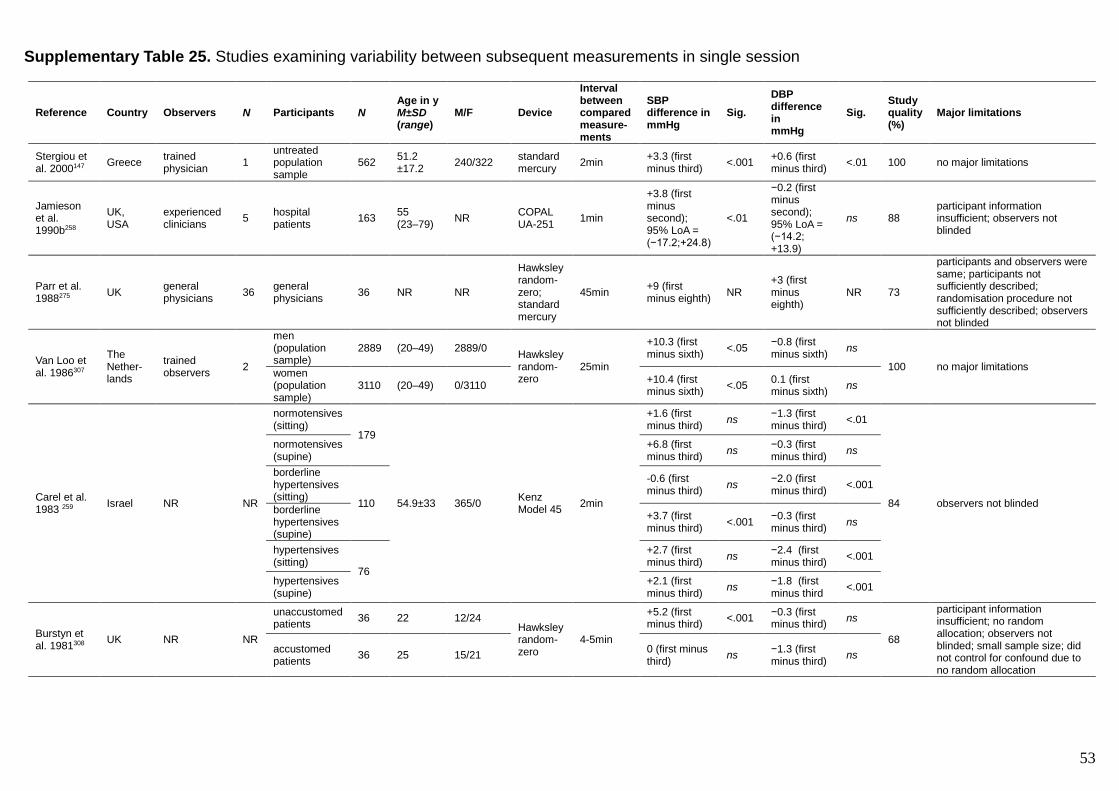
53
Supplementary Table 25. Studies examining variability between subsequent measurements in single session
Reference Country Observers N Participants N Age in y M±SD (range)
M/F Device
Interval between compared measure-ments
SBP difference in mmHg
Sig.
DBP difference in mmHg
Sig. Study quality (%)
Major limitations
Stergiou et al. 2000147 Greece
trained physician
1 untreated population sample
562 51.2 ±17.2
240/322 standard mercury
2min +3.3 (first minus third) <.001
+0.6 (first minus third) <.01 100 no major limitations
Jamieson et al. 1990b258
UK, USA
experienced clinicians
5 hospital patients
163 55 (23–79) NR
COPAL UA-251
1min
+3.8 (first minus second); 95% LoA = (−17.2;+24.8)
<.01
−0.2 (first minus second); 95% LoA = (−14.2; +13.9)
ns 88 participant information insufficient; observers not blinded
Parr et al. 1988275 UK
general physicians
36 general physicians
36 NR NR
Hawksley random-zero; standard mercury
45min +9 (first minus eighth) NR
+3 (first minus eighth)
NR 73
participants and observers were same; participants not sufficiently described; randomisation procedure not sufficiently described; observers not blinded
Van Loo et al. 1986307
The Nether-lands
trained observers
2
men (population sample)
2889 (20–49) 2889/0 Hawksley random-zero
25min
+10.3 (first minus sixth) <.05
−0.8 (first minus sixth) ns
100 no major limitations women (population sample)
3110 (20–49) 0/3110 +10.4 (first minus sixth) <.05
0.1 (first minus sixth)
ns
Carel et al. 1983 259 Israel NR NR
normotensives (sitting)
179
54.9±33 365/0 Kenz Model 45
2min
+1.6 (first minus third)
ns −1.3 (first minus third) <.01
84 observers not blinded
normotensives (supine)
+6.8 (first minus third)
ns −0.3 (first minus third) ns
borderline hypertensives (sitting)
110
-0.6 (first minus third)
ns −2.0 (first minus third) <.001
borderline hypertensives (supine)
+3.7 (first minus third)
<.001 −0.3 (first minus third) ns
hypertensives (sitting)
76
+2.7 (first minus third)
ns −2.4 (first minus third) <.001
hypertensives (supine)
+2.1 (first minus third)
ns −1.8 (first minus third <.001
Burstyn et al. 1981308 UK NR NR
unaccustomed patients
36 22 12/24 Hawksley random-zero
4-5min
+5.2 (first minus third) <.001
−0.3 (first minus third) ns
68
participant information insufficient; no random allocation; observers not blinded; small sample size; did not control for confound due to no random allocation
accustomed patients
36 25 15/21 0 (first minus third) ns
−1.3 (first minus third) ns

54
Supplementary Table 26. Studies examining the effect of inter-arm variability
Reference Country Observers N Participa-nts N Age in y M±SD (range)
M/F Meas-ures per arm
Method of measures
Device
SBP Difference Right − Left (95% LoA) or absolute difference ±SD in mmHg
Sig.
DBP Difference Right − Left (95% LoA) or absolute difference in ±SD mmHg
Sig. Study quality (%)
Major limitations
Agarwal et al. 2008311 USA
trained nurse
1 clinic patients 421 62.9 ±13.2
401/ 20
3 sequential Omron HEM-412C
+5.1 <.001 +2.6 <.001 100 no major limitations
Lazar et al. 2008312 USA NR NR
women in HIV study
335 NR 0/ 335
2 sequential Critikon Dinamap 1846 SX
|6| ±5 NR |4| ±3 NR 95
insufficient participant information (age range not stated)
Poon et al. 2008313 UK NR NR
pregnant women
5435 NR 0/ 5435
NR simul-taneous NR −0.8 ns +0.6 ns 82
recruitment procedure not described; insufficient participant information
Stergiou et al. 2008314 Greece
Invest-igators
2–3 NR 63
60.5 ±12.9
34/29 3 simul-taneous
Microlife WatchBP Office
−0.01 (−8.41; +8.39) ns
−0.38 (−5.78; +5.02) ns 100
no major limitations
Clark et al. 2007a315 UK
Invest-igator 1 patients 247 NR NR NR sequential standard
mercury +1.6 <.05 −1.4 <.05 91
overall participant information not stated - only in subgroups
Clark et al. 2007b316 UK NR NR NR 94
69.6±9.7 (44.5–91.7)
NR NR simul-taneous
Dopplex II FD2
|5.9| ±4.9 NR |4.6| ±3.6 NR 91
participants not sufficiently described
Eguchi et al. 2007317 USA NR NR NR 145
57.7 ±15.8
70/75
NR simul-taneous A&D
UA767-PC
+1.8 .002 +1.2 <.001
95
recruitment procedure not sufficiently described
NR sequential +3.1 <.001 +1.3 .001
Arnett et al. 2005318 USA
certified tech-nicians
NR
random sample
824 55.6 ±11.2
405/ 419
3 sequential
Critikon Dinamap 1846 SX/P
|4.61| ±4.10 <.001 |2.96| ±2.51 <.001 100
no major limitations hypertensive
siblings 2195 55.5 ±11.2
865/ 1330
|5.35| ±4.98 <.001 |3.09| ±2.73 <.001
Karagiannis et al. 2005319
Greece NR NR patients, ward visitors, nurses
384 54.0 ±18.3
189/ 195
NR simul-taneous
Omron HEM-705CP
+1.2 (−8.8;+11.2)
<.0005 +0.4 (−8.0;+8.8)
<.05 95
recruitment procedure not sufficiently described
Kimura et al. 2004320 Japan NR NR
general population
1090 62.4 ±11.1
388/ 702
NR simul-taneous
Colin Form PWV/ ABI
|4.9| ± 4.4; −0.6 (−13.8; +12.6)
<.05 |3.7| ± 3.0; +1.1 (−8.3; +10.5)
<.05 100 no major limitations

55
Reference Country Observers N Participa-nts N Age in y M±SD (range)
M/F Meas-ures per arm
Method of measures
Device
SBP Difference Right − Left (95% LoA) or absolute difference ±SD in mmHg
Sig.
DBP Difference Right − Left (95% LoA) or absolute difference in ±SD mmHg
Sig. Study quality (%)
Major limitations
Chang et al. 2003321 USA
Invest-igator 1
younger volunteers
30 28.3±4.0(23–35) 8/22 30
simul-taneous Critikon
Dinamap PRO 100
+1.93 (0.51;+3.35)
<.01 +0.02 (−1.18;+1.22)
ns
91
recruitment of volunteers not described
older volunteers
30 71.7 ±8.0 (54–82)
18/12 30 simul-taneous
+0.35 (−0.87;+1.57)
ns +1.16 (+0.28;+2.04) <.05
Lane et al. 2002322 UK NR NR
staff and patients
400 56.3 ±19.7
200/ 200
2 simul-taneous
Omron HEM-705CP
|6.32| ± 6.12; +1.81 (−15.43;+19.05)
<.0001; <.0001
|5.06| ± 6.57; −0.23 (−16.81;+16.35)
<.0001; ns
95
recruitment procedure not sufficiently described
Pesola et al. 2002323 USA NR NR hypertensives 100
55.3 ±10.3 (27–78)
33/67 NR sequen-tial standard mercury
+1.83 ns +0.69 ns 100 no major limitations
Cassidy et al. 2001324 UK
un-specified clinicians
>1 patients 237 >16 NR 1 sequen-tial standard mercury
+4.77 (−8.7;+18.3) <.05
+3.73 (−16.43;+23.89) <.05 91
insufficient participant information
Fotherby et al. 1993325
UK NR NR
young 40 31 (18–48) 8/32
8 simul-taneous
Space-Labs 90207
|3.3| <.05 |2.7| <.05
95
recruitment procedure not sufficiently described
elderly 40 74 (63–85) 14/26 |4.2| <.05 |3.6| <.05

56
Observer-related sources of inaccuracy
Supplementary Table 27. Studies examining the effect of observer hearing deficit
Reference Country Observers N Hearing loss (dB) Age in y M±SD (range) M/F
SBP effect (95% LoA) in mmHg
Sig. DBP effect (95% LoA) in mmHg
Sig. Study Quality (%)
Major limitations
Song et al. 2014328 South Korea
trained observers
5
5
NR NR
−0.11 (−0.69; +0.47)
<.05 +1.05 (−2.81; +1.05)
<.001
82 observer demographics and recruitment not sufficiently described; small sample size
10 −0.23 (−1.45; +0.99)
<.05 +1.33 (−2.81; +1.33)
<.001
15 −0.52 (−2.78; +1.74)
<.01 +2.89 (−4.19; +2.89)
<.001
20 −1.36 (−6.68; +3.96)
<.001 +3.88 (−4.18; +3.88) <.001
25 −1.55 (6.97; +3.87)
<.001 +4.32 (−4.1; +4.32)
<.001
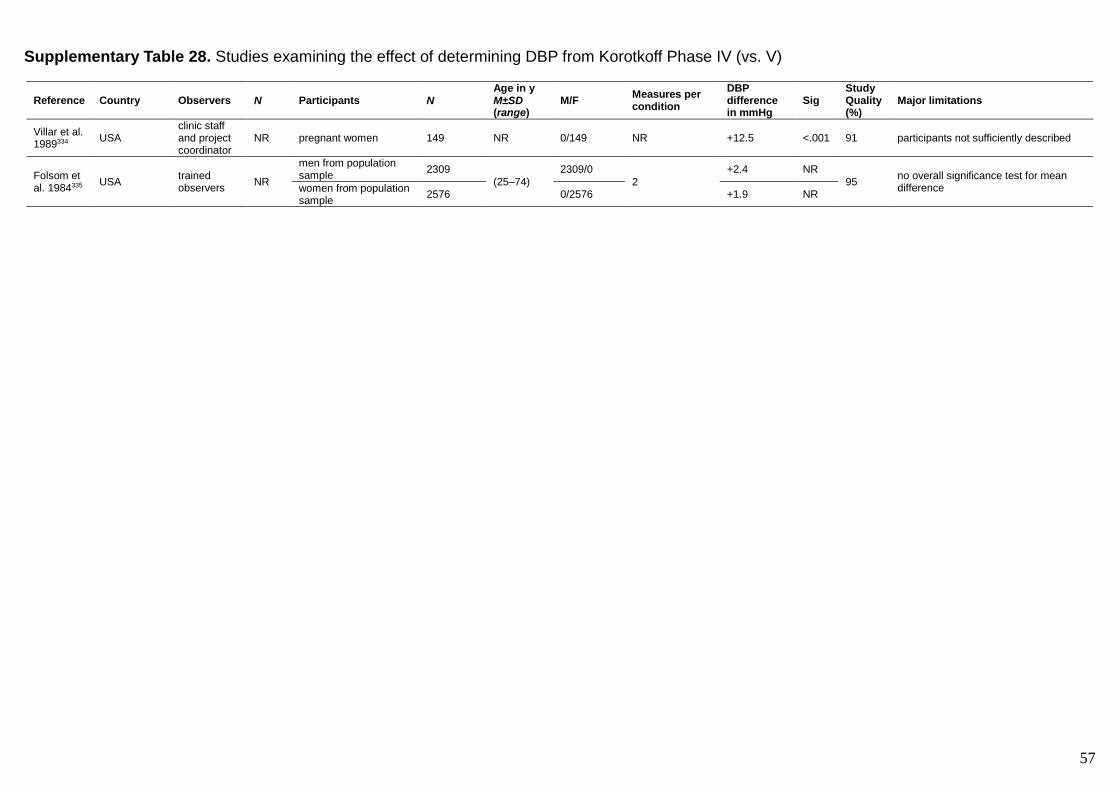
57
Supplementary Table 28. Studies examining the effect of determining DBP from Korotkoff Phase IV (vs. V)
Reference Country Observers N Participants N Age in y M±SD (range)
M/F Measures per condition
DBP difference in mmHg
Sig Study Quality (%)
Major limitations
Villar et al. 1989334 USA
clinic staff and project coordinator
NR pregnant women 149 NR 0/149 NR +12.5 <.001 91 participants not sufficiently described
Folsom et al. 1984335 USA
trained observers
NR
men from population sample
2309
(25–74) 2309/0
2
+2.4 NR
95 no overall significance test for mean difference women from population
sample 2576 0/2576 +1.9 NR

58
Supplementary Table 29. Studies examining the prevalence of terminal digit bias for zero
Reference Country Observers N No. of readings evaluated
Device(s) Prevalence of zero end-digit (SBP)
Prevalence of zero end-digit (DBP)
Study quality (%)
Major limitations
Wang et al. 2015336 China NR NR 318877 mercury 62.5% 63.5% 94
observers not sufficiently described
Odili et al. 2014337 Nigeria trained observers 2 800 mercury ~27.1% ~27.1% 91
only aggregate bias reported; small sample size of observers
Ayodele et al. 2012338 Nigeria
doctors NR 342 mercury
51.2% 64.3% 94
observers not sufficiently described nurses 98.5% 98.5%
Cienki et al. 2012339 USA
emergency medical services personnel
NR 100 various 69% 57% 83
observers not sufficiently described; recruitment not sufficiently described
Jie et al. 2012340 China hospital staff 862 4511 mercury and automated
81.8% 81.2% 100 no major limitations
Lebeau et al. 2011341 France investigators 257 1828
unspecified manual devices
68.8% 74.1% 100 no major limitations
Mengden et al. 2010342 24 Countries NR NR 23062
manual 32.37% 36.58% 94
observers not sufficiently described automated 10.15% 9.67%
Burnier et al. 2008343 Switzerland doctors 504
2580 semi-automated
~25% ~25% 94
only aggregate bias reported
4133 mercury and aneroid
~52% ~52%
Harrison et al. 2008344 UK NR NR 915866 unspecified 71.2 to 36.7% 63.5 to 36.3% 94
observers not sufficiently described
Lyratzopoulos et al. 2008345 UK health care professionals
NR 37161 (from women)
mercury
67.3% 60.2%
100 no major limitations
NR 33977 (from men)
63.1% 54.4%
Niyonsenga et al. 2008346 Canada family physicians NR 18560
mercury and aneroid
81% 79% 94 observers not sufficiently described
Broad et al. 2007347 New Zealand doctors and nurses 495 23676
mostly mercury
64.4% 61.8% 100 no major limitations

59
Reference Country Observers N No. of readings evaluated
Device(s) Prevalence of zero end-digit (SBP)
Prevalence of zero end-digit (DBP)
Study quality (%)
Major limitations
Dickson et al. 2007348 USA nurses 5 NR
unspecified manual
40% 46% 89
small sample size; number of measurements unknown
Kim et al. 2007349 USA staff NR 4330 unspecified
manual devices
50% 50% 94
observers not sufficiently described doctors NR 1347 69% 64%
Roubsanthisuk et al. 2007350 Thailand nurses NR 907
unspecified manual devices
99% 99% 94 observers not sufficiently described
Graves et al. 2006351 USA nurses 11 52827 aneroid 31.0% 33.5% 94 small sample size
Nietert et al. 2006352 USA practising physicians 384 327583 unspecified 44.6% 47.5% 94
observers not sufficiently described
Campbell et al. 20058 Canada highly trained nurse 1 645 mercury 39.2% 24.0% 89
small sample size (n=1 observer)
de Lusignan et al. 2004353 UK various health care staff NR 81145
unspecified/ various
64% 59% 89 observers not sufficiently described
McManus et al. 2003354 UK NR NR NR manual 28.5 to 62.0% 27.4 to 58.9% 89
observers not described
Ostchega et al. 2003355 USA trained doctors 4 7270 mercury 21% 23% 100 no major limitations
Thavarajah et al. 2003356 USA
nurses NR 103 mercury
40% 23% 94
observers not sufficiently described doctors NR 103 31% 36%
Ali et al. 2002357 UK NR NR NR aneroid and mercury
75% 75% 83
observers not described; number of readings not reported
Wingfield et al. 2002a358 UK NR NR 6310
unspecified manual
30.4% 28.2, 31.4% 94 observers not sufficiently described
Wingfield et al. 2002b359 23 European countries trained observers NR 61320 mercury 42.4% NR 94
observers not sufficiently described
Ataman et al. 1996360 USA NR NR 26937 mercury 23.5% 29.9% 89
observers not described
Torrance et al. 1996361 UK student nurses 50 98 mercury 73.5% 73.5% 94
observers not sufficiently described

60
Reference Country Observers N No. of readings evaluated
Device(s) Prevalence of zero end-digit (SBP)
Prevalence of zero end-digit (DBP)
Study quality (%)
Major limitations
Wen et al. 1993362 Canada clinicians NR 28841
unspecified manual
78% NR 89 observers not described
Stoneking et al. 1992363 USA nurses and nurses’ aides NR 292
mercury and aneroid
62% 62% 94 observers not sufficiently described
Villar et al. 1989334 USA clinic staff NR 149 mercury 42.5% 64.8% 94
observers not sufficiently described
Parr et al. 1988275 UK general physicians 36 280 mercury ~33.9% ~33.9% 88
participants and observers same group; only aggregate bias reported
Hessel et al. 1986364 South Africa doctors 12 7616 mercury 78.5%
74.2% (one doctor with bias for '2')
94 small sample size
Hla et al. 1986365 USA nurses NR 35 mercury 45% Not reported 83
sample size unknown; small number of measurements
Patterson et al. 1984366 UK doctors 18 1072 mercury 84% 65% 94
observers not sufficiently described