
characterization of gliclazide release from isabgol husk hydrogel ...

39
List of materials
All other excipients used were of analytical grade.
Drugs/excipients/solvents Suppliers/manufacturers
Gliclazide Lupin Research Park, Pune
Glibenclamide US Vitamins, Mumbai
Methanol (HPLC grade) Finar Chemicals Ltd., Ahmedabad
Hydrochloric acid Qualigens, Mumbai
Sodium hydroxide Merck Specialities Pvt. Ltd., Mumbai
Potassium dihydrogen phosphate Nice Chemicals Pvt. Ltd., Cochin
Di sodium hydrogen phosphate HiMedia Laboratories Pvt. Ltd., Mumbai
Glacial acetic acid Sd. Fine Pvt. Ltd., Mumbai
Sodium acetate trihydrate Suvidhinath Laboratories, Baroda
Ammonium acetate Nice Chemicals Pvt. Ltd., Cochin
Acetonitrile (HPLC grade) Merck Specialities Pvt. Ltd., Mumbai
Polyethylene glycol 400 Merck Specialities Pvt. Ltd., Mumbai
Polyethylene glycol 600 Merck Specialities Pvt. Ltd., Mumbai
Glycerol Merck Specialities Pvt. Ltd., Mumbai
Carboxymethyl cellulose sodium Loba Chemie Pvt. Ltd., Mumbai
Tween 80 Loba Chemie Pvt. Ltd., Mumbai
Tween 40 Loba Chemie Pvt. Ltd., Mumbai
Tween 20 Merck Specialities Pvt. Ltd., Mumbai
Span 80 Suvidhinath Laboratories, Baroda
Boric acid Sd. Fine Pvt. Ltd., Mumbai
Potassium chloride Merck Specialities Pvt. Ltd., Mumbai
Labrafil M2125C8 Ranbaxy Laboratories, Gurgaon
Labrasol Ranbaxy Laboratories, Gurgaon
Lauroglycol 90 Ranbaxy Laboratories, Gurgaon
Lauroglycol FCC Ranbaxy Laboratories, Gurgaon
Sunflower oil Genuine Chemicals Co., Mumbai
Olive oil Genuine Chemicals Co., Mumbai
Soyabean oil Genuine Chemicals Co., Mumbai
Palm oil Genuine Chemicals Co., Mumbai
Peanut oil Genuine Chemicals Co., Mumbai
Corn oil Genuine Chemicals Co., Mumbai
Cottonseed oil Genuine Chemicals Co., Mumbai
Sesame oil National Chemicals, Vadodara

40
List of instruments/equipments
Instruments/Equipments Supplier/Manufacturer
UV-Visible spectrophotometer UV-1601PC, Shimadzu, Japan
HPLC LC-2010CHT, Shimadzu, Japan
Rotospin Tarsons, Kolkata
Water bath shaker Remi Equipments Ltd., Bangalore
Cold centrifuge Remi Equipments Ltd., Bangalore
USP dissolution apparatus Electrolab, Mumbai
Spinwin Tarsons, Kolkata
pH meter Systronics µ pH system 361, Mumbai
Zetasizer Nano ZS Malvern Instruments, UK
Viscometer LV Brookfield, USA
Infrared spectrophotometer FTIR 8300, Shimadzu, Japan
Microscope SDMTECH, Andhra Pradesh
Halogen moisture analyser Mettler Toledo (HB 43), USA
Digital electronic balance Eaasae-Teraoka Ltd., Bangalore
Ultrasonic cleaning bath Spectrolab, Delhi
Stability chamber Thermolab, Mumbai
Transmission electron microscope Philips Technai 12, The Netherlands

41
3.1. Analytical and bioanalytical method development for gliclazide
3.1.1. Identification of gliclazide
Analysis by UV spectrophotometer
In the present study estimation of gliclazide was carried out by uv-visible spectrophotometric
method (UV-1601PC, Shimadzu Corporation, Japan). The drug solution was scanned in
between the wavelength of 400 - 200 nm.
Solubility
Solubility of gliclazide was determined in water, alcohol, acetone and dichloromethane as per
pharmacopoeial requirements.
Infrared spectroscopy
Gliclazide was confirmed by IR spectroscopy - fourier transform infrared (FTIR) spectrum
using Shimadzu 8300 spectrometer and Hyper IR software from Shimadzu, Japan. The drug
sample was dispersed in the KBr (200-400 mg) using a mortar, triturating the material into
fine powder, and compressing the powder bed into the holder using a compression gauge
with 140 mps pressure. The pellet was placed in the light path and the spectrum was
recorded. The characteristic peaks of the functional groups were interpreted and compared
with IR spectrum as given in pharmacopoeia.
Loss on drying
It was tested using Halogen Moisture Analyzer (Mettler Toledo, USA). 1 g of gliclazide was
kept on pan for 10 min at 105 oC. Percentage LOD was reported.
3.1.2. Development and validation of reverse phase HPLC method for estimation of
gliclazide
Gliclazide is a sulfonyl urea derivative having a molecular weight of 323.41 g/mol with a
pKa of 5.8. It is a second-generation sulphonylurea drug, but unlike other drugs in this
family, gliclazide contains an azabicyclo-octyl ring.

42
3.1.2.a. Method development
Initial separation conditions
Acetonitrile was selected as organic solvent to elute gliclazide from the stationary phase
because of its favorable UV transmittance, low viscosity and low backpressure. Diluted
concentration of 10 g/ml gliclazide was prepared from the primary stock solution using
methanol as a diluent.
Stationary phase : Grace Vydac C18 column (250 x 4.6 mm, 5)
Mobile phase : Acetonitrile:20 mM ammonium acetate buffer, pH 4.5(50:50)
Run time : Isocratic run for 20 min
Detection wavelength : 230 nm
Flow rate : 1 ml/min
Injection volume : 20 µl
Temperature : Ambient (around 25 °C)
Auto sampler
temperature : 4±2 °C
The standard solution of gliclazide 10 µg/ml was prepared, injected in to HPLC system and
run for 30 min.
Effect of pH
The mobile phase pH was optimized by using different pH conditions (pH 3.0 to pH 7.0) at a
flow rate of 1 ml/min and Grace Vydac C18 column used as the stationary phase.
Effect of ratio of mobile phase
Acetonitrile and ammonium acetate buffer (pH 4.5) were studied at 50:50, 60:40 and 70:30
(% v/v) for the proper selection of the mobile phase.
Effect of ionic strength
The Ammonium acetate buffer (pH 4.5) was prepared in different strength such as 20, 30 and
40 mM and chromatograms were recorded.
Effect of flow rate
The flow rate of 0.9, 1.0 and 1.1 ml/min were used and chromatograms were recorded.

43
3.1.2.b. Method validation (ICH Q2 R1 guidelines)
Linearity
Solutions with concentration of 0.5, 1, 2, 5, 10, 25, and 50 µg/ml of gliclazide was prepared
in mobile phase and a volume of 20 µl of the solution was injected and chromatograms were
recorded under the optimized chromatographic conditions. Peak area of the gliclazide was
plotted against the concentration to get the regression equation and coefficient determination.
Accuracy
The known amount of standard drug was spiked (100, 120, 150%) in triplicate to the
preanalyzed samples and the recovery of the drug was calculated at three concentrations such
as 10, 12, 15 µg/ml.
Robustness
Evaluation of robustness leads to generation of a series of system suitability parameters
which ensure that the analytical procedure is maintained whenever used.
Precision
Repeatability
A solution containing 10 µg/ml of gliclazide was analyzed at different time intervals and the
percentage relative standard deviation was calculated.
Intermediate precision
It is generally expressed as the percent relative standard deviation for a statistically
significant number of samples. It was carried out in between days and by different analysts.
Limit of detection (LOD) and Limit of quantitation (LOQ)
LOQ and LOD were calculated based on the standard deviation of slope and blank response
from the calibration curve as per ICH guidelines.
LOD= 3.3 SD/S LOQ= 10 SD/S
SD: Standard deviation of blank response; S: Slope of the calibration curve
3.1.3. Development and validation of bioanalytical method for estimation of gliclazide

44
3.1.3.a. Method development
Chromatographic conditions
Stationary phase : Grace Vydac C18 column (250 × 4.6 mm, 5)
Mobile phase : Acetonitrile: 20 mM ammonium acetate buffer, pH 4.5 (55:45)
Run time : Isocratic run for 20 min
Detection wavelength : 230 nm
Flow rate : 1 ml/min
Injection volume : 20 µl
Temperature : Ambient (around 25 °C)
Auto Sampler
temperature : 4±2 °C
Collection of rat plasma
Blood samples from retro-orbital vein of male wistar rats (untreated with any drug) were
collected using heparin capillary and was transferred to vacutainers containing EDTA.
Vacutainers were centrifuged at 10000 rpm at 4 °C for 5 min. The supernatant was pipetted
and stored at - 70 °C.
Selection of internal standard
Different standard drugs like glibenclamide, glimepiride, glipizide were chromatographed in
the same chromatographic condition. Glimepiride was well resolved from gliclazide with
sharp symmetrical peak shape. Hence, in the present study, glimepiride was selected as an
internal standard.
Optimization of extraction procedure of gliclazide from the rat plasma
The protein precipitation method was tried using 10% perchloric acid, 20% trichloroacetic
acid, acetonitrile, methanol and its combination for the extraction of gliclazide from the rat
plasma.
Extraction of gliclazide from rat plasma

45
95 µl of blank rat plasma was taken in the 1.5 ml microcentrifuge tube and 5 µl of gliclazide
with varying concentrations and 10 µl of IS (glimepiride) working stock solution (50 µg/ml)
was added. Then the mixture was vortexed for 1 min. 250 µl of methanol was added, and
vortexed for 10 minutes and then centrifuged at 10000 rpm for 10 min. 50 µl of clear
supernatant liquid was separated and injected into HPLC for analysis.
3.1.3.b. Bioanalytical method validation (As per USFDA guidelines)
Preparation of calibration curve and quality control samples
A volume of 5 µl of working stock solutions were added to 95 µl of blank rat plasma and 10
µl IS solution (50 µg/ml) to get gliclazide concentrations 0.2, 0.3, 0.5, 1, 2, 5, 10, 25 and 50
µg/ml. Similarly 5 µl of controls were spiked with 95 µl of blank (drug free) rat plasma to get
a gliclazide concentrations 0.2 µg/ml (LLOQ), 0.6 µg/ml (low), 20 µg/ml (medium), 40
µg/ml (high). These plasma samples were processed.
Each validation run consisted of a double control, system suitability sample, blank samples (a
plasma sample processed with IS), calibration curve consisting of nine non-zero samples
covering the total range (0.2–50 µg/ml) and QC samples at three concentrations (n = 6, at
each concentration). Such validation runs were generated on four consecutive days.
Calibration samples were analyzed from low to high at the beginning of each validation run
and other samples were distributed randomly through the run.
Selectivity
Selectivity was established by injecting six samples at the LLOQ level and each of the six
blank plasma samples were tested for interference by comparing the mean peak response
obtained by injecting blank plasma samples to that of mean peak response of LLOQ (0.2
µg/ml).
Recovery
Recovery of gliclazide was evaluated by comparing the mean peak areas of three extracted
low, medium and high quality control samples to mean peak areas of three neat reference
solutions (unextracted ). Recovery of Glimepiride (IS) was evaluated by comparing the mean
peak areas of extracted samples to mean peak areas of neat reference solutions (unextracted)
of the same concentration

46
Accuracy and precision
The intra-day precision and accuracy were tested by six replicates of each LLOQ, low,
medium and high QC samples were prepared and injected. Accuracy was calculated based on
the mean observed concentration as compared to the nominal concentration.The inter-day
precision and accuracy were estimated from the assays of QC samples on four consecutive
days.
Stability
In order to determine the stability of gliclazide in rat plasma, the samples were stored at four
different stability conditions such as room temperature, freeze thaw stability, auto injector
stability and long term stability which were examined by replicate analysis of the low and
high plasma QC samples. Room temperature stability was carried out by keeping replicates of
the low and high plasma quality control samples for approximately 24 h. Freeze–thaw
stability of the samples was obtained over three freeze-thaw cycles, by thawing at room
temperature for 2–3 h and refrozen for 12–24 h for each cycle. Auto sampler stability of
gliclazide was tested by analysis of processed and reconstituted low and high plasma QC
samples, which were stored in the auto sampler tray for 24 h. Long term stability of gliclazide
in rat plasma was tested after storage at approximately − 70 °C for 30 days. For each
concentration and storage conditions, six replicates were analyzed in one set of batch. The
results were compared to the data of freshly prepared and processed set of QC samples.
3.1.4. Results and discussion
3.1.4.1. Identification of gliclazide
UV Spectrum
A solution of 10 µg/ml gliclazide was scanned in the UV range of wavelength 400 - 200 nm.
The max was found to be 230 nm.
Solubility

47
Practically insoluble in water(0.13 mg/ml), soluble in methanol(40 mg/ml) and ethanol(35
mg/ml), sparingly soluble in acetone(5 mg/ml), freely soluble in dichloromethane (20
mg/ml). The solubility data complies with the pharmacopoeial specifications.
IR Spectroscopy
The presence of characteristic peaks associated with specific structural characteristics of the
drug molecule was noted. The wave numbers for gliclazide with maximum peak intensities
was found to be at 1701, 1346, 1161, 2866, 2943, 3111, 1697, 1595, 3271 cm-1
respectively.
The characteristic peaks revealed that the drug substance could be gliclazide. The IR
spectrum of gliclazide was shown in Fig. 3.1.
Fig. 3.1. IR spectrum of gliclazide.
Loss on drying
As per BP, LOD of gliclazide limit is NMT 0.25% when determined on 1.0 g by drying in an
oven at 100 – 105 oC for 5 hr. LOD of the given sample of gliclazide was found to be 0.24%
which complies with the BP specification
3.1.4.2. Analytical method development and validation by reverse HPLC method

48
Effect of pH
With the increase in pH of mobile phase there has been a decrease in the retention time of
gliclazide and vice versa. So, Ammonium acetate buffer, pH of 4.5 was selected as the
retention time was within 15 min.
Effect of ratio of mobile phase
The retention time of gliclazide was found to be 7.0, 6.4 and 3.1 mins respectively with
different mobile phase ratio.
Effect of ionic strength
20 mM strength of Ammonium acetate buffer (pH 4.5) was selected as no change in the
retention time was observed with the change in the ionic strength of the buffer.
Effect of flow rate
1 ml/min was selected was selected as good peaks were obtained with the all the different
flow rates.
Based on the above optimization parameters, the following chromatographic condition was
selected for the estimation of gliclazide by HPLC method consists of
Stationary phase : Grace Vydac C18 column (250 × 4.6 mm, 5)
Mobile phase : Acetonitrile: 20 mM ammonium acetate buffer, pH 4.5 (60:40)
Run time : Isocratic run for 20 min
Detection wavelength : 230 nm
Flow rate : 1 ml/min
Injection volume : 20 µl
Temperature : Ambient (around 25 °C)
Autosampler
Temperature : 4±2 °C
With the above separation condition, the retention time for gliclazide was found to be 6.4
mins. The typical standard chromatogram of gliclazide was showed in the Fig. 3.2.

49
Fig. 3.2: Standard chromatogram of gliclazide.
Linearity
The coefficient determination (r2) for the present method was 0.9995 which indicated that the
present method is linear and it is linear in the range from 10 – 70 µg/ml. Acceptance criteria
for Linearity, (r2) is >0.999. Calibration curve is shown in the Fig. 3.3.
Accuracy
The recoveries at three different concentrations (10, 12, 15 µg/ml) were found to be with in
the range of 98 to 102% as per ICH guidelines. Mean % recovery (Mean±SD) was found to
be 99.62±1.43.
Robustness
The overall percentage relative standard deviation in the various parameters was found to be
0.92% and the acceptance limit was <2%. The result indicated that the method was robust.
Precision
The repeatability and intermediate precision of the proposed method was found to be 0.37%
and 0.58% respectively which were within the acceptance criteria for the repeatability and
inter mediate precision (<1% and <2% RSD).
LOD and LOQ

50
The present method LOD and LOQ was found to be 0.1 and 0.5 µg /ml respectively. This
indicates that the developed method is sensitive for the quantification of gliclazide. Summary
of the analytical method validation parameters are reported in the Table 3.1.
Table 3.1. Data of analytical method validation of gliclazide by HPLC.
Validation Parameters Validation
results
Acceptance
criteria
Linearity (r2) (10-70 µg/ml) 0.9995 > 0.999
Accuracy (% Mean±SD) 99.62±1.43 98–102
Robustness (% RSD) 0.92 <2
Repeatability precision (% RSD) 0.37 <1
Intermediate precision (% RSD) 0.58 <2
LOD (µg/ml) 0.1 S/N ratio should
be 3:1
LOQ (µg/ml) 0.5 S/N ratio should
be 10:1
Fig 3.3. Calibration plot of gliclazide by HPLC method.
0
500000
1000000
1500000
2000000
2500000
3000000
3500000
4000000
4500000
0 10 20 30 40 50 60 70 80
Pea
k ar
ea
Concentration (ppm)

51
3.1.4.3. Bioanalytical method development and validation by reverse HPLC method
Protein precipitation method was selected for the extraction of gliclazide from the rat plasma.
The developed method was able to extract 85% and also there were no interferences at the
retention time of gliclazide and glimepiride.
The optimized chromatographic condition consists of the following
Stationary phase : Grace Vydac C18 column (250 × 4.6 mm, 5)
Mobile phase : Acetonitrile: 20 mM ammonium acetate buffer, pH 4.5 (55:45)
Run time : Isocratic run for 20 min
Detection wavelength : 230 nm
Flow rate : 1 ml/min
Injection volume : 20 µl
Temperature : Ambient (around 25 °C)
Sample temperature : 4±2 °C
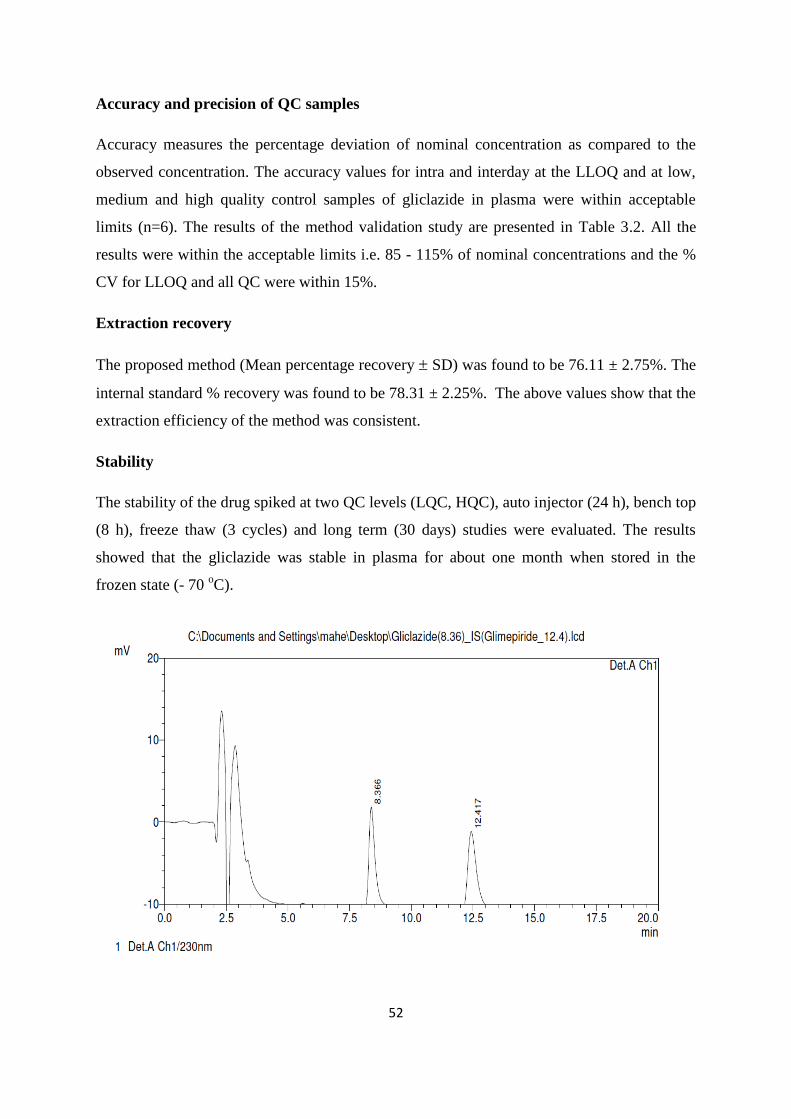
Selectivity
Gliclazide and glimepiride (IS) were well separated from the plasma proteins under the
optimized chromatographic conditions at retention time of 8.36 min and 12.41 min and the
same were shown in the Fig. 3.4. The peaks were of good shape with good separation among
each other and there were no interferences from the plasma matrix.
Linearity
Linear detector response for the peak-area ratios of the gliclazide to internal standard was
observed in concentration range between 0.2–50 µg/ml with a coefficient determination of
0.9992 and shown in Fig. 3.5.
Lower Limit of Quantitation (Sensitivity)
LLOQ 0.2 µg/ml was selected based on the lowest level concentration that would be expected
for analysis in the current study. Accuracy and precision was carried out and it was found to
be within the acceptable limits.
52
Accuracy and precision of QC samples
Accuracy measures the percentage deviation of nominal concentration as compared to the
observed concentration. The accuracy values for intra and interday at the LLOQ and at low,
medium and high quality control samples of gliclazide in plasma were within acceptable
limits (n=6). The results of the method validation study are presented in Table 3.2. All the
results were within the acceptable limits i.e. 85 - 115% of nominal concentrations and the %
CV for LLOQ and all QC were within 15%.
Extraction recovery
The proposed method (Mean percentage recovery SD) was found to be 76.11 ± 2.75%. The
internal standard % recovery was found to be 78.31 ± 2.25%. The above values show that the
extraction efficiency of the method was consistent.
Stability
The stability of the drug spiked at two QC levels (LQC, HQC), auto injector (24 h), bench top
(8 h), freeze thaw (3 cycles) and long term (30 days) studies were evaluated. The results
showed that the gliclazide was stable in plasma for about one month when stored in the
frozen state (- 70 oC).

53
Fig. 3.4. Standard chromatogram of gliclazide in rat plasma with internal standard
(glimepiride).
Fig. 3.5. Calibration plot of gliclazide.
Table 3.2. Summary of bioanalytical method validation of gliclazide by HPLC.
Parameters Validation
Values Acceptance limit
Linearity 0.2-20 µg/ml,
r2>0.999
>0.98 with consistency
Intra batch accuracy (%) 92.41-100.17 85-115.0% except the LLOQ (80-120%)
Inter batch accuracy (%) 93.22-103.34 85-115.0% except the LLOQ (80-120%)
Intra Batch precision
(% CV) 2.07-8.93
±15% dev from nominal conc. except at
LLOQ ± 20% dev.
Inter Batch Precision
(% CV) 6.23-10.25
±15% dev from nominal conc. except at
LLOQ ± 20% dev.
Recovery analyte
(meanSD)
Recovery(Internal standard)
76.11±2.75
78.31±2.25 Consistent recovery
% stability by freeze thaw
(- 70 ºC) 80.21-103.11
85 -115.0% except the LLOQ (80 -
120%)
% stability by auto injector
stability (18 h) (4 °C) 93.19-105.28
85 -115.0% except the LLOQ (80-
120%)
% stability by bench top
stability (8 h) 94.36-105.49
85 -115.0% except the LLOQ (80 -
120%)
% stability by long term 93.23-101.13 85 -115.0% except the LLOQ (80-
0.0000
1.0000
2.0000
3.0000
4.0000
5.0000
6.0000
7.0000
8.0000
9.0000
10.0000
0 10 20 30 40 50 60
Peak a
rea r
ati
o
Conc (µg/ml)

54
Stability (30 days) 120%)
The results of validation showed that the method was accurate, precise and selective and
linear over the wide range of concentration. The method was very simple and was
successfully applied to the determination of gliclazide in rat plasma.
3.2. Analytical and bioanalytical method development for glibenclamide
3.2.1. Identification of glibenclamide
Analysis by UV spectrophotometer
The drug solution of 10 µg/ml was scanned in the uv range and max was determined.
Solubility
The solubility of glibenclamide was estimated in water, methylene chloride, alcohol and
methanol as per pharmacopoeial requirements.
Infrared spectroscopy
Glibenclamide sample was confirmed by IR spectroscopy using Shimadzu 8300 spectrometer
and Hyper IR software from Shimadzu, Japan. The characteristic peaks were compared with
IR spectrum as given in pharmacopoeia.
3.2.2. Development and validation of reverse phase HPLC method for estimation of
glibenclamide
Glibenclamide is a sulfonyl urea derivative having a molecular weight of 494 g/mol with a
pKa of 5.3. It is practically insoluble in water, sparingly soluble in methylene chloride,
soluble in alcohol and in methanol.
3.2.2.a. Method development
Initial separation conditions
Acetonitrile was selected as organic phase to elute glibenclamide. 10 g/ml glibenclamide
was prepared from the primary stock solution using methanol as a diluent and injected in to
HPLC system with the following chromatographic conditions.

55
Stationary phase : Grace Vydac C18 column (250 × 4.6 mm, 5)
Mobile phase : Acetonitrile: 20 mM ammonium acetate buffer, pH 4.5 (50:50)
Solvent ratio : Isocratic run for 30 min
Detection wavelength : 300 nm
Flow rate : 1 ml/min; Injection volume : 20 µl
Temperature : Ambient (around 25 °C); Auto sampler temperature: 4±2 °C
Effect of pH, composition, ionic strength, flow rate of mobile phase
The mobile phases with different pH conditions (pH 3.0 to pH 7.0) were used and retention
time was noted. Various composition of mobile phase were studied at 50:50, 60:40 and 70:30
(% v/v) to optimize the composition of mobile phase. Different strength of ammonium
acetate buffer (pH 4.5) such as 10, 20, 30 and 40 mM with varied flow rate such as 0.9, 1.0
and 1.1 ml/min were used and chromatograms were recorded.
3.2.2.b. Method validation (ICH Q2 R1 guidelines)
Linearity
The linearity of an analytical procedure is its ability to obtain test results which are directly
proportional to the concentration of analyte. 0.5, 1, 2, 5, 10, 25, and 50 µg/ml of
glibenclamide was prepared in mobile phase and 20 µl of the solution was injected and
chromatograms were recorded and regression equation was calculated.
Accuracy
The accuracy of an analytical procedure expresses the closeness of agreement between the
value, which is accepted as true value or reference value. Known amount of standard drug
was spiked (100, 120, 150%) in triplicate to the preanalyzed samples and the recovery of the
drug was calculated at 10, 12, 15 µg/ml.
Robustness
Robustness is the capacity of a method to remain unaffected by small deliberate variations in
method parameters. One consequence of evaluation of robustness should be that a series of
system suitability parameters is established to ensure that the analytical procedure is
maintained whenever used.

56
Precision
Repeatability
Repeatability expresses the precision under the same operating conditions over a short
interval of time. It is also termed as intra-assay precision. 10 µg/ml of glibenclamide was
analyzed at different time intervals. Percentage relative standard deviation was then
calculated.
Intermediate precision
Precision is the measure of the degree of repeatability of an analytical method under normal
operation and is generally expressed as the percent relative standard deviation for a
statistically significant number of samples. It was carried out in between days and by
different analysts.
Limit of detection (LOD) and Limit of quantitation (LOQ)
LOD is ability of analytical method able to detect the lowest concentration of the analyte.
LOQ is lowest concentration of the analyte which can be quantitatively analyzed with
acceptable precision and accuracy. It was calculated based on the slope and blank response
from the calibration curve as per ICH guidelines. LOD and LOQ were calculated based on
the standard deviation of the response and slope.
LOD= 3.3 SD/S LOQ= 10 SD/S
SD: Standard deviation of blank response; S: Slope of the calibration curve
3.2.3. Development and validation of bioanalytical method for estimation of
glibenclamide
3.2.3.a. Method development
Chromatographic conditions
Stationary phase : Grace Vydac C18 column (250 × 4.6 mm, 5)

57
Mobile phase : Acetonitrile: 20 mM ammonium acetate buffer, pH 4.5 (55:45)
Solvent ratio : Isocratic run for 30 min
Detection wavelength : 300 nm
Flow rate : 1 ml/min
Injection volume : 20 µl
Temperature : Ambient (around 25 °C)
Autosampler
Temperature : 4±2 °C
Collection of rat plasma
The blood samples from retro-orbital vein of male wistar rats (untreated with any drug) was
collected using heparin capillary and was transferred to vacutainers containing EDTA.
Vacutainers were centrifuged at 10000 rpm at 4 °C for 5 min. The supernatant was pipetted
and stored at -70 °C for further experimental use. Similarly diabetes induced rats blank blood
was collected and plasma was separated and stored in the refrigerator.
Selection of internal standard
Selection of internal standard is mainly based on the chemical structure, solubility, polarity
characteristics of the drug. Different standard drugs like gliclazide, glimepiride, glipizide
were chromatographed in the same chromatographic condition. Glipizide was well resolved
from glibenclamide with sharp symmetrical peak shape. Hence, in the present study, glipizide
was selected as an internal standard.
Optimization of extraction procedure of glibenclamide from the rat plasma
The protein precipitation method was tried using 10% perchloric acid, 20% trichloroacetic
acid, acetonitrile, methanol and its combination for the extraction of glibenclamide from the
rat plasma.
Extraction of glibenclamide from rat plasma
95 µl of blank rat plasma was taken in the 1.5 ml microcentrifuge tube and 5 µl of
glibenclamide with varying concentrations and 10 µl of IS (glipizide) working stock solution
(50 µg/ml) was added. Then the mixture was vortexed for 1 min. 250 µl of methanol was

58
added, and vortexed for 10 minutes and then centrifuged at 10000 rpm for 10 min. 50 µl of
clear supernatant liquid was separated and injected into HPLC for analysis.
3.2.3.b. Bioanalytical method validation (As per USFDA guidelines)
Preparation of calibration curve and quality control samples
A volume of 5 µl of working stock solutions were added to 95 µL of blank rat plasma and 10
µl IS solution (50 µg/ml) to get glibenclamide concentrations 0.2, 0.3, 0.5, 1, 2, 5, 10, 25 and
50 µg/ml. Similarly 5 µl of controls were spiked with 95 µl of blank (drug free) rat plasma to
get a glibenclamide concentrations 0.2 µg/ml (LLOQ), 0.6 µg/ml (low), 20 µg/ml (medium),
40 µg/ml (high).These plasma samples were processed.
Each validation run consisted of a double control, system suitability sample, blank samples (a
plasma sample processed with IS), calibration curve consisting of nine non-zero samples
covering the total range (0.2–50 µg/ml) and QC samples at three concentrations (n = 6, at
each concentration). Such validation runs were generated on four consecutive days.
Calibration samples were analyzed from low to high at the beginning of each validation run
and other samples were distributed randomly through the run.
Selectivity, recovery, accuracy, precision and stability
The method used was similar to as explained previously in the bioanalytical method
validation of gliclazide in 3.1.3.2.
3.2.4. Results and discussion
3.2.4.1. Identification of glibenclamide
UV Spectrum
max was found to be 300 nm which complies with IP specification.
Solubility

59
The drug was found to be practically insoluble in water (0.05 mg/ml), sparingly soluble in
methylene chloride (5 mg/ml), slightly soluble in alcohol (10 mg/ml) and in methanol (12
mg/ml). The solubility data complies with the pharmacopoeial specifications.
IR Spectroscopy
In order to confirm the functional group of the drug IR spectrum was taken.The wave
numbers was found to be at 1714, 1342, 1155, 2852, 2929, 3115, 1525, 1618, 3365 cm-1
respectively. The characteristic peaks revealed that the drug substance could be
glibenclamide. The IR spectrum of glibenclamide was shown in Fig. 3.6.
Fig. 3.6. IR spectrum of glibenclamide.
3.2.4.2. Analytical method development and validation by reverse HPLC method
Effect of pH, composition, ionic strength, flow rate of mobile phase
The retention time of glibenclamide was decreased with increase in pH of the mobile phase.
This might be due to the unionization of the drug. Hence, Ammonium acetate buffer, pH of
4.5 was selected since elution was within 15 min with adequate system suitability. With
different mobile phase ratio the retention time was found to be 8.4, 7.5 and 4.2 min

60
respectively. On increasing the % of acetonitrile there was a decrease in the retention time
which might be due to the higher elution strength of acetonitrile.The retention time of
glibenclamide did not change much with the change in buffer strength. So, 20 mM strength of
Ammonium acetate buffer (pH 4.5) was selected. Symmetrical peaks were obtained with the
different flow rates. For the present study, 1 ml/min was selected. Based on the above
optimization parameters, the following chromatographic condition was selected for the
estimation of glibeclamide by HPLC method.
Stationary phase : Grace Vydac C18 column (250 × 4.6 mm, 5)
Mobile phase : Acetonitrile: 20 mM ammonium acetate buffer, pH 4.5 (60:40)
Solvent ratio : Isocratic run for 30 min
Detection wavelength : 300 nm
Flow rate : 1 ml/min
Injection volume : 20 µl
Temperature : Ambient (around 25 °C)
Autosampler
Temperature : 4±2 °C
With the above separation condition, the retention time for glibenclamide was found to be 7.5
mins. The typical standard chromatogram of glibenclamide was showed in the Fig. 3.7.
Fig. 3.7. Standard chromatogram of glibenclamide.
Linearity
Linearity is generally reported by the coefficient determination (r2) and the acceptance
criteria is (r2) should be >0.999. The coefficient determination (r
2) was 0.9997 which

61
indicated that the present method is linear (range 10–70 µg/ml). Standard plot is shown in
Fig. 3.8.
Accuracy
Recoveries at three different concentrations (10, 12, 15 µg/ml) were found to be with in the
range of 98 to 102% as per ICH guidelines. Mean % recovery (Mean±SD) was found to be
99.22±1.07.
Robustness
Overall percentage relative standard deviation was found to be 0.90% and the acceptance
limit was <2% which indicated that the method was robust.
Precision
The repeatability and intermediate precision of the proposed method was found to be 0.56%
and 0.72% respectively which were within the acceptance criteria indicating that the method
was precise and reproducible one.
LOD and LOQ
LOD and LOQ were found to be 0.1 and 0.5 µg/ml which suggests that the developed method
is sensitive for the quantification of glibenclamide. Summary of the analytical method
validation parameters are reported in the Table 3.3.
Table 3.3. Data of analytical method validation of glibenclamide by HPLC.
Validation Parameters Validation
results
Acceptance
criteria
Linearity (r2) (10-70 µg/ml) 0.9997 > 0.999
Accuracy (% Mean±SD) 99.22±1.07 98–102
Robustness (% RSD) 0.90 <2
Repeatability precision (% RSD) 0.56 <1
Intermediate precision (% RSD) 0.72 <2
LOD (µg/ml) 0.1 S/N ratio
should be 3:1
LOQ (µg/ml) 0.5 S/N ratio
should be 10:1

62
Fig. 3.8. Standard plot of glibenclamide.
3.2.4.3. Bioanalytical method development and validation by reverse HPLC method
Protein precipitation method was selected for the extraction of glibenclamide from the rat
plasma. The optimized chromatographic condition consists of the following
Stationary phase : Grace Vydac C18 column (250 × 4.6 mm, 5)
Mobile phase : Acetonitrile: 20 mM ammonium acetate buffer, pH 4.5 (55:45)
Run time : Isocratic run for 30 min
Detection wavelength : 300 nm
Flow rate : 1 ml/min
Injection volume : 20 µl
Temperature : Ambient (around 25 °C)
Autosampler
Temperature : 4±2 °C
Bioanalytical method validation of glibenclamide by HPLC
Selectivity
Retention time for glibenclamide and glipizide (IS) were 10.04 and 4.3 min (Fig 3.9). The
peaks were of good shape with good separation among each other without any interference.
Linearity
The coefficient determination was found to be 0.9993 in the concentration range of 0.2–20
µg/ml as shown in Fig 3.10.
0
100000
200000
300000
400000
500000
600000
700000
0 20 40 60 80
Pe
ak a
rea
Concentration (ppm)

63
Lower Limit of Quantitation (Sensitivity)
Based on lowest level concentration LLOQ 0.2 µg/ml was selected.
Accuracy and precision of QC samples
The accuracy values for intra and interday at the LLOQ and at low, medium and high quality
control samples of glibenclamide in plasma were within acceptable limits (n=6). The results
of the method validation study are presented in Table 3.4. All the results were within the
acceptable limits.
Extraction recovery
Mean percentage recovery was found to be 75.183.25%. The internal standard % recovery
was found to be 77.123.21%. The above values indicate that the extraction efficiency of the
method was consistent.
Stability
Stability of the drug spiked at two QC levels (LQC, HQC), auto injector (24 h), bench top (8
h), freeze thaw (3 cycles) and long term (30 days) studies were evaluated. The results showed
that the glibenclamide was stable in plasma for about one month when stored in the frozen
state (- 70 oC).
Fig.3.9. Typical standard chromatogram of glibenclamide in rat plasma with internal standard
(glipizide).

64
Fig. 3.10. Calibration plot of glibenclamide.
Table 3.4. Summary of bioanalytical method validation of glibenclamide by HPLC.
Parameters Validation
Values Acceptance limit
Linearity 0.2-20 µg/ml,
r2>0.99
>0.98 with consistency
Intra batch accuracy (%) 94.12-101.37 85-115.0% except the LLOQ (80-
120%)
Inter batch accuracy (%) 91.51-102.14 85-115.0% except the LLOQ (80-
120%)
Intra Batch precision (% CV) 2.45-9.33 ± 15% dev from nominal conc.
except at LLOQ±20% dev.
Inter Batch Precision (% CV) 5.14–10.55 ± 15% dev from nominal conc.
except at LLOQ±20% dev.
Recovery analyte (meanSD)
Recovery(Internal standard)
75.18±3.25
77.12±3.21 Consistent recovery
% stability by freeze thaw 90.16-105.15 85-115.0% except the LLOQ (80-
120 %)
% stability by auto injector stability
(18 h) (4 °C) 98.03-101.47
85-115.0% except the LLOQ (80-
120%)
% stability by bench top (8 h) 95.11-105.32 85-115.0% except the LLOQ (80-
120%)
% stability by long term (30 days) 89.1-100.22 85-115.0% except the LLOQ (80-
120%)
The results suggest that method was very simple and was successfully applied for the
determination of glibenclamide in rat plasma. Validation results showed that the method was
accurate, precise and selective and linear over the wide range of concentration.
-2.0000
0.0000
2.0000
4.0000
6.0000
8.0000
0 5 10 15 20 25
Pe
ak A
rea
Rat
io
Conc (µg/mL)
Calibration plot of Glibenclamide


![[Product Monograph Template - Standard]jamp.pharmaready.com/.../0005/m1/ca/0005-ca-m131-annotated-pm-… · Web viewPRODUCT MONOGRAPH. PrACT GLICLAZIDE MR. Gliclazide. Modified-release](https://static.fdocuments.in/doc/165x107/5cdb13cd88c99386458c1eb0/product-monograph-template-standardjamp-web-viewproduct-monograph-pract.jpg)

