Effects of Gliclazide Dose Escalation on Postprandial ...
22
VOLUME 67, NUMBER 2, MARCH/APRIL 2006 Effects of Gliclazide Dose Escalation on Postprandial Hyperglycemia in Type 2 Diabetes Mellitus: A Prospective, Open-Label, Case-Controlled, Dose-Escalation Study Poobalan Naidoo, BPharml; Rambiritch Virendra, PhD1; and Mayet Layla, MBChB, MMedSc 2 7 School of Pharmacy and Pharmacology, University of KwaZulu-Natal, KwaZulu- Natal, South Africa; and 2Diabetes Unit, Department of Medicine, Addington Hospital, KwaZulu-Natal, South Africa ABSTRACT Objectives: The aims of this study were to determine the effects of increas- ing doses of gliclazide on postprandial glucose excursions after a standardized breakfast and lunch, and to clarify the relationship between gliclazide dose and glucose response. Methods: This prospective, open-label, case-controlled, dose-escalation study was conducted at the Addington Hospital Diabetes Clinic, eThekwini/ Durban, KwaZulu-Natal, South Africa. Male and female patients aged ___18 years with type 2 diabetes mellitus (DM) and postprandial hyperglycemia (2-hour postprandial blood glucose [PPBG2 h] level, ___11.1 mmol/L [___200 mg/dL]) and receiving an oral hypoglycemic agent were eligible. After a 1-week washout period during which patients were asked to discontinue treatment with all oral hypoglycemic agents, baseline glycemic measurements were performed (fast- ing blood glucose, PPBG 2 h, 6-hour postprandial blood glucose [PPBG6 h], mean blood glucose [MBG], plasma insulin, fasting serum fructosamine, and glycosyl- ated hemoglobin). All patients subsequently received 2 weeks of oral treatment with each of 3 doses of gliclazide: 40, 80, and 160 mg/d. Glycemic parameters were measured at the end of each dosing interval. Adverse-effect monitoring included direct reporting of untoward effects to the resident medical practi- tioner, clinical examination, monitoring of home blood glucose records, hema- tology, and liver and kidney function tests. Compliance was assessed using pill counts, examination of diary entries, and patient interview. Results: Thirty-three patients were screened; 14 entered the dose-escalation phase. Thirteen patients completed the study (7 women, 6 men; mean [SD] age, 52.0 [11.1] years); 1 was withdrawn because of poor compliance. Dose escala- tion from 40 to 80 mg/d was associated with a significant change only in MBG (mean [SD], 11.3 [4.2] vs 10.0 [3.9] mmol/L [203.6 (75.7) vs 180.1 (70.3) mg/dL]; Accepted for publicationFebruary 9, 2006. Reproduction in whole or part is not permitted. doi:l 0.1016/j.curtheres.2006.04.001 0011-393X/06/$19.00 Copyright © 2006 Excerpta Medica, Inc. 81
Transcript of Effects of Gliclazide Dose Escalation on Postprandial ...
VOLUME 67, NUMBER 2, MARCH/APRIL 2006
Effects of Gliclazide Dose Escalation on Postprandial Hyperglycemia in Type 2 Diabetes Mellitus: A Prospective, Open-Label, Case-Controlled, Dose-Escalation Study Poobalan Naidoo, BPharml; Rambiritch Virendra, PhD1; and Mayet Layla, MBChB, MMedSc 2
7 School of Pharmacy and Pharmacology, University of KwaZulu-Natal, KwaZulu- Natal, South Africa; and 2Diabetes Unit, Department of Medicine, Addington Hospital, KwaZulu-Natal, South Africa
ABSTRACT Objectives: The aims of this s tudy were to determine the effects of increas-
ing doses of gliclazide on postprandial glucose excursions after a standardized breakfast and lunch, and to clarify the relationship between gliclazide dose and glucose response.
Methods: This prospective, open-label, case-controlled, dose-escalation s tudy was conducted at the Addington Hospital Diabetes Clinic, eThekwini/ Durban, KwaZulu-Natal, South Africa. Male and female patients aged ___18 years with type 2 diabetes mellitus (DM) and postprandial hyperglycemia (2-hour postprandial blood glucose [PPBG 2 h] level, ___11.1 mmol/L [___200 mg/dL]) and receiving an oral hypoglycemic agent were eligible. After a 1-week washout period during which patients were asked to discontinue treatment with all oral hypoglycemic agents, baseline glycemic measurements were performed (fast- ing blood glucose, PPBG 2 h, 6-hour postprandial blood glucose [PPBG 6 h], mean blood glucose [MBG], plasma insulin, fasting serum fructosamine, and glycosyl- ated hemoglobin). All patients subsequent ly received 2 weeks of oral treatment with each of 3 doses of gliclazide: 40, 80, and 160 mg/d. Glycemic parameters were measured at the end of each dosing interval. Adverse-effect monitoring included direct reporting of untoward effects to the resident medical practi- tioner, clinical examination, monitoring of home blood glucose records, hema- tology, and liver and kidney function tests. Compliance was assessed using pill counts, examination of diary entries, and patient interview.
Results: Thirty-three patients were screened; 14 entered the dose-escalation phase. Thirteen patients completed the s tudy (7 women, 6 men; mean [SD] age, 52.0 [11.1] years); 1 was withdrawn because of poor compliance. Dose escala- tion from 40 to 80 mg/d was associated with a significant change only in MBG (mean [SD], 11.3 [4.2] vs 10.0 [3.9] mmol/L [203.6 (75.7) vs 180.1 (70.3) mg/dL];
Accepted for publication February 9, 2006. Reproduction in whole or part is not permitted.
doi:l 0.1016/j.curtheres.2006.04.001 0011-393X/06/$19.00
Copyright © 2006 Excerpta Medica, Inc. 81
CURRENT THERAPEUTIC RESEARCH
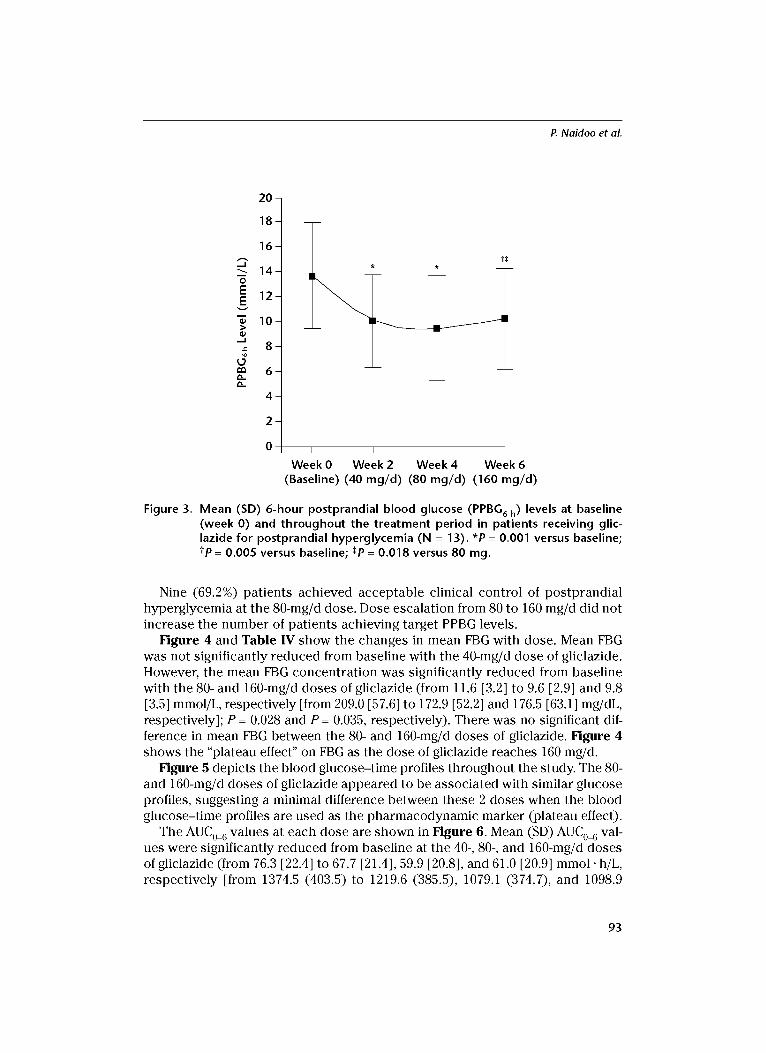
P < 0.001). Dose escalation from 80 to 160 mg/d was associated with a signifi- cant change only in PPBG 6 h (9.5 [4.2] vs 10.3 [4.1] mmol/L [171.1 (75.7)vs 185.6 (73.9) mg/dL]; P = 0.018). No other significant changes in glycemic parameters between doses were found throughout the treatment period. No adverse effects were reported.
Conclusions: In this small s tudy of gliclazide dose escalation in patients with type 2 DM and postprandial hyperglycemia, gliclazide 80 mg/d was associ- ated with a reduction in postprandial hyperglycemia. Dose escalation from 80 to 160 mg/d was not found to be associated with additional clinical benefit. Based on these results, we recommend that gliclazide dose escalation to the maximum dose recommended by the manufacturer be guided by measures of glycemia. All doses were well tolerated. (Curr TherRes Clin Exp. 2006;67:81-102) Copyright © 2006 Excerpta Medica, Inc.
Key words: type 2 diabetes mellitus, oral antidiabetic agents, oral hypo- glycemic agents, gliclazide, postprandial hyperglycemia, sulfonylureas.
INTRODUCTION The Diabetes Control and Complications Trial 1 and the United Kingdom Pro- spective Diabetes Study 2 found the benefits of blood glucose control in types 1 and 2 diabetes mellitus (DM), respectively. The findings of these landmark stud- ies have since entrenched glucose levels as a surrogate biochemical marker to predict clinical outcomes in patients with type 1 or 2 DM.
Following the findings of those 2 trials, clinicians have focused the manage- ment of DM on the regulation of blood glucose (ie, attaining near-normoglycemia [fasting blood glucose (FBG) level, 4.0-6.0 mmol/L (72.1-108.1 mg/dL)]). Clini- cians commonly base the pharmacotherapy of hyperglycemia on the objective parameters of FBG, fructosamine, and glycosylated hemoglobin (HbAlc).
However, increasing evidence supports and emphasizes the importance of targeting postprandial hyperglycemia (2-hour postprandial blood glucose [PPBG2 h] level, 2 hours after a meal, _ 11.1 mmol/L [___200 mg/dL]). 3 Postprandial blood glucose (PPBG) levels have been reported to be better predictors of glycemic control and to correlate better with HbAlc compared with FBG. 4 In a review of literature concerning elevated PPBG as a risk factor for cardiovascu- lar disease in patients with type 2 DM, Bonora and Muggeo 5 concluded that postprandial hyperglycemia, even in the absence of fasting hyperglycemia, was a risk factor for ischemic heart disease. In a prospective, randomized, con- trolled s tudy of blood glucose monitoring in pregnant women with type 1 DM in northern Ireland, Manderson et al 6 found that PPBG monitoring and regula- tion were associated with a significantly reduced prevalence of preeclampsia compared with preprandial blood glucose monitoring and regulation (3% vs 21%; P < 0.048). Furthermore, in a prospective, randomized study of combina- tion treatment with short-acting (regular) plus intermediate-acting (NPH) human insulin in 66 patients with gestational DM in the United States, de Veciana et al 7
82
P. Na idoo et aL
found that PPBG monitoring and regulation were associated with improved out- comes in pregnancy (mean [SD] birth weight, 3469 [668] vs 3848 [434] g).
Sulfonylureas (SUs) are a well-established class of drugs used for the man- agement of type 2 DM. They are also the most commonly used first-line oral antidiabetic agents. 8 One second-generation SU, gliclazide, is a well-established oral hypoglycemic agent used in the management of type 2 DM. Gliclazide, like all SUs, promotes insulin secretion by closing adenosine t r iphosphate- sensitive potassium channels in the pancreatic [3-cell membrane, resulting in opening of voltage-dependent calcium channels and subsequently increasing intracellular Ca 2+, which induces phosphorylat ion of proteins, which in turn stimulate insulin release. 9,1° The dose-response relationship of gliclazide has not been firmly established. Nonetheless, gliclazide is extensively used in South Africa.
The epidemiologic evidence supporting PPBG monitoring and regulation and the dose-response relationships of SUs11--gliclazide 12 in particular--motivated the present study. The aims of this study were to determine the effects of increasing doses of gliclazide on postprandial glucose excursions after a stan- dardized breakfast and lunch, and to clarify the relationship between gliclazide dose and glucose response.
PATIENTS AND METHODS This prospective, open-label, case-controlled, dose-escalation study was con- ducted at the Addington Hospital Diabetes Clinic, a tertiary referral hospital in eThekwini/Durban, KwaZulu-Natal, South Africa. The study protocol was ap- proved by the ethics committee at the University of Durban-Westville, South Africa. Permission to conduct the study at Addington Hospital was obtained from the KwaZulu-Natal Department of Health and the manager of Addington Hospital. The study was conducted in accordance with the Declaration of Helsinki and its amendments 13 and the Patients' Rights Charter. 14 All patients provided written informed consent to participate.
Inclusion and Exclusion Criteria Male and female patients were identified using the medical records of the clinic;
those meeting the inclusion criteria and consenting to participate in the study were enrolled. Patients were not compensated for their participation. Inclusion criteria were as follows: age, ___18 years; type 2 DM (duration, ---6 months); current treatment with an oral hypoglycemic agent; capillary FBG level, 8 to 10 mmol/L (144-180 mg/dL); HbAlc concentration, 8% to 10%; and postprandial hyper- glycemia (PPBG 2 h, ---11.1 mmol/L [___200 mg/dL]).
Exclusion criteria were as follows: significant renal impairment (serum crea- tine level, >1.8 mg/dL); impaired liver function (alanine aminotransferase, aspartate aminotransferase, total bilirubin, or alkaline phosphatase >2.5-fold the upper limit of normal); poor compliance, as assessed using a pill count at
83
CURRENT THERAPEUTIC RESEARCH
each study visit; poorly controlled DM; current or history of alcohol or other drug abuse; hematologic disorder (white blood cell count, <2.0 × 10⁹ cells/L; platelet count, <100 × 109 cells/L); congestive heart failure; and porphyria. Women who were pregnant or breastfeeding also were excluded.
Study Drug Administration and Efficacy Assessments The primary efficacy end points were changes in PPBG 2 h and 6-hour PPBG
(PPBG6 h) with dose increase. Secondary efficacy end points were changes in FBG level, area under the blood glucose-time curve from time 0 to 6 hours after breakfast (AUC0_6), and MBG level.
The study included a screening visit (week -1), a 1-week washout period, and 4 additional clinic visits (weeks 0 [baseline], 2, 4, and 6). Hematology (full blood cell count) and biochemistry (liver and kidney function tests; serum lipid lev- els; HbAlc; serum levels of fructosamine, creatinine, electrolytes, and CO2; urea; and FBG) were performed in all patients. Anthropomorphic measurements (height, weight, and waist and hip circumferences) also were determined. Full body examinations, including vital sign measurements, were performed by the resident medical practitioner (M.L.). Also at the screening visit, eligible patients were asked to d iscont inue all t r ea tmen t with oral hypoglycemic agents for 1 week (washout period) and throughout the study. Treatment with other con- comitant medications was continued and itemized throughout the study. Pa- tients received instructions from a nurse on using a home glucose monitor (Glucostix, Ames Division, Miles Laboratories, Elkhart, Indiana) and were asked to record their FBG levels each day on waking in a patient diary during the washout period. Patients received counseling on appropriate diet from the resi- dent dietician, and were asked to record and repor t any major changes in dietary or exercise habits throughout the study.
One week after screening (week 0; baseline), patients returned to the clinic after an overnight fast, and a blood sample was drawn to determine fasting levels of serum fructosamine, plasma insulin, and blood glucose. A standardized breakfast was then administered, followed by a standardized lunch 4 hours later. The researcher (P.N.) observed the complete consumption of the meals, which occurred within -10 minutes. To determine AUC0~, blood glucose levels were measured at 30-minute intervals for 6 hours after breakfast; these measurements included PPBG 2 h and PPBG 6 h" Plasma insulin was measured again 30 minutes after breakfast. At the end of the baseline visit, patients were supplied with gliclazide 80-mg tablets, to be self-administered at 40 mg (1/2 tablet) QD in the morning with a meal and -250 mL water for 2 weeks, commencing the following morning.
At week 2, patients returned to the clinic after an overnight fast and received gliclazide 40 mg 15 minutes before a standardized breakfast was administered. A standardized lunch was administered 4 hours after breakfast. Blood glucose was measured at 30-minute intervals for 6 hours after breakfast; these measure- ments included PPBG 2 h and PPBG 6 h" Fructosamine and insulin were measured as during the baseline visit. At the end of the week-2 visit, patients were asked
84
P. Na idoo et aL
to begin self-administering a dose of 80 mg QD for 2 weeks, beginning on the fol- lowing morning.
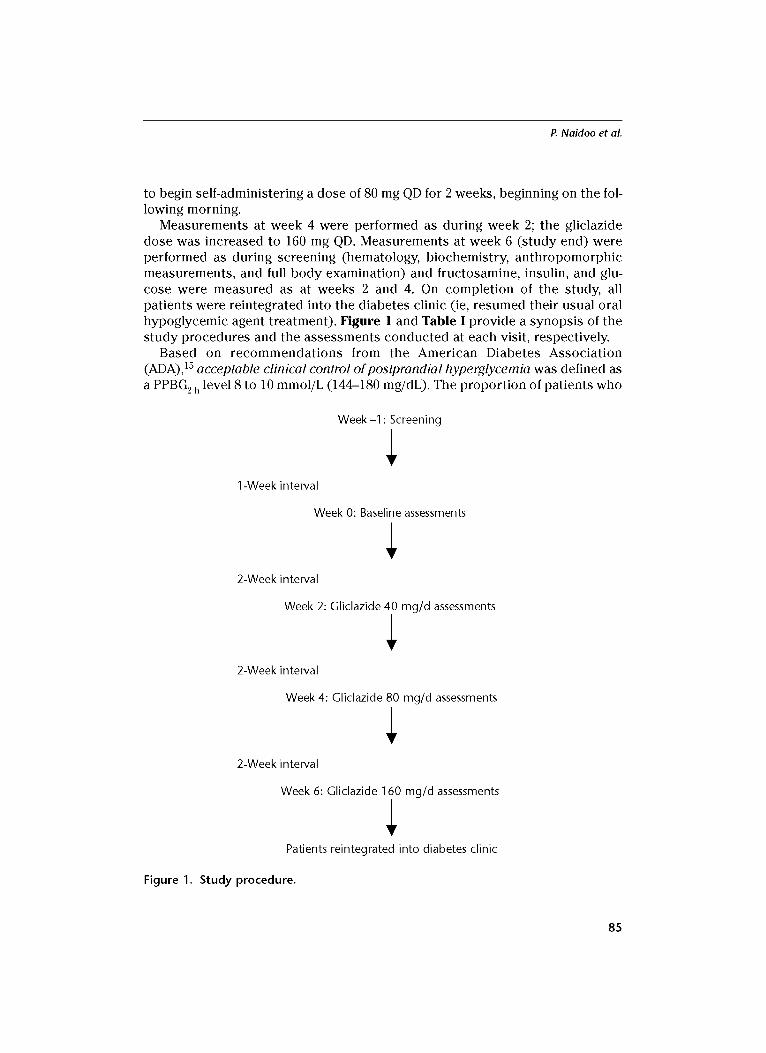
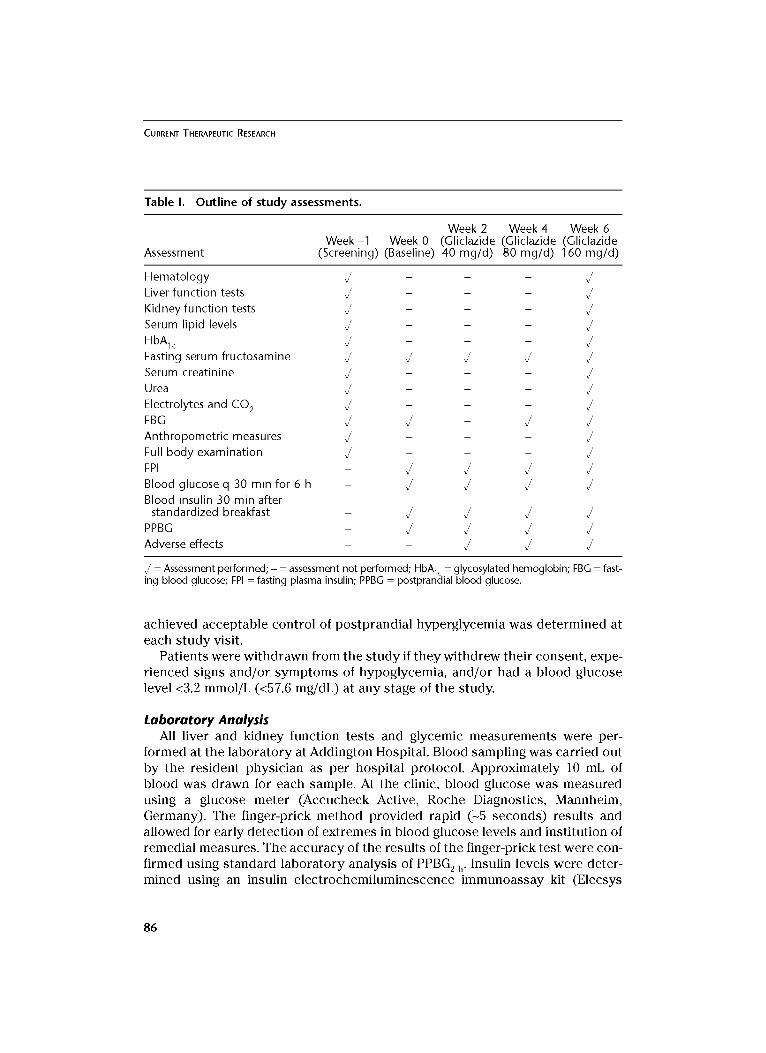
Measurements at week 4 were performed as during week 2; the gliclazide dose was increased to 160 mg QD. Measurements at week 6 (study end) were performed as during screening (hematology, biochemistry, anthropomorphic measurements, and full body examination) and fructosamine, insulin, and glu- cose were measured as at weeks 2 and 4. On completion of the study, all patients were reintegrated into the diabetes clinic (ie, resumed their usual oral hypoglycemic agent treatment). Figure 1 and Table I provide a synopsis of the study procedures and the assessments conducted at each visit, respectively.
Based on recommendations from the American Diabetes Association (ADA)) 5 acceptable clinical control of postprandial hyperglycemia was defined as a PPBG 2 h level 8 to 10 mmol/L (144-180 mg/dL). The proportion of patients who
1 -Week interval
Week-1 • Screening
Week 0: Baseline assessments
2-Week interval
Week 2: Gliclazide 40 mg/d assessments
2-Week interval
Week 4: Gliclazide 80 mg/d assessments
2-Week interval
Week 6: Gliclazide 160 mg/d assessments
Patients reintegrated into diabetes clinic
Figure 1. Study procedure.
85
CURRENT THERAPEUTIC RESEARCH
Table I. O u t l i n e o f s t u d y assessments.
Week 2 Week 4 Week 6 W e e k - 1 Week 0 (Gl iclazide (Gl iclazide (Gl iclazide
Assessment (Screening) (Baseline) 40 m g / d ) 80 m g / d ) 160 m g / d )
H e m a t o l o g y U - - - U
Liver funct ion tests ~ - - -
K idney funct ion tests ~ - - -
Serum lipid levels U - - - U
HbAlc U - - - U Fasting serum f ructosamine ~ ~ ~ ~
Serum creat inine ~ - - -
Urea ~ - - -
Electrolytes and C O 2 , / - - - , /
FBG U U - U U An th ropome t r i c measures ~ - - -
Full b o d y examina t ion U - - - U
FPI - U U U U
Blood glucose q 30 min for 6 h - U U U U
Blood insulin 30 min after s tandardized breakfast - ~ ~ ~
PPBG - U U U U Adverse effects - - ~ ~
U = Assessment performed; - = assessment not performed; HbA lc = glycosylated hemoglobin; FBG = fast- ing blood glucose; FPI = fasting plasma insulin; PPBG = postprandial blood glucose.
achieved acceptable control of postprandial hyperglycemia was determined at each study visit.
Patients were withdrawn from the study if they withdrew their consent, expe- rienced signs and/or symptoms of hypoglycemia, and/or had a blood glucose level <3.2 mmol/L (<57.6 mg/dL) at any stage of the study.
Laboratory Analysis All liver and kidney function tests and glycemic measurements were per-
formed at the laboratory at Addington Hospital. Blood sampling was carried out by the resident physician as per hospital protocol. Approximately 10 mL of blood was drawn for each sample. At the clinic, blood glucose was measured using a glucose meter (Accucheck Active, Roche Diagnostics, Mannheim, Germany). The finger-prick method provided rapid (-5 seconds) results and allowed for early detection of extremes in blood glucose levels and institution of remedial measures. The accuracy of the results of the finger-prick test were con- firmed using standard laboratory analysis of PPBG 2 h" Insulin levels were deter- mined using an insulin electrochemiluminescence immunoassay kit (Elecsys
86
P. Na idoo et aL
Systems D-68298, Roche Diagnostics). Analysis of HbAlc was carr ied out using the Cobas Integra me thod (Roche Diagnostics, Inc., Somerville, New Jersey).
Anthropometric Measures Height was measu red using a s tadiometer , and weight was obta ined using a
s tandard e lectronic digital scale. Waist c i rcumference was obta ined at the level of the umbilicus, and hip c i rcumference was measu red at the maximum circum- ference around the hips. This me thodo logy was similar to tha t adop ted by Tulloch-Reid et al. 16
Glucose Profiles MBG was de te rmined as follows:
MBG = [(Sum of glucose levels during the 6-hour a s sessment per iod for pat ient l /n) + (Sum of glucose levels for pat ient 2/n) .. ./N]
where n = the number of glucose measu remen t s during the 6-hour s tudy period, and N = total number of patients.
Surrogate Measures of Insulin Resistance and Insulin Secretion The homeos ta t i c model a s sessment (HOMA)-2 calculator sof tware (Univer-
s i ty of Oxford, Oxford, United Kingdom) was used to d e t e rm in e HOMA-IR, which is a sur roga te marker of insulin res i s tance (IR) and was used to descr ibe the IR s ta tus of the s t udy cohor t . Pat ients with HOMA-IR values >1.57 were classified as insulin resistant . Acute insulin re lease (AIR) was calcula ted as the difference in insulin levels at 30 and 0 minutes, and s e rv ed as a sur roga te marker of f i rs t-phase insulin secre t ion. Response was defined as HOMA-IR ___1 and any increase in AIR. The rate of r e sponse was de t e rmined at s t u d y end.
Tolerability Assessment Adverse-effect moni tor ing included direct repor t ing of untoward effects to
the res ident medical prac t i t ioner (M.L.), clinical examination, moni tor ing of home blood glucose records, hematology, and liver and kidney function tests.
Compliance Assessment Compliance was assessed using pill counts , examinat ion of d iary entries, and
pat ient interview. Compliance was enforced using t e l ephone calls to the pa- t ients each day.
Statistical Analysis A sample size of 11 pat ients was required to de tec t a difference of 2 mmol/L
(36 mg/dL) be tween any two levels of glucose, with a probabi l i ty of 0.05 and 80% power, assuming a cons tan t SD of 3.22 mmol/L (58 mg/dL) at each dose interval. Buoen et a117 assessed cohor t size in Phase I dose-escalat ion trials and conc luded that a sample size of ___10 pat ients was sufficient.
87
CURRENT THERAPEUTIC RESEARCH
Continuous variables are expressed as mean (SD) unless otherwise stated. The paired samples t test was used to determine differences between continu- ous variables at 95% CI. Statistical significance was assumed for P values <0.05. Data collection and statistical analysis were performed using SPSS version 11.5 (SPSS Inc., Chicago, Illinois).
RESULTS Study Population
Of the 33 patients who were screened, 14 satisfied the inclusion criteria and were enrolled in the study. Thirteen patients completed the s tudy (7 women, 6 men; mean [SD] age, 52.0 [11.1] years). One patient was wi thdrawn because of poor compliance. Seven patients not current ly receiving ant ihyper tensive t rea tment did not reach the ADA 15 optimal blood pressure of <130/80 mm Hg.
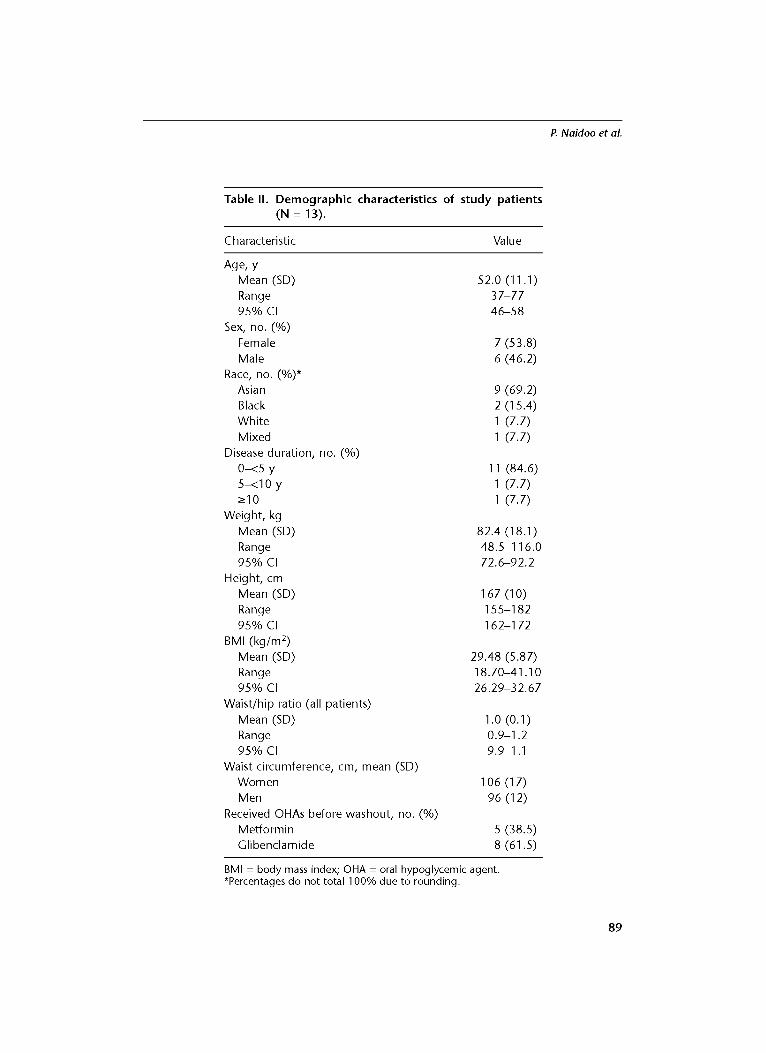
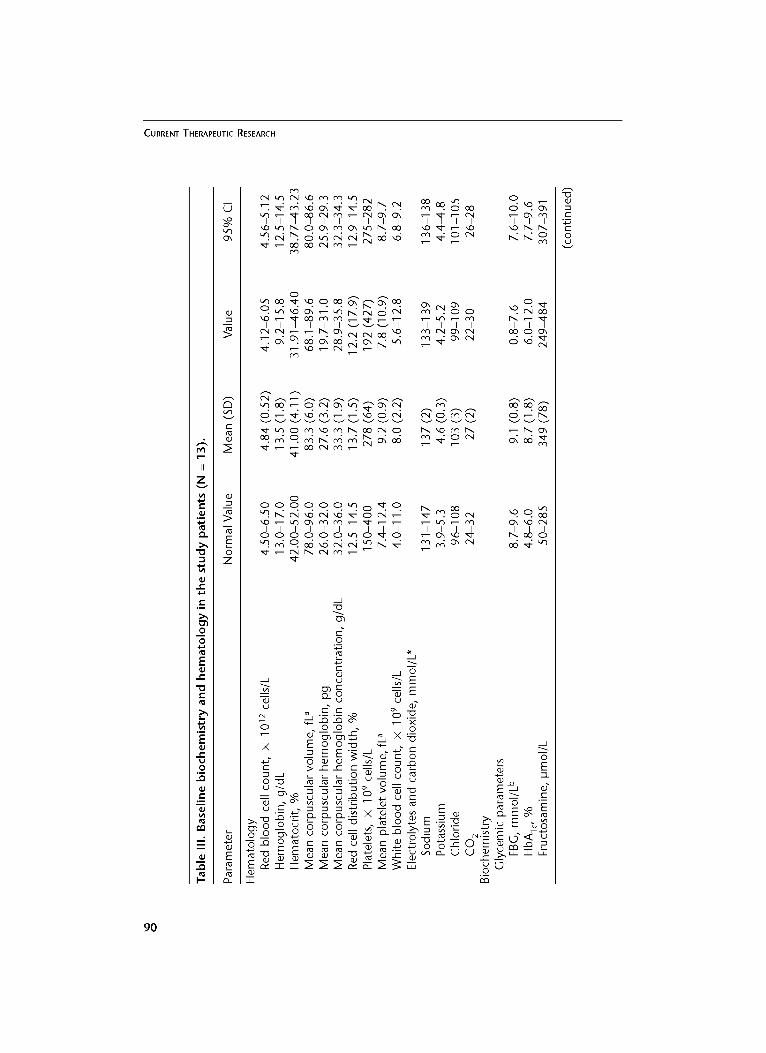
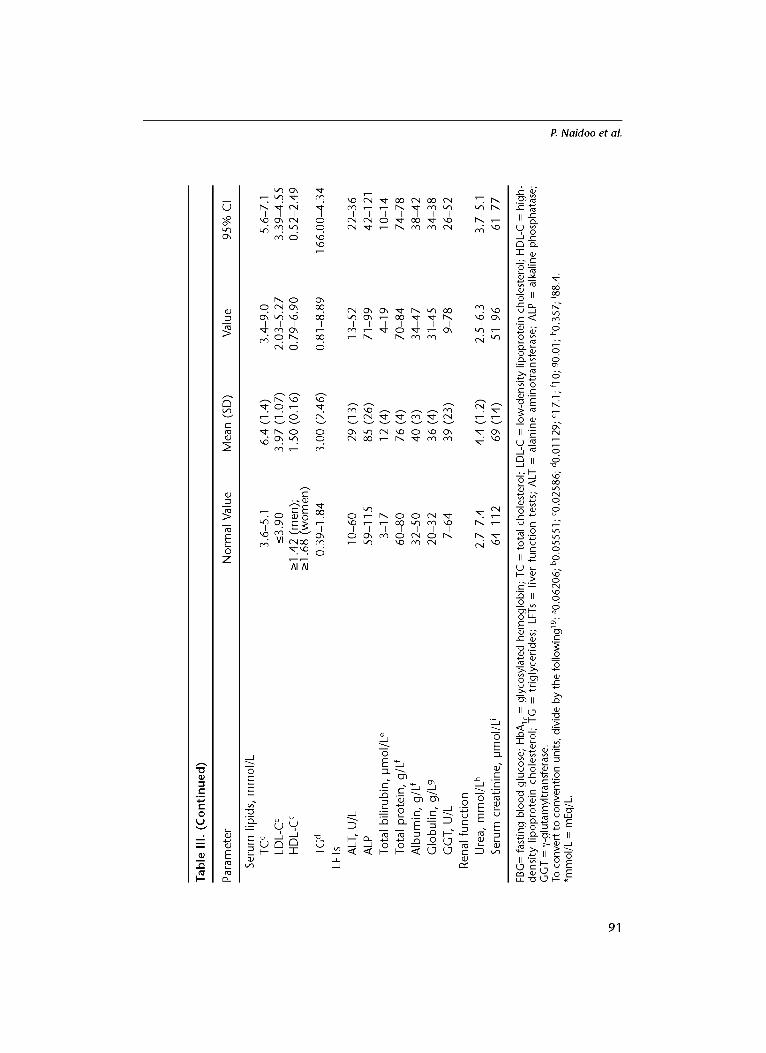
In 11 (84.6%) pat ients , the dura t ion of DM was be tween 0 and 5 years . All 13 patients had hyperl ipidemia (low-density lipoprotein cholesterol level, >3.9 mmol/L; total cholesterol level, >5.9 mmol/L; triglyceride level, >1.84 mmol/L). Eleven patients were categorized as obese based on World Health Organization criteria (body mass index, ->30 kg/m2). 18 On entry, 9 (69.2%) patients had IR. However, 12 patients had elevated globulin levels (mean [SD] in patients with elevated globulin levels, 36 [4] g/L [normal range, 20-32 g/L]). The hematologic parameters were within the normal ranges at baseline and at the complet ion of the s tudy in all 13 patients. The demographic character is t ics and baseline bio- chemis t ry and hematology of the s tudy cohort on entry are presented in Table II and Table III, respectively.
Efficacy Table IV shows the glycemic measurements found in the s tudy population.
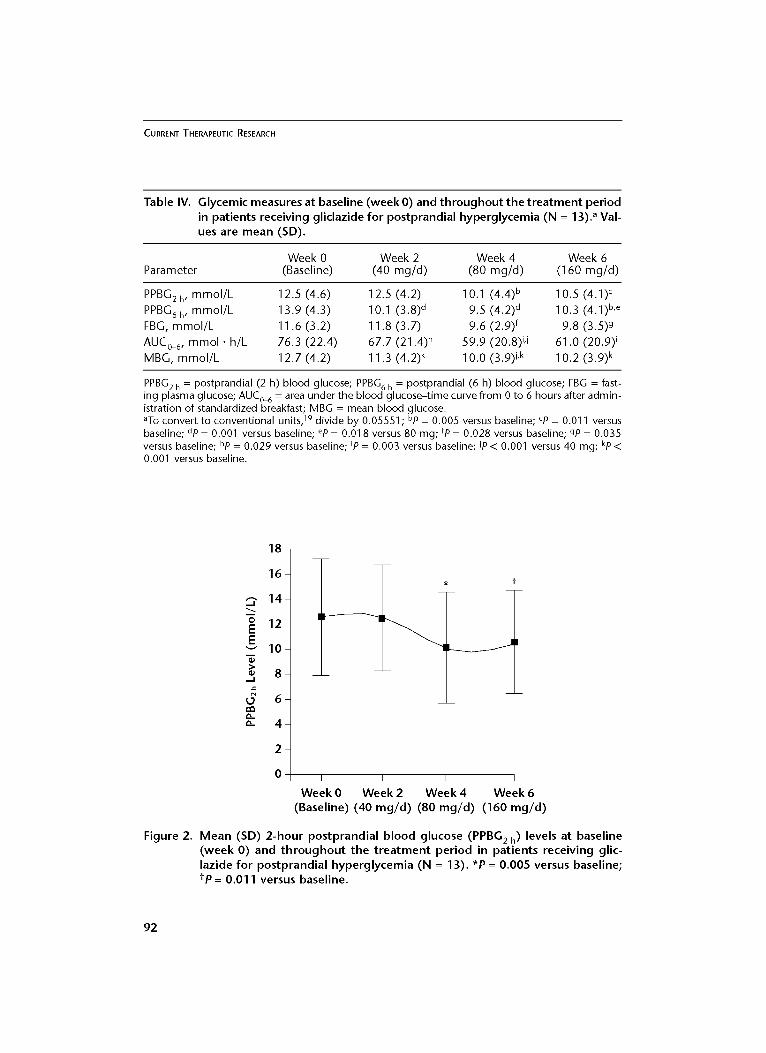
Mean levels of PPBG 2 h and PPBG 6 h at each dose of gliclazide are depicted in Figures 2 and 3, respectively, and Table IV. The change from baseline in mean PPBG2 h was not statistically significant with gliclazide 40 mg/d. Mean (SD) PPBG2 h was significantly reduced from baseline with doses of 80 and 160 mg/d (from 12.5 [4.6] to 10.1 [4.4] and 10.5 [4.1] mmol/L, respectively [from 225.2 [82.9] to 181.9 [79.3] and 189.2 [73.9] mg/dL, respectively]; P = 0.005 and P = 0.011, respectively). Mean PPBG 2 h did not change significantly with dose esca- lation from 80 to 160 mg/d (Figure 2 and Table IV).
Mean (SD) PPBG 6 h was significantly reduced from baseline with all 3 doses of gliclazide (40, 80, and 160 mg/d) (from 13.9 [4.3] to 10.1 [3.8], 9.5 [4.2], and 10.3 [4.1] mmol/L, respectively [from 250.4 [77.5] to 181.9 [68.5], 171.1 [75.7], and 185.6 [73.9] mg/dL, respectively]; P = 0.001, P = 0.001, and P = 0.005, respectively). The dif- ference in mean PPBG 6 h Was not significantly different between the 40- and 80-mg/d doses. However, there was a statistically significant decrease in mean PPBG 6 h when the gliclazide dose was increased from 80 to 160 mg/d (P = 0.018) (Figure 3 and Table IV).
88
P. Naidoo et aL
Table II. Demographic characteristics of study patients (N = 13).
Characteristic Value
Age, y Mean (SD) 52.0 (11.1) Range 3 7 - 7 7
95% CI 46-58 Sex, no. (%)
Female 7 (53.8) Male 6 (46.2)
Race, no. (%)* Asian 9 (69.2) Black 2 (15.4) White 1 (7.7) Mixed 1 (7.7)
Disease duration, no. (%) 0-<5 y 11 (84.6) 5-<10 y 1 (7.7) _>1o 1 (7.7)
Weight, kg Mean (SD) 82.4 (18.1 ) Range 48.5-116.0 95% CI 72.6-92.2
Height, cm Mean (SD) 167 (10) Range 155-182 95% CI 162-1 72
BMI (kg/m 2) Mean (SD) 29.48 (5.87) Range 18.70-41.10 95% CI 26.29-32.67
Waist/hip ratio (all patients) Mean (SD) 1.0 (0.1) Range 0.9-1.2 95% CI 9.9-1.1
Waist circumference, cm, mean (SD) Women 106 (17) Men 96 (12)
Received OHAs before washout, no. (%) Metformin 5 (38.5) Glibenclamicle 8 (61.5)
BMI = body mass index; OHA = oral hypoglycemic agent. *Percentages do not total 100% due to rounding.
89
C U R R E N T T H E R A P E U T I C R E S E A R C H
O
Oh
~J
r -
~J
~J
E O z
E
m
~ 0 ~ ~ ~
0 d ' £ ~ , ~ Oh r 'q
I I I
0 ~ oo ~ ,,o o oo ~,~,~, . ~ ~ o ~ °
. ~4 ,.6 o-; ,z ~4 r,,: r~ o r~ 0
' £ . 4 % q" q I oo 0 0"-.
d , 5 ~
~ M q M ~ M M ~ N ~ ~ m ~ o m
0 ~ ~
o < 0 d ~
O ~ o o o o o ~ ~ o . ~ d ~ d ~ S d " % ~ n q ~
I I I I I I I I I I I I I I I I I 0 0 0 0 0 0 ~ 0 ~ 0 ~ ~ 0
0 . m
r -
u ~ E - ~ 2_~ ~ E -~ u u
E'E
0 O O . O o~ o~ .~ ~ X ~
E o o ' - o - ~ X
_= E E,2-~ ~ " ~ - _ . ~ ~-
0 " 0 ~ ~ ~ ' . ~ u ~ - - E . ~ _ ~ 5 ' 5 5 = ~ > ~ ~:_~
. o U U U ..-Q ~ ~ ";'- ~ ~ ~ ~ 0 "~-
' ~ ' - " = = = ~ x ~ ~ _E_~ > ~ _ E ~ > , - a ~ '~ e_ e_ e _ . ~
~ , , _ o ~ o , ~ , ~ , ~ . . ~ = , ~ o : 5 ~ 2 ~ ~.~ E - < ~ ~ . u E E ~ ~ ~ ~ ~ b o ~ O E ~
E ~ - - r - r ~ ~ ~ ~ ~- ~ ~ , m ~ ~J
" - r a3
r - . m t - O
90
P. Naidoo et al.
i
=_.
C~
vh Oh
r -
E 0
z
E
I I I ~ O h C N
P¢3
I 0 0
I '~ 0 O~ O P ' q O ~ oo O ~ v h ' . . O oo
I I I I
o 4 o ~ . Eo
"~" 0 ~
• " o ,'-q
@ Oh V3 O
pc3 ~ pc3
'2"
~. 'q . d
AI AI
I I I I I I I I I ~ 0 ~ ~ ~
I I I I I I I I I ~ 0 ~ ~
0 ~ 0 0 ~ . ~
I I I I I I I I I 0 ~ 0 ~ 0 ~ ~
- i
Z~ -5 ~- E
E ~
E £ £ ~ ~, ~.~._'E
~ 1.5 ~_" . - ~ ~ E
H
o ~
o ,, U ~
0 ~- E E
• __- ~, 2 < ,b"
m m cN
~._o ~
~"-=- c-~
"N II ,,o O m o
c- ~ E
~ _o
• r-- ~
, i~ _~- -~
m
E ~ E ~ . _ ~ ? 0¢ ~ > ...i
~ o E o ~
_ ~ > ~ E O
I ' ~ O ~ ~ E r ~ E
9 1
CURRENT THERAPEUTIC RESEARCH
Table IV. Glycemic measures at baseline (week 0) and th roughou t the t rea tment period in patients receiving gliclazide for postprandial hyperglycemia (N = 13). a Val- ues are mean (SD).
Week 0 Week 2 Week 4 Week 6 Parameter (Baseline) (40 mg/d) (80 mg/d) (160 mg/d)
PPBG2 h , mmol/L 12.5 (4.6) 12.5 (4.2) 10.1 (4.4) b 10.5 (4.1) c PPBG6 h , mmol/L 13.9 (4.3) 10.1 (3.8) a 9.5 (4.2) a 10.3 (4.1) b,e FBG, mmol/L 11.6 (3.2) 1 1.8 (3.7) 9.6 (2.9) f 9.8 (3.5)9 AUC0_6, mmo l . h/L 76.3 (22.4) 67.7 (21.4) h 59.9 (20.8) i,j 61.0 (20.9) i MBG, mmol/L 12.7 (4.2) 11.3 (4.2) k 1 0.0 (3.9)J ,k 1 0.2 (3.9) k
PPBG2 h = postprandial (2 h) blood glucose; PPBG 6 h = postprandial (6 h) blood glucose; FBG = fast- ing plasma glucose; AUC0~ = area under the blood glucose-time curve from 0 to 6 hours after admin- istration of standardized breakfast; MBG = mean blood glucose. aTo convert to conventional units, 19 divide by 0.05551; bp = 0.005 versus baseline; cp = 0.011 versus baseline; dp = 0.001 versus baseline; ep = 0.018 versus 80 mg; fP = 0.028 versus baseline; gP = 0.035 versus baseline; hp = 0.029 versus baseline; ip = 0.003 versus baseline; ip ~ 0.001 versus 40 mg; kp 0.001 versus baseline.
18-
16-
--- 14- m o 12- E E v 10-
8 -
O 6 -
4 -
2 -
0 I I I I
Week 0 Week 2 Week 4 Week 6 (Baseline) (40 mg /d ) (80 mg/d ) (160 mg /d )
Figure 2. Mean (SD) 2-hour postprandia l b lood glucose (PPBG 2 h) levels at baseline (week 0) and t h r o u g h o u t the t rea tmen t per iod in pat ients receiving glic- lazide for postprandia l hyperg lycemia (N = 13). *P = 0.005 versus baseline; tp = 0.011 versus baseline.
92
P. Naidoo et al.
m 0
E E
> <D
~9 r~ r~
2 0 -
1 8 -
1 6 -
1 4 -
1 2 -
1 0 -
8 -
6 -
4 -
2 -
0 I I I I
Week 0 Week 2 Week 4 Week 6 (Baseline) (40 mg/d) (80 mg/d) (160 mg/d)
Figure 3. Mean (SD) 6-hour postprandial blood glucose (PPBG 6 h) levels at baseline (week 0) and throughout the treatment period in patients receiving glic- lazide for postprandial hyperglycemia (N = 13). *P = 0.001 versus baseline; tp = 0.005 versus baseline; *P = 0.018 versus 80 mg.
Nine (69.2%) patients achieved acceptable clinical control of postprandial hyperglycemia at the 80-mg/d dose. Dose escalation from 80 to 160 mg/d did not increase the number of patients achieving target PPBG levels.
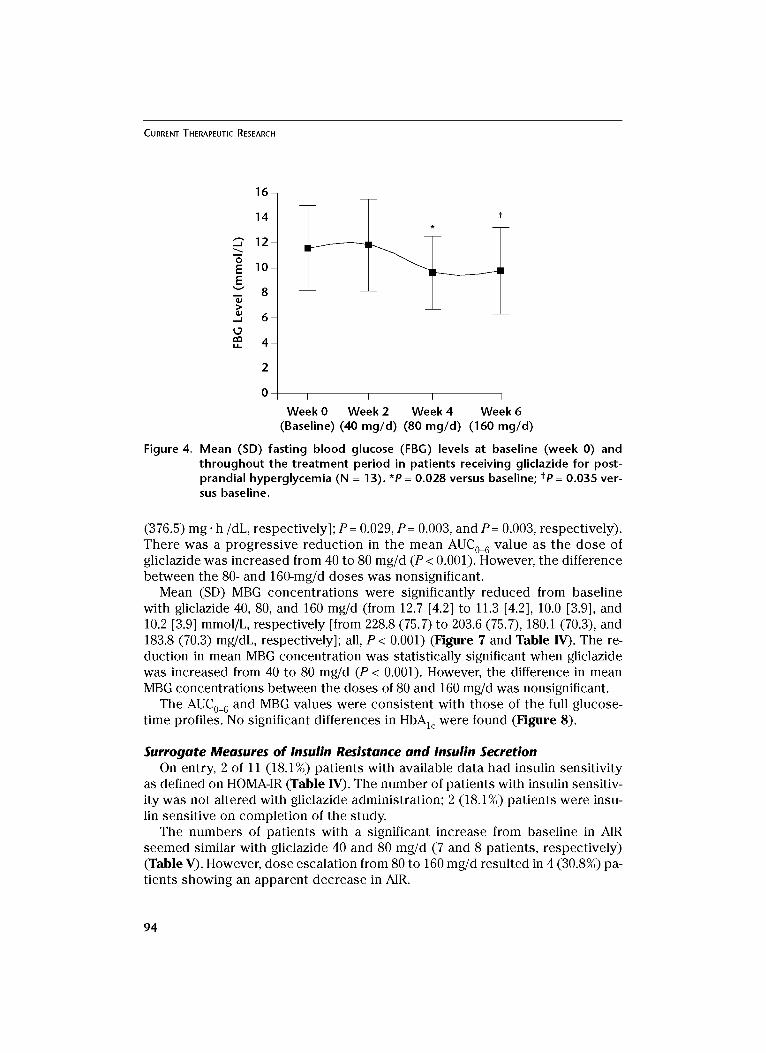
Figure 4 and Table IV show the changes in mean FBG with dose. Mean FBG was not significantly reduced from baseline with the 40-mg/d dose of gliclazide. However, the mean FBG concentration was significantly reduced from baseline with the 80- and 160-mg/d doses of gliclazide (from 11.6 [3.2] to 9.6 [2.9] and 9.8 [3.5] mmol/L, respectively [from 209.0 [57.6] to 172.9 [52.2] and 176.5 [63.1] mg/dL, respectively]; P = 0.028 and P = 0.035, respectively). There was no significant dif- ference in mean FBG between the 80- and 160-mg/d doses of gliclazide. Figure 4 shows the "plateau effect" on FBG as the dose of gliclazide reaches 160 mg/d.
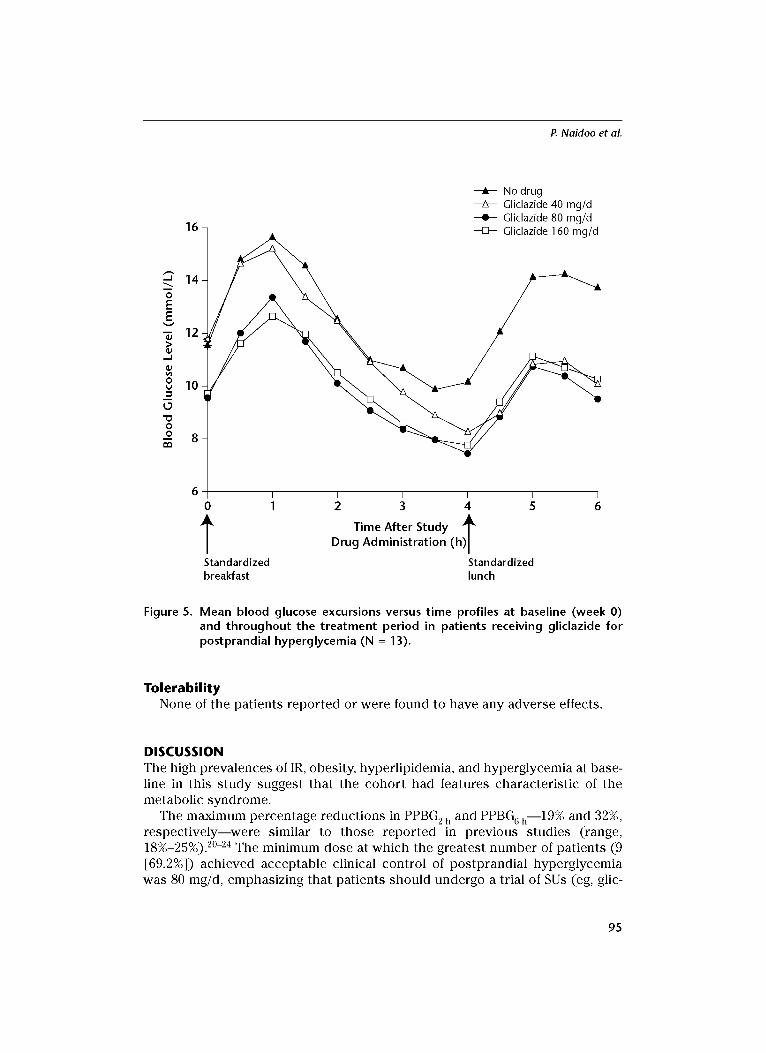
Figure 5 depicts the blood glucose-time profiles throughout the study. The 80- and 160-mg/d doses of gliclazide appeared to be associated with similar glucose profiles, suggesting a minimal difference between these 2 doses when the blood glucose-time profiles are used as the pharmacodynamic marker (plateau effect).
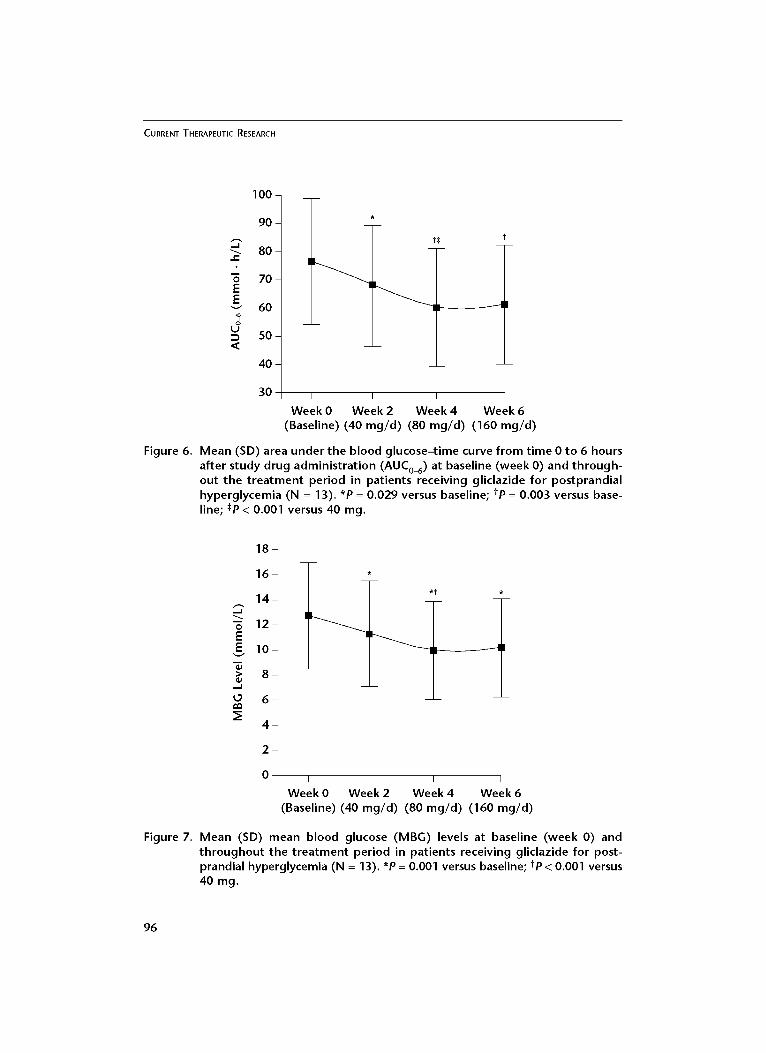
The AUC0_ 6 values at each dose are shown in Figure 6. Mean (SD) AUC0_ 6 val- ues were significantly reduced from baseline at the 40-, 80-, and 160-mg/d doses of gliclazide (from 76.3 [22.4] to 67.7 [21.4], 59.9 [20.8], and 61.0 [20.9] mmol. h/L, respectively [from 1374.5 (403.5) to 1219.6 (385.5), 1079.1 (374.7), and 1098.9
93
CURRENT THERAPEUTIC RESEARCH
16
14
~" 12 m 0 E 10 E
v 8 >
-- 6
4
I I I I
Week 0 Week 2 Week 4 Week 6 (Baseline) (40 mg/d) (80 mg/d) (160 mg/d)
Figure 4. Mean (SD) fasting blood glucose (FBG) levels at baseline (week O) and throughout the treatment period in patients receiving gliclazide for post- prandial hyperglycemia (N = 13). *P = 0.028 versus baseline; tp = 0.035 ver- sus baseline.
(376.5) mg. h/dL, respectively]; P= 0.029, P= 0.003, and P= 0.003, respectively). There was a progressive reduction in the mean AUC0_ 6 value as the dose of gliclazide was increased from 40 to 80 mg/d (P < 0.001). However, the difference between the 80- and 160-mg/d doses was nonsignificant.
Mean (SD) MBG concentrations were significantly reduced from baseline with gliclazide 40, 80, and 160 mg/d (from 12.7 [4.2] to 11.3 [4.2], 10.0 [3.9], and 10.2 [3.9] mmol/L, respectively [from 228.8 (75.7) to 203.6 (75.7), 180.1 (70.3), and 183.8 (70.3) mg/dL, respectively]; all, P < 0.001) (Figure 7 and Table IV). The re- duction in mean MBG concentration was statistically significant when gliclazide was increased from 40 to 80 mg/d (P < 0.001). However, the difference in mean MBG concentrations between the doses of 80 and 160 mg/d was nonsignificant.
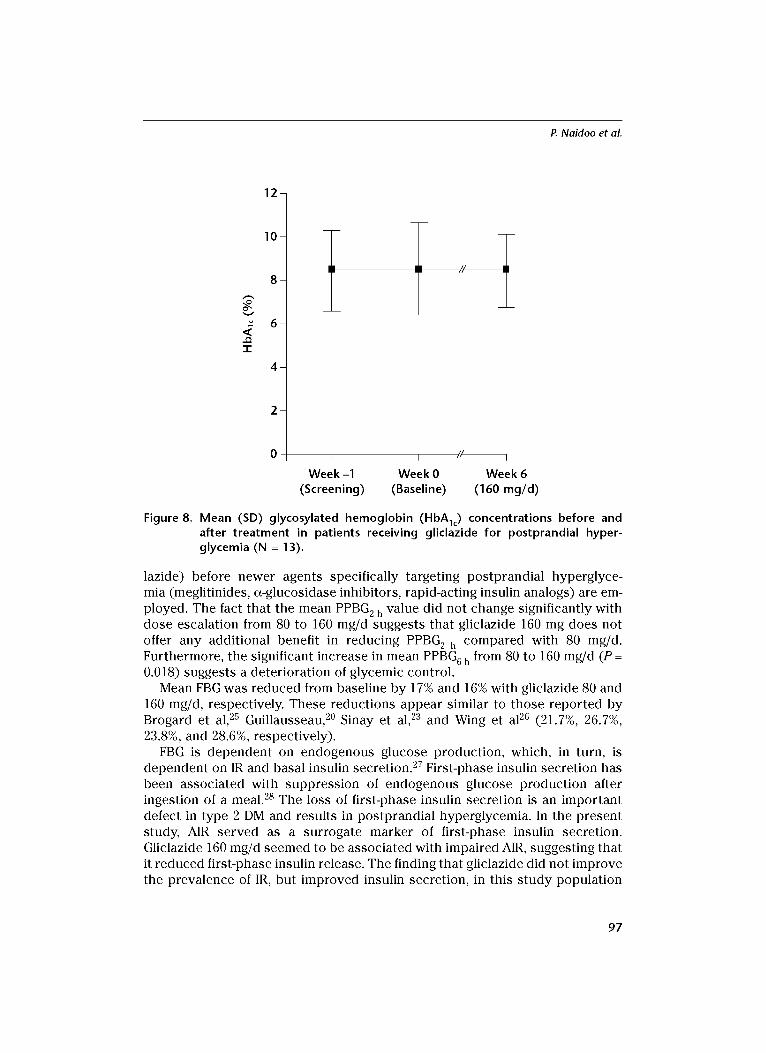
The AUC0_ 6 and MBG values were consistent with those of the full glucose- time profiles. No significant differences in HbAlc were found (Figure 8).
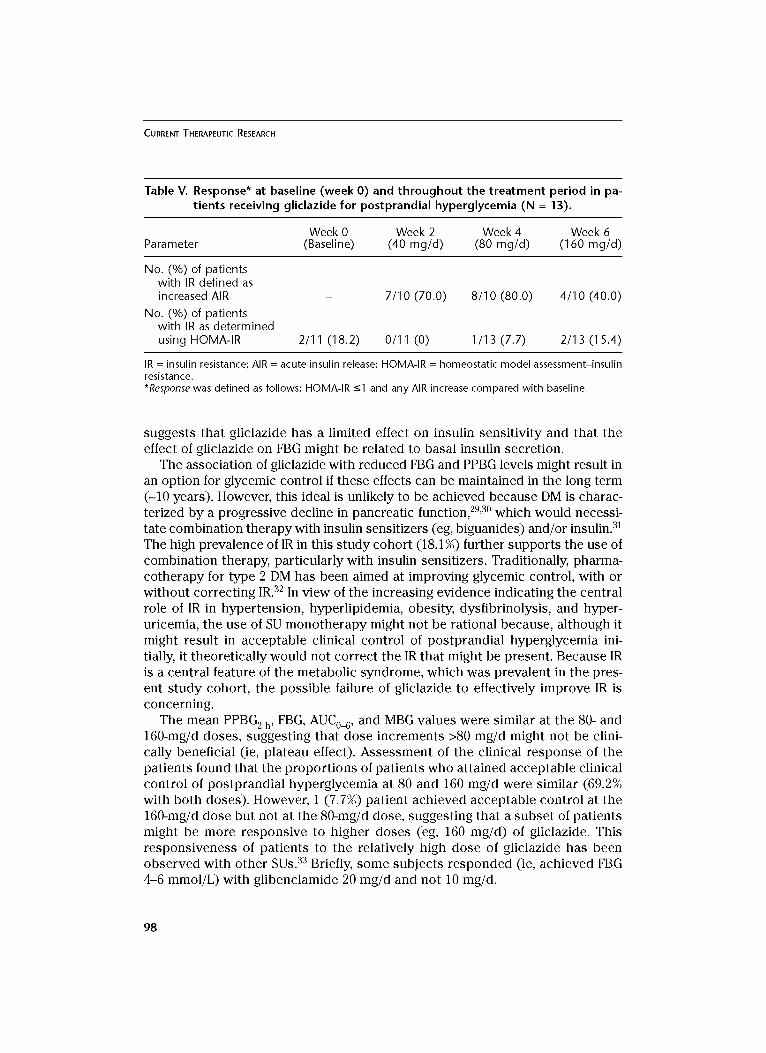
Surrogate Measures of Insulin Resistance and Insulin Secretion On entry, 2 of 11 (18.1%) patients with available data had insulin sensitivity
as defined on HOMA-IR (Table IV). The number of patients with insulin sensitiv- ity was not altered with gliclazide administration; 2 (18.1%) patients were insu- lin sensitive on completion of the study.
The numbers of patients with a significant increase from baseline in AIR seemed similar with gliclazide 40 and 80 mg/d (7 and 8 patients, respectively) (Table V). However, dose escalation from 80 to 160 mg/d resulted in 4 (30.8%) pa- tients showing an apparent decrease in AIR.
94
A No drug --~-- Gliclazide 40 mg/d --II-- Gliclazide 80 mg/d --~-- Gliclazide 160 mg/d
"G
E E
> Q; .-I
0
,,,,1
0 _o
16
14
12
10
8
P. Na idoo et al.
I I I I I I
0 1 2 3 4 5
k Time After Study ~k Drug Administration (h)J
Standardized Standardized breakfast lunch
6
Figure 5. Mean blood glucose excursions versus time profiles at baseline (week 0) and throughout the treatment period in patients receiving gliclazide for postprandial hyperglycemia (N = 13).
T o l e r a b i l i t y None of the patients reported or were found to have any adverse effects.
DISCUSSION The high prevalences of IR, obesity, hyperlipidemia, and hyperglycemia at base- line in this study suggest that the cohort had features characteristic of the metabolic syndrome.
The maximum percentage reductions in PPBG 2 h and PPBG 6 h--19% and 32%, respectively--were similar to those reported in previous studies (range, 18%-25%). 20-24 The minimum dose at which the greatest number of patients (9 [69.2%]) achieved acceptable clinical control of postprandial hyperglycemia was 80 mg/d, emphasizing that patients should undergo a trial of SUs (eg, glic-
95
CURRENT THERAPEUTIC RESEARCH
"G
E E
o U
,<
100 -
9 0 -
8 0 -
70 -
6 0 -
5 0 -
4 0 -
30
t~
I I I I
Week 0 Week 2 Week 4 Week 6 (Baseline) (40 rag/d) (80 rag/d) (160 rag/d)
Figure 6. Mean (SD) area under the blood glucose-time curve from time 0 to 6 hours after study drug administration (AUC0_6) at baseline (week 0) and through- out the t reatment period in patients receiving gliclazide for postprandial hyperglycemia (N = 13). *P = 0.029 versus baseline; tp = 0.003 versus base- line; ~P ~ 0.001 versus 40 mg.
18 -
16 -
14 -
-~ 12- E E 10-
8 -
4 -
2 -
0
* t
I I I I
Week 0 Week 2 Week 4 Week 6 (Baseline) (40 rag/d) (80 rag/d) (160 rag/d)
Figure 7. Mean (SD) mean blood glucose (MBG) levels at baseline (week 0) and throughout the treatment period in patients receiving gliclazide for post- prandial hyperglycemia (N = 13). *P = 0.001 versus baseline; tp ~ 0.001 versus 40 mg.
96
P. Na idoo et al.
12-
e~
"1-
1 0 -
8 -
6 -
4 -
2 -
T I
I I / / I
Week -1 Week 0 Week 6 (Screening) (Baseline) (160 rag/d)
Figure 8. Mean (SD) glycosylated hemoglobin (HbAlc) concentrations before and after treatment in patients receiving gliclazide for postprandial hyper- glycemia (N = 13).
lazide) before newer agents specifically targeting postprandial hyperglyce- mia (meglitinides, ~-glucosidase inhibitors, rapid-acting insulin analogs) are em- ployed. The fact that the mean PPBG 2 h value did not change significantly with dose escalation from 80 to 160 mg/d suggests that gliclazide 160 mg does not offer any additional benefit in reducing PPBG 2 h compared with 80 mg/d. Furthermore, the significant increase in mean PPBG 6 h from 80 to 160 mg/d (P = 0.018) suggests a deterioration of glycemic control.
Mean FBG was reduced from baseline by 17% and 16% with gliclazide 80 and 160 mg/d, respectively. These reductions appear similar to those reported by Brogard et al, 25 Guillausseau, 2° Sinay et al, 23 and Wing et a126 (21.7%, 26.7%, 23.8%, and 28.6%, respectively).
FBG is dependent on endogenous glucose production, which, in turn, is dependent on IR and basal insulin secretion. 27 First-phase insulin secretion has been associated with suppression of endogenous glucose production after ingestion of a meal. 28 The loss of first-phase insulin secretion is an important defect in type 2 DM and results in postprandial hyperglycemia. In the present study, AIR served as a surrogate marker of first-phase insulin secretion. Gliclazide 160 mg/d seemed to be associated with impaired AIR, suggesting that it reduced first-phase insulin release. The finding that gliclazide did not improve the prevalence of IR, but improved insulin secretion, in this s tudy population
97
CURRENT THERAPEUTIC RESEARCH
Table V. Response* at baseline (week O) and throughout the treatment period in pa- tients receiving gliclazide for postprandial hyperglycemia (N = 13).
Week 0 Week 2 Week 4 Week 6 Parameter (Baseline) (40 mg/d) (80 mg/d) (160 mg/d)
No. (%) of patients with IR defined as increased AIR
No. (%) of patients with IR as determined using HOMA-IR
7/10 (70.0) 8/10 (80.0) 4/10 (40.0)
2/11 (18.2) 0/11 (0) 1/13 (7.7) 2/13 (15.4)
IR = insulin resistance; AIR = acute insulin release; HOMA-IR = homeostatic model assessment-insulin resistance. *Response was defined as follows: HOMA-IR -<1 and any AIR increase compared with baseline.
suggests that gliclazide has a limited effect on insulin sensitivity and that the effect of gliclazide on FBG might be related to basal insulin secretion.
The association of gliclazide with reduced FBG and PPBG levels might result in an option for glycemic control if these effects can be maintained in the long term (-10 years). However, this ideal is unlikely to be achieved because DM is charac- terized by a progressive decline in pancreatic function, 29,3° which would necessi- tate combination therapy with insulin sensitizers (eg, biguanides) and/or insulin. 31 The high prevalence of IR in this study cohort (18.1%) further supports the use of combination therapy, particularly with insulin sensitizers. Traditionally, pharma- cotherapy for type 2 DM has been aimed at improving glycemic control, with or without correcting IR. 32 In view of the increasing evidence indicating the central role of IR in hypertension, hyperlipidemia, obesity, dysfibrinolysis, and hyper- uricemia, the use of SU monotherapy might not be rational because, although it might result in acceptable clinical control of postprandial hyperglycemia ini- tially, it theoretically would not correct the IR that might be present. Because IR is a central feature of the metabolic syndrome, which was prevalent in the pres- ent study cohort, the possible failure of gliclazide to effectively improve IR is concerning.
The mean PPBG 2 h, FBG, AUC0_6, and MBG values were similar at the 80- and 160-mg/d doses, suggesting that dose increments >80 mg/d might not be clini- cally beneficial (ie, plateau effect). Assessment of the clinical response of the patients found that the proportions of patients who attained acceptable clinical control of postprandial hyperglycemia at 80 and 160 mg/d were similar (69.2% with both doses). However, 1 (7.7%) patient achieved acceptable control at the 160-mg/d dose but not at the 80-mg/d dose, suggesting that a subset of patients might be more responsive to higher doses (eg, 160 mg/d) of gliclazide. This responsiveness of patients to the relatively high dose of gliclazide has been observed with other SUs. 33 Briefly, some subjects responded (ie, achieved FBG 4-6 mmol/L) with glibenclamide 20 mg/d and not 10 mg/d.
98
P. Na idoo et aL
The finding of no significant differences in HbAlc was expected due to the short duration of the study (7 weeks). HbAlc typically is used for detecting changes in glycemia over an 8-to 12-week period.
The plateau effect of gliclazide (and other SUs) with dose escalation has been reported previously. 31,33-35 A clinical study of gliclazide in patients with type 2 DM conducted by Shaw et a112 found that increasing the dose of gliclazide from 80 to 160 mg/d during long-term administration might not increase antihyper- glycemic activity. Rambiritch, 33 in a dose-escalation study of glibenclamide 5, 10, 15, and 20 mg/d in 22 patients with type 2 DM in South Africa, found a lack of added glycemic control with doses of glibenclamide >5 to 10 mg/d (mean [SD] FBG levels at doses of 10 and 20 mg/d, 11.5 [3.84] and 11.2 [4.15] mmol/L, respectively; P = 0.782). This finding supports the observation by Jonsson et a134 that maximal therapeutic efficacy of glibenclamide occurred within the dose range of 7.0 mg/d (median HbAI~, 7.2% [range, 6.3%-10.3%]) to 10.5 mg/d (median HbAI~, 8.0% [range, 6.0%-9.9%]) in a prospective study in 50 pa- tients with type 2 DM in Sweden. The results of the present s tudy agree with the growing consensus that maximal reductions in glycemia are found with SU doses approximately half the manufacturers' maximum recommended daily dose.31,35
This study found a statistically significant increase in PPBG 6 h ( e = 0.018) ,
indicating a decrease in glycemic control, when the dose of gliclazide was increased from 80 to 160 mg/d. The maximum manufacturer's recommended dose 1° of 320 mg/d was not used in this study. Therefore, it is speculative as to what effect the higher dose of gliclazide would have had. If the trend toward reduced glycemic control with doses >80 mg/d were to continue, then higher doses would have produced a paradoxical increase in blood glucose levels. However, based on a MEDLINE search for literature concerning gliclazide (key terms: gliclazide, dose escalation, and efficacy; years: 1970-2005), no studies have found a deterioration of glycemic control with high doses of gliclazide. Nonetheless, this phenomenon has been described for other SUs (eg, glipizide 36,37 and glibenclamide33,38). Dose escalation from 80 to 160 mg/d was associated with an apparent reduction in AIR, which might explain the apparent deteriora- tion in glycemic control. However, the reason for high-dose SUs impairing glycemic control requires elucidation. It is tempting to speculate that this impairment might be due to the SU-induced hyperinsulinemia, which conse- quently would increase appetite and food intake, leading to glucotoxicity, although, based on our literature search, no published data are available. In a prospective study of glibenclamide in 15 patients with type 2 DM in South Africa by Jackson and Robertson, 38 this increase in appetite and food intake was described as patients "eating to keep up with their glibenclamide dose."
Because the doses of many pharmacologic agents in diverse drug classes have been altered from those recommended by the manufacturer, 39 we recom- mend that the efficacy and tolerability of less-than-recommended doses of SUs be reviewed through postmarketing surveillance. 4°
99
CURRENT THERAPEUTIC RESEARCH
Study Limitations The generalizability of the findings of the present s tudy is limited because this
s tudy was of a shor t durat ion (7 weeks) and the sample size was small (n = 13). Gliclazide was not e sca la ted to the m a x i m u m manufac tu re r ' s r e c o m m e n d e d dose of 320 mg/d b e c a u s e of the potent ia l danger of hypog lycemia and b e c a u s e this dose is not c o m m o n l y p r e sc r ibed in clinical p rac t i ce in South Africa. Al though no adve r s e effects of gliclazide were found or r epor ted , the small sam- ple size might have limited their detect ion.
CONCLUSIONS In this s t u d y of gliclazide dose esca la t ion in pa t ien ts with type 2 DM and pos t - prandia l hyperg lycemia , gliclazide 80 mg/d effect ively r educed pos tp rand ia l hyperg lycemia . Dose esca la t ion f rom 80 to 160 mg/d was not found to be clini- cally beneficial with regard to pos tp rand ia l hyperg lycemia . Based on these results , we r e c o m m e n d tha t gliclazide dose esca la t ion to the m a x i m u m dose r e c o m m e n d e d by the manufac tu re r be guided by m e a s u r e s of glycemia.
ACKNOWLEDGMENTS We gratefully acknowledge the financial a s s i s t ance p rov ided by the Univers i ty of Durban-Westville, South Africa, and the dona t ion of gliclazide by Sandoz, Johannesburg , South Africa.
REFERENCES 1. The Diabetes Control and Complications Trial Research Group. The effect of inten-
sive treatment of diabetes on the development and progression of long-term compli- cations in insulin-dependent diabetes mellitus. N Engl J Med. 1993;329:977-986.
2. UK Prospective Diabetes Study Group. Tight blood pressure control and risk of macrovascular and microvascular complications in type 2 diabetes: UKPDS 38 [pub- lished correction appears in BMJ. 1999;318:29]. BMJ. 1998;317:703-713.
3. Ceriello A. The possible role of postprandial hyperglycaemia in the pathogenesis of diabetic complications. Diabetologia. 2003;46(Suppl 1):M9-M16.
4. Avignon A, Radauceanu A, Monnier L. Nonfasting plasma glucose is a better marker of diabetic control than fasting plasma glucose in type 2 diabetes. Diabetes Care. 1997;20:1822-1826.
5. Bonora E, Muggeo M. Postprandial blood glucose as a risk factor for cardiovascular disease in Type II diabetes: The epidemiological evidence. Diabetologia. 2001;44: 2107-2114.
6. Manderson JG, Patterson CC, Hadden DR, et al. Preprandial versus postprandial blood glucose monitoring in type 1 diabetic pregnancy: A randomized controlled clinical trial. Am J Obstet Gynecol. 2003;189:507-512.
7. de Veciana M, Major CA, Morgan MA, et al. Postprandial versus preprandial blood glucose monitoring in women with gestational diabetes mellitus requiring insulin therapy. N Engl J Med. 1995;333:1237-1241.
100
P. Na idoo et aL
8. Charbonnel BH, Matthews DR, Schernthaner G, et al, for the QUARTET Study Group. A long-term comparison of pioglitazone and gliclazide in patients with type 2 diabetes mellitus: A randomized, double-blind, parallel-group comparison trial. Diabet Med. 2005;22:399-405.
9. Harrower A. Gliclazide modified release: From once daily administration to 24-hour glucose control. Metabolism. 2000;49(Suppl 2):7-11.
10. Palmer K J, Brogden RN. Gliclazide: An update of its pharmacological properties and therapeutic efficacy in non-insulin dependent diabetes mellitus. Drugs. 1993;46:92- 125.
11. Melander A. Kinetics-effect relations of insulin-releasing drugs in patients with type 2 diabetes: Brief overview. Diabetes. 2004;53(Suppl 3):$151-$155.
12. Shaw KM, Wheeley MS, Campbell DB, Ward JD. Home blood glucose monitoring in non-insulin-dependent diabetics: The effect of gliclazide on blood glucose and weight control, a multicentre trial. Diabet ivied. 1985;2:484-490.
13. World Medical Association (WMA) Declaration of Helsinki. Recommendations Guiding Medical Doctors in Biomedical Research Involving Human Subjects [WMA Web site]. Ferney-Voltaire, France: WMA; 1989. Available at: http://www.wma.net. Accessed March 6, 2006.
14. South Africa Dept. of Health. The patients' rights charter. Available at: http://www. d°h'g°v'za/d°cs/legislati°n/patientsright/chartere'html" Accessed March 7, 2006.
15. Expert Committee on the Diagnosis and Classification of Diabetes Mellitus. American Diabetes Association: Clinical practice recommendations 2002. Diabetes Care. 2002; 25(Suppl 1):$1-$147.
16. Tulloch-Reid MK, Williams DE, Looker HC, et al. Do measures of body fat distribution provide information on the risk of type 2 diabetes in addition to measures of general obesity? Comparison of anthropometric predictors of type 2 diabetes in Pima Indians. Diabetes Care. 2003;26:2556-2561.
17. Buoen C, Holm S, Thomsen MS. Evaluation of the cohort size in phase I dose escala- tion trials based on laboratory data. J Clin Pharmacol. 2003;43:470-476.
18. World Health Organization (WHO). Obesity: Preventing and Managing the Global Epidemic. Geneva, Switzerland: WHO; 2000. WHO Technical Report Series 804. Available at: http://whqlibdoc.who.int/trs/WHO_TRS_894.pdf. Accessed March 7, 2006.
19. Iverson C, Flanagin A, Fontanrosa PB, et al, for the American Medical Association. American Medical Association Manual of Style: A Guide for Authors and Editors. 9th ed. Philadelphia, Pa: Lippincott Williams & Wilkins; 1998:486-503.
20. Guillausseau PJ. An evaluation of long-term glycemic control in non-insulin-dependent diabetes mellitus: The relevance of glycated hemoglobin. Am JMed. 1991;90(Suppl): 46S-49S.
21. Kilo C, Dudley J, Kalb B. Evaluation of the efficacy and safety of Diamicron in non- insulin-dependent diabetic patients. Diabetes Res Clin Pract. 1991;14(Suppl 2):$79-$82.
22. Scott RS, Donnelly T. No effect of gliclazide on gastric inhibitory polypeptide (GIP) in type II diabetes. Diabetes Res Clin Pract. 1987;3:175-178.
23. Sinay IR, Arias P, Schnitman MA, et al. Diet only or diet and sulfonylureas in mild type II diabetes (NIDDM)? Pathophysiologic and therapeutic implications. Acta Diabetol Lat. 1988;25:289-297.
101

CURRENT THERAPEUTIC RESEARCH
24. Noury J, Nandeuil A. Comparative three-month study of the efficacies of metformin and gliclazide in the treatment of NIDD. Diabetes Metab. 1991; 17:209-212.
25. Brogard JM, Pinget M, Dorner M. Effect of middle-term gliclazide treatment on insulin secretion in non-insulin dependent diabetics. Curr ivied Res Opin. 1984;9:56-63.
26. Wing JR, Panz VR, Joffe BI, Seftel HC. Changes in glucose disposal and cellular insulin binding in obese black Southern African patients with type 2 diabetes mellitus before and after sulphonylurea therapy. Diabet Med. 1993;10:50-55.
27. DeFronzo RA, Bonadonna RC, Ferrannini E. Pathogenesis of NIDDM. A balanced overview. Diabetes Care. 1992;15:318-368.
28. DeFronzo RA, Gunnarsson R, Bjorkman O, eta]. Effects of insulin on peripheral and splanchnic glucose metabolism in noninsulin-dependent (type I1) diabetes mellitus. J Clin Invest. 1985;76:149-155.
29. UK Prospective Diabetes Study (UKPDS) Group. Intensive blood-glucose control with sulphonylureas or insulin compared with conventional treatment and risk of compli- cations in patients with type 2 diabetes (UKPDS 33) [published correction appears in Lancet. 1999;354:602]. Lancet. 1998;352:837--853.
30. UK Prospective Diabetes Study (UKPDS) Group. Effect of intensive blood-glucose control with metformin on complications in overweight patients with type 2 diabetes (UKPDS 34) [published correction appears in Lancet. 1998;352:1558]. Lancet. 1998; 352:854-865.
31. DeFronzo RA. Pharmacologic therapy for type 2 diabetes mellitus. Ann Intern Med. 1999;131:281-303.
32. Ceriel]o A, Johns D, Wide] M, eta]. Comparison of effect of pioglitazone with met- formin or sulfonylurea (monotherapy and combination therapy) on postload gly- cemia and composite insulin sensitivity index during an oral glucose tolerance test in patients with type 2 diabetes [published correction appears in Diabetes Care. 2005; 28:1272]. Diabetes Care. 2005;28:266-272.
33. Rambiritch V. Pharmacokinetics and pharmacodynamics of glibenclamide in type 2 diabetics [dissertation]. KwaZulu-Nata], South Africa: University of KwaZulu-Nata]; 2004.
34. Jonsson A, Hallengren B, Rydberg T, Melander A. Effects and serum levels of gliben- clamide and its active metabolites in patients with type 2 diabetes. Diabetes Obes Metab. 2001;3:403-409.
35. Krentz A J, Bailey CJ. Oral antidiabetic agents: Current role in type 2 diabetes melli- tus. Drugs. 2005;65:385-411.
36. Wahlin-Boll E, Sartor G, Melander A, Schersten B. Impaired effect of sulfonylurea fol- lowing increased dosage. EurJ Clin Pharmacol. 1982;22:21-25.
37. Stenman S, Melander A, Groop PH, Groop LC. What is the benefit of increasing the sulfonylurea dose? Ann Intern Med. 1993;118:169-172.
38. Jackson L, Robertson L. Sulphonylureas (specifically glibenclamide) and their correct dosage. S Afr Med J. 1989;76:286.
39. Heerdink ER, Urquhart J, Leufkens HG. Changes in prescribed drug doses after market introduction. Pharmacoepidemiol Drug Saf. 2002; 11:447--453.
40. Rambiritch V, Naidoo P. Gliclazide modified release. Drugs. 2005;65:1449-1450.
Address correspondence to: Poobalan Naidoo, BPharm, Universi ty of KwaZulu-Natal, Faculty of Health Sciences, Westville Campus, Discipline of Pha rmaco logy , Pr ivate Bag X54001, Durban 4000, South Africa. E-mail: [email protected]
102