Liquefied strength ratio from liquefaction flow failure case...
19
Liquefied strength ratio from liquefaction flow failure case histories Scott M. Olson and Timothy D. Stark Abstract: The shear strength of liquefied soil, s,(LIQ), mobilized during a liquefaction flow failure is normalized with re- spect to the vertical effective stress (o :,) prior to failure to evaluate the liquefied strength ratio, s,(LIQ)/o :,. Liquefied strength ratios mobilized during 33 cases of liquefaction flow failure are estimated using a procedure developed to directly back-analyze the liquefied strength ratio. In ten cases, sufficient data regarding the flow slide are available to incorporate the kinetics, i.e., momentum, of failure in the back-analysis. Using liquefied strength ratios back-calculated Erom case histories, relationships between liquefied strength ratio and normalized standard penetration test blowcount and cone penetration test tip resistance are proposed. These relationships indicate approximately linear correlations between liquefied strength ratio and penetration resistance up to values of q,, and (N,),, of 6.5 MPa and 12 blows/ft (i.e., blowd0.3 m), respectively. Key words: liquefaction, flow failure, liquefied shear strength, stability analysis, kinetics, penetration resistance. RCsumC : La resistance au cisaillement du sol liqukfie, s,(LIQ), mobiliste lors d'un ecoulement par liquefaction est nor- maliste par rapport a la contrainte effective verticale (a : , ) anterieure & la rupture pour tvaluer le rapport de rtsistance liqutfike, s,(LIQ)/o&, Les rapports de resistance liqutfiee mobilisCs au cours de 33 cas de rupture par liquefaction sont evalues au moyen d'une procedure dkveloppte pour rttro-analyser directement le rapport de resistance liqutfiee. Dans dix cas, il y avait suffisamment de donntes disponibles pour incorporer dans la rttro-analyse la cinetique de la rupture, c'est-&dire la quantite de mouvement. Utilisant les rapports de resistance liquefike retro-calculCs pour les histoires de cas, on propose des relations entre les rapports de rtsistance liquefite, le nombre de coups de penetration standard nor- malises, et la rtsistance en pointe de I'essai de penetration au c6ne. Ces relations indiquent approximativement des cor- relations lintaires entre le rapport de resistance liquefiee et la resistance A la penetration jusqu'a des valeurs de q,, et (N,),, de 6,5 MPa et de 12 coupslpied (coups/0.3 m) respectivement. Mots ~1.4~ : liquefaction, rupture par tcoulement, rtsistance au cisaillement, analyse de stabilite, cinetique, resistance a la ptnetration. [Traduit par la Redaction] Introduction cause it is generic and does not imply correspondence to any laboratorytest condition. ~e~ard1;s.s of &rminology, the The liquefied shear strength, su(LIQ), is the shear strength concepts for the liquefied shear strength stem from mobilized at large deformation after liquefaction is triggered Casagrande,s (1940) seminal work on the critical void ratio, in saturated, contractive, sandy soils. This strength differs from the shear strength available to a soil at the triggering of have proposed procedures to esti- liquefaction, which is referred to as the yield shear strength mate the shear strength of liquefied soils (Poulos et al. 1985; (Terzaghi et al. 1996). The liquefied shear strength has been Seed 1987; Seed and Harder 1990; Stark and 1992; referred to as the undrained steady-state shear strength, s,, Ishihara 1993; Konrad and Watts 1995; Fear and Robertson (Poulos et al. 1985), the undrained residual shear strength, s, 1995; others). The widely used of these p roce - (Seed 1987), and the undrained critical shear strength, dures are those by Poulos et Seed su(critical) (Stark and Mesri 1992). Based on a National Sci- (1987)9 Seed and Harder (1990)7 and Stark and ence Foundation (NSF) international workshop (Stark et al. These are discussed O ther 1998), the liquefied shear strength is used herein be- methods to estimate the liquefied shear strength are critiqued by Olson (2001). Poulos et al. (1985) presented a laboratory-based proce- Received 26 July 2001. Accepted 6 November 2001. Published on the NRC Research Press Web site at dure to estimate the in situ liquefied shear strength from un- http://cjg.nrc.ca on 9 May 2002. drained triaxial compression tests on reconstituted and high quality piston samples. Slight errors in estimating the in situ S.M. Olson? URS Corporation, 22 18 Millpark Drive, I void ratio from the ~iston samdes can cause large differ- I St. Louis, MO 63043, UXA. ences in the laboratory steady-state strength because of the T.D. Stark. University of Illinois at Urbana-Champaign, Department of Civil and Environmental Engineering, Urbana, small slope of the steady-state line (Kramer 1989). Poulos et IL 61801, U.S.A. al. (1985) indicated that the steady-state shear strength is de- pendent solely on the void ratio after consolidation (and 'Corresponding author (e-mail: [email protected]). prior to shear). However, more recent studies (e.g., Vaid and Can. Geotech. J. 39: 629 - 647 (2002) DOI: 10.1 1391T02-001 O 2002 NRC Canada
Transcript of Liquefied strength ratio from liquefaction flow failure case...

Liquefied strength ratio from liquefaction flow failure case histories
Scott M. Olson and Timothy D. Stark
Abstract: The shear strength of liquefied soil, s,(LIQ), mobilized during a liquefaction flow failure is normalized with re- spect to the vertical effective stress (o :,) prior to failure to evaluate the liquefied strength ratio, s,(LIQ)/o :,. Liquefied strength ratios mobilized during 33 cases of liquefaction flow failure are estimated using a procedure developed to directly back-analyze the liquefied strength ratio. In ten cases, sufficient data regarding the flow slide are available to incorporate the kinetics, i.e., momentum, of failure in the back-analysis. Using liquefied strength ratios back-calculated Erom case histories, relationships between liquefied strength ratio and normalized standard penetration test blowcount and cone penetration test tip resistance are proposed. These relationships indicate approximately linear correlations between liquefied strength ratio and penetration resistance up to values of q,, and (N,),, of 6.5 MPa and 12 blows/ft (i.e., blowd0.3 m), respectively.
Key words: liquefaction, flow failure, liquefied shear strength, stability analysis, kinetics, penetration resistance.
RCsumC : La resistance au cisaillement du sol liqukfie, s,(LIQ), mobiliste lors d'un ecoulement par liquefaction est nor- maliste par rapport a la contrainte effective verticale (a :,) anterieure & la rupture pour tvaluer le rapport de rtsistance liqutfike, s,(LIQ)/o&, Les rapports de resistance liqutfiee mobilisCs au cours de 33 cas de rupture par liquefaction sont evalues au moyen d'une procedure dkveloppte pour rttro-analyser directement le rapport de resistance liqutfiee. Dans dix cas, il y avait suffisamment de donntes disponibles pour incorporer dans la rttro-analyse la cinetique de la rupture, c'est-&dire la quantite de mouvement. Utilisant les rapports de resistance liquefike retro-calculCs pour les histoires de cas, on propose des relations entre les rapports de rtsistance liquefite, le nombre de coups de penetration standard nor- malises, et la rtsistance en pointe de I'essai de penetration au c6ne. Ces relations indiquent approximativement des cor- relations lintaires entre le rapport de resistance liquefiee et la resistance A la penetration jusqu'a des valeurs de q,, et (N,),, de 6,5 MPa et de 12 coupslpied (coups/0.3 m) respectivement.
Mots ~ 1 . 4 ~ : liquefaction, rupture par tcoulement, rtsistance au cisaillement, analyse de stabilite, cinetique, resistance a la ptnetration.
[Traduit par la Redaction]
Introduction cause it is generic and does not imply correspondence to any laboratorytest condition. ~e~ard1;s.s of &rminology, the
The liquefied shear strength, su(LIQ), is the shear strength concepts for the liquefied shear strength stem from mobilized at large deformation after liquefaction is triggered Casagrande,s (1940) seminal work on the critical void ratio, in saturated, contractive, sandy soils. This strength differs from the shear strength available to a soil at the triggering of have proposed procedures to esti-
liquefaction, which is referred to as the yield shear strength mate the shear strength of liquefied soils (Poulos et al. 1985;
(Terzaghi et al. 1996). The liquefied shear strength has been Seed 1987; Seed and Harder 1990; Stark and 1992;
referred to as the undrained steady-state shear strength, s,, Ishihara 1993; Konrad and Watts 1995; Fear and Robertson
(Poulos et al. 1985), the undrained residual shear strength, s, 1995; others). The widely used of these proce-
(Seed 1987), and the undrained critical shear strength, dures are those by Poulos et Seed su(critical) (Stark and Mesri 1992). Based on a National Sci- (1987)9 Seed and Harder (1990)7 and Stark and ence Foundation (NSF) international workshop (Stark et al. These are discussed Other
1998), the liquefied shear strength is used herein be- methods to estimate the liquefied shear strength are critiqued by Olson (2001).
Poulos et al. (1985) presented a laboratory-based proce- Received 26 July 2001. Accepted 6 November 2001. Published on the NRC Research Press Web site at dure to estimate the in situ liquefied shear strength from un-
http://cjg.nrc.ca on 9 May 2002. drained triaxial compression tests on reconstituted and high quality piston samples. Slight errors in estimating the in situ
S.M. Olson? URS Corporation, 22 18 Millpark Drive, I void ratio from the ~ i s t o n samdes can cause large differ-
I St. Louis, MO 63043, UXA. ences in the laboratory steady-state strength because of the T.D. Stark. University of Illinois at Urbana-Champaign, Department of Civil and Environmental Engineering, Urbana,
small slope of the steady-state line (Kramer 1989). Poulos et
IL 61801, U.S.A. al. (1985) indicated that the steady-state shear strength is de- pendent solely on the void ratio after consolidation (and
'Corresponding author (e-mail: [email protected]). prior to shear). However, more recent studies (e.g., Vaid and
Can. Geotech. J . 39: 629-647 (2002) DOI: 10.1 1391T02-001 O 2002 NRC Canada

Can. Geotech. J. Vol. 39, 2002
Thomas 1995) indicate that the laboratory steady-state shear strength also may be influenced by the mode of shear, effec- tive confining pressure, and sample preparation method.
As an alternative, Seed (1987) presented a relationship (later updated by Seed and Harder 1990) to estimate the liq- uefied shear strength from the equivalent clean sand stan- dard penetration test (SPT) blowcount, (N1)60-cs, where
where N is the field SPT blowcount, ER is the energy ratio of the SPT hammer system used (in percent), and A(N1)6,, is a fines content adjustment to generate an "equivalent clean sand" blowcount. The use of a fines content adjustment is discussed in a later section of this paper. CN is the overbur- den correction factor (slightly modified from Liao and Whit- man 1986)
where Pa is atmospheric pressure and o:, is the vertical ef- fective stress (same units as Pa).
The Seed (1987) approach is based on the back-analysis of 17 case histories of liquefaction flow failures and lateral spreads. The Seed and Harder (1990) relationship is the state-of-practice to estimate the liquefied shear strength, de- spite numerous uncertainties implicit in back-calculating the liquefied shear strength or in determining the "representa- tive" SPT blowcount. For example, 6 of the 17 cases involve liquefaction-induced lateral spreading, not liquefaction flow failure. Recently, NSF workshop participants (Stark et al. 1998) concluded that the shear strength back-calculated from cases of lateral spreading may not correspond to the shear strength mobilized during a liquefaction flow failure and should be considered separately. For some cases, Seed (1987) used the prefailure geometry to back-calculate an up- per bound liquefied shear strength, while for most cases the postfailure geometry was analyzed. Seed and Harder (1990) considered the kinetics of the failure movements to back- calculate liquefied shear strengths for an unknown number of the 17 case histories, but did not present their kinetics- based methodology, and in many cases their results differ from the results presented herein, which explicitly incorpo- rate kinetics. In 7 of the 17 cases, SPT blowcounts are not available and had to be estimated from an appraisal of rela- tive density, and numerous cases had only a limited number of penetration tests from which to select a representative value of (N,),,. Finally, Seed and Harder (1990) recom- mended that "the lower-bound, or near lower-bound relation- ship between [liquefied shear strength] and (NI)60-cs be used.. . at this time owing to scatter and uncertainty, and the limited number of case studies back-analvzed to date." Nu- merous studies have suggested that the use of the lower bound relationship to estimate liquefied shear strength re- sults in conservative factors of safety, particularly for large structures with large static shear stresses (e.g., Pillai and Salgado 1994; Finn 1998; Koester 1998).
Stark and Mesri (1992) concluded that an increase in pre- failure vertical effective stress (i.e., vertical consolidation
pressure) should result in an increase in liquefied shear strength due to consolidation under an increased confining stress. Accordingly, Stark and Mesri (1992) developed an approach to estimate the liquefied shear strength from lique- faction case histories as a function of the prefailure vertical effective stress. Utilizing the cases from Seed and Harder (1990) and three additional cases, Stark and Mesri (1992) presented a relationship between the liquefied strength ratio, s,(LIQ)lo lo and (N1)60-cs, where o ;, was a "representative" prefailure vertical effective stress in the zone of liquefaction. Their re-analysis did not reduce the scatter of the case histo- ries in comparison to the relationship proposed by Seed and Harder (1990) as a result of many of the difficulties dis- cussed above for the Seed and Harder (1990) approach. Stark and Mesri (1992) also suggested that many of the liq- uefaction failures experienced drainage during flow, result- ing in back-calculated shear strengths that did not represent undrained conditions. Stark and Mesri (1992) discerned this because some of the liquefied strength ratios exceeded the level ground yield strength ratios for the same SPT blow- count. (See Stark and Mesri 1992 for further details and a description of "yield strength ratio.")
In summary, there are a number of practical difficulties and uncertainties in using existing methods to estimate the liquefied shear strength and the strength ratio. In addition, laboratory testing is an expensive and difficult means to esti- mate liquefied shear strength. This paper presents improved relationships to estimate the liquefied strength ratio from CPT or SPT penetration resistance. A back-analysis proce- dure is presented to directly evaluate the liquefied strength ratio rather than using values of s,(LIQ) and o:, estimated separately. This procedure incorporates the entire range of prefailure vertical effective stress acting throughout the zone of liquefaction. Thirty-three case histories of liquefaction flow failure involving loose clean sands, silty sands, sandy silts, and tailings sands were back-analyzed to develop the improved relationships. Lateral spreading case histories are not considered in this study.
Sufficient information is available in ten cases to incorpo- rate the kinetics, i.e., momentum, of failure in the stability analysis. These analyses suggest that kinetics only influ- ences the back-analysis of liquefied shear strength in embankments/slopes larger than 10 m in height. For clarity, the term "kinetics" describes the forces, accelerations, and displacements associated with flow of the failure mass. The term "dynamics" is not used because it typically is associ- ated with seismic forces.
Discussion of concepts and terminology
Liquefied shear strength The liquefied shear strength is the shear strength mobi-
lized at large deformation by a saturated, contractive soil fol- lowing the triggering of strain-softening response. In the laboratory, where drainage conditions are controlled, the term "undrained" applies. However, in the field, as evidenced by observation and analysis of flow failures, drainage may oc- cur (Stark and Mesri 1992; Fiegel and Kutter 1994). There- fore, the shear strength mobilized in the field may not be undrained. The term "liquefied shear strength" is used to describe the shear strength actually mobilized during a
O 2002 NRC Canada

Olson and Stark
liquefaction flow failure in the field, including any potential effects of drainage, pore-water pressure redistribution, soil mixing, etc.
Laboratory shear tests on loose to medium dense labora- tory specimens or loose specimens under low effective con- solidation pressure indicate that dilation often occurs at large strain. These soils may exhibit a "quasi-steady state" (Ishi- hara 1993), or minimum strength prior to strain hardening. However, as noted by Yoshimine et al. (1999), once lique- faction is triggered and deformation begins in the field, the "...behavior may become dynamic and turbulent due to iner- tia effects [i.e., kinetics]. . ." and the dilation observed in the laboratory may not occur in the field. Despite some of these difficulties in interpreting the liquefied shear strength mobi- lized in the field, one purpose of this study was to determine if the liquefied shear strength can be interpreted in terms of the critical void ratio concept proposed by Casagrande (1940).
Liquefied strength ratio The liquefied strength ratio is defined as the liquefied
shear strength normalized by the prefailure vertical effective stress, S , ( L I Q ) ~ ~ ~ ~ . Recent laboratory testing (e.g., Ishihara 1993; Baziar and Dobry 1995; Vaid and Sivathalayan 1996) has shown that the liquefied shear strength of many loose (i.e., contractive) cohesionless soils is linearly proportional to the major principal effective stress after consolidation. Figure 1 presents an example of this behavior for remolded layered specimens of silty sand, Batch 7, from Lower San Fernando Dam (LSFD) (Baziar and Dobry 1995).
Following critical state soil mechanics theory, for a given method of deposition and mode of shearing of a co- hesionless soil, there is a unique value of s,(LIQ)/oLe, for a given value of state parameter, yf, as follows:
where o;,, is the mean effective stress, M is the slope of the failure surface in stress path space (q', o Lean), q' is the effective deviator stress, and A,, is the slope of the steady- state line (SSL) when mean effective stress is plotted on a logarithmic scale. Been and Jefferies (1985) defined the state parameter as
where eo is the in situ void ratio at a given mean effective confining stress prior to shearing, and e,, is the void ratio at the steady-state line for the same effective confining stress. Because the value of KO (the ratio of horizontal to vertical effective stress) does not vary significantly in loose sands, the liquefied shear strength, s,(LIQ)/o;,, is also uniquely re- lated to state parameter.
For many loose compressible sandy soils, the consolida- tion line and steady-state line are approximately parallel (Olson 2001; Cunning 1994). Therefore, for a given increase in effective confining stress, the value of state parameter re- mains nearly constant and the liquefied shear strength in- creases in proportion to the effective confining stress. Even if the consolidation behavior and steady-state line are not ex- actly parallel, it may be reasonable to assume that in many field conditions the consolidation behavior is approximately
Fig. 1. Relationship between liquefied shear strength and initial major principal effective stress for remolded layered specimens of silty sand, Batch 7, Lower San Fernando Dam (Baziar and Dobry 1995). Kc, ratio of major principal effective stress to minor principal effective stress at the end of consolidation.
Liquefied shear strength,s,(llQ) (kPa)
parallel to the steady-state line, for the range of effective stress of engineering interest. While this concept is not ex- pected to hold for dense sands, the authors suggest that if a material is loose enough to be susceptible to liquefaction flow failure, then this concept applies. Figure 2 presents an example of this concept for specimens of silty sand, Batch 7, from LSFD. Olson (2001) presents examples of this behav- ior for other sands.
This study applies the premise that liquefied shear strength is proportional to effective consolidation stress to the interpretation of liquefaction flow failures. Specifically, as the prefailure vertical effective stress increases, void ratio decreases, and therefore, liquefied shear strength increases. The prefailure vertical effective stress is used for normaliza- tion because alternate prefailure effective confining stresses such as the mean effective stress (oh,,,), effective stress normal to the failure surface (ok), and major or minor prin- cipal effective stress (ok or o;,), are difficult to determine accurately. Furthermore, because KO is not expected to vary greatly in loose sandy soils, o i0 (rather than o Lean) can be used to determine the liquefied shear strength without intro- ducing significant uncertainty. Lastly, the failure surface within the zone of liquefaction for the majority of the flow failures studied approaches direct shear conditions; thus, the prefailure o;, is nearly equal to c l ~ A.
Relation between liquefied strength ratio and penetration resistance
Several researchers (e.g., Jefferies et al. 1990; Stark and Mesri 1992; and Ishihara 1993) have related liquefied strength ratio to penetration resistance. A correlation between lique- fied strength ratio and penetration resistance is reasonable because both liquefied strength ratio and penetration resis- tance are functions of soil density and effective confining
O 2002 NRC Canada

Can. Geotech. J . Vol. 39. 2002
Fig. 2. A comparison of the consolidation behavior and the steady- state line for remolded layered specimens of silty sand, Batch 7, Lower San Fernando Dam (after Baziar and Dobry 1995). o;,,, minor principal effective stress at the steady-state condition.
Consolidation behavior, U&
7 Confining stress at steady-state, a&,,
a Baziar and Ddxy (1995) Vasquez-Herrera and Dobry (1 989)
I Range of in situ void ratios from Castro et a1 (1989)
stress. For example, Been et al. (1987b) related normalized CPT tip resistance to state parameter, as follows:
where k and m are soil constants that can be related to the slope of the steady-state line. Equation [S] indicates that higher values of normalized penetration resistance corre- spond to lower values of state parameter. Sladen (1989) dis- cussed difficulties with the exact form of this relationship, suggesting that the relationship is influenced by stress level. However, Shuttle and Jefferies (1998) showed that the rela- tionship is influenced by shear modulus, not stress level.
It is generally accepted that the shear modulus of sand in- creases with the square root of effective confining stress and KO does not vary greatly in loose sands. Therefore, (q, - omean)/o&ean can be reasonably replaced by another form of normalized CPT penetration resistance, qcl, to account for the increase in shear modulus with depth. This form of nor- malized CPT tip resistance is used throughout the remainder of this paper and is defined as
where q, is CPT tip resistance and the form of C, in eq. [6] was defined by Kayen et al. (1992).
On the basis of this discussion, Jefferies et al. (1990) sug- gested the following theoretical relationship (assuming rea- sonable values of k, m, KO, and A,,):
where Q was defined as q@;. However, Jefferies et al. (1990) found that liquefied strength ratios back-calculated from seven flow failures fell below the theoretical relationship and followed the trend
Stark and Mesri (1 992) recommended the following relation- ship between liquefied strength ratio and normalized pene- tration resistance
to describe the constant volume conditions present at the start of flow slides. Ishihara (1993) presented theoretical sU(LIQ)/o:, - Nl relationships for individual sands but also found that many available case histories fell below these the- oretical relationships.
Back-analysis of liquefaction flow failures
Three levels of stability analysis were used to back- calculate the liquefied strength ratio for the 33 flow failures. The appropriate level of analysis depended on the detail and quality of information available for each case history. For cases with minimal available information, a simplified anal- ysis was conducted to estimate the liquefied strength ratio. For the majority of cases (21 of 33), sufficient information was available to allow a rigorous slope stability analysis and the direct back-calculation of the liquefied strength ratio. For cases with appropriate documentation and failure conditions, an additional kinetics analysis was conducted to back- calculate the liquefied strength ratio. The following sections describe the simplified, rigorous, and kinetics analyses.
Simplified stability analysis of postfailure geometry Several investigators (e.g., Meyerhof 197 1 ; Lucia 198 1 ;
and Ishihara et al. 1990a) have developed simplified meth- ods to estimate the shear strength mobilized during flow slides. The Ishihara et al. (1990a) method was adopted for the simplified analysis and is briefly reviewed.
Ishihara et al. (1990a) used the following assumptions to estimate the liquefied shear strength mobilized during sev- eral flow failures: (i) the ground surface and the surface of the flowed material are approximately parallel when the mass comes to rest; (ii) side forces are equal, opposite, and co- linear; and (iii) the shear strength mobilized at the moment the failed mass comes to rest is equal to the liquefied shear strength. If the flowed material has an average thickness of H and a unit weight of y,, then force equilibrium in the di- rection of flow (similar to an infinite slope analysis) indi- cates that
[ lo] su(LIQ) = y,H sin a cos a
where a is the angle of inclination of the sliding surface and surface of flowed material to the horizontal.
Equation [ lo] is used to estimate values of liquefied shear strength for cases with insufficient information to conduct the rigorous stability analysis and where the above assump- tions are satisfied. Numerous flow failure cases in the litera- ture did not meet these minimum assumptions and therefore are not included in this study.
The simplified procedure only provides a value of lique- fied shear strength. Therefore, a representative vertical
O 2002 NRC Canada

Olson and Stark 633
effective stress is estimated from the prefailure geometry to calculate a liquefied strength ratio. Because the simplified analysis does not explicitly consider kinetics, values of su(LIQ)/~;, estimated using this method may be smaller than the actual s,(LIQ)/o;, of the liquefied soil (Olson 2001).
Rigorous stability analysis of postfailure geometry Olson (2001) developed a rigorous stability analysis pro-
cedure to back-calculate the liquefied strength ratio directly. This analysis was conducted for the majority (21 of 33) of cases. The rigorous stability analysis uses Spencer's (1967) slope stability method as coded in the microcomputer pro- gram UTEXAS3 (Wright 1992). Because this analysis also does not explicitly consider kinetics, values of s,(LIQ)/o;, estimated using this method may be smaller than the actual s,(LIQ)/o;, of the liquefied soil.
As explained subsequently, this analysis requires an esti- mate of the range of o;, for the liquefiable material prior to failure. To accurately assess the range of prefailure o;, for the liquefiable material, either the geometric extent of the liquefied soil must be known, or the initial failure surface must be assumed to pass approximately through the center of the zone of liquefaction. Olson (2001) examined a limited number of well-documented flow failures and found that ini- tial failure surfaces do pass approximately through the center of the zones of liquefaction. Therefore, this assumption appears valid and is used for the analysis of the other flow failures.
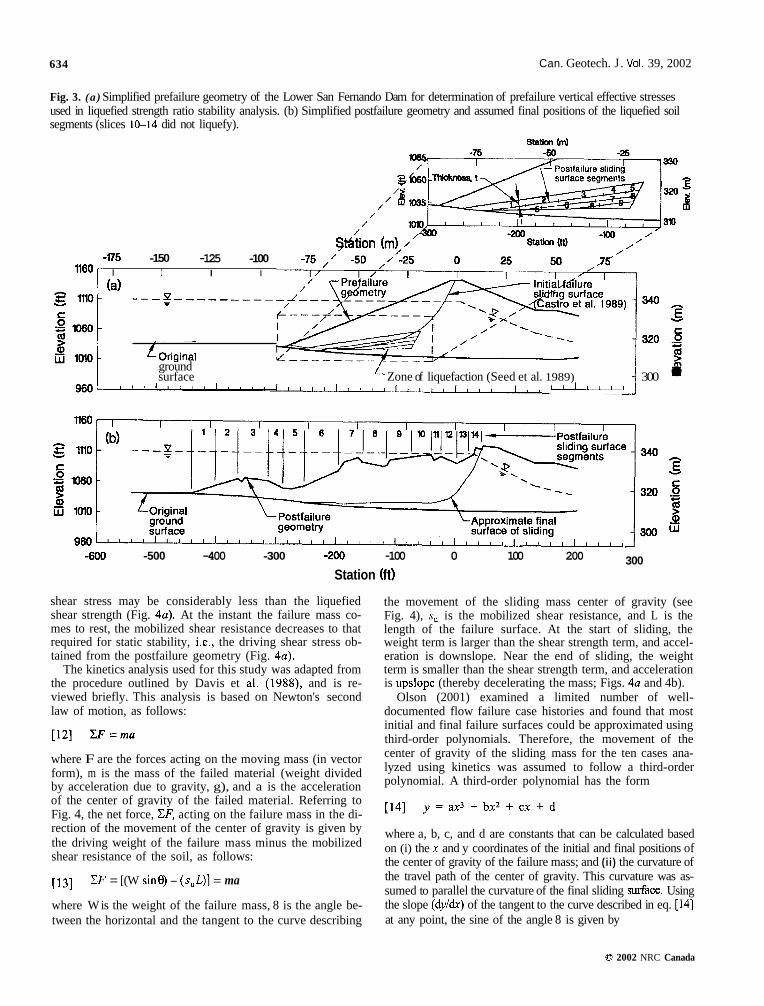
In this procedure, the postfailure sliding surface is divided into a number of segments. Based on the lengths of the postfailure segments, corresponding lengths of liquefied soil are defined within the prefailure geometry, i.e., within the zone of liquefaction or near the initial failure surface. Fig- ure 3 illustrates this procedure for the flow failure of LSFD. The postfailure sliding surface (Fig. 3b) is broken into 14 segments of various lengths. Based on the postfailure geom- etry segment lengths, corresponding lengths of liquefied soil are defined in the prefailure zone of liquefaction (Fig. 3a). The distance between the prefailure segments (i.e., thickness t in Fig. 3a) is approximately equal to the average final thickness of the liquefied soil estimated from the postfailure geometry. Segments 1-9 of the postfailure sliding surface consist of liquefied soil, while segments 10-14 consist of nonliquefied soil (namely, segments 10-13 correspond to core material, and segment 14 corresponds to ground shale hydraulic fill and rolled fill). Therefore, only segments 1-9 are located in the liquefied zone in the prefailure geometry in Fig. 3b. The prefailure o;, is determined for each segment in the liquefied soil (segments 1-9) and is assigned to the corresponding segment in its postfailure position. Olson (2001) found that rearranging the positions of the segments has little effect on the back-calculated liquefied strength ra- tio, as long as the segments are equally spaced in the zone of liquefaction or centered around the initial failure surface.
Using the individual o;, values for each segment and a single value of s,(LIQ)/o;,, individual values of liquefied shear strength are assigned to each segment of the post- failure geometry for the stability analysis (i.e., segments 1-9 in Fig. 3). This allows the variation in prefailure oh, within the zone of liquefaction to be reflected in variable liquefied shear strengths along the final sliding surface. Soils initially
above the phreatic surface, or otherwise known not to have liquefied (e.g., segments 10-14 in Fig. 3), are assigned ap- propriate drained or undrained shear strengths (see Olson 2001 for details of shear strength assignment for each of the case histories). The liquefied strength ratio is then varied (which in turn varies the liquefied shear strength mobilized along each segment of the postfailure geometry) until a fac- tor of safety of unity is achieved.
This analysis considers the entire range of prefailure verti- cal effective stress within the zone of liquefaction rather than a single "representative" value of prefailure o;,. Therefore, liquefied strength ratios back-calculated using this technique are considered more appropriate than those reported else- where, e.g., Stark and Mesri (1992) and Ishihara (1993). For use in the kinetics analyses, the weighted average prefailure vertical effective stress was calculated as follows:
where ot,i is the prefailure vertical effective stress for seg- ment i and L, is the length of segment i.
Stability analysis considering kinetics of failure mass movements
To obtain the best estimate of liquefied shear strength mo- bilized during failure, the back-analysis should consider the kinetics of failure. The reason for this is illustrated in Fig. 4 using the calculations made for the liquefaction flow failure of the North Dike of Wachusett Dam (Olson et al. 2000). At the onset of a liquefaction flow failure, only small strains are required to reduce the shear strength from the yield (or peak) shear strength to the liquefied shear strength (Davis et al. 1988). These strains occur while the driving shear stress re- mains relatively unchanged. For simplification, the liquefied soil is assumed to be in a post-peak condition and the mobi- lized strength at the beginning of failure (at time t = 0) is equal to the liquefied shear strength (as indicated in Fig. 4a). The initial driving shear stress in the zone of liquefaction is determined from a static slope stability analysis assuming a factor of safety of unity (Castro et al. 1989; Seed et al. 1989). Because the initial driving shear stress is larger than the liquefied shear strength (this is a prerequisite for a lique- faction flow failure), the mass begins to accelerate downslope (Fig. 4b). Therefore, the velocity of the failure mass increases from zero (Fig. 4c), and downslope displace- ment occurs (Fig. 46). The downslope displacement of the failure mass, in turn, decreases the driving shear stress of the failure mass because of the curvature of the failure path.
When the driving shear stress is reduced to the liquefied shear strength, the failure mass has an acceleration of zero and has attained its maximum velocity (Figs. 4b and 4c). (In Fig. 4a, the mobilized shear resistance is lower than the liq- uefied shear strength as a result of hydroplaning, as dis- cussed subsequently.) Because the failure mass has a finite velocity, it continues to displace and deform, decreasing the driving shear stress to a value less than the liquefied shear strength, thereby decelerating the failure mass (i.e., upslope acceleration; Figs. 4a and 4b). When the failure mass reaches a velocity of zero and comes to rest, the driving
O 2002 NRC Canada
634 Can. Geotech. J . Vol. 39, 2002
Fig. 3. (a) Simplified prefailure geometry of the Lower San Fernando Dam for determination of prefailure vertical effective stresses used in liquefied strength ratio stability analysis. (b) Simplified postfailure geometry and assumed final positions of the liquefied soil segments (slices 10-14 did not liquefy).
Statkn M
-l75 -150 -125 -100 I I I I
(a) ---P--------- =
LOriginaI ground surface Zone of liquefaction (Seed et al. 1989) - 300
, # . . . . . . . . . . . . . . . . . . . . . . . I I I I L I , ,
-600 -500 -400 -300 -200 -100 0 100 200 300 Station (ft)
shear stress may be considerably less than the liquefied shear strength (Fig. 4a). At the instant the failure mass co- mes to rest, the mobilized shear resistance decreases to that required for static stability, i.e., the driving shear stress ob- tained from the postfailure geometry (Fig. 4a).
The kinetics analysis used for this study was adapted from the procedure outlined by Davis et al. (1988), and is re- viewed briefly. This analysis is based on Newton's second law of motion, as follows:
where F are the forces acting on the moving mass (in vector form), m is the mass of the failed material (weight divided by acceleration due to gravity, g), and a is the acceleration of the center of gravity of the failed material. Referring to Fig. 4, the net force, CF, acting on the failure mass in the di- rection of the movement of the center of gravity is given by the driving weight of the failure mass minus the mobilized shear resistance of the soil, as follows:
[ I 31 5 = [(W sine) - (s,L)] = ma
where W is the weight of the failure mass, 8 is the angle be- tween the horizontal and the tangent to the curve describing
the movement of the sliding mass center of gravity (see Fig. 4), s, is the mobilized shear resistance, and L is the length of the failure surface. At the start of sliding, the weight term is larger than the shear strength term, and accel- eration is downslope. Near the end of sliding, the weight term is smaller than the shear strength term, and acceleration is upslope (thereby decelerating the mass; Figs. 4a and 4b).
Olson (2001) examined a limited number of well- documented flow failure case histories and found that most initial and final failure surfaces could be approximated using third-order polynomials. Therefore, the movement of the center of gravity of the sliding mass for the ten cases ana- lyzed using kinetics was assumed to follow a third-order polynomial. A third-order polynomial has the form
where a, b, c, and d are constants that can be calculated based on (i) the x and y coordinates of the initial and final positions of the center of gravity of the failure mass; and (i i) the curvature of the travel path of the center of gravity. This curvature was as- sumed to parallel the curvature of the final sliding surFace. Using the slope (dyldx) of the tangent to the curve described in eq. [14] at any point, the sine of the angle 8 is given by
O 2002 NRC Canada

Olson and Stark 635
Fig. 4. Freebody diagram used for kinetics analysis (top) and kinetics analysis for the North Dike of the Wachusett Dam (a-d).
Initial center ol gravity position 7
Direction of sliding
Sliding surface and path of center ol gravity
Final center of gravity position
(dl
- - P
-60 0 1 2 3 4 5 6 7 8 9
Time (s)
O 2002 NRC Canada

636 Can. Geotech. J . Vol. 39, 2002
where dy and dx are the vertical and horizontal displace- ments, respectively, of the center of gravity of the failure mass along the curve defined by eq. [14].
The acceleration of the failure mass center of gravity is estimated using the second derivative of the displacement, A, with respect to time, t, as
Substituting into eq. [I21 yields the following:
W d2A [17] [(W sine) - (suL)] = - -
g dt2
Equation [17] can be solved for displacement numerically or by direct integration. Olson (2001) employed a time-step nu- merical solution using a spreadsheet program. An initial value of liquefied shear strength is assumed, and eq. [17] is solved to estimate the total displacement and duration of movement. The assumed value of liquefied shear strength then is revised to obtain reasonable agreement with the ob- served displacement of the center of gravity of the failure mass. The approximate duration of sliding is only available for two cases, therefore agreement is based solely on center of gravity movement.
The kinetics analysis also should account for potential hydroplaning (slide material "riding" on a layer of water as flow occurs), mixing with water, and the increase in void ra- tio of the liquefied material if the failure mass slid into a body of water (Castro et al. 1992). To account for these po- tential effects, the shear strength mobilized along the failure surface in the body of water (beyond the original limits of the prefailure geometry) is assumed to be equal to 50% of the value of shear strength mobilized within the limits of the prefailure slope geometry. For each case, reduction factors of 0% and 100% also are used to ascertain the sensitivity of the liquefied shear strength to the effect of hydroplaning and to obtain a range of possible values of liquefied shear strength. The same reduction factors were used by Castro et al. (1992) to back-calculate the possible range of liquefied shear strength mobilized during the flow failure of LSFD.
The kinetics analysis also considers the change in weight of the failure mass if the mass slid into a body of water and the change in the length of the failure surface during flow. These changes during failure are incorporated into the soh- tion of eq. [I71 as a function of the distance traveled by the center of gravity of the failure mass with respect to its total distance of travel. Lastly, appropriate drained or undrained shear strengths of nonliquefied soils are incorporated after the solution of eq. [17] using the following adjustment to s,(LIQ):
where s, is determined by the solution of eq. [17], Ld is the percentage of the total length of the postfailure sliding sur- face that incorporates soils that did not liquefy, and sd is the average shear strength of the soils that did not liquefy. Values of sd are provided subsequently and Olson (2001) de- tails the assignment of shear strength to nonliquefied soils for each case history.
The kinetics analysis only provides the "best estimate" of su(LIQ). This value of su(LIQ) is divided by the weighted average prefailure ok, (eq. [ l I]) to obtain the "best estimate" of liquefied strength ratio. These values of liquefied shear strength and strength ratio are "best estimates" because they incorporate the kinetics of failure, potential hydroplaning and mixing effects, and the shear strength of nonliquefied soils.
Case histories of liquefaction flow failure
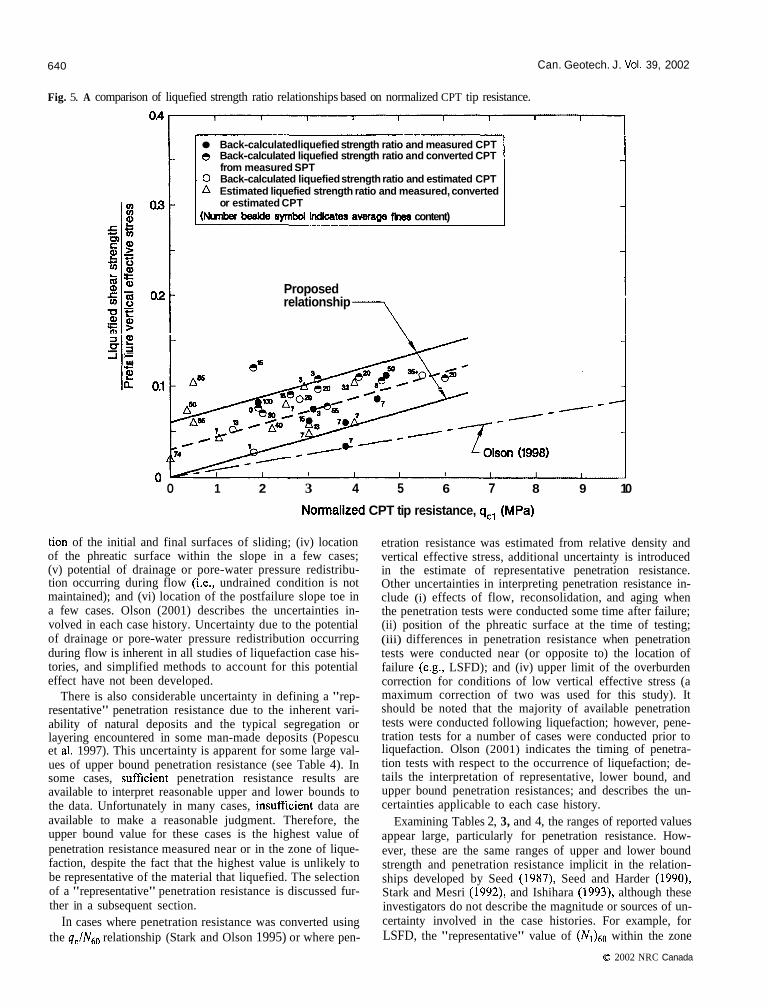
Olson (2001) collected 33 liquefaction flow failure case histories for which CPT or SPT results were available or could be reasonably estimated. Olson (2001) also described the available information, the analyses conducted, the evalua- tion of penetration resistance, and the uncertainties involved in each case history. The case histories and corresponding references are summarized in Table 1. The liquefied strength ratios back-calculated using the simplified or rigorous stabil- ity analysis and weighted average prefailure a:, are pre- sented in Table 2. Table 2 also includes values of liquefied shear strength back-calculated independently for each case. The back-calculation of these values will be discussed sub- sequently. For the ten cases with sufficient documentation to perform a kinetics analysis, the "best estimate" liquefied shear strength and strength ratios considering the kinetics of failure are presented in Table 3. As expected, the "best esti- mate" liquefied shear strengths and strength ratio values esti- mated from the kinetics analysis are greater than the values estimated from the rigorous stability analysis (Table 2). Ta- ble 3 also includes strengths of nonliquefied soils (sd) and the percentage of the postfailure sliding surface that incorpo- rates nonliquefied soils. Measured or estimated penetration resistances and selected soil properties available for the case histories are presented in Table 4. For cases where either CPT or SPT penetration alone was measured, the corre- sponding value of the other penetration resistance was esti- mated using the q,lN6, relationship presented by Stark and Olson (1995) and the median grain size of the liquefied soil. Other details and uncertainties regarding the penetration tests are discussed in the following section. Figure 5 pres- ents the "best estimate" liquefied strength ratios and mean q,, values for each of the cases. Figure 6 presents "best esti- mate" liquefied strength ratios and mean (N1)60 values. The numbers adjacent to each of the data points are the average fines content of the liquefied soil. The role of fines content will be discussed subsequently.
O 2002 NRC Canada
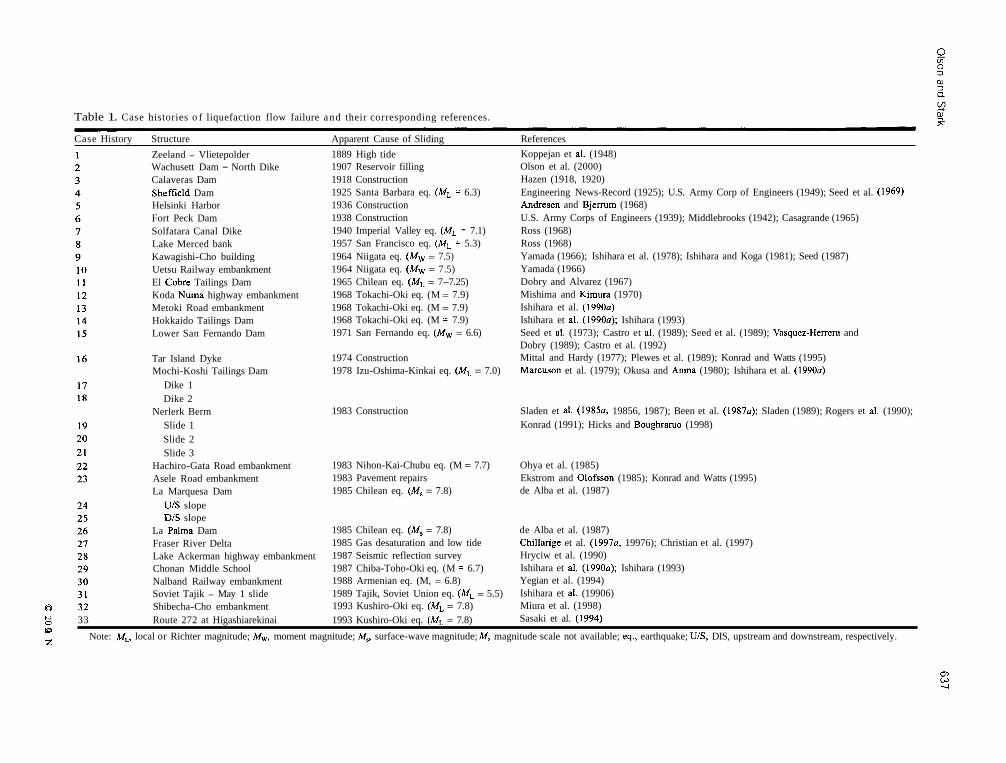
Table 1. Case histories o f liquefaction flow failure and their corresponding references.
Case History Structure Apparent Cause of Sliding References
Zeeland - Vlietepolder Wachusett Dam - North Dike Calaveras Dam Sheffield Dam Helsinki Harbor Fort Peck Dam Solfatara Canal Dike Lake Merced bank Kawagishi-Cho building Uetsu Railway embankment El Cobre Tailings Dam Koda Numa highway embankment Metoki Road embankment Hokkaido Tailings Dam Lower San Fernando Dam
Tar Island Dyke Mochi-Koshi Tailings Dam
Dike 1 Dike 2
Nerlerk Berm Slide 1 Slide 2 Slide 3
Hachiro-Gata Road embankment Asele Road embankment La Marquesa Dam
U/S slope DIS slope
La Palma Dam Fraser River Delta Lake Ackerman highway embankment Chonan Middle School Nalband Railway embankment Soviet Tajik - May 1 slide Shibecha-Cho embankment
1889 High tide 1907 Reservoir filling 191 8 Construction 1925 Santa Barbara eq. (ML = 6.3) 1936 Construction 1938 Construction 1940 Imperial Valley eq. (ML = 7.1) 1957 San Francisco eq. (ML = 5.3) 1964 Niigata eq. (Mw = 7.5) 1964 Niigata eq. (Mw = 7.5) 1965 Chilean eq. (ML = 7-7.25) 1968 Tokachi-Oki eq. (M = 7.9) 1968 Tokachi-Oki eq. (M = 7.9) 1968 Tokachi-Oki eq. (M = 7.9) 1971 San Fernando eq. (Mw = 6.6)
1974 Construction 1978 Izu-Oshima-Kinkai eq. (ML = 7.0)
1983 Construction
1983 Nihon-Kai-Chubu eq. (M = 7.7) 1983 Pavement repairs 1985 Chilean eq. (M, = 7.8)
1985 Chilean eq. (M, = 7.8) 1985 Gas desaturation and low tide 1987 Seismic reflection survey 1987 Chiba-Toho-Oki eq. (M = 6.7) 1988 Armenian eq. (M, = 6.8) 1989 Tajik, Soviet Union eq. (ML = 5.5) 1993 Kushiro-Oki eq. (ML = 7.8)
Koppejan et al. (1948) Olson et al. (2000) Hazen (1918, 1920) Engineering News-Record (1925); U.S. Army Corp of Engineers (1949); Seed et al. (1969) Andresen and Bjermm (1968) U.S. Army Corps of Engineers (1939); Middlebrooks (1942); Casagrande (1965) Ross (1968) Ross (1968) Yamada (1966); Ishihara et al. (1978); Ishihara and Koga (1981); Seed (1987) Yamada (1966) Dobry and Alvarez (1967) Mishima and Kimura (1970) Ishihara et al. (1990~) Ishihara et al. (1990~); Ishihara (1993) Seed et al. (1973); Castro et al. (1989); Seed et al. (1989); Vasquez-Herrera and Dobry (1989); Castro et al. (1992) Mittal and Hardy (1977); Plewes et al. (1989); Konrad and Watts (1995) Marcuson et al. (1979); Okusa and Anma (1980); Ishihara et al. (1990~)
Sladen et al. (1985a, 19856, 1987); Been et al. (1987~); Sladen (1989); Rogers et al. (1990); Konrad (1991); Hicks and Boughramo (1998)
Ohya et al. (1985) Ekstrom and Olofsson (1985); Konrad and Watts (1995) de Alba et al. (1987)
de Alba et al. (1987) Chillarige et al. (1997a, 19976); Christian et al. (1997) Hryciw et al. (1990) Ishihara et al. (1990~); Ishihara (1993) Yegian et al. (1994) Ishihara et al. (19906) Miura et al. (1998) Sasaki et al. (1994) Ng 33 Route 272 at Higashiarekinai 1993 Kushiro-Oki eq. (ML = 7.8) . .
0 N
2: Note: M,, local or Richter magnitude; M,, moment magnitude; M,, surface-wave magnitude; M, magnitude scale not available; eq., earthquake; U/S, DIS, upstream and downstream, respectively.
638 Can. Geotech. J. Vol. 39, 2002
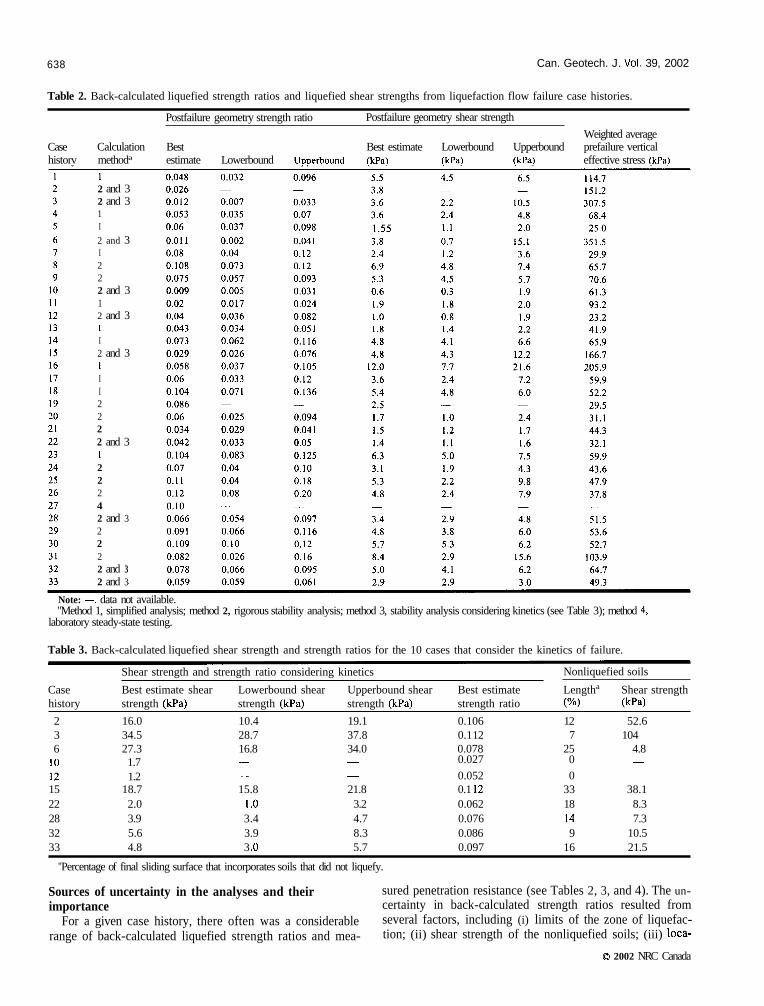
Table 2. Back-calculated liquefied strength ratios and liquefied shear strengths from liquefaction flow failure case histories.
Postfailure geometry strength ratio Postfailure geometry shear strength
Weighted average Case Calculation Best Best estimate Lowerbound Upperbound prefailure vertical historv methoda estimate Lowerbound U~~erbound IkPa) fkF'a) M a ) effective stress fkPa)
1 2 and 3 2 and 3 1 I 2 and 3 I 2 2 2 and 3 1 2 and 3 1 I 2 and 3 1 I I 2 2 2 2 and 3 1 2 2 2 4 2 and 3 2 2 2 2 and 3 2 and 3
Note: -, data not available. "Method 1, simplified analysis; method 2, rigorous stability analysis; method 3, stability analysis considering kinetics (see Table 3); method 4,
laboratory steady-state testing.
Table 3. Back-calculated liquefied shear strength and strength ratios for the 10 cases that consider the kinetics of failure.
Shear strength and strength ratio considering kinetics Nonliquefied soils
Case Best estimate shear Lowerbound shear Upperbound shear Best estimate Lengtha Shear strength history strength ( P a ) strength (kPa) strength (kPa) strength ratio w) (kpa)
2 16.0 10.4 19.1 0.106 12 52.6 3 34.5 28.7 37.8 0.1 12 7 104 6 27.3 16.8 34.0 0.078 25 4.8
10 1.7 - - 0.027 0 -
12 1.2 - - 0.052 0 -
15 18.7 15.8 21.8 0.1 12 33 38.1 22 2.0 1 .O 3.2 0.062 18 8.3 28 3.9 3.4 4.7 0.076 14 7.3 32 5.6 3.9 8.3 0.086 9 10.5 33 4.8 3 .O 5.7 0.097 16 21.5
"Percentage of final sliding surface that incorporates soils that did not liquefy.
Sources of uncertainty in the analyses and their sured penetration resistance (see Tables 2, 3, and 4). The un- importance certainty in back-calculated strength ratios resulted from
For a given case history, there often was a considerable several factors, including (i) limits of the zone of liquefac- range of back-calculated liquefied strength ratios and mea- tion; (ii) shear strength of the nonliquefied soils; (iii) loca-
O 2002 NRC Canada

Table 4. Measured a n d es t imated penetration resistances for t he l iquefaction f low failure case histories. Q cn 0 3
Normalized Penetration Resistance Soil grain properties a, 3
Lowerbound Upperbound Stark and a Case Available Mean qcl Lowerbound Upperbound Mean (N1)60 (N1)60 (Nl)60 Reported Approximate Olson (1995) $2 histoly dataa (MPa) 4cl (MPa) qcl (MPa) (blows10.3 m) (blowsl0.3 m) (blows10.3 m) DR (%) Ap~mximate D50 (mm) F C ~ (%) 4clN60 $
1 CPT 3.0 1.7 4.4 7.5 4.2 10.9 - 0.12 3-1 1 0.4 2 SPT 4.6 2.6 6.5 7 4 10 - 0.42 5-10 0.65
3 D~ 5.5 1 6 8 2 12 20-50 - 10 to >60 -0.5 4 D~ 2.2 1.8 2.6 5 4 6 20-40 0.10 33-48 0.35 5 Est. 4 .0 - - - - - - 6 -40 -0.5
6 SPT 3.4 1.6 5.6 8.5 4 14 40-50 0.06-0.2 -55 0.3-0.5 7 D~ 2.5 - - 4 - - -32 0.17 6-8 0.47 8 DR; SPT 3.2 3 6.2 7.5 6.5 12.3 -40 0.2 1 (0.18-0.25) 1-4 0.5 (0.48-0.55) 9 CPT; SPT 3.1 1.7 3.8 4.4 3.7 5.6 -40-50 0.35 <5 0.59
10 Est. 1.8 - 3 - - - 0.3-0.4 0-2 0.6 (0.57-0.62) 11 SPT 0 - - - - - 0 0.08 to ?? 55-93 0.3 to ??
(desiccated to NC tailings) I2 Est. 1.35 - - - - - 3 0.15 to 0.20 -13 -0.45 13 Est.' 1.05 0.9 1.2 2.6 2.3 3 - silty sand -0.4
14 CPT 0.36 0.35 0.38 1.1 I 1.2 - -0.074 -50 -0.32
sandy silt - silty sand 15 CPT; SPT 4.7 2.1 6.2 11.5 5 15 -48 (dk) -0.074 (0.02-0.3) -50 (5-90) -0.32 16 CPT; SPT 3.0 2 4 7 4 15 -30-40 -0.15 -10-15 -0.45 17 CPT; SPT 0.5 0.25 1 2.7 0 6 0.04 85 0.28 -
18 CPT; SPT 0.5 0.25 1 2.7 0 6 0.04 85 0.28 -
19 CPT 4.5 2.6 7.8 8.7 5 15 -30-50 0.22 2-12 0.52 20 CPT 3.8 1.9 8.0 7.2 3.6 15.3 -30-50 0.22 2-12 0.52 21 CPT 3.8 1.9 8.0 7.2 3.6 15.3 -30-50 0.22 2-12 0.52 22 CPT; SPT 3.0 1.1 4.9 4.4 3.1 5.8 0.2 10-20 0.5 -
23 SPT 4.0 3.4 4.6 7 6 8 - 0.3 (0.15-0.55) 32 (23-38) 0.57 24 SPT 2.0 1.8 2.3 4.5 4 5 - -0.15 -30 -0.45
25 SPT 4.1 3.2 5 9 7 I I - -0.15 -20 -0.45
26 SPT 1.8 1 .O 2.5 3.5 2 5 - -0.2 -15 -0.5
27 CPT 2.9 1.3 4.5 5.3 2.4 8.2 -25 to 5 0.25 0-5 0.55 28 SPT 1.9 0.6 4.4 3 1 7 -0 0.4 0 0.63 29 SPT 2.6 1.8 4.4 5.2 2.6 9 -0.2 18 -0.5 -
30 SPT 6.0 2.3 8.1 9.2d 3.6d 1 2 . 4 ~ - -1.5 -20 0.65e 3 1 CPT 1.9 1.1 2.4 7.6 4.4 9.6 - 0.012 100 0.25
32 st.' 2.8 1.5 5.4 5.6 2.9 10.7 - 0.2 (0.12-0.4) 20 (12-35) 0.5 33 SPT 3.2 1.2 5.0 6.3 2.4 10 - - 0 . 2 ~ 2of -0.5
"CPT, measured cone penetration resistance; SPT, measured standard penetration resistance; D,, relative density; Est., estimated. b ~ C , fines content. 'Values of SPT and CPT penetration resistance were estimated from measured Swedish cone penetration test results. *Values of N,, were corrected for gravel content as described in Terzaghi et al. (1996). 'q,IN,, determined from data presented by Yegian et al. (1994); D,, is outside range reported by Stark and Olson (1995).
8 'Values of D,, and FC were estimated from same parent soil deposit described in Miura et al. (1998). N
640 Can. Geotech. J. Vol. 39, 2002
Fig. 5. A comparison of liquefied strength ratio relationships based on normalized CPT tip resistance.
Back-calculated liquefied strength ratio and measured CPT Back-calculated liquefied strength ratio and converted CPT from measured SPT
0 Back-calculated liquefied strength ratio and estimated CPT Estimated liquefied strength ratio and measured, converted or estimated CPT
(Nunber bedfie mbd lndlcates averam flnea content)
Proposed relationship
al - L - 3 - .- a(
-
0 1 2 3 4 5 6 7 8 9 10
Normalized CPT tip resistance, q,, (MPa)
tion of the initial and final surfaces of sliding; (iv) location of the phreatic surface within the slope in a few cases; (v) potential of drainage or pore-water pressure redistribu- tion occurring during flow (i.e., undrained condition is not maintained); and (vi) location of the postfailure slope toe in a few cases. Olson (2001) describes the uncertainties in- volved in each case history. Uncertainty due to the potential of drainage or pore-water pressure redistribution occurring during flow is inherent in all studies of liquefaction case his- tories, and simplified methods to account for this potential effect have not been developed.
There is also considerable uncertainty in defining a "rep- resentative" penetration resistance due to the inherent vari- ability of natural deposits and the typical segregation or layering encountered in some man-made deposits (Popescu et al. 1997). This uncertainty is apparent for some large val- ues of upper bound penetration resistance (see Table 4). In some cases, sufficient penetration resistance results are available to interpret reasonable upper and lower bounds to the data. Unfortunately in many cases, insufficient data are available to make a reasonable judgment. Therefore, the upper bound value for these cases is the highest value of penetration resistance measured near or in the zone of lique- faction, despite the fact that the highest value is unlikely to be representative of the material that liquefied. The selection of a "representative" penetration resistance is discussed fur- ther in a subsequent section.
In cases where penetration resistance was converted using the q,/Nbo relationship (Stark and Olson 1995) or where pen-
etration resistance was estimated from relative density and vertical effective stress, additional uncertainty is introduced in the estimate of representative penetration resistance. Other uncertainties in interpreting penetration resistance in- clude (i) effects of flow, reconsolidation, and aging when the penetration tests were conducted some time after failure; (ii) position of the phreatic surface at the time of testing; (iii) differences in penetration resistance when penetration tests were conducted near (or opposite to) the location of failure (e.g., LSFD); and (iv) upper limit of the overburden correction for conditions of low vertical effective stress (a maximum correction of two was used for this study). It should be noted that the majority of available penetration tests were conducted following liquefaction; however, pene- tration tests for a number of cases were conducted prior to liquefaction. Olson (2001) indicates the timing of penetra- tion tests with respect to the occurrence of liquefaction; de- tails the interpretation of representative, lower bound, and upper bound penetration resistances; and describes the un- certainties applicable to each case history.
Examining Tables 2, 3, and 4, the ranges of reported values appear large, particularly for penetration resistance. How- ever, these are the same ranges of upper and lower bound strength and penetration resistance implicit in the relation- ships developed by Seed (1987), Seed and Harder (1990), Stark and Mesri (1992), and Ishihara (1993), although these investigators do not describe the magnitude or sources of un- certainty involved in the case histories. For example, for LSFD, the "representative" value of (N1)(jO within the zone
O 2002 NRC Canada

Olson and Stark
Fig. 6. A comparison of liquefied strength ratio relationships based on normalized SPT blowcount.
6 8 10 12
Normalized SPT blowcount (N1)60
0.4 0 Back-calculated liquefied strength ratio and measured SPT 0 Back-calculated liquefied strength ratio and converted SPT
from measured CPT 0 Back-calculated liquefied strength ratio and estimated SPT A Estimated liquefied strength ratio and measured, converted
or estimated SPT
0.3 - (Number beside symbol indicates average fines content) A //
fn fn / / E Y
Stark and Mesri (1992) fn
2 - .- C
$ % z 0 2 - 0 .- t: (D Proposed relationship > 2 - a - .- crl C
2 Q
of hydraulic fill that likely liquefied has been reported as 15 by Seed (1987), 5.5 by Davis et al. (1988), 11.5 by Seed et al. (1989) and Seed and Harder (1990), 12 (with a range of 9-15) by Jefferies et al. (1990), 7 (with a minimum repre- sentative value of 4) by McRoberts and Sladen (1992), and 8.5 by Poulos (1988) and Castro (1995). These "representa- tive" values vary from 4 to 15; a considerable range in itself. In the downstream shell of the dam, the actual measured val- ues of (N1),O ranged fiom 6 to over 40. Correcting these val- ues to correspond to the upstream slope (Seed et al. 1989), the (N,),, values are approximately 3 to 37.
The true range of (N,),, values (fiom 3 to 37) for LSFD is not shown in existing relationships between liquefied shear strength or strength ratio and (N1),O because this range would plot off the chart. Individual investigators determined mean and (or) median values of (N,),, within the zone of liquefaction and used engineering judgment to evaluate if these values were "representative" of the hydraulic fill that liquefied and led to the observed failure. Large (N1)60 values (probably above 15-20) are likely too dense to be contrac- Gve under the effective stresses present in the upstream slope of LSFD, and are therefore too large to be representative. Small (N1),O values (probably less than about 6) are some- what anomalous and probably do not represent the overall density of the hydraulic fill. Therefore, mean, median, or values of (N,),, based on judgment are reported in the litera- ture and used in existing relationships between liquefied shear strength or strength ratio and penetration resistance.
taken as the mean values. So that the actual ranges can be examined, Table 4 includes upper and lower bound values of penetration resistance. As previously mentioned, sufficient penetration resistance results are available for some cases to interpret reasonable upper and lower bounds to the data. However, in many cases, insufficient data are available to make a reasonable judgment. For these cases, the upper bound is the maximum value of penetration resistance mea- sured near or in the zone of liquefaction, despite the fact that the highest value is very unlikely to be representative of the material that liquefied.
Interpretation and discussion
Despite the uncertainties for each case, a reasonable trend in the data is apparent, particularly for the cases where the most information is available (cases plotted with a solid, half-solid, or open circle in Figs. 5 and 6). Upper bound, lower bound, and average trendlines are proposed in Figs. 5 and 6. The average trendlines are linear regressions of the data excluding the cases where only the simplified analysis was conducted (cases plotted as triangles in Figs. 5 and 6). The average trendlines are described as
for q,, 5 6.5 MPa In this study, "representative" values of q,, and (N1)(jO are
O 2002 NRC Canada

Can. Geotech. J . Vol. 39, 2002
Su(L'Q) - 0.03 + 0.0075[(N,),,] + 0.03 [19b] o;,
for (N,) 5 12
The upper and lower trendlines in Figs. 5 and 6 approxi- mately correspond to plus and minus one standard deviation (the standard deviation for both trendlines was *0.025).
Included in Fig. 5 is the design line presented by Olson (1998). The Olson (1998) design line is conservative for all values of q,,. Included in Fig. 6 are the boundaries for lique- fied strength ratio proposed by Stark and Mesri (1992) and the design lines proposed by Stark and Mesri (1992) in eq. [9] and Davies and Campanella (1994). The data in Fig. 6 show considerably less scatter compared to the bounds pre- sented by Stark and Mesri (1992) as a result of the improved analyses conducted in this study. The design line proposed by Stark and Mesri (1992) in eq. [9] is conservative for all values of (N1),@ while that proposed by Davies and Campanella (1994) is unconservative for (N& values greater than 8. It should be noted that part of the conserva- tism of the Olson (1998) and Stark and Mesri (1992) design lines results from incorporating a fines content adjustment, while data in Figs. 5 and 6 are plotted without any adjust- ment for fines content.
Back-calculation of liquefied shear strength To evaluate the correlation between liquefied shear strength
and prefailure vertical effective stress, "single values" of liq- uefied shear strength also were back-calculated from the case histories. As suggested by Seed (1987) and Seed and Harder (1990), "single values" of su(LIQ) were evaluated from a static slope stability analysis of the postfailure geom- etry using Spencer's (1967) method as coded in the com- puter program UTEXAS3 (Wright 1992). The "single value" of su(LIQ) was varied until a factor of safety of unity was achieved. Appropriate drained or undrained shear strengths were assigned to nonliquefied soils. As previously men- tioned, ten cases had sufficient documentation to perform a kinetics analysis of the failure. This analysis also estimated su(LIQ). Values of su(LIQ) back-calculated using the simpli- fied and static stability analyses are presented in Table 2, while values incorporating kinetics are found in Table 3. Olson (2001) details the individual case history analyses.
Figure 7 presents the "single values" of su(LIQ) (from Ta- bles 2 and 3) and weighted average prefailure o;, (eq. [3] and Table 2). Despite differences in density, mode of deposition, grain size distribution, grain shape, state parameter, modes of shear, and steady-state friction angle of the liquefied soils, the data in Fig. 7 illustrate that an approximately linear relationship exists between s,(LIQ) and weighted average prefailure o;, for liquefaction flow failures. The relationship ranges from approx- imately su(LIQ) = 0.05 to 0 . 1 2 ~ ; ~ with an average value (from linear regression) of 0 . 0 9 0 ~ ~ . As illustrated in Figs. 5 and 6, the variation in s,(LIQ)/o;, from 0.05 to 0.12 is explained in terms of increasing normalized penetration resistance.
Baziar and Dobry (1995) also presented bounding rela- tionships between liquefied shear strength and prefailure vertical effective stress as shown in Fig. 7. With the excep- tion of LSFD, Baziar and Dobry (1995) used the values of su(LIQ) and prefailure o;, presented by Stark and Mesri (1992) to develop these boundaries. As discussed previously,
Fig. 7. An evaluation of the strength ratio concept using lique- faction flow failure case histories.
Liquefied Shear strength, S,(LIQ) (kPa) 0 10 20 30 40 50 60
the improved analysis procedures of this study yielded different values of su(LIQ) and prefailure o;, than those re- ported by Stark and Mesri (1992). Figure 7 illustrates that this re-evaluation of case histories results in considerably less scatter between the upper and lower bound relationships of su(LIQ) and prefailure o;,. In summary, the case history data presented in Fig. 7 confirm laboratory data that indicate a linear relationship between liquefied shear strength and initial vertical effective stress (e.g., Fig. 1 from Baziar and Dobry 1995; Ishihara 1993).
Effect of fines content on liquefied shear strength and strength ratio
Previous case history studies (Seed and Harder 1990; Stark and Mesri 1992) incorporated fines content adjustments to generate an "equivalent clean sand" blowcount and to evalu- ate the liquefied shear strength or strength ratio. The purpose of the adjustment is to increase the penetration resistance of silty sands to that exhibited by clean sands with identical rel- ative densities. The reason for this difference in penetration resistance is, in part, related to differences in soil compress- ibility (Been et al. 1987b).
No fines content adjustment was adopted in this study. In Figs. 5 and 6, the fines content of the liquefied soil is pro- vided next to each data point. The data reveal no trend in liquefied strength ratio with respect to fines content. The au- thors anticipate that although soils with higher fines contents should exhibit lower values of penetration resistance (as a result of greater soil compressibility and smaller hydraulic conductivity), these soils are more likely to maintain an un-
0 2002 NRC Canada

Olson and Stark
drained condition during flow. The combination of these factors may, in effect, offset each other, resulting in no ap- parent difference in values of liquefied strength ratio for cases of clean sands and sands with higher fines contents. Therefore, this study recommends no fines content adjust- ment for estimating liquefied strength ratio from the proposed relationships.
Effect of kinetics on liquefied shear strength and strength ratio
The ten cases that explicitly consider the kinetics of failure (Table 3) provide the "best estimates" of liquefied strength ra- tio because the kinetics analysis accounts for the momentum of the failure mass in the back-calculation of s,(LIQ). How- ever, in cases where the center of gravity of the failure mass did not move a considerable vertical distance, the effect of kinetics was unclear and thus investigated.
The effect of kinetics on the liquefied shear strength was examined with respect to (i) the loss of potential energy of the failure mass as a result of sliding; and (ii) the prefailure height of the embankment or slope. The loss of potential en- ergy was calculated as the average weight of the failure mass (from the pre- and post-failure geometry) multiplied by the change in vertical position of the centroid of the failure mass as a result of sliding. The effect of kinetics on the back- calculated s,(LIQ) was examined in terms of the difference in liquefied shear strength considering kinetics [s,(LIQ, Kinet- ics)] minus the liquefied shear strength not considering kinet- ics [s,(LIQ)]. As illustrated in Fig. 8a, the effect of kinetics on the back-calculation of liquefied shear strength is not sig- nificant unless the loss of potential energy of the failure mass is greater than approximately lo3 to lo4 kJ/m. Considering this issue in a simpler manner, Fig. 8b illustrates the effect of the prefailure height of the embankmentklope on the back- calculated liquefied shear strength. As shown in Fig. 8b, ki- netics has a minor effect on the liquefied shear strength for embankments/slopes less than about 10 m in height. Only 1 of the 23 case histories where a kinetics analysis was not con- ducted involves a slope with a height greater than 10 m. Therefore, liquefied strength ratios back-calculated for the other 22 cases using the simplified or rigorous stability analy- ses also represent "best estimates." Further, for design and remediation, kinetics does not appear to play a significant role in embankments/slopes that are less than 10 m in height.
Effect of penetration resistance on liquefied strength ratio As noted previously, mean values of penetration resistance
are plotted in Figs. 5 and 6. However, most failures occur through the weakest zones of soil, not through the mean value zones. Popescu et al. (1997, 1998) showed that pore- water pressure buildup during seismic shaking is bracketed when soil properties are estimated from penetration resis- tance values between the median (50th percentile) and 20th percentile. (In their nomenclature, this is the 80th percen- tile.) Therefore, it may be more appropriate to use the mini- mum or 20th percentile values of normalized penetration resistance (Popescu et al. 1997, 1998; Yoshimine et al. 1999) to develop the relationships proposed in Figs. 5 and 6. Un- fortunately, in most flowfailure case histories there are in- sufficient penetration test results available to reasonably estimate a 20th (or other) percentile value of penetration re-
sistance. Therefore, mean values of penetration resistance were used in this study.
When assessing liquefaction triggering and post-triggering stability in practice, minimum values of penetration resis- tance often are used with empirical relationships. If a mini- mum value of penetration resistance is used in conjunction with the relationships proposed in Figs. 5 and 6, an engineer may consider selecting a liquefied strength ratio greater than the value corresponding to the average relationship. In a small parametric study of three existing (unfailed) dams, the authors found that using the mean penetration resistance with the average relationships in Figs. 5 and 6 provided nearly the same liquefied strength ratios as using the mini- mum penetration resistance with the upperbound relation- ships in Figs. 5 and 6. In addition, because the upper- and lower-bounds of the relationships proposed in Figs. 5 and 6 correspond approximately to plus and minus one standard deviation, the desired level of conservatism can be used to estimate the liquefied strength ratio.
Applications of liquefied strength ratio
The liquefied strength ratio allows the variation in lique- fied shear strength throughout a zone of liquefied soil to be incorporated in a post-triggering stability analysis. Increases in s,(LIQ) can be the result of increases in prefailure vertical effective stress, increases in normalized penetration resis- tance, or both. To incorporate a strength ratio in a stability analysis, a liquefied soil layer can be separated into a num- ber of sublayers of equal o;, (stress contours) and (or) equal penetration resistance (penetration contours). For example, each vertical effective stress contour would have an equal value of s,(LIQ), and s,(LIQ) would increase as the o;, con- tours increased.
Additionally, liquefied strength ratios can be used to facil- itate remediation studies. Two common remediation tech- niques for seismic dam stability are the use of stabilizing berms and soil densification. If a stabilizing berm is added, new o;, contours can be developed to estimate the liquefied shear strength for various berm heights. The increase in ver- tical effective stress caused by the weight of the stabilizing berm decreases the void ratio of the liquefiable material and results in an increase in s,(LIQ). If soil densification is used, penetration tests typically are conducted to verify the suc- cess of the densification effort. These additional penetration tests can be used to revise the liquefied strength ratio, and thus revise values of s,(LIQ). Densification often increases the horizontal effective stress, a;, (and thus penetration resistance), without significantly increasing the vertical ef- fective stress. However, the increase in oi, caused by densification should decrease the void ratio of the treated material and result in an increase in s,(LIQ).
On high-risk projects, the compressibility of the liquefiable soil should be compared to the slope of the steady-state line to confirm the applicability of the strength ratio concept. If the compressibility of the soil is not found to be reasonably paral- lel to the slope of the SSL, at least over the range of effective stresses of interest, the strength ratio concept may not be appli- cable for the particular soil. If the compressibility is signifi- cantly smaller than the slope of the SSL, the strength ratio will lead to unconservative estimates of s,,(LIQ). Engineers should
O 2002 NRC Canada

644 Can. Geotech. J. Vol. 39, 2002
Fig. 8. The difference in back-calculated shear strength considering and not considering kinetics compared to (a) loss of potential energy resulting from flow failure; and (b) prefailure height of the embankment.
Potential energy loss (kJ1m)
O 2002 NRC Canada
35 -
3 30 ax u
(b)
.
c i 2 - a w=' 20
Label WD CD FPD ULR KN LSFD HG LA SC R272
Case history CD North Dike of Wachusett Dam Calveras Dam
/ Fort Peck Dam Uetsu-Line Railway Embankment Koda Numa Highway Embankment Lower San Fernando Dam F P D / Hachiro-Gata Road Embankment Maximum Lake Ackerman Hi hway Embankment strength Shibecha-Cho ~mzankment difference - Route 272 Highway Embankment Y3 1
= G 5 2 g'z 25 . 2 .E 4 4 %
i V
=' rn - 5
0 . KN m
1 10 100 Height of embankment (m)
be particularly wary of this potential for remediation projects be susceptible to flow failure, the assumption of parallel con- involving large berms. However, as discussed above and solidation and steady-state lines may be reasonable, particularly shown by Olson (2001), generally, if a soil is loose enough to for soils with greater than 12% fines content.

Olson and Stark 645
Conclusions
This paper evaluates 33 liquefaction flow failure case histo- ries using a stability analysis specifically developed to back- calculate the liquefied strength ratio. This improved ap- proach allows the entire range of vertical effective stress act- ing on the liquefied material prior to failure to be considered in the back-calculation of the liquefied strength ratio, rather than using a single "representative" value of prefailure verti- cal effective stress. In addition, analyses that incorporate the kinetics of failure are conducted to obtain the "best esti- mate" of liquefied strength ratio. These analyses show that the effect of kinetics on the back-calculation of liquefied strength ratio is important for embankments/slopes greater than 10 m in height.
The factors contributing to the uncertainty of both the back-calculation of liquefied strength ratio and normalized penetration resistance are discussed. Despite these uncertain- ties, there are clear trends of increasing liquefied strength ra- tio with increasing normalized standard and cone penetration resistance.
The resulting relationships between liquefied strength ra- tio and penetration resistance exhibit considerably less scat- ter than relationships previously proposed (e.g., Stark and Mesri 1992). The average trendlines presented in Figs. 5 and 6 (or eqs. [19a] and [19b]) can be used to estimate the lique- fied shear strength ratio from CPT or SPT normalized pene- tration resistance, respectively. The average trendlines are described as
for qcl 5 6.5 MPa
and
Su(LIQ) = 0.03 + 0.0075[(N,),,] f 0.03 0 :o
for (N1)60 5 12
The CPT-based relationship is preferred for design because of the fundamental advantages of the CPT over the SPT in most liquefaction problems (see Stark and Olson 1995). These relationships provide values of liquefied strength ra- tios that are greater than previously proposed and can be used in post-triggering stability analyses to assess the poten- tial for flow failure. By using a liquefied strength ratio, rather than a representative value of liquefied shear strength, the increase in liquefied shear strength with vertical effective stress can be incorporated in a post-triggering stability anal- ysis and evaluation of remedial measures. Applications for utilizing a liquefied strength ratio are presented.
Acknowledgments
This study was funded by the National Science Founda- tion (NSF), Grant Number 97-01785, as part of the Mid- America Earthquake (MAE) Center headquartered at the University of Illinois at Urbana-Champaign. This support is gratefully acknowledged. The authors would also like to thank Gholemreza Mesri, Youssef Hashash, Steven L.
Kramer, and David R. Gillette for their discussions on this topic and their review of this manuscript.
References
Andresen, A., and Bjermm, L. 1968. Slides in subaqueous slopes in loose sand and sil. Norwegian Geotechnical Institute Publica- tion No. 81, pp. 1-9.
Baziar, M.H., and Dobry, R. 1995. Residual strength and large- deformation potential of loose silty sands. Journal of Geotechnical Engineering, ASCE, 121(12): 896-906.
Been, K., and Jefferies, M.G. 1985. A state parameter for sands. Geotechnique, 35(2): 99-1 12.
Been, K., Conlin, B.H., Crooks, J.H.A., Fitzpatrick, S.W., Jefferies, M.G., Rogers, B.T., and Shinde, S. 1987a. Back analysis of the Nerlerk berm liquefaction slides: Discussion. Canadian Geo- technical Journal, 24: 170-1 79.
Been, K., Jefferies, M.G., Crooks, J.H.A., and Rothenburg, L. 1987b. The cone penetration test in sands: part 11, general inference of state. GCotechnique, 37(3): 285-299.
Casagrande, A. 1940. Characteristics of cohesionless soils affect- ing the stability of slopes and earth fills. In Contributions to Soil Mechanics, 1925-1940, Boston Society of Civil Engineers, Oc- tober, (Originally published in the Journal of the Boston Society of Civil Engineers, January, 1936), pp. 257-276.
Casagrande, A. 1965. Second Terzaghi lecture: role of the "calcu- lated risk" in earthwork and foundation engineering. Journal of the Soil Mechanics and Foundations Division, ASCE, 91(SM4): 1-40,
Castro, G. 1995. Empirical methods in liquefaction evaluation. In Proceedings of the 1st Annual Leonardo Zeevaert International Conference. Vol. 1, pp. 1-41,
Castro, G., Keller, T.O., and Boynton, S.S. 1989. Re-evaluation of the Lower San Fernando Dam: Report 1, an investigation of the February 9, 1971 slide. US. Army Corps of Engineers Contract Report GL-89-2, Volumes 1 and 2. U.S. Army Corps of Engi- neers Waterways Experiment Station, Vicksburg, Mississippi.
Castro, G., Seed, R.B., Keller, T.O., and Seed, H.B. 1992. Steady- state strength analysis of Lower San Fernando Dam slide. Jour- nal of Geotechnical Engineering, ASCE, 118(3): 406427.
Chillarige, A.V., Robertson, P.K., Morgenstern, N.R., Christian, H.A. 1997a. Evaluation of the in situ state of Fraser River sand. Canadian Geotechnical Journal, 34: 5 10-5 19.
Chillarige, A.V., Morgenstem, N.R., Robertson, P.K., and Christian, H.A. 19976. Seabed instability due to flow liquefaction in the Fraser River delta. Canadian Geotechnical Journal, 34: 52C533.
Christian, H.A., Woeller, D.J., Robertson, P.K., and Courtney, R.C. 1997. Site investigation to evaluate flow liquefaction slides at Sand Heads, Fraser River delta. Canadian Geotechnical Journal, 34: 384397.
Cunning, J.C. 1994. Shear wave velocity measurements of co- hesionless soils for evaluation of in situ state. M.Sc. thesis, De- partment of Civil Engineering, University of Alberta, Edmonton.
Davies, M.P., and Campanella, R.G. 1994. Selecting design values of undrained strength for cohesionless soils. In Proceedings of the 47th Canadian Geotechnical Conference, Halifax, Nova Sco- tia, September 1994, BiTech Publishers. Vol. 1, pp. 176-186.
Davis, A.P., Jr., Poulos, S.J., and Castro, G. 1988. Strengths back- figured from liquefaction case histories. In Proceedings of the 2nd International Conference on Case Histories in Geotechnical Engineering, 1-5 June, St. Louis, MO, pp. 1693-1701.
de Alba, P., Seed, H.B., Retamal, E., and Seed, R.B. 1987. Resid- ual strength of sand from dam failures in the Chilean earthquake
O 2002 NRC Canada

Olson and Stark
Olson, S.M., Stark, T.D., Walton, W.H., and Castro, G. 2000. 1907 Static liquefaction flow failure of the North Dike of Wachusett Dam. Journal of Geotechnical and Geoenvironmental Engi- neering, ASCE, 126(12): 1184-1 193.
Pillai, V.S., and Salgado, F.M. 1994. Post-liquefaction stability and deformation analysis of Duncan Dam. Canadian Geotechnical Journal, 31: 967-978.
Plewes, H.D., O'Neil, G.D., McRoberts, E.C., and Chan, W.K. 1989. Liquefaction considerations for Suncor tailings pond. In Proceedings of the Dam Safety Seminar, Edmonton, Alberta, Sept., Vol. 1, pp. 61-89.
Popescu, R., Prevost, J.H., and Deodatis, G. 1997. Effects of spa- tial variability on soil liquefaction: some design recommenda- tions. Geotechnique, 47(5): 1019-1036.
Popescu, R., Prevost, J.H., and Deodatis, G. 1998. Characteristic percentile of soil strength for dynamic analysis. In Specialty Conference on Geotechnical Earthquake Engineering and Soil Dynamics 111, Seattle. American Society of Civil Engineers, Geotechnical Special Publication No. 75, Vol. 2, 146 1-147 1.
Poulos, S.J. 1988. Liquefaction and related phenomena. In Ad- vanced dam engineering for design, construction, and rehabilita- tion, Van Nostrand Reinhold, New York.
Poulos, S.J., Castro, G., and France, W. 1985. Liquefaction evalua- tion procedure. Journal of Geotechnical Engineering Division, ASCE, 1 ll(6): 772-792.
Rogers, B.T., Been, K., Hardy, M.D., Johnson, G.J., and Hachey, J.E. 1990. Re-analysis of Nerlerk B-67 berm failures. In Proceed- ings of the 43rd Canadian Geotechnical Conference - Prediction of Performance in GCotechnique, Quebec, Canada, Vol. 1, pp. 227-237.
Ross, G.A. 1968. Case studies of soil stability problems resulting from earthquakes. Ph.D. thesis, University of California, Berke- ley, Calif.
Seed, H.B. 1987. Design problems in soil liquefaction. Journal of Geotechnical Engineering Division, ASCE, 113(8): 827-845.
Seed, H.B., Lee, K.L., and Idriss, I.M. 1969. Analysis of Shefield Dam failure. Journal of the Soil Mechanics and Foundations Di- vision, ASCE, 95(SM6): 1453-1490.
Seed, H.B., Lee, K.L., Idriss, I.M., and Makdisi, F. 1973. Analysis of the slides in the San Fernando Dams during the earthquake of Feb. 9, 1971. Earthquake Engineering Research Center Report No. EERC 73-2, University of California, Berkeley, Calif.
Seed, H.B., Seed, R.B., Harder, L.F., and Jong, H.-L. 1989. Re- evaluation of the Lower San Fernando Dam: Report 2, examina- tion of the post-earthquake slide of February 9, 1971. US . Army Corps of Engineers Contract Report GL-89-2, U S . A m y Corps of Engineers Waterways Experiment Station, Vicksburg, Mississippi.
Seed, R.B., and Harder, L.F., Jr. 1990. SPT-based analysis of cyclic pore pressure generation and undrained residual strength. In Proceedings of the H.B. Seed Memorial Symposium, Bi-Tech Publishing Ltd., Vol. 2, pp. 351-376.
Shuttle, D., and Jefferies, M. 1998. Dimensionless and unbiased CPT interpretation in sand. International Journal for Numerical and Analytical Methods in Geomechanics, 22: 351-391.
Sladen, J.A. 1989. Problems with interpretation of sand state from cone penetration test. Geotechnique, 39(2): 323-332.
Sladen, J.A., D'Hollander, R.D., and Krahn, J. 1985~ . The liquefac- tion of sands, a collapse surface approach. Canadian Geotechnical Journal, 22: 564-578.
Sladen, J.A., D'Hollander, R.D., Krahn, J., and Mitchell, D.E. 1985b. Back analysis of the Nerlerk berm liquefaction slides. Canadian Geotechnical Journal, 22: 579-588.
Sladen, J.A., D'Hollander, R.D., Krahn, J., and Mitchell, D.E. 1987. Back analysis of the Nerlerk berm liquefaction slides: Reply. Ca- nadian Geotechnical Journal, 24: 179-185.
Spencer, E. 1967. A method of analysis of the stability of embank- ments assuming parallel inter-slice forces. Geotechnique, 17(1): 11-26.
Sasaki, Y., Oshiki, H., and Nishikawa, J. 1994. Embankment fail- ure cased by the Kushiro-Oki earthquake of January 15, 1993. In Proceedings of the 13th International Conference on Soil Me- chanics and Foundation Engineering, New Delhi, India, Vol. 1, pp. 61-68.
Stark, T.D., and Mesri, G. 1992. Undrained shear strength of lique- fied sands for stability analysis. Journal of Geotechnical Engi- neering, ASCE, 118(1 I): 1727-1747.
Stark, T.D., and Olson, S.M. 1995. Liquefaction resistance using CPT and field case histories. Journal of Geotechnical Engineering, ASCE, 121(12): 85C869.
Stark, T.D., Olson, S.M., Kramer, S.L., and Youd, T.L. 1998. Shear strength of liquefied soils. In Proceedings of the Workshop on Post-Liquefaction Shear Strength of Granular Soils, University of Illinois at Urbana-Champaign, Urbana, Illinois, 17-18 April 1997, 288 p. (Available only on the World Wide Web at http://mae.ce.uiuc.edu/info/resources.html.)
Terzaghi, K., Peck, R.B., and Mesri, G. 1996. Soil mechanics in engineering practice, 3rd ed. John Wiley & Sons, Inc., New York, 549 pp.
U.S. Army Corps of Engineers. 1939. Report on the slide of a por- tion of the upstream face of the Fort Peck Dam, Fort Peck, Montana. United States Government Printing Office, Washing- ton, D.C.
U.S. A m y Corps of Engineers. 1949. Report on investigation of failure of Shefield Dam, Santa Barbara, California. Office of the District Engineer, Los Angeles, California, June.
Vaid, Y.P., and Sivathayalan, S. 1996. Static and cyclic liquefaction potential of Fraser Delta sand in simple shear and triaxial tests. Canadian Geotechnical Journal, 33(2): 281-289.
Vaid, Y.P., and Thomas, J. 1995. Liquefaction and post-liquefaction behavior of sand. Journal of Geotechnical Engineering, ASCE, 121(2): 163-173.
Vasquez-Herrera, A., and Dobry, R. 1989. Re-evaluation of the Lower San Fernando Dam: Report 3, the behavior of undrained contractive sand and its effect on seismic liquefaction flow fail- ures of earth structures. U S . Army Corps of Engineers Contract Report GL-89-2, U.S. Army Corps of Engineers Waterways Ex- periment Station, Vicksburg, Mississippi.
Wright, S.G. 1992. UTEXAS3: A computer program for slope sta- bility calculations. Geotechnical Engineering Software GS86-1, Department of Civil Engineering, University of Texas, Austin.
Yamada, G. 1966. Damage to earth structures and foundations by the Niigata earthquake June 16, 1964, in JNR. Soils and Foun- dations, 6(1): 1-13.
Yegian, M.K., Ghahraman, V.G., and Harutinunyan, R.N. 1994. Liquefaction and embankment failure case histories, 1988 Ar- menia earthquake. Journal of Geotechnical Engineering, ASCE, 120(3): 581-596.
Yoshimine, M., Robertson, P.K., and Wride (Fear), C.E. 1999. Un- drained shear strength of clean sands to trigger flow liquefac- tion. Canadian Geotechnical Journal, 36(5): 891-906.
O 2002 NRC Canada