Liquefaction Behavior of Silt and Sandy Silts from Cyclic ... Papers/Sadrekarimi_13.00... ·...
8
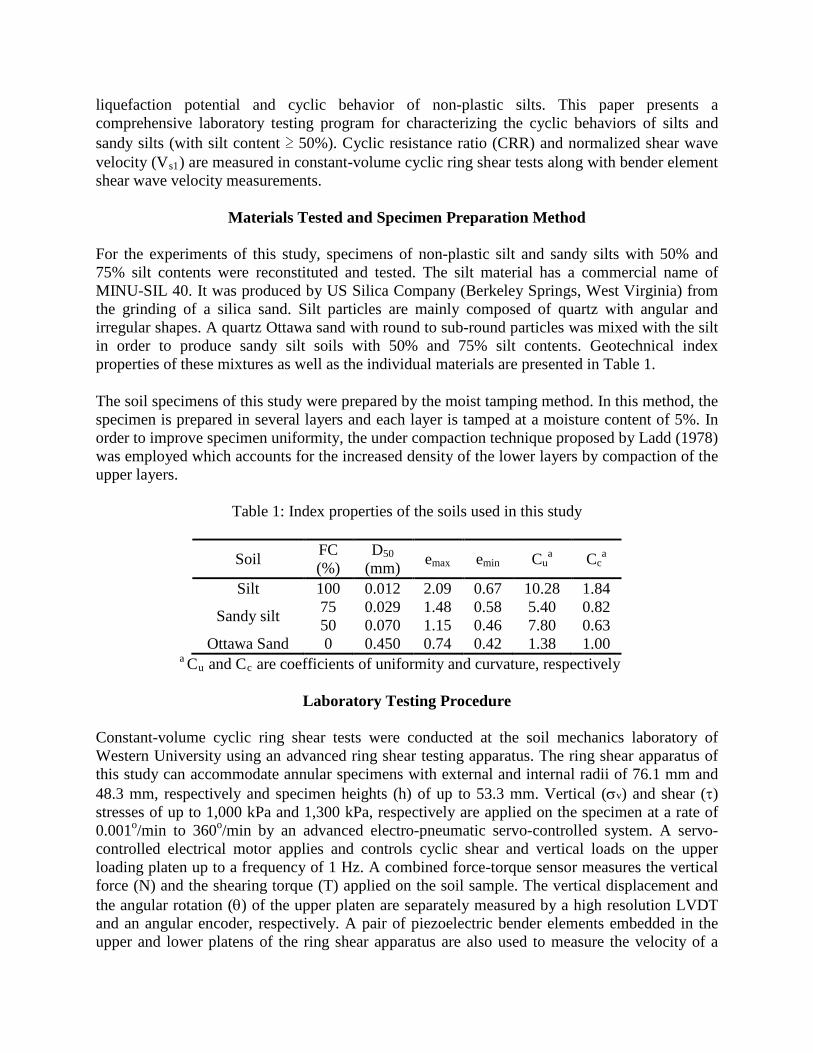
6 th International Conference on Earthquake Geotechnical Engineering 1-4 November 2015 Christchurch, New Zealand Liquefaction Behavior of Silt and Sandy Silts from Cyclic Ring Shear Tests A. El Takch 1 , A. Sadrekarimi 2 , M. H. El Naggar 3 ABSTRACT Cyclic ring shear tests are employed in this study to investigate the cyclic resistance ratio (CRR) of reconstituted samples of non-plastic silt and sandy silts with 50% and 75% silt content. In these experiments, liquefaction and strain-softening occurred at excess pore water pressure ratios (r u ) between 0.6 and 0.7 corresponding to cumulative cyclic shear strains (γ) of 4% to 6%. Subsequently, cyclic liquefaction failure ensued with large shear strains. For the silt and sandy silts of this study, increasing void ratio or decreasing silt content at a certain void ratio result in a decrease of CRR measured in the cyclic ring shear tests. Irrespective of silt content, the measured CRR exhibits a unique relationship with the stress-normalized shear wave velocity measurements (V s1 ) for the silts and sandy silts of this study. The V s1 -based correlation developed from the cyclic ring shear experiments suggests higher CRR than those from earlier studies. Introduction Cyclic liquefaction occurs when a soil loses a substantial part of its shear strength or undergoes large shear strains. This phenomenon has emerged as an important area of investigation in geotechnical earthquake engineering following the extensive damages that occurred as a result of soil liquefaction during the 1964 Alaska and Niigata earthquakes (Fukuoka 1966; Scott et al. 1973; Seed 1968). Cyclic liquefaction behavior of clean sands (Boulanger 2003; Yoshimi 1989) and sandy soils with less than 35% silt content (Xenaki and Athanasopoulos 2003; Polito and Martin 2001) has been extensively studied. Based on these studies, a number of empirical relationships have been developed for predicting the cyclic resistance of cohesionless soils with less than 30% silt content (Idriss and Boulanger 2008). Because of the understanding that fine-grained soils have lower liquefaction potential, the liquefaction and cyclic shearing behavior of non-plastic silts and sandy silts has often been neglected (Sassa and Fukuoka 2006). This is contrary to the extensive liquefaction of sandy silts and silts observed in past earthquakes (Tokimatsu and Katsumata 2012; Boulanger et al. 2013; Sancio et al. 2002; Orense et al. 2011). Moreover, most field deposits of cohesionlees soils are seldom clean and often include fine-grained materials and silt. Accordingly, updated guidelines for liquefaction analysis need to be developed which would cover primarily silty soils as well as clean and silty sands. This requires further experimental studies to better understand the 1 Ali El Takch, Hatch Ltd., Geotechnical EIT, Niagara Falls, Ontario, Canada, [email protected] 2 Abouzar Sadrekarimi, Faculty of Engineering, Western University, Assistant Professor, London, Ontario, Canada, [email protected] 3 M. Hesham El Naggar, Faculty of Engineering, Western University, Professor and Associate Dean, London, Ontario, Canada, [email protected]
Transcript of Liquefaction Behavior of Silt and Sandy Silts from Cyclic ... Papers/Sadrekarimi_13.00... ·...
6th International Conference on Earthquake Geotechnical Engineering 1-4 November 2015Christchurch, New Zealand
Liquefaction Behavior of Silt and Sandy Silts from Cyclic Ring Shear Tests
A. El Takch1, A. Sadrekarimi2, M. H. El Naggar3
ABSTRACT
Cyclic ring shear tests are employed in this study to investigate the cyclic resistance ratio (CRR) of reconstituted samples of non-plastic silt and sandy silts with 50% and 75% silt content. In these experiments, liquefaction and strain-softening occurred at excess pore water pressure ratios (ru) between 0.6 and 0.7 corresponding to cumulative cyclic shear strains (γ) of 4% to 6%. Subsequently, cyclic liquefaction failure ensued with large shear strains. For the silt and sandy silts of this study, increasing void ratio or decreasing silt content at a certain void ratio result in a decrease of CRR measured in the cyclic ring shear tests. Irrespective of silt content, the measured CRR exhibits a unique relationship with the stress-normalized shear wave velocity measurements (Vs1) for the silts and sandy silts of this study. The Vs1-based correlation developed from the cyclic ring shear experiments suggests higher CRR than those from earlier studies.
Introduction
Cyclic liquefaction occurs when a soil loses a substantial part of its shear strength or undergoes large shear strains. This phenomenon has emerged as an important area of investigation in geotechnical earthquake engineering following the extensive damages that occurred as a result of soil liquefaction during the 1964 Alaska and Niigata earthquakes (Fukuoka 1966; Scott et al. 1973; Seed 1968). Cyclic liquefaction behavior of clean sands (Boulanger 2003; Yoshimi 1989) and sandy soils with less than 35% silt content (Xenaki and Athanasopoulos 2003; Polito and Martin 2001) has been extensively studied. Based on these studies, a number of empirical relationships have been developed for predicting the cyclic resistance of cohesionless soils with less than 30% silt content (Idriss and Boulanger 2008).
Because of the understanding that fine-grained soils have lower liquefaction potential, the liquefaction and cyclic shearing behavior of non-plastic silts and sandy silts has often been neglected (Sassa and Fukuoka 2006). This is contrary to the extensive liquefaction of sandy silts and silts observed in past earthquakes (Tokimatsu and Katsumata 2012; Boulanger et al. 2013; Sancio et al. 2002; Orense et al. 2011). Moreover, most field deposits of cohesionlees soils are seldom clean and often include fine-grained materials and silt. Accordingly, updated guidelines for liquefaction analysis need to be developed which would cover primarily silty soils as well as clean and silty sands. This requires further experimental studies to better understand the
1 Ali El Takch, Hatch Ltd., Geotechnical EIT, Niagara Falls, Ontario, Canada, [email protected] Abouzar Sadrekarimi, Faculty of Engineering, Western University, Assistant Professor, London, Ontario, Canada,[email protected] 3 M. Hesham El Naggar, Faculty of Engineering, Western University, Professor and Associate Dean, London,Ontario, Canada, [email protected]
liquefaction potential and cyclic behavior of non-plastic silts. This paper presents a comprehensive laboratory testing program for characterizing the cyclic behaviors of silts and sandy silts (with silt content ≥ 50%). Cyclic resistance ratio (CRR) and normalized shear wave velocity (Vs1) are measured in constant-volume cyclic ring shear tests along with bender element shear wave velocity measurements.
Materials Tested and Specimen Preparation Method For the experiments of this study, specimens of non-plastic silt and sandy silts with 50% and 75% silt contents were reconstituted and tested. The silt material has a commercial name of MINU-SIL 40. It was produced by US Silica Company (Berkeley Springs, West Virginia) from the grinding of a silica sand. Silt particles are mainly composed of quartz with angular and irregular shapes. A quartz Ottawa sand with round to sub-round particles was mixed with the silt in order to produce sandy silt soils with 50% and 75% silt contents. Geotechnical index properties of these mixtures as well as the individual materials are presented in Table 1.
The soil specimens of this study were prepared by the moist tamping method. In this method, the specimen is prepared in several layers and each layer is tamped at a moisture content of 5%. In order to improve specimen uniformity, the under compaction technique proposed by Ladd (1978) was employed which accounts for the increased density of the lower layers by compaction of the upper layers.
Table 1: Index properties of the soils used in this study
Soil FC (%)
D50 (mm) emax emin Cu
a Cca
Silt 100 0.012 2.09 0.67 10.28 1.84
Sandy silt 75 0.029 1.48 0.58 5.40 0.82 50 0.070 1.15 0.46 7.80 0.63
Ottawa Sand 0 0.450 0.74 0.42 1.38 1.00 a Cu and Cc are coefficients of uniformity and curvature, respectively
Laboratory Testing Procedure
Constant-volume cyclic ring shear tests were conducted at the soil mechanics laboratory of Western University using an advanced ring shear testing apparatus. The ring shear apparatus of this study can accommodate annular specimens with external and internal radii of 76.1 mm and 48.3 mm, respectively and specimen heights (h) of up to 53.3 mm. Vertical (σv) and shear (τ) stresses of up to 1,000 kPa and 1,300 kPa, respectively are applied on the specimen at a rate of 0.001o/min to 360o/min by an advanced electro-pneumatic servo-controlled system. A servo-controlled electrical motor applies and controls cyclic shear and vertical loads on the upper loading platen up to a frequency of 1 Hz. A combined force-torque sensor measures the vertical force (N) and the shearing torque (T) applied on the soil sample. The vertical displacement and the angular rotation (θ) of the upper platen are separately measured by a high resolution LVDT and an angular encoder, respectively. A pair of piezoelectric bender elements embedded in the upper and lower platens of the ring shear apparatus are also used to measure the velocity of a
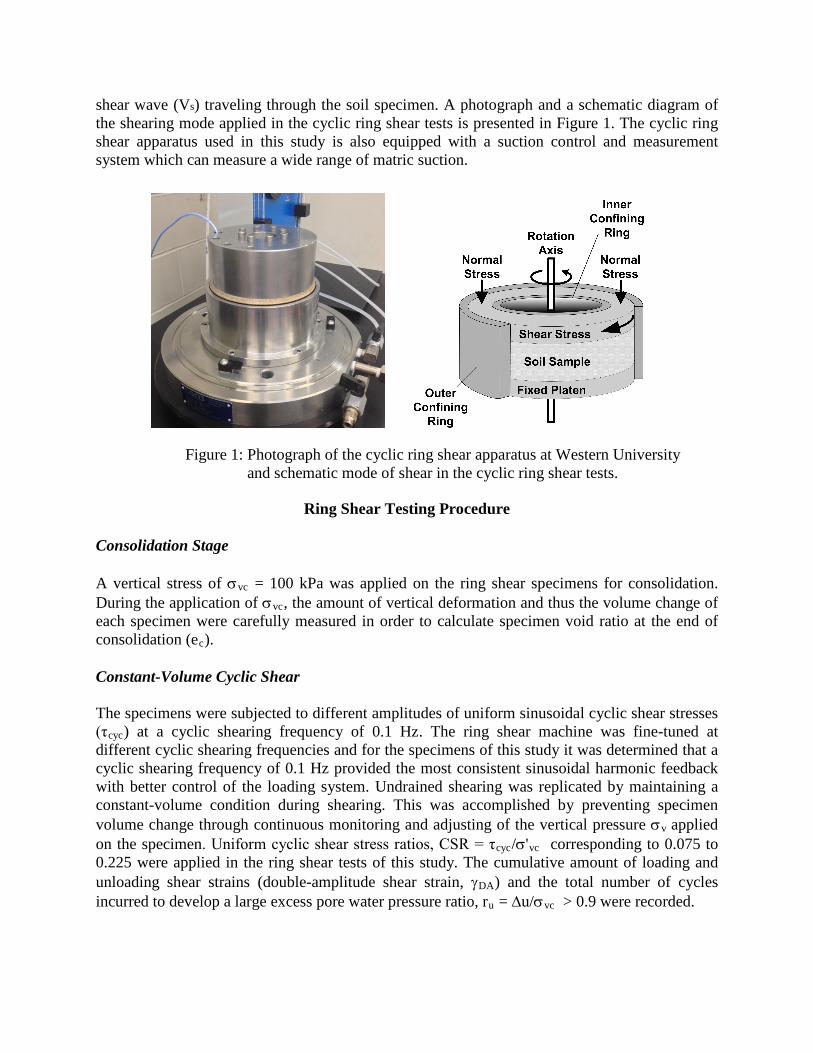
shear wave (Vs) traveling through the soil specimen. A photograph and a schematic diagram of the shearing mode applied in the cyclic ring shear tests is presented in Figure 1. The cyclic ring shear apparatus used in this study is also equipped with a suction control and measurement system which can measure a wide range of matric suction.
Ring Shear Testing Procedure
Consolidation Stage A vertical stress of σvc = 100 kPa was applied on the ring shear specimens for consolidation. During the application of σvc, the amount of vertical deformation and thus the volume change of each specimen were carefully measured in order to calculate specimen void ratio at the end of consolidation (ec).
Constant-Volume Cyclic Shear The specimens were subjected to different amplitudes of uniform sinusoidal cyclic shear stresses (τcyc) at a cyclic shearing frequency of 0.1 Hz. The ring shear machine was fine-tuned at different cyclic shearing frequencies and for the specimens of this study it was determined that a cyclic shearing frequency of 0.1 Hz provided the most consistent sinusoidal harmonic feedback with better control of the loading system. Undrained shearing was replicated by maintaining a constant-volume condition during shearing. This was accomplished by preventing specimen volume change through continuous monitoring and adjusting of the vertical pressure σv applied on the specimen. Uniform cyclic shear stress ratios, CSR = τcyc/σ'vc corresponding to 0.075 to 0.225 were applied in the ring shear tests of this study. The cumulative amount of loading and unloading shear strains (double-amplitude shear strain, γDA) and the total number of cycles incurred to develop a large excess pore water pressure ratio, ru = ∆u/σvc > 0.9 were recorded.
Figure 1: Photograph of the cyclic ring shear apparatus at Western University and schematic mode of shear in the cyclic ring shear tests.
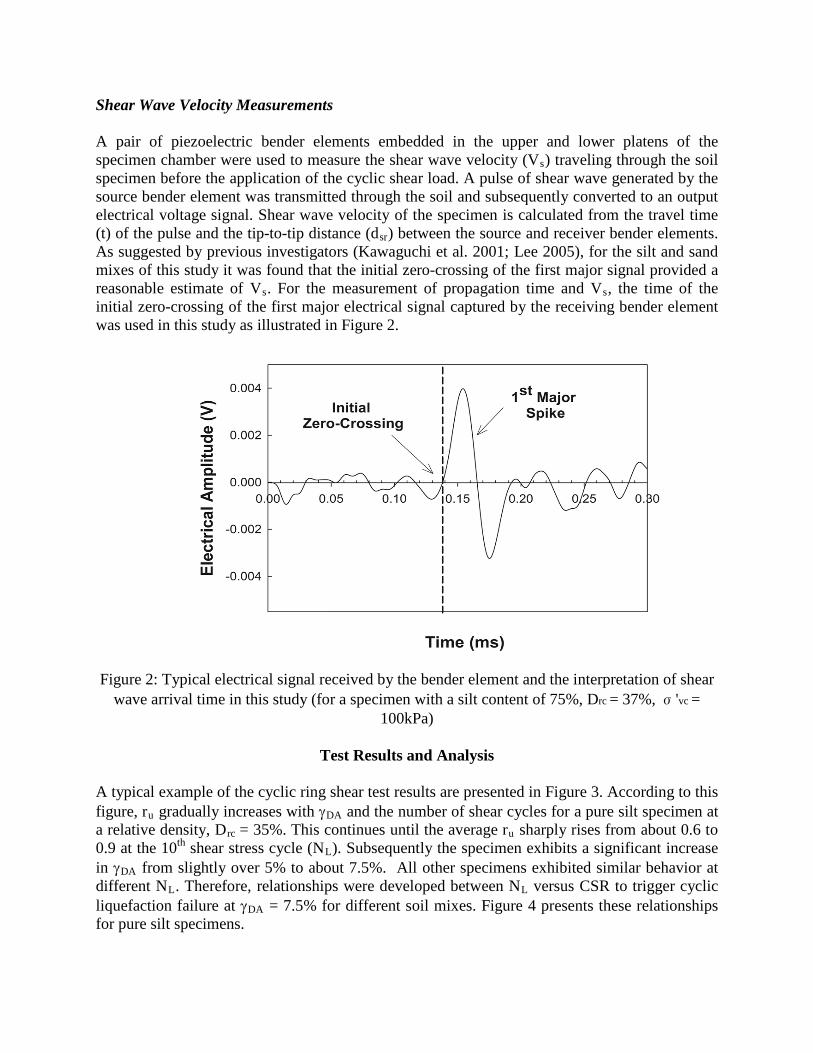
Shear Wave Velocity Measurements A pair of piezoelectric bender elements embedded in the upper and lower platens of the specimen chamber were used to measure the shear wave velocity (Vs) traveling through the soil specimen before the application of the cyclic shear load. A pulse of shear wave generated by the source bender element was transmitted through the soil and subsequently converted to an output electrical voltage signal. Shear wave velocity of the specimen is calculated from the travel time (t) of the pulse and the tip-to-tip distance (dsr) between the source and receiver bender elements. As suggested by previous investigators (Kawaguchi et al. 2001; Lee 2005), for the silt and sand mixes of this study it was found that the initial zero-crossing of the first major signal provided a reasonable estimate of Vs. For the measurement of propagation time and Vs, the time of the initial zero-crossing of the first major electrical signal captured by the receiving bender element was used in this study as illustrated in Figure 2.
Figure 2: Typical electrical signal received by the bender element and the interpretation of shear wave arrival time in this study (for a specimen with a silt content of 75%, Drc = 37%, σ'vc =
100kPa)
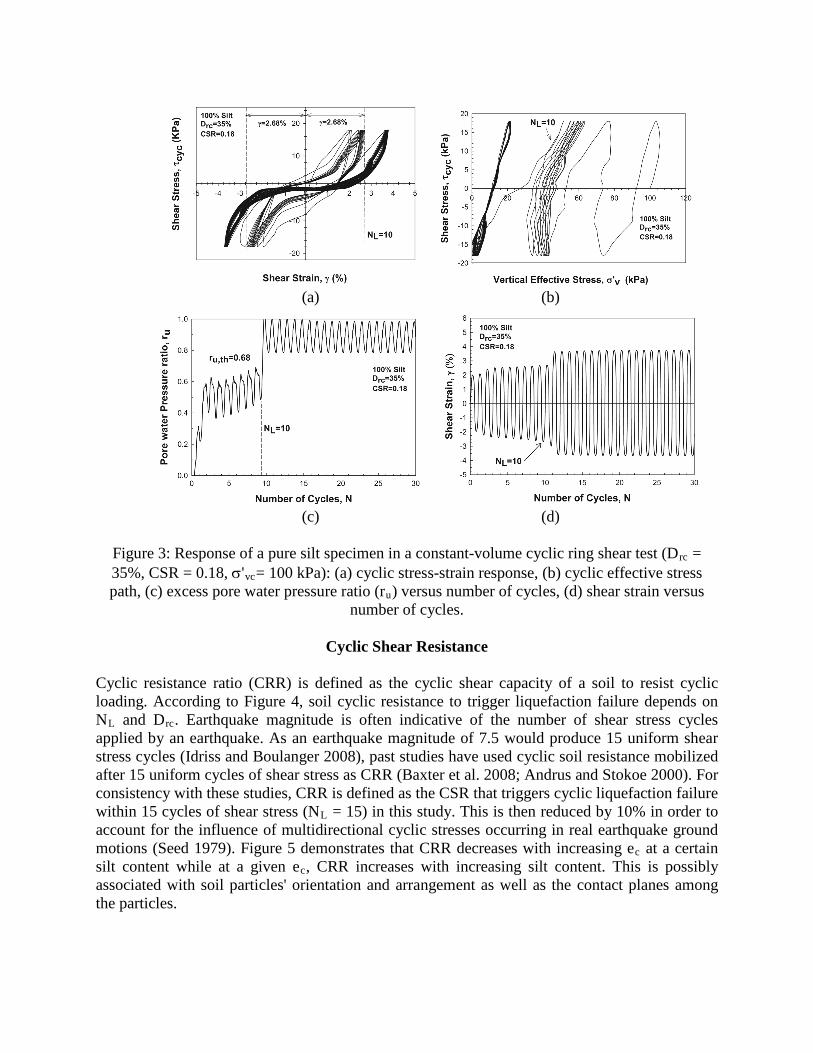
Test Results and Analysis A typical example of the cyclic ring shear test results are presented in Figure 3. According to this figure, ru gradually increases with γDA and the number of shear cycles for a pure silt specimen at a relative density, Drc = 35%. This continues until the average ru sharply rises from about 0.6 to 0.9 at the 10th shear stress cycle (NL). Subsequently the specimen exhibits a significant increase in γDA from slightly over 5% to about 7.5%. All other specimens exhibited similar behavior at different NL. Therefore, relationships were developed between NL versus CSR to trigger cyclic liquefaction failure at γDA = 7.5% for different soil mixes. Figure 4 presents these relationships for pure silt specimens.
(a) (b)
(c) (d)
Figure 3: Response of a pure silt specimen in a constant-volume cyclic ring shear test (Drc = 35%, CSR = 0.18, σ'vc= 100 kPa): (a) cyclic stress-strain response, (b) cyclic effective stress path, (c) excess pore water pressure ratio (ru) versus number of cycles, (d) shear strain versus
number of cycles.
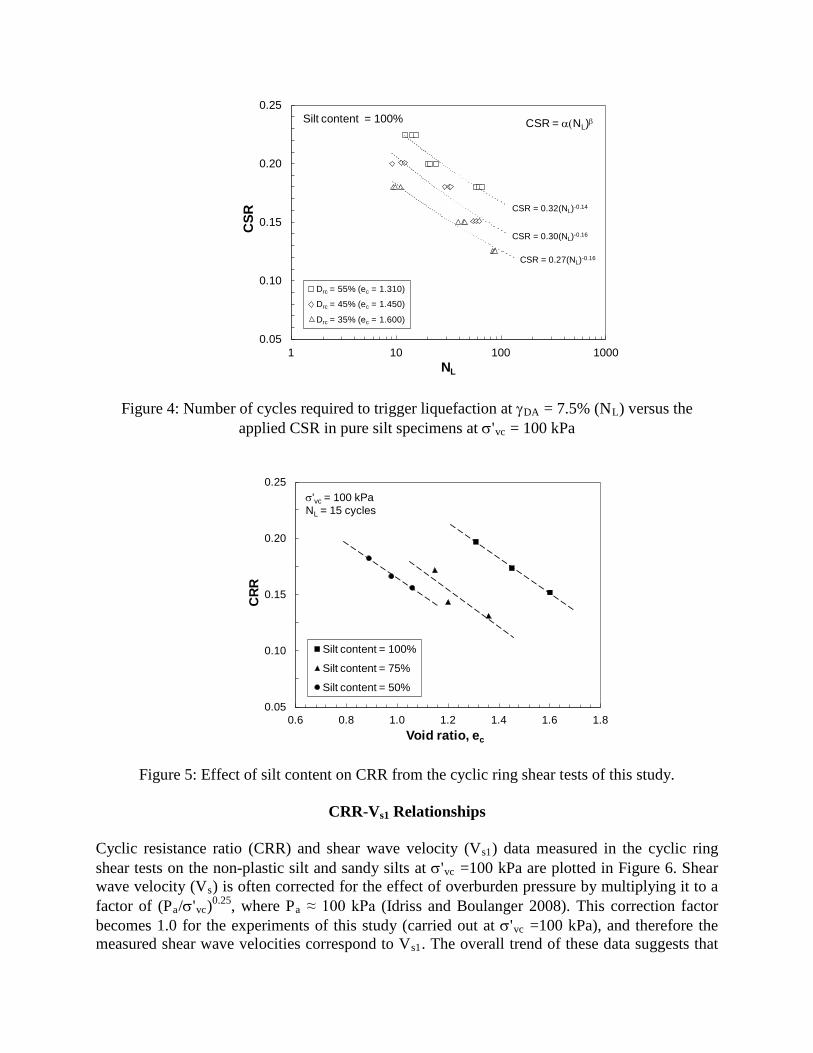
Cyclic Shear Resistance Cyclic resistance ratio (CRR) is defined as the cyclic shear capacity of a soil to resist cyclic loading. According to Figure 4, soil cyclic resistance to trigger liquefaction failure depends on NL and Drc. Earthquake magnitude is often indicative of the number of shear stress cycles applied by an earthquake. As an earthquake magnitude of 7.5 would produce 15 uniform shear stress cycles (Idriss and Boulanger 2008), past studies have used cyclic soil resistance mobilized after 15 uniform cycles of shear stress as CRR (Baxter et al. 2008; Andrus and Stokoe 2000). For consistency with these studies, CRR is defined as the CSR that triggers cyclic liquefaction failure within 15 cycles of shear stress (NL = 15) in this study. This is then reduced by 10% in order to account for the influence of multidirectional cyclic stresses occurring in real earthquake ground motions (Seed 1979). Figure 5 demonstrates that CRR decreases with increasing ec at a certain silt content while at a given ec, CRR increases with increasing silt content. This is possibly associated with soil particles' orientation and arrangement as well as the contact planes among the particles.
CSR = 0.32(NL)-0.14
CSR = 0.30(NL)-0.16
CSR = 0.27(NL)-0.16
0.05
0.10
0.15
0.20
0.25
1 10 100 1000
CSR
NL
CSR = α(NL)βSilt content = 100%
Drc = 55% (ec = 1.310)
Drc = 45% (ec = 1.450)
Drc = 35% (ec = 1.600)
Figure 4: Number of cycles required to trigger liquefaction at γDA = 7.5% (NL) versus the applied CSR in pure silt specimens at σ'vc = 100 kPa
Figure 5: Effect of silt content on CRR from the cyclic ring shear tests of this study.
CRR-Vs1 Relationships
Cyclic resistance ratio (CRR) and shear wave velocity (Vs1) data measured in the cyclic ring shear tests on the non-plastic silt and sandy silts at σ'vc =100 kPa are plotted in Figure 6. Shear wave velocity (Vs) is often corrected for the effect of overburden pressure by multiplying it to a factor of (Pa/σ'vc)0.25, where Pa ≈ 100 kPa (Idriss and Boulanger 2008). This correction factor becomes 1.0 for the experiments of this study (carried out at σ'vc =100 kPa), and therefore the measured shear wave velocities correspond to Vs1. The overall trend of these data suggests that
0.05
0.10
0.15
0.20
0.25
0.6 0.8 1.0 1.2 1.4 1.6 1.8
CRR
Void ratio, ec
Silt content = 100%
Silt content = 75%
Silt content = 50%
σ'vc = 100 kPaNL = 15 cycles
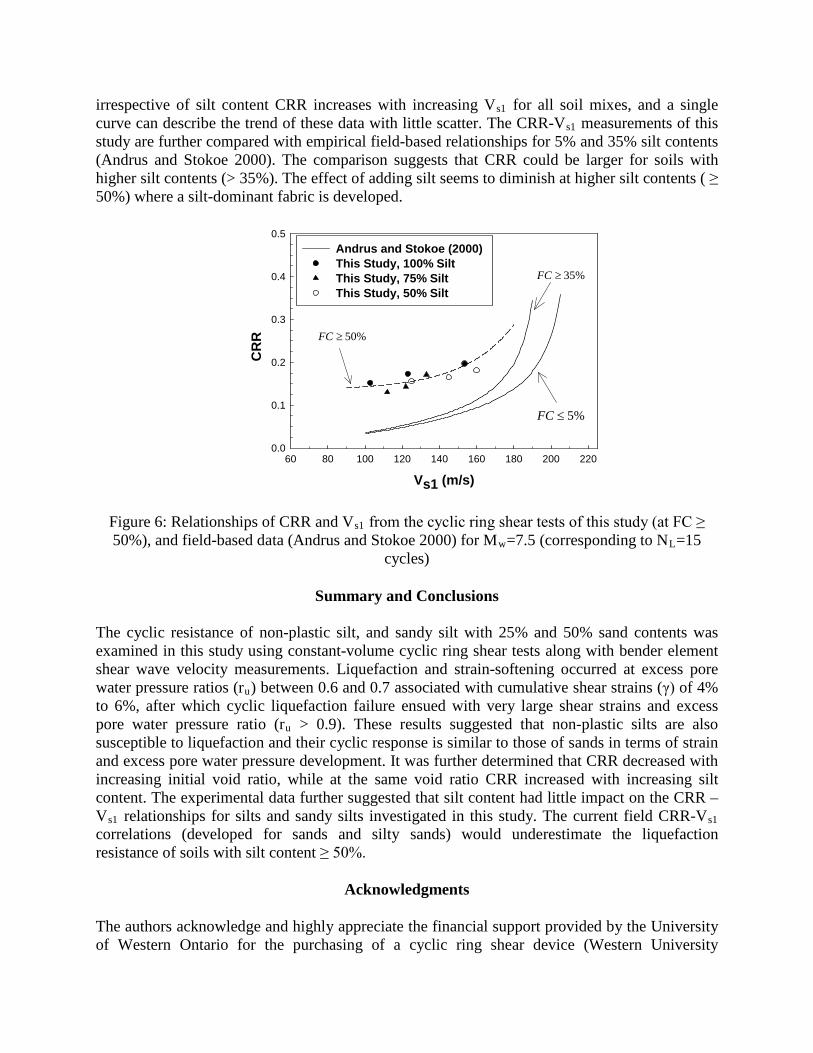
irrespective of silt content CRR increases with increasing Vs1 for all soil mixes, and a single curve can describe the trend of these data with little scatter. The CRR-Vs1 measurements of this study are further compared with empirical field-based relationships for 5% and 35% silt contents (Andrus and Stokoe 2000). The comparison suggests that CRR could be larger for soils with higher silt contents (> 35%). The effect of adding silt seems to diminish at higher silt contents ( ≥ 50%) where a silt-dominant fabric is developed.
Figure 6: Relationships of CRR and Vs1 from the cyclic ring shear tests of this study (at FC ≥ 50%), and field-based data (Andrus and Stokoe 2000) for Mw=7.5 (corresponding to NL=15
cycles)
Summary and Conclusions The cyclic resistance of non-plastic silt, and sandy silt with 25% and 50% sand contents was examined in this study using constant-volume cyclic ring shear tests along with bender element shear wave velocity measurements. Liquefaction and strain-softening occurred at excess pore water pressure ratios (ru) between 0.6 and 0.7 associated with cumulative shear strains (γ) of 4% to 6%, after which cyclic liquefaction failure ensued with very large shear strains and excess pore water pressure ratio (ru > 0.9). These results suggested that non-plastic silts are also susceptible to liquefaction and their cyclic response is similar to those of sands in terms of strain and excess pore water pressure development. It was further determined that CRR decreased with increasing initial void ratio, while at the same void ratio CRR increased with increasing silt content. The experimental data further suggested that silt content had little impact on the CRR – Vs1 relationships for silts and sandy silts investigated in this study. The current field CRR-Vs1 correlations (developed for sands and silty sands) would underestimate the liquefaction resistance of soils with silt content ≥ 50%.
Acknowledgments
The authors acknowledge and highly appreciate the financial support provided by the University of Western Ontario for the purchasing of a cyclic ring shear device (Western University
Vs1 (m/s)
60 80 100 120 140 160 180 200 220
CR
R
0.0
0.1
0.2
0.3
0.4
0.5Andrus and Stokoe (2000) This Study, 100% SiltThis Study, 75% SiltThis Study, 50% Silt
35%FC ≥
5%FC ≤
50%FC ≥
Academic Development Fund, Project No. R4890A05) as well as the financial assistance provided to the first author for pursuing graduate studies.
References
Andrus R. D., Stokoe K. H. Liquefaction resistance of soils from shear-wave velocity. Journal of Geotechnical and Geoenvironmental Engineering, 126: 1015-1025. 2000.
Baxter C.D.P., Bradshaw A.S., Green R.A., Wang J.H. Correlation between cyclic resistance and shear-wave velocity for providence silts. Journal of Geotechnical and Geoenvironmental Engineering, 134: 37-46. 2008.
Boulanger, R.W. High overburden stress effects in liquefaction analyses, Journal of Geotechnical and Geoenvironmental Engineering, 129: 1071-1082. 2003.
Cox B.R., Boulanger R.W., Tokimatsu K., Wood C.M., Abe A., Ashford S. Liquefaction at Strong Motion Stations and in Urayasu City during the 2011 Tohoku-Oki Earthquake. Earthquake Spectra, 29: 55 - 80. 2013.
Fukuoka M. Damage to civil engineering structures. Soils Found, 6: 45 - 52. 1966.
Idriss I.M., Boulanger R.W. Soil liquefaction during earthquakes, Earthquake Engineering Research Institute, San Francisco, 2008.
Jurko J., Sassa K., Fukuoka H. Dynamic behavior of gentle silty slopes based on undrained cyclic shear test, in: Disaster Mitigation of Debris Flows, Slope Failures and Landslides Universal Academy Press, Inc., Tokyo, Japan, pp. 411–420. 2006.
Kawaguchi T., Mitachi T., Shibuya S. Evaluation of shear wave travel time in laboratory bender element test, in: A. Anagnostopoulos, M. Pachakis, Ch. Tsatsanifos (Eds.) 15th International Conference on Soil Mechanics and Geotechnical Engineering, Balkema, Istanbul, pp. 155 - 158. 2001.
Ladd R. S. Preparing test specimens using undercompaction. Geotechnical Testing Journal, ASTM, 1: 16 - 23. 1978.
Lee, S. J., Bender elements: performance and signal interpretation. Journal of Geotechnical and Geoenvironmental Engineering, ASCE, 131: 1063 - 1070. 2005.
Orense R.P., Kiyota T., Yamada S., Cubrinovski M., Hosono Y., Okamura M. Comparison of liquefaction features observed during the 2010 and 2011 Canterbury earthquakes. Seismological Research Letters, 82: 905 - 918. 2011.
Polito C.P., Martin J.R. Effects of nonplastic fines on the liquefaction resistance of sands. Journal of Geotechnical and Geoenvironmental Engineering, ASCE, 127: 408-415. 2001.
Sancio R.B., Bray J.D., Stewart J.P., Youd T.L., Durgunoglu H.T., Onalp A., Seed R.B., Christensen C., Baturay M.B., Karadayilar T. Correlation between ground failure and soil conditions in Adapazari, Turkey. Soil Dynamics and Earthquake Engineering, 22: 1093-1102. 2002.
Scott R.F., Zuckerman K.A. Sandblows and Liquefaction, in: V. Foy, E.E. Bishop, M. Duggan, H. Olney (Eds.) The Great Alaska Earthquake of 1964, National Academy of Sciences, Washington, D. C., 1973.
Seed H.B. Soil liquefaction and cyclic mobility evaluation for level ground during earthquakes. Journal of Geotechnical and Geoenvironmental Engineering, ASCE, 105: 201 - 255. 1979.
Seed H.B. Landslides during earthquakes due to soil liquefaction. Journal of Soil Mechanics and Foundation Engineering Division, ASCE, 94: 193 - 260. 1968.
Tokimatsu K., Katsumata K. Liquefaction-induced damage to buildings in Urayasu City during the 2011 Tohoku pacific earthquake, in: International Symposium on Engineering Lessons Learned from the 2011 Great East Japan Earthquake, Japan Association for Earthquake Engineering, Tokyo, Japan, pp. 665 - 674. 2012.
Xenaki V.C., Athanasopoulos G.A. Liquefaction resistance of sand–silt mixtures: anexperimental investigation of the effect of fines. Soil Dynamics and Earthquake Engineering, 23: 183 - 194. 2003.
Yoshimi Y., Tokimatsu K., Hosaka Y. Evaluation of liquefaction resistance of clean sands based on high-quality undisturbed samples. Soils and Foundations, 29(1): 93 - 104. 1989.