LIQUEFACATION OF SILTS AND SILT-CLAY MIXTURES US TAIWAN WORKSHOP ON LIQUEFACTION November-2003 Vijay...
37
LIQUEFACATION OF SILTS AND SILT-CLAY MIXTURES US TAIWAN WORKSHOP ON LIQUEFACTION November-2003 Vijay K. Puri Professor Southern Illinois University Carbondale, IL Shamsher Prakash* Emeritus Professor, University of Missouri Rolla, MO * Corresponding Author
-
Upload
baldwin-ramsey -
Category
Documents
-
view
216 -
download
0
Transcript of LIQUEFACATION OF SILTS AND SILT-CLAY MIXTURES US TAIWAN WORKSHOP ON LIQUEFACTION November-2003 Vijay...

LIQUEFACATION OF SILTS AND SILT-CLAY MIXTURES
US TAIWAN WORKSHOP ON LIQUEFACTION November-2003
Vijay K. Puri
Professor
Southern Illinois University Carbondale, IL
Shamsher Prakash* Emeritus Professor, University of Missouri Rolla, MO
* Corresponding Author
2
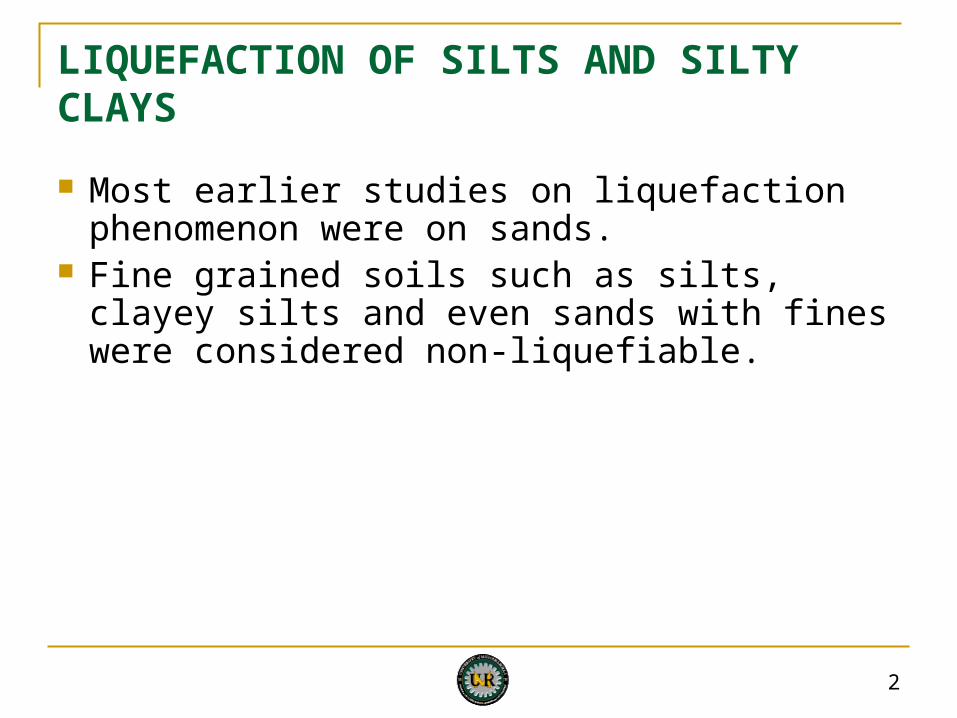
LIQUEFACTION OF SILTS AND SILTY CLAYS
Most earlier studies on liquefaction phenomenon were on sands.
Fine grained soils such as silts, clayey silts and even sands with fines were considered non-liquefiable.
3
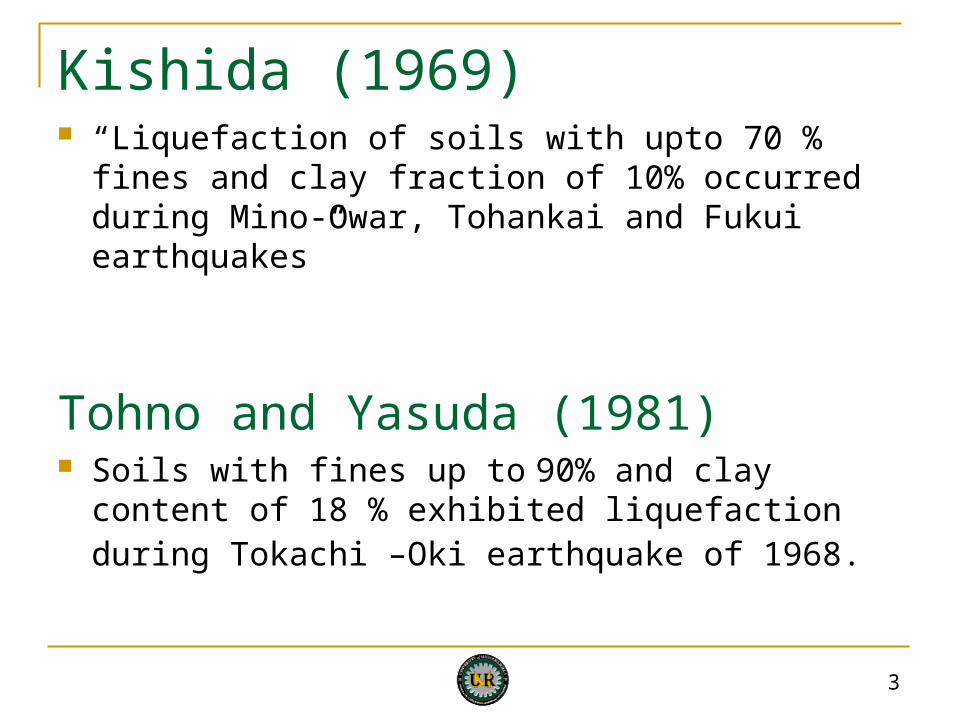
Kishida (1969) “Liquefaction of soils with upto 70 % fines and clay
fraction of 10% occurred during Mino-Owar, Tohankai and Fukui earthquakes”
Tohno and Yasuda (1981) Soils with fines up to 90% and clay content of 18 %
exhibited liquefaction during Tokachi –Oki earthquake of 1968.
4
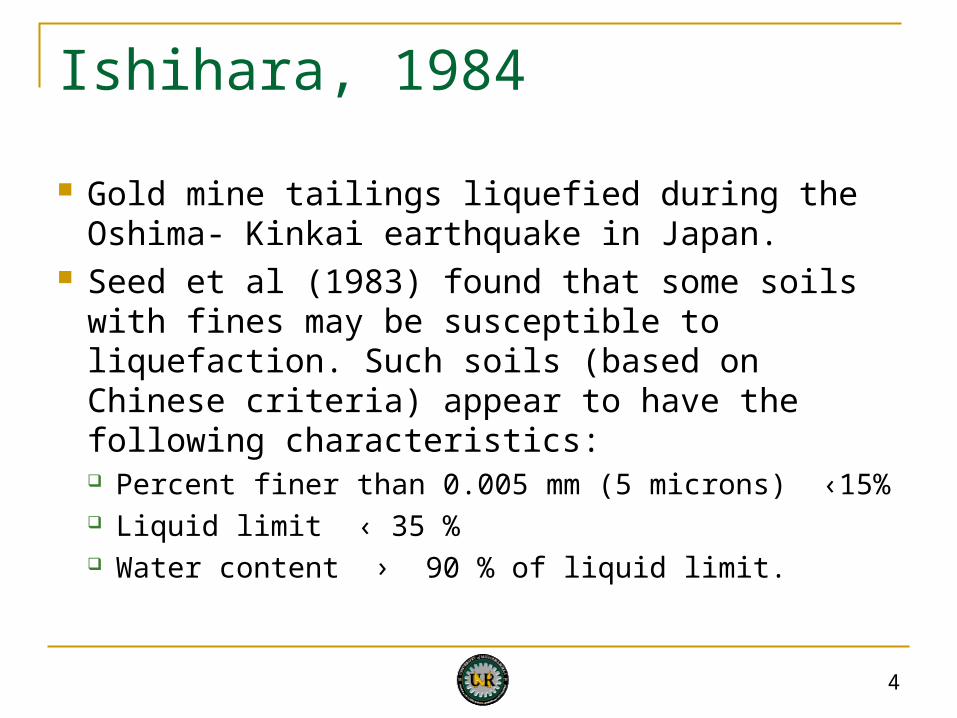
Ishihara, 1984
Gold mine tailings liquefied during the Oshima- Kinkai earthquake in Japan.
Seed et al (1983) found that some soils with fines may be susceptible to liquefaction. Such soils (based on Chinese criteria) appear to have the following characteristics: Percent finer than 0.005 mm (5 microns) ‹15% Liquid limit ‹ 35 % Water content › 90 % of liquid limit.

5
Ishihara and Koseki (1989)
The cyclic strength does not change much for low plasticity range (PI ‹10) but increases thereafter.
The behavior of silts and silt clay mixtures in the low plasticity range is of particular interest and should be ascertained to see if these soils are vulnerable to liquefaction.

6
Confusion
An increase in the fines content in sand decreases the CPT resistance but increases the cyclic resistance of the soil.
Zhou (1987)
Intensity I 7 8 9
(%) 10 13 16*cP
If the clay content in a soil is more than the critical
percentage , the soil will not liquefy. The values are related to the intensity of earthquake ‘I’ as follows:
*cP
*P*cP
Zhou (1981)

7
The Chinese practice of determining the liquid and plastic limits, water content and clay fraction differs somewhat from the ASTM procedures
Adjustments of the index properties as determined using the US standards, prior to applying the Chinese criteria: decrease the fines content by 5% increase the liquid limit by 1% and increase the water content by 2

8
w = 0.87LL
Saturated moisture content, w (%)
NON-LIQUEFIABLE SOIL: w < 0.87LL or LL > 33.5 or Clay fraction > 20% or Plasticity Index > 13
LL = 33.5
POTENTIALLY LIQUEFIABLE SOIL IF: Clay fraction (0.005 mm) is less than 20% Plasticity Index is less than or equal to 13.
Liq
uid
Lim
it, L
L
60
50
40
30
20
10
0 0 20 40 60 80
Figure 2. Chinese Criteria Adapted to ASTM Definitions of Soil Properties (Perlea, Koester and Prakash, 1999)
9
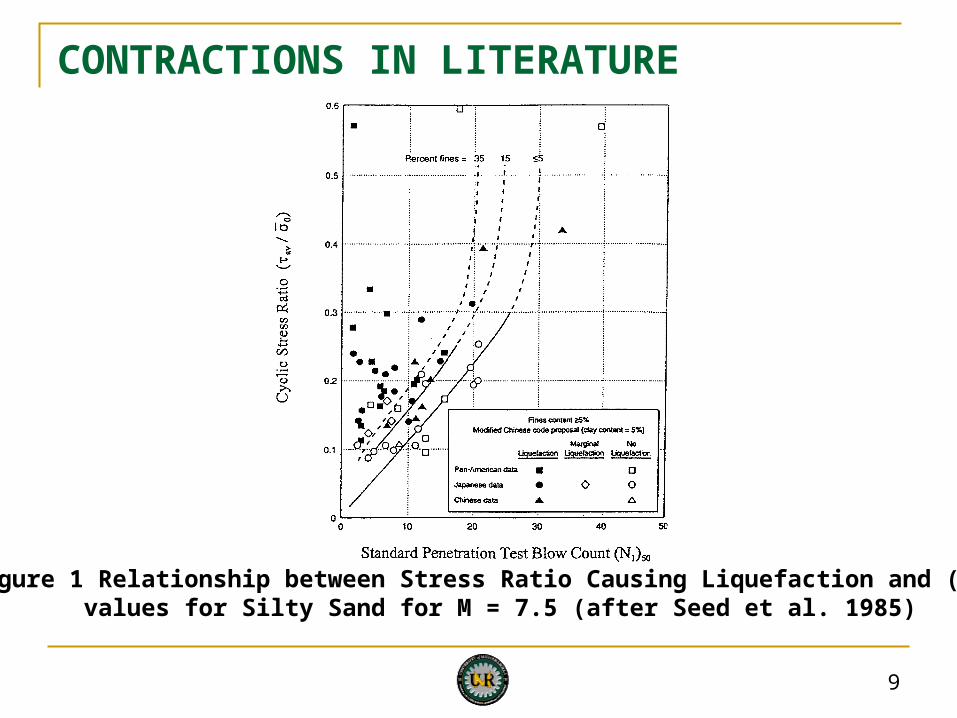
CONTRACTIONS IN LITERATURE
Figure 1 Relationship between Stress Ratio Causing Liquefaction and (N1)60 values for Silty Sand for M = 7.5 (after Seed et al. 1985)

10
Figure 3 Variation of Cyclic Strength with Fine Content at Constant Void Ratio (after Troncoso, 1990)
11
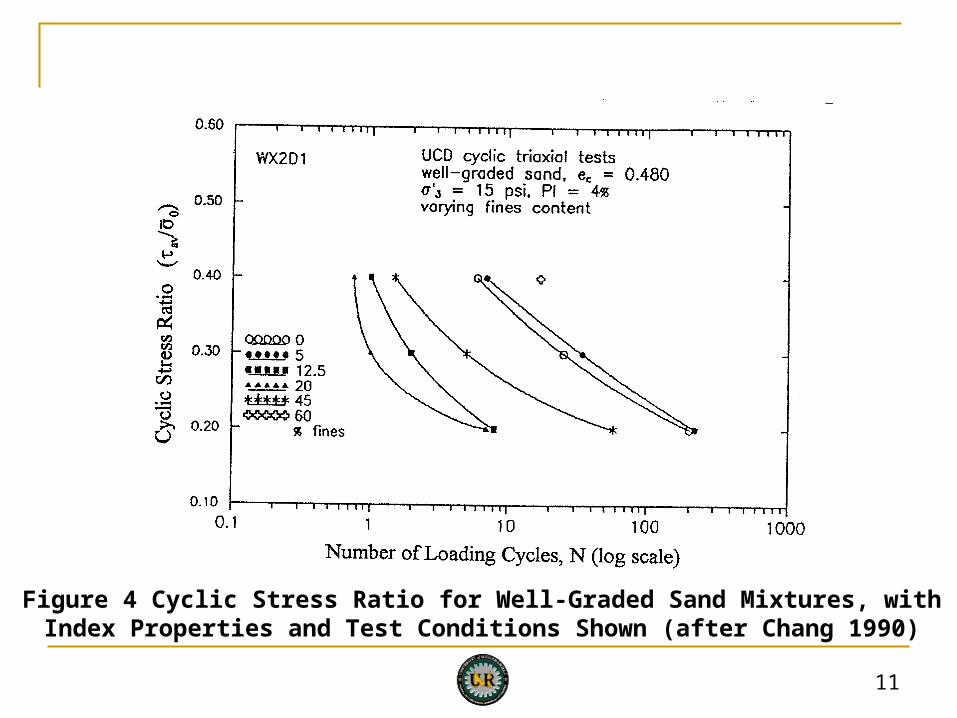
Figure 4 Cyclic Stress Ratio for Well-Graded Sand Mixtures, withIndex Properties and Test Conditions Shown (after Chang 1990)
12
Troncoso (1990) and Koester (1993) indicated that the cyclic strength of sand decreased with increasing silt content up to 20-30% by weight. If the fines content goes beyond 20%, cyclic stress ratio of sand increases with fines. There should be a lowest value of cyclic stress ratio between fines content of 20-30% of the soil’s weight.
There is more scatter in Koester’s (1993) data than in that of Troncoso (1990). Therefore, no quantitative conclusions can be drawn relating the decrease in CSR with fines content.
Further systematic investigations are needed to study these effects.
13
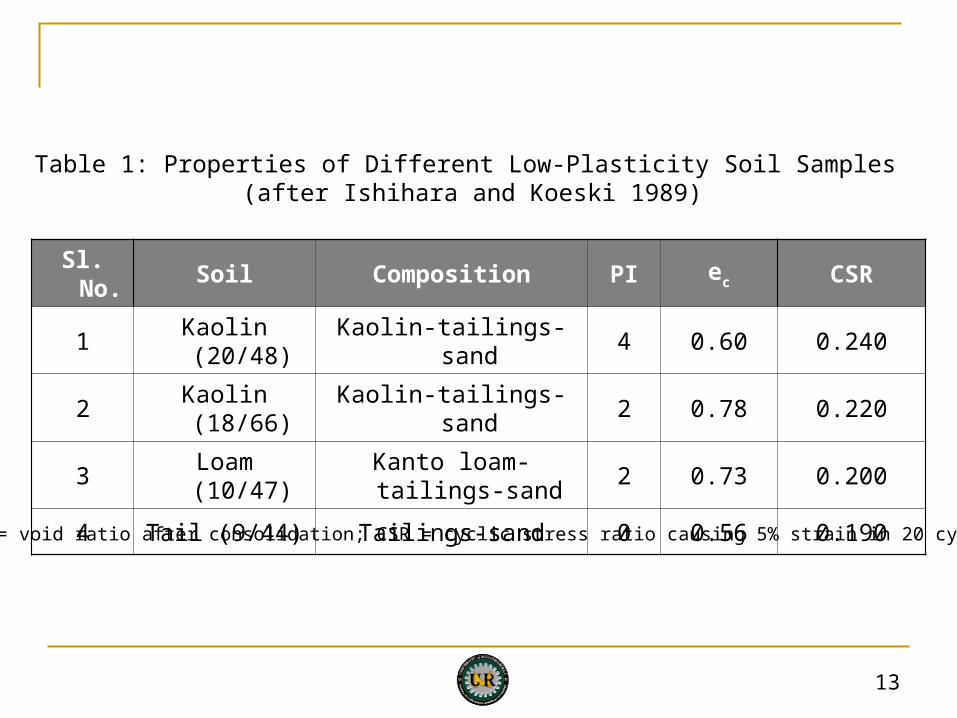
Sl. No. Soil Composition PI ec CSR
1 Kaolin (20/48) Kaolin-tailings-sand 4 0.60 0.240
2 Kaolin (18/66) Kaolin-tailings-sand 2 0.78 0.220
3 Loam (10/47) Kanto loam-tailings-sand 2 0.73 0.200
4 Tail (9/44) Tailings-sand 0 0.56 0.190
Table 1: Properties of Different Low-Plasticity Soil Samples (after Ishihara and Koeski 1989)
Note: ec = void ratio after consolidation; CSR = cyclic stress ratio causing 5% strain in 20 cycles.

14
Sample No.Gradation
<2µm%PI eo of sample Soil type
Number of cycles
CSR
Site (I)A
0 - 0.644 SM 20 0.295
B 19 5 0.478 ML-CL 20 0.32
C 21 8 0.548 ML 20 0.265
Site (II)D
17 9 0.654 ML 20 0.305
E 28 15 0.914 ML-MH 20 0.326a
F 15 6.5 0.600 ML-CL 20 0.335
Table 2: Characteristics of the Specimens and Test Results (El Hosri et al. 1984)
a Extrapolated Value
15
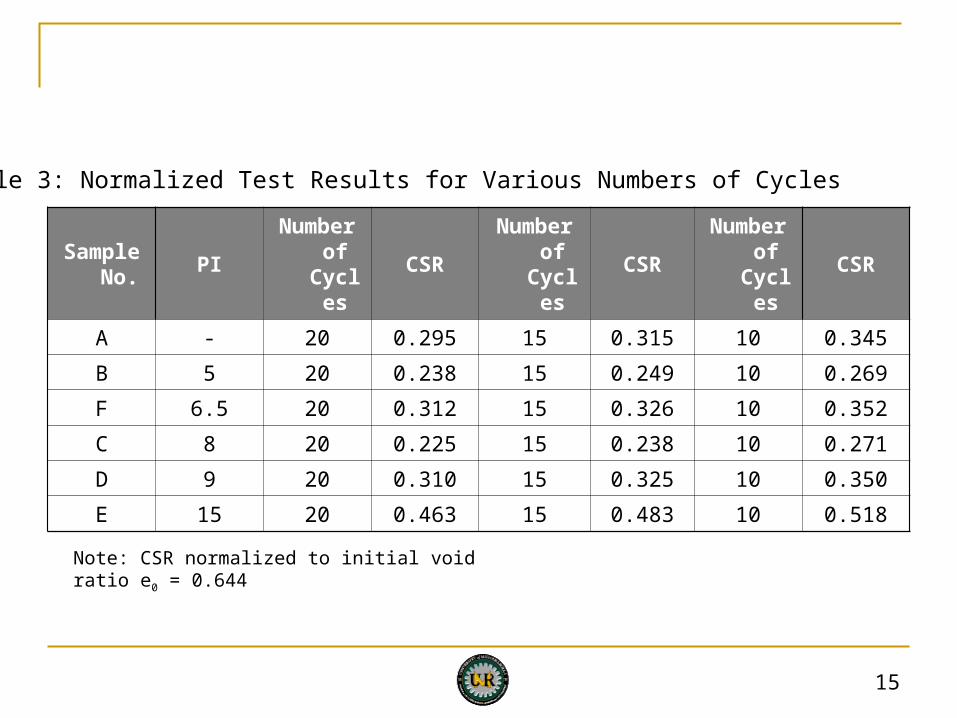
Sample No.
PI
Number of
Cycles
CSR
Number of
Cycles
CSR
Number of
Cycles
CSR
A - 20 0.295 15 0.315 10 0.345
B 5 20 0.238 15 0.249 10 0.269
F 6.5 20 0.312 15 0.326 10 0.352
C 8 20 0.225 15 0.238 10 0.271
D 9 20 0.310 15 0.325 10 0.350
E 15 20 0.463 15 0.483 10 0.518
Table 3: Normalized Test Results for Various Numbers of Cycles
Note: CSR normalized to initial void ratio e0 = 0.644
16
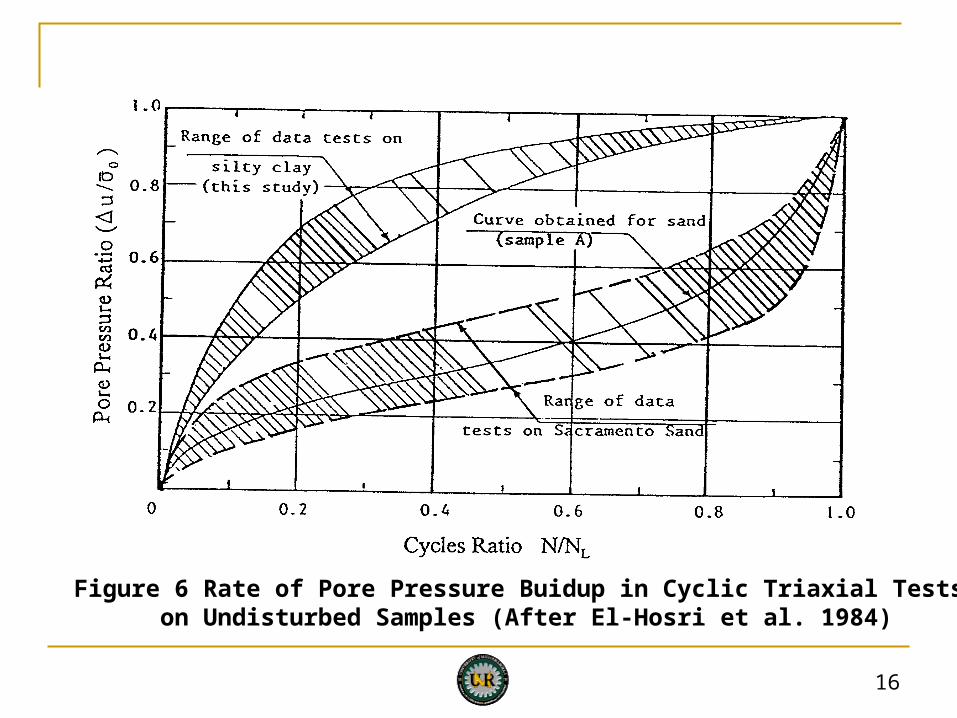
Figure 6 Rate of Pore Pressure Buidup in Cyclic Triaxial Tests on Undisturbed Samples (After El-Hosri et al. 1984)
17
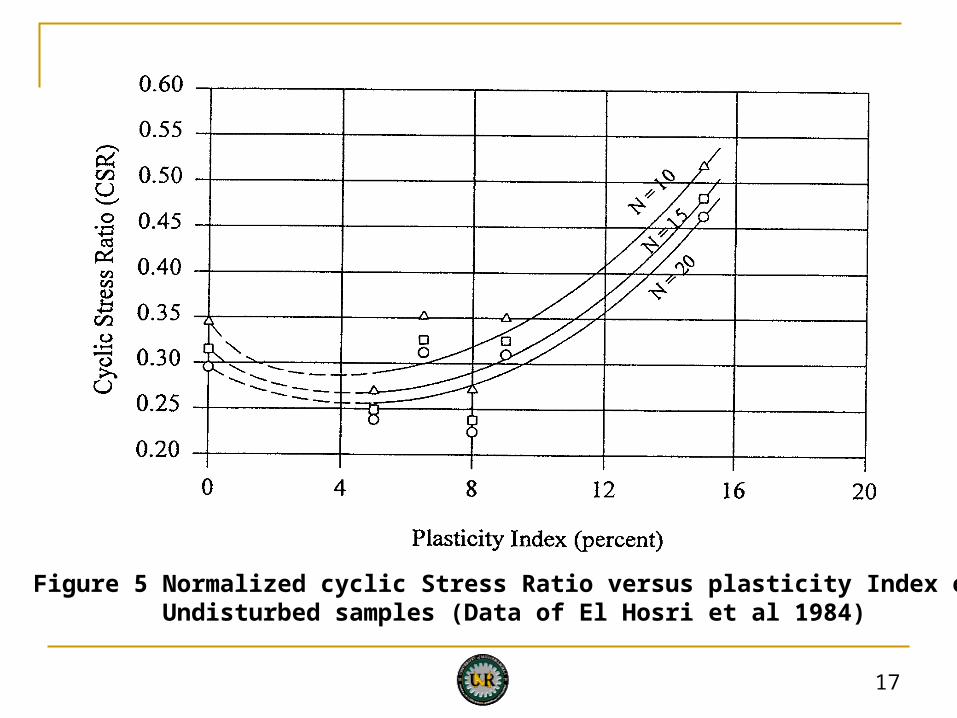
Figure 5 Normalized cyclic Stress Ratio versus plasticity Index on Undisturbed samples (Data of El Hosri et al 1984)

18
On the basis of studies on undisturbed samples, the following was concluded: (Guo and Prakash 1989) Tests indicate that the pore water pressure buildup in silt-
clay mixtures are remarkably different from that for sands. The increase of the PI decreases the liquefaction
resistance of silt-clay mixtures in the low range of plasticity. In the high plasticity range, the liquefaction resistance increases with an increasing PI.
For silt-clay mixtures, the criteria used to define the stage of initial liquefaction for sands may not be applicable, because of the difference in pore pressure buildup and deformation relationship as compared with those of sand.

19
Figure 7. Cyclic Stress ratio Versus number of Cycles for Undisturbed SaturatedSamples for σ3 = 10.0 psi (Puri, 1984)
20
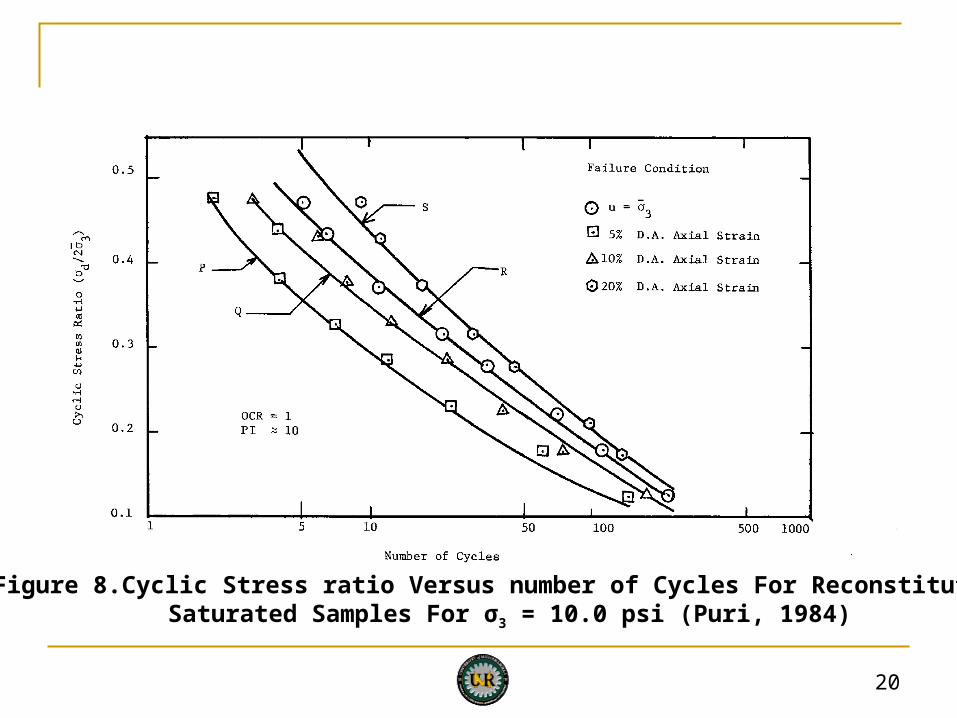
Figure 8.Cyclic Stress ratio Versus number of Cycles For Reconstituted Saturated Samples For σ3 = 10.0 psi (Puri, 1984)

21
Figure 9 Comparison of Cyclic Stress Ratios for Undisturbed and Reconstituted Saturated Samples For Inducing u = Condition in a Given
Number of Cycles (Puri, 1984)
Number of Cycles
3 3
3
22
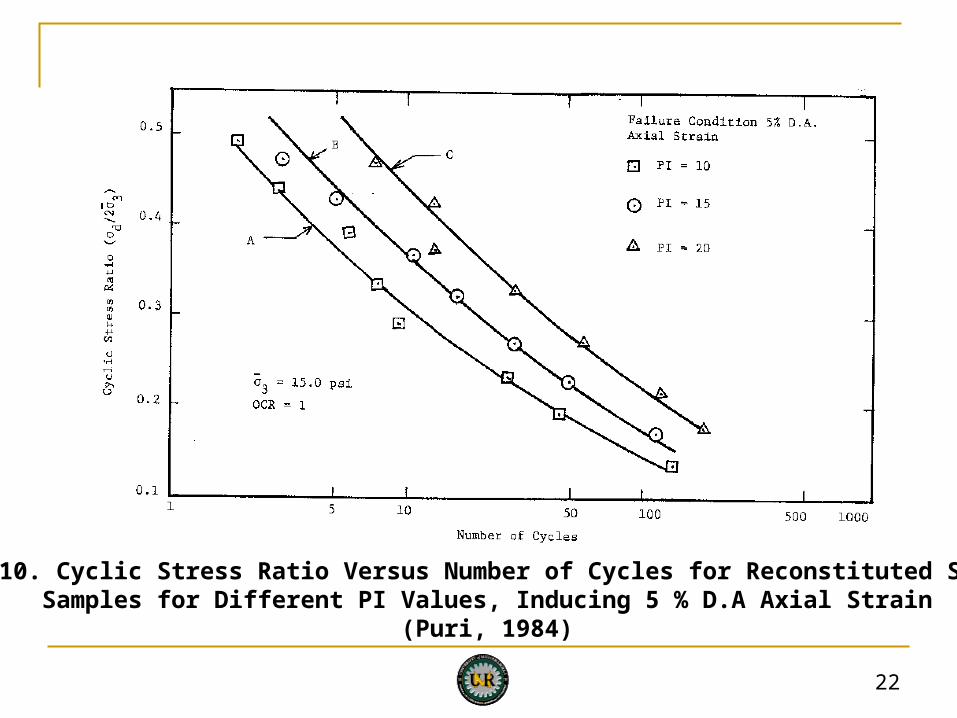
Figure 10. Cyclic Stress Ratio Versus Number of Cycles for Reconstituted SaturatedSamples for Different PI Values, Inducing 5 % D.A Axial Strain
(Puri, 1984)

23
Figure 11 Effect of Plasticity Index on Cyclic Stress Ratio Inducing FailureNumber of Cycles (Puri, 1984)
24
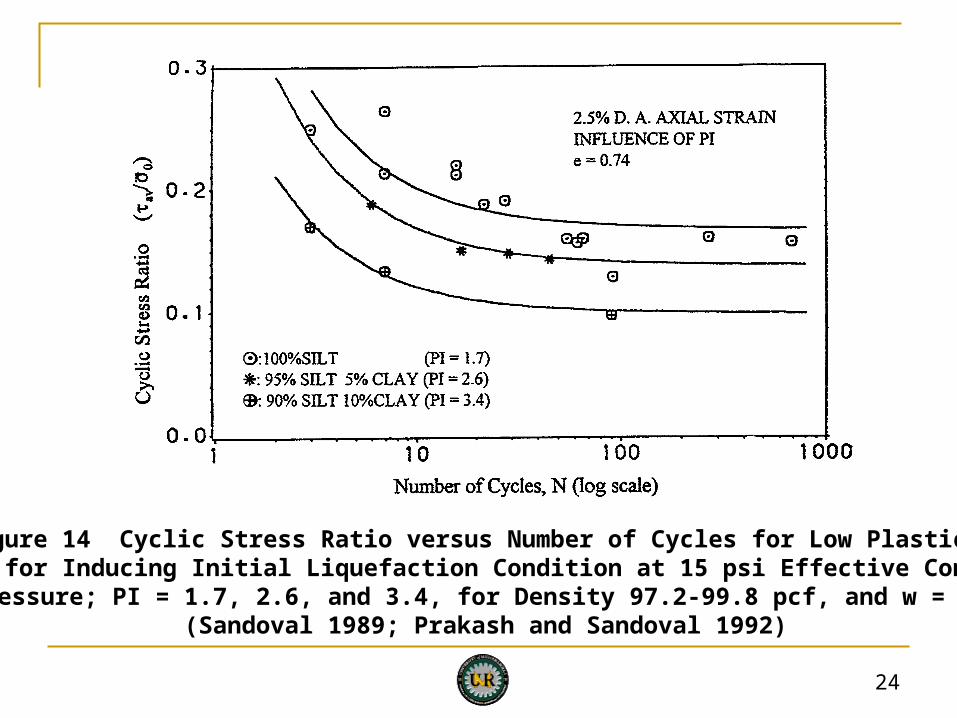
Figure 14 Cyclic Stress Ratio versus Number of Cycles for Low Plasticity Silts for Inducing Initial Liquefaction Condition at 15 psi Effective Confining
Pressure; PI = 1.7, 2.6, and 3.4, for Density 97.2-99.8 pcf, and w = 8% (Sandoval 1989; Prakash and Sandoval 1992)

25
Figure 15 Cyclic Stress Ratio versus Plasticity Index for Silt-Clay Mixtures (CSR Normalized to initial Void Ration e0 = 0.74) (Prakash and Guo, 1999)

26
Conclusions
The silts and silt –clay mixtures behave differently from sands, both with respect to development and build up of pore water pressures, and deformations under cyclic loading.
There are several gaps in the existing literature and no guidelines are available and there is no definite criterion to ascertain the liquefaction susceptibility of silts and silt-clay mixtures from simple index properties or simple field tests.
27
PI and e0 are very important variables. Their effects, as independent variables, need to be studied further in detail.
The effects of soil fabric, aging, and other factors are not quite clear. It appears that the soil fabric and aging may slow down the pore pressure generation.

28
Thank you for your patience.
AMEN!
29
Description of Materials to be Used (Silts): A silt with 80% passing the #200 sieve, and a colloid content (0.002 mm) of 15% will be the target soil to prepare in the slurry. However, this material should be able to liquefy under the “Modified Chinese Criteria”.
30
FURTHER PROGRAM OF INVESTIGATIONS:
We have planned to work further on liquefaction of silts and silt-clay mixtures at UMR:
Preparation of Specimens Consolidation of Silts:
The most appropriate way to prepare laboratory scale specimens of alluvial soils is to sediment them from a slurry. This slurry will be placed in a large consolidometer and allowed to drain by gravity, and subsequently by loading.
31
Dynamic Testing of Silts: Triggering of liquefaction in terms of both pore pressure generation and cyclic strain will be studied. Samples that have been Ko consolidated in the large diameter consolidometer to appropriate stress levels will be extracted and tested in the stress-path triaxial test cell. Monotonic (static) triaxial shear testing will be performed to describe the behavior of the soils.
Similarly, cyclic triaxial shear testing will be conducted on identically prepared specimens. Liquefaction triggering will be defined in terms of both pore pressure generation (100% pore pressure ratio) and cyclic strain (20% double amplitude strain).
Post liquefaction strength will also be determined

32
Model Cone and Laboratory Vane Shear Testing:The ultimate goal of the laboratory program is to establish relationships between field in-situ experimental techniques and liquefaction of silts.
CPT and shear vane tests are known to do a better job at capturing the in-situ fine-grained soil behavior during shearing.
Establishing correlations between the CPT and the VST to liquefaction seems like a very practical objective.

33

34
SIGNIFICANT DEVELOPMENTS: LIQUEFACTION OF FINE GRAINED SOILS
Fig. 1 shows the boundary line between liquefiable and non-liquefiable level sandy sites with less than 5%, and with 15 and 35% fines for an earthquake of magnitude of 7.5. A detailed study of Fig. 1 suggests that (Guo and Prakash, 1999) : The changes of “CSR increase” imply changes in the pore water
pressure build up in the soil. At lower SPT values, i.e., loose sand, fines in the soil leads to higher pore pressure than in the pure sand. When the sand is dense with higher fines content, plasticity is introduced. This imparts cohesive character to soil, and therefore the resistance to liquefaction increases rapidly.
CSR increase is the lowest with (N1)60 for soils containing fines of about 10%. For (N1)60 greater than 15, the rate of increase of CSR is substantially higher in sands with higher fines content. This indicates that both the content and nature of fines (such as plasticity index) control the value of CSR.

35
Puri (1984):Percent finer than 75 μ (0.075 mm) = 93.0 – 98.0 %Natural water content = 18 -26 %Liquid limit = 32.0 – 36.0 %Plastic limit = 21.0 – 25.0 %Plasticity index = 9 -14 (mostly ≈ 10)Clay content (‹ 2μ) = 2.0 – 7.2 %Dry unit weight = 14.7 – 15.2 kN/m3 (93.5 – 96.5 lb/ft3)Specific gravity of soil particles = 2.71Particle size D50 = 0.06 mmUniformity coefficient ≈ 1

36
SILTS AND SILT CLAY MIXTURES
For clean non-plastic saturated silts , the behavior under cyclic loading and nature of generation and buildup of pore-pressure should be expected to be about the same as that for clean sands. If, however a small fraction of highly plastic material is added to non-plastic silt, one of two things may happen:
The rate of buildup of pore water pressure may increase because the addition of clay fraction will reduce the hydraulic conductivity of the soil , which may lead to higher pore water pressures.
Plasticity of clay fraction will impart it some cohesion to the soil which may increase the resistance of the soil to liquefaction.
It is the interplay of these two factors that will determine whether the liquefaction resistance of silt-clay mixtures increases or decreases compared to that of the pure silts.

37
Sandoval (1989)
Specific gravity of soil solids 2.725Particle size data D50 mm 0.022 D10 mm 0.013 Uniformity coefficient 3.5 Percent finer than # 200 (wet sieving) 96-98 Percent finer than # 200 (dry sieving) 83-87Liquid limit (distilled water) 24.2-26.6Plastic limit (distilled water) 21.0 – 25.2Liquid limit (tap water) 24.0-26.0Plastic limit (tap water) 22.5 – 23.0Plasticity index 1.7± 0.1Proctor compaction test Optimum water content 16.5- 17.5 %Maximum dry unit weight 106.0-107.2 pcf