Lipoproteins: Hypothesis Lipid-Lowering Effect …...density lipoproteins. The effects on lipid...
9
Effects of Dietary Fats on Plasma Lipids and Lipoproteins: an Hypothesis for the Lipid-Lowering Effect of Unsaturated Fatty Acids NORTON SPRrz and MAURICE A. MisuaL From The Rockefeller University, New York 10021; the Lipid Metabolism Laboratory of the Second (Cornell) Medical Division, Bellevue Hospital, New York 10016; and the Department of Medicine, Cornell University Medical College, New York 10021 A B S T R A C T Several aspects of the effects of dietary fat on plasma lipids and lipoproteins were investigated in 12 subjects during the long-term feeding of formulas containing 40% of their calories as either saturated or unsaturated fats. The changes in fatty acid composition of plasma lipids, shown previously to occur after pro- longed feedings of a dietary fat, required 10-14 days to be complete and were synchronous with the effect of the fat on plasma lipid concentrations. The change in lipid concentration occurred in low but not in high density lipoproteins. The effects on lipid levels of the low density lipoproteins were found to occur with little or no effect on the concentration of the protein moiety of these lipoproteins; as a result, cholesterol- and phos- pholipid to protein ratios in low density lipoproteins fell during unsaturated fat feeding. The effects of dietary fat on plasma phospholipids were studied in detail: the relative amounts of phosphatidylcholine, phosphatidyl- ethanolamine, sphingomyelin, and lysophosphatidylcho- line were unaffected by the type of dietary fat. However, the molecular species of phosphatidylcholine were mark- edly affected. More than 90% of the fatty acids at the a-position were saturated during both saturated and un- saturated feedings. In contrast, during unsaturated feed- ings, linoleate at the ,8-position outnumbered oleate by approximately 4: 1, whereas during saturated feedings these two types of fatty acids were present in nearly equal amounts. This work was presented in part at the Council on Athero- sclerosis of the American Heart Association, San Francisco, Calif., 1967, and has been published in abstract form (1). Address requests for reprints to Dr. Norton Spritz, The Rockefeller University, New York, N. Y. 10021. Received for publication 2 April 1968 and in revised form 27 September 1968. This paper also presents the following hypothesis for the lipid-lowering effect of unsaturated dietary fat: since unsaturated fatty acids occupy a greater area than saturated acids, they alter the spatial configuration of the lipids into which they are incorporated; as a re- sult, fewer lipid molecules can be accommodated by the apoprotein of the low-density lipoproteins (LDL), and thus the lipid content of the lipoprotein is lowered. The experimental findings of this study, while not proving this hypothesis, are consistent with it. INTRODUCTION It is well established that the concentration of choles- terol and phospholipid in the plasma is affected by the type of fat in the diet. Although nonglyceride compo- nents of dietary fats (such as cholesterol and plant sterols) can play a role in changing plasma lipid levels (2, 3), experiments utilizing synthetic oils containing glycerides alone, indicate that the glyceride per se will produce the observed effect (4). Several investigators have demonstrated that the lipid-lowering effect of these dietary oils can be related to the degree of polyunsatu- ration of their constituent fatty acids (5, 6). Most of the studies directed at determining the mechanism of this effect of unsaturated fats have been attempts to de- termine whether these fats lower plasma lipids by in- creasing fecal excretion of cholesterol and/or its meta- bolic products. Although several investigators (7-9) have found an increase in excretion of neutral and/or acidic sterols during unsaturated fat intake, others have demonstrated that such an effect is neither a necessary nor frequent accompaniment of the change in plasma cholesterol (4, 10, 11). Since there is no evidence that 78 The Journal of Clinical Investigation Volume 48 1969
Transcript of Lipoproteins: Hypothesis Lipid-Lowering Effect …...density lipoproteins. The effects on lipid...

Effects of Dietary Fats on Plasma Lipids and
Lipoproteins: an Hypothesis for the Lipid-Lowering
Effect of Unsaturated Fatty Acids
NORTONSPRrz and MAURICEA. MisuaL
From The Rockefeller University, NewYork 10021; the Lipid MetabolismLaboratory of the Second (Cornell) Medical Division, Bellevue Hospital,New York 10016; and the Department of Medicine, Cornell UniversityMedical College, New York 10021
A B S T R A C T Several aspects of the effects of dietaryfat on plasma lipids and lipoproteins were investigatedin 12 subjects during the long-term feeding of formulascontaining 40% of their calories as either saturated orunsaturated fats. The changes in fatty acid compositionof plasma lipids, shown previously to occur after pro-longed feedings of a dietary fat, required 10-14 days tobe complete and were synchronous with the effect ofthe fat on plasma lipid concentrations. The change inlipid concentration occurred in low but not in highdensity lipoproteins. The effects on lipid levels of thelow density lipoproteins were found to occur with littleor no effect on the concentration of the protein moietyof these lipoproteins; as a result, cholesterol- and phos-pholipid to protein ratios in low density lipoproteins fellduring unsaturated fat feeding. The effects of dietaryfat on plasma phospholipids were studied in detail: therelative amounts of phosphatidylcholine, phosphatidyl-ethanolamine, sphingomyelin, and lysophosphatidylcho-line were unaffected by the type of dietary fat. However,the molecular species of phosphatidylcholine were mark-edly affected. More than 90% of the fatty acids at thea-position were saturated during both saturated and un-saturated feedings. In contrast, during unsaturated feed-ings, linoleate at the ,8-position outnumbered oleate byapproximately 4: 1, whereas during saturated feedingsthese two types of fatty acids were present in nearlyequal amounts.
This work was presented in part at the Council on Athero-sclerosis of the American Heart Association, San Francisco,Calif., 1967, and has been published in abstract form (1).
Address requests for reprints to Dr. Norton Spritz, TheRockefeller University, New York, N. Y. 10021.
Received for publication 2 April 1968 and in revised form27 September 1968.
This paper also presents the following hypothesisfor the lipid-lowering effect of unsaturated dietary fat:since unsaturated fatty acids occupy a greater areathan saturated acids, they alter the spatial configurationof the lipids into which they are incorporated; as a re-sult, fewer lipid molecules can be accommodated by theapoprotein of the low-density lipoproteins (LDL), andthus the lipid content of the lipoprotein is lowered. Theexperimental findings of this study, while not provingthis hypothesis, are consistent with it.
INTRODUCTIONIt is well established that the concentration of choles-terol and phospholipid in the plasma is affected by thetype of fat in the diet. Although nonglyceride compo-nents of dietary fats (such as cholesterol and plantsterols) can play a role in changing plasma lipid levels(2, 3), experiments utilizing synthetic oils containingglycerides alone, indicate that the glyceride per se willproduce the observed effect (4). Several investigatorshave demonstrated that the lipid-lowering effect of thesedietary oils can be related to the degree of polyunsatu-ration of their constituent fatty acids (5, 6). Most ofthe studies directed at determining the mechanism ofthis effect of unsaturated fats have been attempts to de-termine whether these fats lower plasma lipids by in-creasing fecal excretion of cholesterol and/or its meta-bolic products. Although several investigators (7-9)have found an increase in excretion of neutral and/oracidic sterols during unsaturated fat intake, others havedemonstrated that such an effect is neither a necessarynor frequent accompaniment of the change in plasmacholesterol (4, 10, 11). Since there is no evidence that
78 The Journal of Clinical Investigation Volume 48 1969

TABLE IDietary Oils and Plasma Lipid Concentrations in 12 Patients
Dietary oils Cholesterol concentrations Triglyceride concentrationsPatient Age Sex Wt Saturated* Unsaturated* Saturated* Unsaturated* Saturated* Unsaturated*
kg
1. M. W. 70 F 43 Coconut (21) Safflower (21) 210 ±13 145 4±18§ 130 4±16 68 411§2. F. S. 61 F 58 Coconut (28) Safflower (21) 265 419 200 ±12§ 115 412 103 ±93. V. F. 38 F 51 Coconut (28) Corn (28) 400 ±19 352 ±24§ 56 ±11 55 494. I. G. 52 M 71 Coconut (28) Safflower (21) 390 ±10 225 ±19§ - -
5. J. Ba. 40 M 80 Butter (28) Corn (28) 255 ±16 193 412§ 199 ±12 162 ±6§6. N. R. 36 F 67 Butter (136) Safflower (55) 236 ±i10 141 ±6§ 201 ±11 111 426§7. J. Bo. 38 M 75 Butter (28) Trilinolein (42) 371 ±t13 216 ±9§ 205 ±22 156 ±17§8. J. C. 39 M 65 Butter (126) Safflower (70) 279 +19 180 44§ 201 ±24 149 413§9. A. M. 21 F 62 Butter (28) Corn (49) 429 ±14 391 ±5§ 44 412 46 ±t14
10. H. T. 57 M 41 Butter (42) Corn (84) 339 ±17 253 ±7§ 236 ±15 165 +15§11. B. K. 53 F 40 Butter (112) Safflower (56) 304 423 233 ±12§ 129 ±27 117 ±t2012. A. K. 44 M 76 Butter (56) Corn (70) 270 ±14 178 ±11§ 284 415 218 ±39§
* Saturated = during saturated fat feeding. Unsaturated = during unsaturated fat feeding. Figure in parentheses is durationof feeding in days.t Based on last five bi-weekly values during each feeding period. Values represented are mean ±+SD.§ Concentration significantly lower during unsaturated feeding.
unsaturated fat inhibits cholesterol synthesis, this lackof consistent effect on excretion has given rise to thehypothesis that a decrease in plasma cholesterol con-tent can reflect a shift of cholesterol from the plasmato other body pools (4, 12). An increase in fecal ster-oids, when present, may then be secondary to this redis-tribution, rather than the primary cause of the change inplasma cholesterol content.
If the lipid-lowering effect of unsaturated fats is notmediated primarily by an effect on fecal steroid excre-tion, it is possible that it results from alterations inplasma lipoproteins that are produced when unsatu-rated replace saturated fatty acids in circulating lipids.In order to acquire information that may be pertinent tothis question, we have examined several aspects of thechemistry of lipids and the relationship of lipids to pro-teins in the plasma obtained from humans during theintake of highly saturated and unsaturated dietary fats.In addition to the results of these studies, we presentan hypothesis in which the lipid-lowering effect of un-saturated fatty acids is related to the effect of their spa-tial configuration on lipid/protein associations in lipo-proteins.
METHODSExperimental subjects. Table I lists the 12 patients in
whom the studies were carried out. Patients 1-4 were hos-pitalized at the metabolic unit of the Second (Cornell)Medical Division at Bellevue Hospital and patients 5-12 atthe Hospital of The Rockefeller University. All were main-tained on liquid formula feeding with the dietary oil com-prising 40% of calories (13) ; the caloric intakes wereadjusted to prevent weight changes. As indicated in Table I,
these subjects included individuals with both normal andabnormal concentrations of plasma cholesterol, and allexcept patients 3 and 11 had occlusive vascular disease.Although in some patients hypertriglyceridemia of moderatedegree had been noted in the past, at the time of the studythe plasma triglyceride concentration was below 285 mg/100ml in all subjects on both diets. Plasma lipoprotein electro-phoresis by the method of Hatch and Lees (14) demon-strated that in those subjects with mild elevation of tri-glyceride the increase was endogenous (prebeta) in type.Those with hypercholesterolemia (subjects 3, 4, 7, and 9-11)had increased amounts of ,8-lipoprotein (type II, classifica-tion of Fredrickson, Levy, and Lees) (15).
Dietary oils. Table II lists the fatty acid composition ofthe dietary oils used in this study. Patients 6, 8, and 11were participants in a separate study of the effect of dietaryfat on sterol balance (10) ; they ingested formulas contain-ing the natural oils to which cholesterol and plant sterol hadbeen added so that the intake of these sterols was the sameduring saturated and unsaturated feedings. Subject 7 was
TABLE I IFatty Acid Composition of Dietary Oils*
12:0 14:0 16:0 16:1 18:0 18:1 18:2 18:3
SaturatedCoconut 39.4 27.8 13.6 2.6 12.7 4.6Butter 4.2 15.0 36.4 3.6 13.3 27.4
UnsaturatedCorn 10.7 1.4 28.7 59.0Safflower 7.2 2.3 13.2 76.0 0.7Trilinolein 4.2 95.8
* Omitting fatty acids with chain length less than 12.
Dietary Fat and Plasma Lipids 79

given the synthetic fat trilinolein ;1 in all other instancescommercially available oils were used.
Plasma lipids. Bloods were obtained after an overnightfast. Disodium ethylenediamine-tetra-acetate (NaEDTA)was used as anticoagulant (approximately 1 mg/ml blood),and the plasmas were stored at 40C for up to 10 daysbefore analyses were completed. In those specimens inwhich fatty acid analyses or qualitative determination ofphospholipids were to be done, a portion of the plasma wasextracted within several hours and stored under nitrogenat -10°C. Lipoprotein separation was begun within 24 hrof blood drawing. Except for the data presented in Fig. 2,analyses were performed on plasma specimens obtained 10days or more after the institution of any given dietary fat,at which time the cholesterol concentration had reached aplateau.
Plasma cholesterol was determined either by the methodof Abell, Levy, Brodie, and Kendall (16) or by a semi-automated method (14); triglyceride either by the methodof Van Handel (17) or by a semiautomated fluorometricmethod (14). In any one subject, a single method was usedthroughout the study. Lipid phosphorus was determined bythe method of Stewart and Hendry (18) and protein by themethod of Lowry, Rosebrough, Farr, and Randall (19).Plasma lipids were extracted with chloroform:methanol,2:1, and lipid class separations were carried out bypreparative thin-layer chromatography (TLC) (20). Methylesters were prepared from cholesterol ester, triglyceride,and phospholipid after hydrolysis, by the use of boron tri-fluoride-methanol (21). Gas-liquid chromatography (GLC)was carried out as previously described (22).
Ultracentrifugal separation of plasma lipoprotein fractionswas carried out as described by Havel, Eder, and Bragdon(23). The low density lipoprotein fraction (either d =1.006-1.063 or d= 1.019-1.063) was centrifuged a secondtime at 1.063 and then dialyzed for at least 12 hr at 40Cin a nitrogen-saturated solution of 0.01%o NaEDTA in0.85% sodium chloride. This fraction was shown to containuncontaminated ,8-lipoprotein when examined by immuno-electrophoresis.2
Plasma phospholipids were separated into phosphatidyl-ethanolamine, phosphatidylcholine, sphingomyelin, and lyso-phosphatidylcholine by TLC (24). Lipid phosphorus wasdetermined for each fraction after identification withaqueous Rhodamine-G and elution from the silica gel withmethanol. Recovery of phosphorus from the TLC platesvaried from 87-95%.
Determination of the molecular species of the lecithinfraction was done essentially as described by Van Golde,Tomasi, and Van Deenen (25). The incubation mixture forthe conversion of lecithin to diglyceride consisted of 1 mgof phospholipase C (Clostridium welchii, type 1 toxin 3)dissolved in 1.5 ml 0.05 M Tris buffer, pH 7.2, and 0.5 ml0.04 M calcium chloride to which the lecithin was added dis-solved in 3-ml peroxide-free ether. The reaction was carriedout at room temperature in an atmosphere of nitrogen withcontinuous agitation and was complete in 1 hr; the etherphase was dried over anhydrous sodium sulphate. The1,2-diglyceride fraction, shown to be free of 1,3-diglycerideby TLC, was subfractionated by TLC with 12%o AgNO3 inSilica Gel H in a paper-lined tank kept at 4°C, the solventsystem being 8% ethanol in chloroform. Diglyceride frac-
1 Kindly prepared by Dr. F. Mattson of Procter & GambleCo., Cincinnati, Ohio.
2 Kindly carried out by Dr. Robert S. Lees.3 Sigma Chemical Co., St. Louis, Mo.
tions were identified by Rhodamine G and immediatelyeluted with ether. Aliquots were used for saponification,methylation, and determination of fatty acid constituentsafter pancreatic lipase hydrolysis. The composition of thep-fatty acids of lecithin were determined after incubation oflecithin with phospholipase A (26), and recovery of thea-fatty acid and lysolecithin by TLC. The composition ofthe a- and a-fatty acids of the diglyceride fractions weredetermined as described by Mattson and Volpenheim (27).
RESULTS
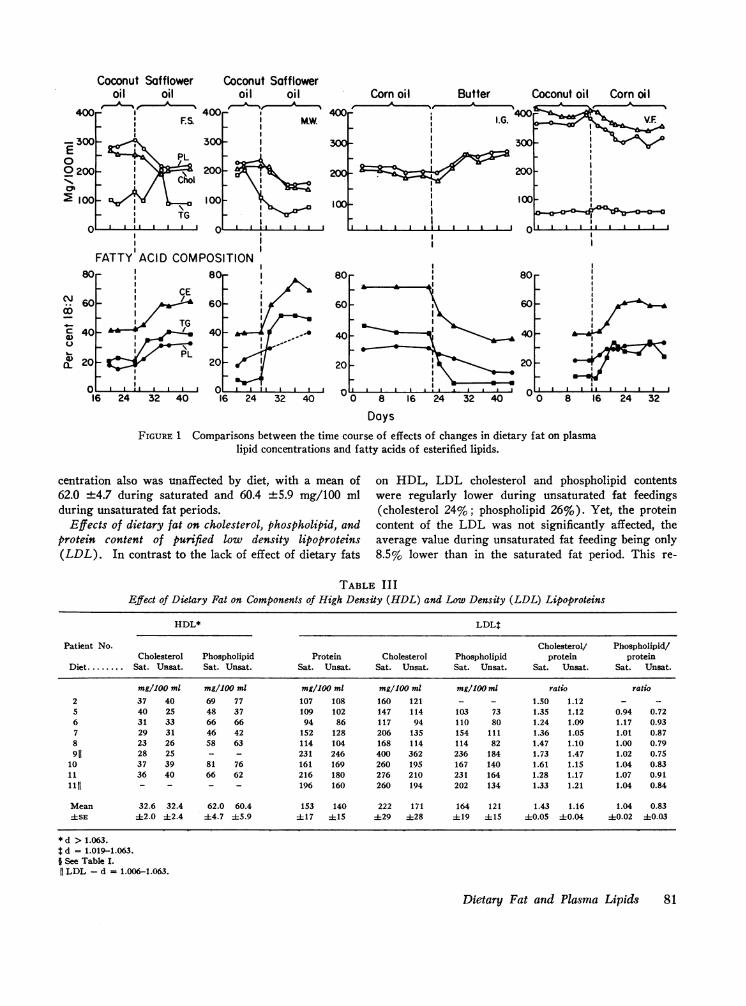
Effect of dietary fats on plasma lipid concentrations.As indicated in Table I, plasma cholesterol concentra-tion was lower during unsaturated than saturated fatfeeding in all subjects. The difference averaged 27% ofthe value during saturated feeding. Changes in plasmaphospholipids closely paralleled those in cholesterol inthe six subjects in whom this determination was regu-larly carried out. In 7 of 11 subjects, triglyceride con-centration was significantly lower during unsaturatedthan saturated period. In general, the triglyceride con-centration was least affected in those subjects with thelowest initial values.
Comparison between effects of dietary fat on plasmalipid concentrations and fatty acid compositions. In pa-tients 1-4 the time-course of the change in fatty acidcomposition of the individual esterified plasma lipidswas compared with the change in the concentration ofeach plasma lipid class after exchanges of dietary fats(Fig. 1).
The major change in fatty acid composition involvedlinoleate (18: 2) and oleate (18: 1), which varied re-ciprocally. The time-course of the effect of the changein dietary oil on fatty acid composition, particularlyof the phospholipid and cholesterol ester fractions, closelyparalleled the changes in lipid concentrations in everycase. In some instances the effect on the triglyceridefatty acids was completed more rapidly than in the caseof phospholipid or cholesterol ester fatty acids.
The limits within which fatty acid compositionschanged were similar in all four subjects. For choles-terol ester, the per cent of 18: 2 never fell below 35-40%, even when saturated oils containing essentially no18: 2 comprised the sole dietary fat. The minimal valuefor phospholipid 18: 2 approximated 15%, and for tri-glyceride 5-10%. During highly unsaturated feedings,18: 2 rose to about 70% in cholesterol ester, to 35% inphospholipids and to 40-50% in triglycerides.
Effects of dietary fat on the cholesterol and phospho-lipid content of high density lipoproteins. Table IIIlists the average value of three to six determinations ofcholesterol concentration of d > 1.063 lipoproteins(HDL) from eight patients during saturated and un-saturated fat feedings. On saturated fats the mean valuefor the group was 32.6 ±2.0 compared with 32.4 ±2.4mg/100 ml on unsaturated fats. HDL phospholipid con-
80 N. Spritz and M. A. Mishkel
Coconut Saffloweroil oil
400 -
- 300-E - PL
0'2200-
100-_, TG
FATTY ACID COMF80-
I CE60-
OD
C40 -
cL20 PL
016 24 32 40
40C
30C
200
bc
POSI80
60.
40.
20
Coconut Saffloweroil oil
. -
II M.W400
300
200
100I
a . I I, I I
ITION
I I a a I I
8
6
4
2
Corn oil Butter Coconut oil Corn oil
I 1. V.EF ~ ~~~30
' - - eI
:0 I
a I a a L.A.~~~~~~~
80r
60
40
20
16 24 32 40 0 8 16 24 32 40
_I_I 1I_I
,I.,r
0 8 16 24 32
DaysFIGURE 1 Comparisons between the time course of effects of changes in dietary fat on plasma
lipid concentrations and fatty acids of esterified lipids.
centration also was unaffected by diet, with a mean of on HDL, LDL cholesterol and phospholipid contents62.0 ±4.7 during saturated and 60.4 +5.9 mg/100 ml were regularly lower during unsaturated fat feedingsduring unsaturated fat periods. (cholesterol 24%; phospholipid 26%). Yet, the protein
Effects of dietary fat on cholesterol, phospholipid, and content of the LDL was not significantly affected, theprotein content of purified low density lipoproteins average value during unsaturated fat feeding being only(LDL). In contrast to the lack of effect of dietary fats 8.5% lower than in the saturated fat period. This re-
TABLE IIIEffect of Dietary Fat on Components of High Density (HDL) and Low Density (LDL) Lipoproteins
HDL* LDLt
Patient No. Cholesterol/ Phospholipid/Cholesterol Phospholipid Protein Cholesterol Phospholipid protein protein
Diet. Sat. Unsat. Sat. Unsat. Sat. Unsat. Sat. Unsat. Sat. Unsat. Sat. Unsat. Sat. Unsat.
mg/10O ml mg/100 ml mg/100 ml mg/100 ml mg/100 ml ratio ratio2 37 40 69 77 107 108 160 121 - - 1.50 1.12 - -5 40 25 48 37 109 102 147 114 103 73 1.35 1.12 0.94 0.726 31 33 66 66 94 86 117 94 110 80 1.24 1.09 1.17 0.937 29 31 46 42 152 128 206 135 154 111 1.36 1.05 1.01 0.878 23 26 58 63 114 104 168 114 114 82 1.47 1.10 1.00 0.79911 28 25 - - 231 246 400 362 236 184 1.73 1.47 1.02 0.75
10 37 39 81 76 161 169 260 195 167 140 1.61 1.15 1.04 0.8311 36 40 66 62 216 180 276 210 231 164 1.28 1.17 1.07 0.911111 - - - - 196 160 260 194 202 134 1.33 1.21 1.04 0.84
Mean 32.6 32.4 62.0 60.4 153 140 222 171 164 121 1.43 1.16 1.04 0.83-+-SE -4±2.0 ±2.4 44.7 45.9 4±17 415 ±29 428 ±19 ±15 ±0.05 ±0.04 ±0.02 40.03
*d >1.063.t d = 1.019-1.063.I See Table I.
II LDL - d = 1.006-1.063.
Dietary Fat and Plasma Lipids 81
0-..lIII II
200.r=
I I I I I I
I
IIIIaIIII

sulted in a change in cholesterol to protein ratios, froman average of 1.43 during saturated to 1.16 during un-saturated fat feeding, and in phospholipid to protein ra-tio from 1.04 to 0.83, respectively. Both changes werestatistically highly significant.
In patients 4 and 9 the per cent of cholesterol in es-terified form was determined during both dietary pe-riods. Between 65 and 70% of total cholesterol was es-terified in all four determinations; no effect of diet wasevident.
Effect of dietary fat on the components of plasmaphospholipids. Table IV lists the percent of composi-tion of plasma phospholipid as phosphatidylcholine(PC), lysophosphatidylcholine (LPC), sphingomyelin(Sp), and phosphatidylethanolamine (PE) in patients9 and 12. Although total phospholipid was 11 and 13%lower during unsaturated than during saturated fat feed-ing, the relative amounts of the four phospholipid sub-groups were essentially unaffected by the diet change.As found by others (24), PC comprised approximately% of the total, and PC plus Sp exceeded 90% in all de-terminations. Phosphatidylinositol and lysophosphatidyl-ethanolamine were less than 1% of the total during bothtypes of feeding.
Effect of diet on the fatty acid composition of totalplasma phospholipid. Table V lists the fatty acid com-position of phospholipids isolated from plasma obtainedfrom seven subjects during the two feeding periods.It is evident that while patient to patient variation wassmall, there were striking effects of diet change. Thecontents of saturated and tri- and tetra-enoic acids wereessentially unaffected by diet; on the other hand, 18: 1and 18: 2 were greatly altered, and the changes werereciprocal.
Effect of dietary fat on the molecular species of plasma
TABLE IVEffect of Dietary Fat on the Components of
Plasma Phospholipids
9 12Patient No.*
Diet: Sat. Unsat. Sat. Unsat.
Plasma 323 287 235 205phospholipid,mg/100 ml
Phosphatidyl- 61.8 58.5 71.0 71.0choline, %
Lysophosphatidyl- 3.7 4.6 1.5 0.6choline, %
Sphingomyelin, % 32.4 34.7 25.0 25.8Phosphatidyl- 2.1 2.2 2.6 2.6
ethanolamine, %
* See Table I.
TABLE V
Effect of Diet on Plasma Phospholipid Fatty Acids
Phospholipid fatty acid
Poly (20:3Patient Saturated 18:1 18:2 and 20:4)
No.* Sat.1 Unsat.§ Sat.§ Unsati§ Sat.§ Unsat.§ Sat.I Unsat.§
1 48 41 22 10 14 38 16 115 48 42 23 11 15 34 14 146 47 44 24 12 13 30 16 147 44 47 28 10 11 30 16 139T 50 48 20 9 14 33 16 10
10 49 43 20 10 16 29 16 1810: 51 48 22 9 15 29 13 1312: 47 41 22 9 19 37 12 13
* See Table I.4 Phosphatidylcholine fatty acids.§ Dietary fat.
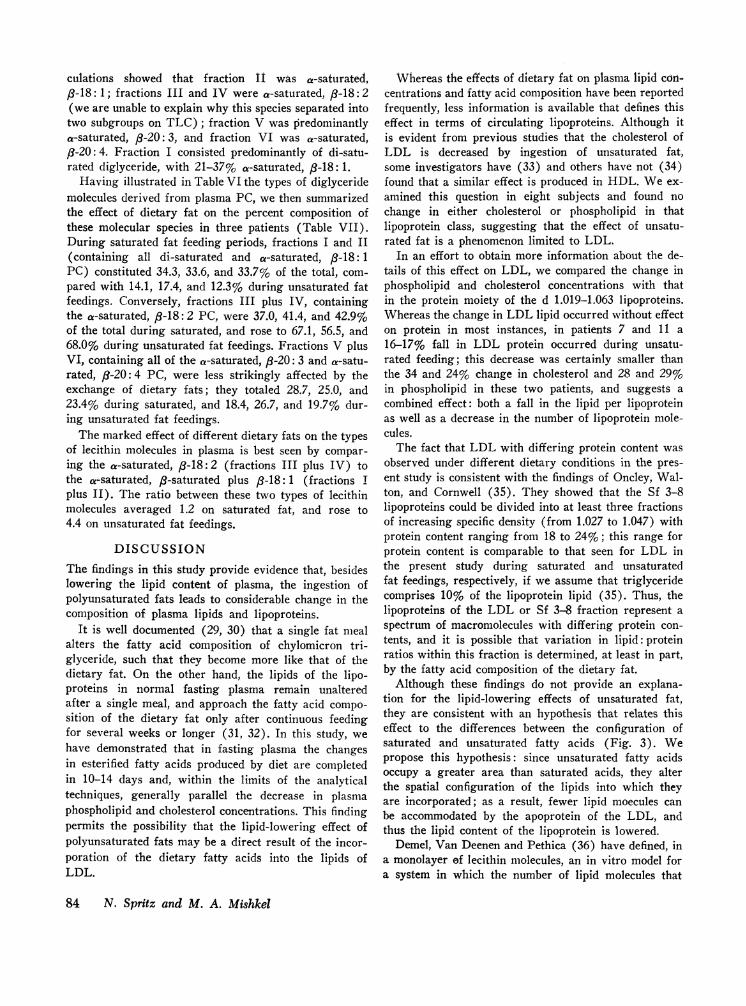
lecithins. PC was isolated from the total phospholipidmixture, and the fatty acid compositions at the a- andfl-positions were then determined. The first step was toconvert the PC to diglyceride by reacting it with phos-pholipase C (28). As illustrated in Fig. 2, the resultantdiglycerides were separated by TLC on silver nitrate-
Saturated
Frcction
I
II
*Diet...
Moio:rcomponen
sat - sat
Sot - 18
IV -St- 1-8
VI S. t -20;
Origin
Unsatu~rated
2 ..2t ..
4
FIGURE 2 Thin-layer chromatograph of diglycerides de-rived from plasma lecithins during saturated and unsaturatedfeeding periods. The plate was made of 12% AgNOs inSilica Gel H and the solvent system was ethanol: chloro-form, 8: 92. For this illustration the chromatograph wasstained by charring with 50% HSO,.
82 N. Spritz and M. A. Mishkel

TABLE VIComposition of Diglycerides Derived from Plasma Lecithins during Saturated
and Unsaturated Feedings
DietDominwit
Saturated Unsaturated fatty acids
Fatty acid ...... Sat.* 18:1 18:2 Poly Sat.* 18:1 18:2 Poly a
Patient 9Fraction
I 63 37 - - 79 21 - - Sat. Sat.(94)1 (92)
II 50 50 - - 57 43 - - Sat. 18:1(86) (91)
III 47 8 45 - 46 5 49 - Sat. 18:2(85) (84)
IV - - - - 48 6 46 - Sat. 18:2(86)
V 49 8 9 35§ 48 8 - 45§ Sat. 20:3(92) (93)
VI 51 7 - 4211 54 13 _ 3411 Sat. 20:4(88) (92)
Patient 12I 70 30 - - 78 22 - - Sat. Sat.II 49 47 4 - 49 48 3 - Sat. 18:1III 44 4 52 - 43 4 53 - Sat. 18:2IV - - - - 39 6 56 Sat. 18:2V 44 3 8 45§ 48 4 3 46§ Sat. 20:3VI 45 5 - 5111 43 5 2 5111 Sat. 20:4
* Sumof 14:0, 16:0, and 18:0.Figures given in parentheses in patient 9 are per cent of saturated fatty acid on a-carbon, determined as described in text.
§20:3.1120:4.impregnated silicic acid. Six fractions could be isolated diglycerides contained one saturated and one unsatu-and the fatty acid composition of each was determined by rated acid. Studies with pancreatic lipase (patient 9,GLC. Table VI lists the fatty acid compositions of these Table VI) confirmed this and indicated that the satu-six fractions during saturated and unsaturated fat feed- rated fatty acid was localized largely to the a-carbon inings in patients 9 and 12. all fractions during both dietary periods. With this in-
On both diets approximately half of the fatty acids of formation, the structure of the diglyceride in each frac-fractions II to VI were saturated, suggesting that the tion could be determined from the GLC data. The cal-
TABLE VI IEffect of Dietary Fat on Per Cent of Composition of Molecular Species of Plasma Lecithins
Patient: 9 10 12 Average
- Diet: Sat. Unsat. Sat. Unsat. Sat. Unsat. Sat. Unsat.Dominant
Fraction* fatty acids*
I Sat.-Sat. 4.3 2.1 2.7 2.6 7.8 1.1 4.9 1.9II Sat.-18: 1 30.0 12.0 30.9 14.8 25.9 11.2 28.9 12.7III Sat.-18:2 37.0 62.0 41.4 50.6 42.9 65.6 40.4 59.4IV Sat.-18:2 - 5.1 - 5.9 - 2.4 - 4.5V Sat.-20:3 14.6 8.8 8.8 12.8 9.8 9.3 11.1 10.3VI Sat.-20:4 14.1 9.6 16.2 13.9 13.6 10.4 14.6 11.3
*See Table VI and Fig. 3.
Dietary Fat and Plasma Lipids 83
culations showed that fraction It was a-saturated,B3-18: 1; fractions III and IV were a-saturated, /3-18: 2(we are unable to explain why this species separated intotwo subgroups on TLC); fraction V was predominantlya-saturated, /3-20: 3, and fraction VI was a-saturated,,8-20: 4. Fraction I consisted predominantly of di-satu-rated diglyceride, with 21-37% a-saturated, /8-18: 1.
Having illustrated in Table VI the types of diglyceridemolecules derived from plasma PC, we then summarizedthe effect of dietary fat on the percent composition ofthese molecular species in three patients (Table VII).During saturated fat feeding periods, fractions I and II(containing all di-saturated and a-saturated, /-18: 1PC) constituted 34.3, 33.6, and 33.7% of the total, com-pared with 14.1, 17.4, and 12.3% during unsaturated fatfeedings. Conversely, fractions III plus IV, containingthe a-saturated, 8-18: 2 PC, were 37.0, 41.4, and 42.9%of the total during saturated, and rose to 67.1, 56.5, and68.0% during unsaturated fat feedings. Fractions V plusVI, containing all of the a-saturated, /8-20: 3 and a-satu-rated, /-20: 4 PC, were less strikingly affected by theexchange of dietary fats; they totaled 28.7, 25.0, and23.4% during saturated, and 18.4, 26.7, and 19.7% dur-ing unsaturated fat feedings.
The marked effect of different dietary fats on the typesof lecithin molecules in plasma is best seen by compar-ing the a-saturated, /-18: 2 (fractions III plus IV) tothe a-saturated, /3-saturated plus /8-18: 1 (fractions Iplus II). The ratio between these two types of lecithinmolecules averaged 1.2 on saturated fat, and rose to4.4 on unsaturated fat feedings.
DISCUSSIONThe findings in this study provide evidence that, besideslowering the lipid content of plasma, the ingestion ofpolyunsaturated fats leads to considerable change in thecomposition of plasma lipids and lipoproteins.
It is well documented (29, 30) that a single fat mealalters the fatty acid composition of chylomicron tri-glyceride, such that they become more like that of thedietary fat. On the other hand, the lipids of the lipo-proteins in normal fasting plasma remain unalteredafter a single meal, and approach the fatty acid compo-sition of the dietary fat only after continuous feedingfor several weeks or longer (31, 32). In this study, wehave demonstrated that in fasting plasma the changesin esterified fatty acids produced by diet are completedin 10-14 days and, within the limits of the analyticaltechniques, generally parallel the decrease in plasmaphospholipid and cholesterol concentrations. This findingpermits the possibility that the lipid-lowering effect ofpolyunsaturated fats may be a direct result of the incor-poration of the dietary fatty acids into the lipids ofLDL.
Whereas the effects of dietary fat on plasma lipid con-centrations and fatty acid composition have been reportedfrequently, less information is available that defines thiseffect in terms of circulating lipoproteins. Although itis evident from previous studies that the cholesterol ofLDL is decreased by ingestion of unsaturated fat,some investigators have (33) and others have not (34)found that a similar effect is produced in HDL. Weex-amined this question in eight subjects and found nochange in either cholesterol or phospholipid in thatlipoprotein class, suggesting that the effect of unsatu-rated fat is a phenomenon limited to LDL.
In an effort to obtain more information about the de-tails of this effect on LDL, we compared the change inphospholipid and cholesterol concentrations with thatin the protein moiety of the d 1.019-1.063 lipoproteins.Whereas the change in LDL lipid occurred without effecton protein in most instances, in patients 7 and 11 a16-17% fall in LDL protein occurred during unsatu-rated feeding; this decrease was certainly smaller thanthe 34 and 24% change in cholesterol and 28 and 29%in phospholipid in these two patients, and suggests acombined effect: both a fall in the lipid per lipoproteinas well as a decrease in the number of lipoprotein mole-cules.
The fact that LDL with differing protein content wasobserved under different dietary conditions in the pres-ent study is consistent with the findings of Oncley, Wal-ton, and Cornwell (35). They showed that the Sf 3-8lipoproteins could be divided into at least three fractionsof increasing specific density (from 1.027 to 1.047) withprotein content ranging from 18 to 24%; this range forprotein content is comparable to that seen for LDL inthe present study during saturated and unsaturatedfat feedings, respectively, if we assume that triglyceridecomprises 10% of the lipoprotein lipid (35). Thus, thelipoproteins of the LDL or Sf 3-8 fraction represent aspectrum of macromolecules with differing protein con-tents, and it is possible that variation in lipid: proteinratios within this fraction is determined, at least in part,by the fatty acid composition of the dietary fat.
Although these findings do not provide an explana-tion for the lipid-lowering effects of unsaturated fat,they are consistent with an hypothesis that relates thiseffect to the differences between the configuration ofsaturated and unsaturated fatty acids (Fig. 3). Wepropose this hypothesis: since unsaturated fatty acidsoccupy a greater area than saturated acids, they alterthe spatial configuration of the lipids into which theyare incorporated; as a result, fewer lipid moecules canbe accommodated by the apoprotein of the LDL, andthus the lipid content of the lipoprotein is lowered.
Demel, Van Deenen and Pethica (36) have defined, ina monolayer of lecithin molecules, an in vitro model fora system in which the number of lipid molecules that
84 N. Spritz and M. A. Mishkel

Width of Dietary Fatty Acids
Soturoted Mono-cis Di -cis, cis
p
-2.5A - -76A---
FIGURE 3 Scale models of the carbon skeleton of stearic,oleic, and linoleic acids.4 These models illustrate the markedeffect of cis double bonds on the configuration of these acids.
can be accommodated within a given area is determinedby the fatty acid composition of the lipid. It is obviousthat lipid/protein interaction in lipoproteins must befar more complex than the molecular interaction in amonolayer film. Yet it is possible that the arrangementis such that differences in configuration of the lipidmolecules produced by substitution of unsaturated forsaturated acids could be one of the factors determiningthe number of available sites for attachment to the apo-protein. On the assumption that lecithin is the lipid mostclosely associated with protein in LDL, we examinedin detail the changes in the molecular species of lecithinmolecules produced by substitution of saturated by un-saturated dietary fats. We found that the moleculesshown to be larger by Demel et al. (36)-a-saturated,,8-18: 2-exceeded those with 18: 1 at the /3-position byabout 4: 1 during unsaturated feedings while the twotypes were present in nearly equal amounts during satu-rated feedings. This finding is compatible with the ideathat the lower lipid/protein ratio seen during unsatu-rated feedings reflects decreased carrying capacity forlecithin on the apoprotein of LDL.
While this study provides several findings that are inaccord with the hypothesis we propose, there are datain apparent contradiction to it and a conclusive test ofits validity requires a knowledge of lipoprotein structurethat is not presently available. One apparent contradiction
'Dimensions refer to measurements of width from scalemolecular models and are not intended to reflect the mea-surement of the fatty acids in situ.
arises from the finding that the fatty acids of the lipidsin HDL are altered by diet just as in the case of LDL,yet unsaturated fat does not lower the concentration ofHDL cholesterol and phospholipid. Although HDL pro-tein has not been quantified during saturated and un-saturated fat feedings, let us assume that, since thelipid contents of HDL are unaltered, there has been nochange in their lipid/protein ratio. Why, then, shouldthe lipid capacity of HDLbe governed by considerationsdifferent than for LDL? Marked differences in lipidcomposition between the two types of lipoproteins indi-cate that there are important differences in their struc-ture that could account for the differences in responseto dietary fat exchange. Perhaps most important forpresent consideration is the much lower lipid to proteinratio in HDL. It is conceivable that the number of lipidmolecules that can be accommodated by an apoproteinwill be determined by the configuration of the lipid onlywhen the carrying capacity of the apoprotein is at ornear saturation, the situation that probably is presentin LDL, but which may not be in HDL. Meaningfulconsideration of this line of reasoning must await fur-ther knowledge of the details of structure of both typesof lipoproteins.
The effects of drugs and low-fat diets on lipid/pro-tein ratios in lipoproteins have not yet been evaluated.If the change in lipid/protein ratio in LDL found inthis study is unique, it would provide further supportfor the proposed hypothesis. If, on the other hand,changes in this ratio generally parallel lowering ofplasma lipids, one must assume either that configura-tional effects are not critical in the lipid-lowering effectof unsaturated fat, or that this is only one of severalmechanisms by which the amount of lipid transportedby LDL apoprotein can be altered. Further investiga-tions designed to answer the questions raised by theseconsiderations could provide information concerningthe mechanisms of lipid-lowering procedures as well asto the nature of lipid/protein associations in lipoproteins.
ACKNOWLEDGMENTSWe are deeply indebted to Dr. E. H. Ahrens, Jr., for hishelp and guidance throughout this study. The excellenttechnical assistance of Mrs. Vivian Leonard, Mrs. GloriaRabkin, and Miss Barbara Geyer is also gratefully acknowl-edged, as is the cooperation and efforts of the Nursing,Dietary, and Medical Staffs of the Hospital of The Rocke-feller University and the Cornell Medical Division ofBellevue Hospital.
Dr. Spritz is a Career Scientist of the Health ResearchCouncil of New York (1-476). Dr. Mishkel is a SeniorFulbright Research Scholar. This study was supported inpart by U. S. Public Health Service grants HE-0622 andNB-03346 and in part by U. S. Public Health Service GrantFR-00102 from the General Clinical Research Center Branchof the Division of Research Facilities and Resources.
Dietary Fat and Plasma Lipids 85

REFERENCES
1. Spritz, N. 1967. A model for lipoprotein structure basedon the phospholipid-lowering effects of unsaturateddietary fat. Circulation. 36: 38. (Abstr.)
2. Connor, W. E., D. B. Stone, and R. E. Hodges. 1964.The interrelated effects of dietary cholesterol and fatupon human serum lipid levels. J. Clin. Invest. 43: 1691.
3. Beveridge, J. M. R., W. F. Connell, and G. A. Mayer.1957. The nature of the substances in dietary fat affect-ing the level of plasma cholesterol in humans. Can. J. Bio-chem. 35: 257.
4. Spritz, N., S. Grundy, and E. H. Ahrens, Jr. 1965. Sterolbalance in man as plasma cholesterol concentrations arealtered by exchanges of dietary fat. J. Clin. Invest. 44:1482.
5. Ahrens, E. H., Jr., J. Hirsch, W. Insull, Jr., T. T.Tsaltas, R. Blomstrand, and M. L. Peterson. 1957. Theinfluence of dietary fats on serum lipid levels in man.Lancet. 1: 943.
6. Keys, A., J. T. Anderson, and F. Grande. 1957. Serumcholesterol response to dietary fat. Lancet. 1: 787.
7. Wood, P. D. S., R. Shioda, and L. W. Kinsell. 1966.Dietary regulation of cholesterol metabolism. Lancet. 2:604.
8. Connor, W. E., D. T. Witiak, D. B. Stone, and M. L.Armstrong. 1967. Cholesterol balance in normal man fedfat of different fatty acid composition. Circulation. 36:6. (Abstr.)
9. Hellman, L., R. S. Rosenfeld, W. Insull, Jr., and E. H.Ahrens, Jr. 1957. Intestinal excretion of cholesterol: amechanism for regulation of plasma levels. J. Clin.Invest. 36: 898. (Abstr.)
10. Grundy, S. M., and E. H. Ahrens, Jr. 1966. An evalua-tion of the relative merits of two methods for measuringthe balance of sterols in man: isotopic balance versuschromatographic analysis. J. Clin. Invest. 45: 1503.
11. Avigan, J., and D. Steinberg. 1965. Sterol and bile acidexcretion in man and the effects of dietary fat. J. Clin.Invest. 44: 1845.
12. Bieberdorf, F. A., and J. D. Wilson. 1965. Studies onthe mechanism of action of unsaturated fats on cholesterolmetabolism in the rabbit. J. Clin. Invest. 44: 1834.
13. Ahrens, E. H., Jr., V. P. Dole, and D. H. Blankenhorn.1954. The use of orally fed liquid formulas in metabolicstudies. Amer. J. Clin. Nutr. 2: 336.
14. Hatch, F. T., and R. S. Lees. 1968. Practical methods forplasma lipoprotein analysis. Advan. Lipid Res. 6: 1.
15. Fredrickson, D. S., R. I. Levy, and R. S. Lees. 1967.Fat transport in lipoproteins-an integrated approach tomechanisms and disorders. N. Engl. J. Med. 276: 32.
16. Abell, L. L., B. B. Levy, B. B. Brodie, and F. E. Ken-dall. 1952. A simplified method for the estimation oftotal cholesterol in serum and demonstration of itsspecificity. J. Biol. Chem. 195: 357.
17. Van Handel, E. 1961. Suggested modifications of micro-determination of triglycerides. Clin. Chem. 7: 249.
18. Stewart, C. P., and E. B. Hendry. 1935. Phospholipins ofblood. Biochem. J. 29: 1683.
19. Lowry, 0. H., N. J. Rosebrough, A. L. Farr, and R. J.
Randall. 1951. Protein measurement with the Folinphenol reagent. J. Biol. Chem. 193: 265.
20. Mangold, H. K. 1961. Thin-layer chromatography oflipids. J. Amer. Oil Chem. Soc. 38: 708.
21. Metcalfe, I. D., and A. A. Schmitz. 1961. The rapidpreparation of fatty acids esters for gas chromatographicanalysis. Anal. Chem. 33: 363.
22. Lieber, C. S., N. Spritz, and L. M. De Carli. 1966. Roleof dietary, adipose, and endogenously synthesized fattyacids in the pathogenesis of the alcoholic fatty liver.J. Clin. Invest. 45: 51.
23. Havel, R. J., H. A. Eder, and J. H. Bragdon. 1955. Thedistribution and chemical composition of ultracentrifugallyseparated lipoproteins in human serum. J. Clin. Invest. 34:1345.
24. Skipski, V. P., M. Barclay, R. K. Barclay, V. A. Fetzer,J. J. Good, and F. M. Archibald. 1967. Lipid compositionof human serum lipoproteins. Biochem. J. 104: 340.
25. Van Golde, L. M. G., V. Tomasi, and L. L. M. VanDeenen. 1967. Determination of molecular species oflecithin from erythrocytes and plasma. Chem. Phys.Lipids. 1: 282.
26. Nutter, L. J., and 0. S. Privett. 1966. Phospholipase Aproperties of several snake venom preparations. Lipids.1: 258.
27. Mattson, F. H., and R. A. Volpenhein. 1961. The use ofpancreatic lipase for determining the distribution of fattyacids in partial and complete glycerides. J. Lipid Res. 2:58.
28. Sribney, M., and E. P. Kennedy. 1958. The enzymaticsynthesis of sphingomyelin. J. Biol. Chem. 233: 1315.
29. Kayden, H. J., A. Karmen, and A. Dumont. 1963.Alterations in the fatty acid composition of human lymphand serum lipoproteins by single feedings. J. Clin. Invest.42: 1373.
30. Blomstrand, R., and 0. Dahlback. 1960. The fatty acidcomposition of human thoracic duct lymph lipids. J. Clin.Invest. 39: 1185.
31. Ahrens, E. H., Jr., W. Insull, Jr., J. Hirsch, W. Stoffel,M. L. Peterson, J. W. Farquhar, T. Miller, and H. J.Thomasson. 1959. The effect on human serum lipids ofa dietary fat, highly unsaturated, but poor in essentialfatty acids. Lancet. 1: 115.
32. Hallgren, B., S. Stenhagen, A. Svanloory, and L. Sven-nerholm. 1960. Gas chromatographic analysis of the fattyacid composition of the plasma lipids in normal anddiabetic subjects. J. Clin. Invest. 39: 1424.
33. Farquhar, J. W., and M. Sokolow. 1958. Response ofserum lipids and lipoproteins of man to beta-sitosteroland safflower oil. Circulation. 17: 890.
34. Nichaman, M. Z., C. C. Sweeley, and R. E. Olson. 1967.Plasma and fatty acids in normolipemic and hyperlipemicsubjects during fasting and after linoleate feeding.Amer. J. Clin. Nutr. 20: 1057.
35. Oncley, J. L., K. W. Walton, and D. G. Cornwell. 1957.A rapid method for the bulk isolation of p-lipoproteinsfrom human plasma. J. Amer. Chem. Soc. 79: 4666.
36. Demel, R. A., L. L. M. Van Deenen, and B. A. Pethica.1967. Monolayer interactions of phospholipids and cho-lesterol. Biochim. Biophys Acta. 135: 11.
86 N. Spritz and M. A. Mishkel