Linked Financial Statement Presentation · Linked Financial Statement Presentation Lisa Koonce...
39
Linked Financial Statement Presentation Lisa Koonce [email protected] Zheng Leitter [email protected] Brian White [email protected] Department of Accounting McCombs School of Business The University of Texas at Austin Austin, TX 78712 April 6, 2017 We thank workshop participants at the following schools for their helpful comments on a prior version of this paper: Bern, Erasmus, Iowa, Kentucky, and Texas-Austin. We gratefully acknowledge funding from the Eugene and Dora Bonham Endowment Fund and the Deloitte Foundation.
Transcript of Linked Financial Statement Presentation · Linked Financial Statement Presentation Lisa Koonce...

Linked Financial Statement Presentation
Lisa Koonce [email protected]
Zheng Leitter [email protected]
Brian White [email protected]
Department of Accounting McCombs School of Business
The University of Texas at Austin Austin, TX 78712
April 6, 2017
We thank workshop participants at the following schools for their helpful comments on a prior version of this paper: Bern, Erasmus, Iowa, Kentucky, and Texas-Austin. We gratefully acknowledge funding from the Eugene and Dora Bonham Endowment Fund and the Deloitte Foundation.

Linked Financial Statement Presentation
Abstract Certain financial statement items, such as those in hedging relationships, are closely related. Standard setters struggle to define the appropriate presentation format for these related items. Linked presentation—a format that presents financial statement items adjacent to one another at their disaggregated amounts—is often discussed as a possible format for related items, as an alternative to separate or net presentation. In this study, we experimentally test investors’ reactions to a fair value hedge in which the hedged asset and the hedging instrument are presented in linked, separate or net formats. We find that investors’ risk assessments capture differences in hedge effectiveness (low versus high) only under linked presentation; investors do not discriminate between low and high hedge effectiveness under either separate or net presentation. Our results should be informative to standard setters interested in improving reporting for related financial statement items. Keywords: financial statements, linked presentation, causal reasoning Data availability: Contact the authors
1
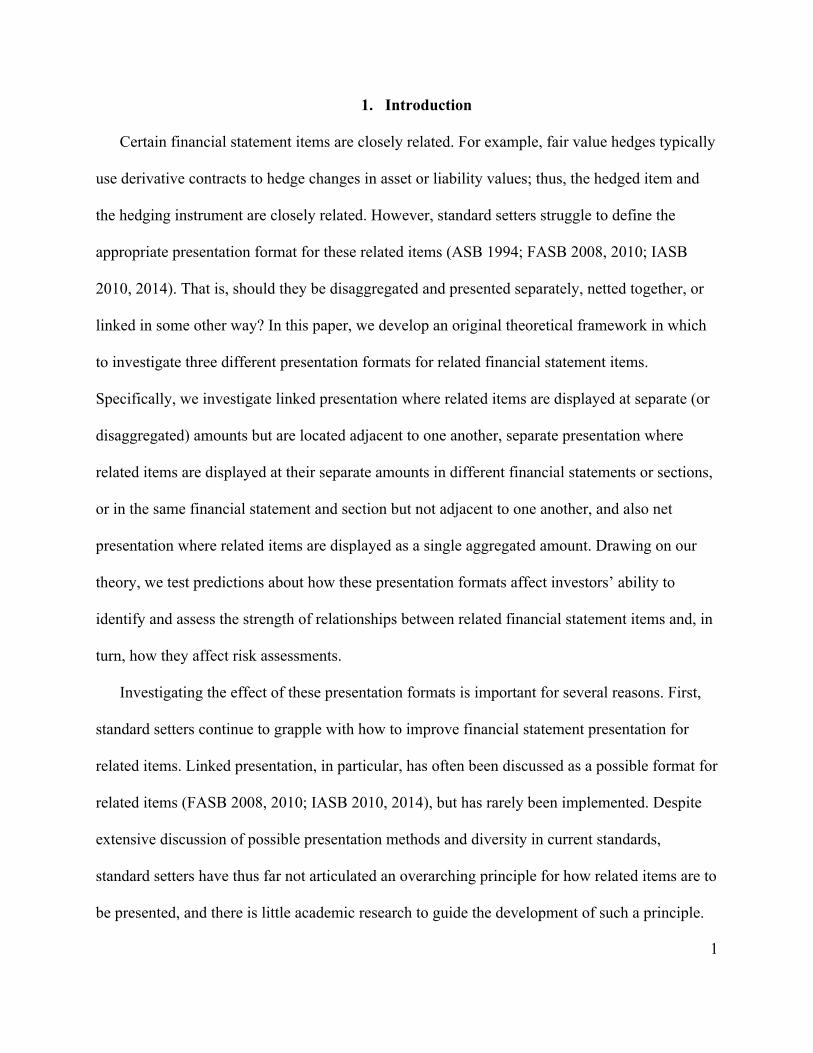
1. Introduction
Certain financial statement items are closely related. For example, fair value hedges typically
use derivative contracts to hedge changes in asset or liability values; thus, the hedged item and
the hedging instrument are closely related. However, standard setters struggle to define the
appropriate presentation format for these related items (ASB 1994; FASB 2008, 2010; IASB
2010, 2014). That is, should they be disaggregated and presented separately, netted together, or
linked in some other way? In this paper, we develop an original theoretical framework in which
to investigate three different presentation formats for related financial statement items.
Specifically, we investigate linked presentation where related items are displayed at separate (or
disaggregated) amounts but are located adjacent to one another, separate presentation where
related items are displayed at their separate amounts in different financial statements or sections,
or in the same financial statement and section but not adjacent to one another, and also net
presentation where related items are displayed as a single aggregated amount. Drawing on our
theory, we test predictions about how these presentation formats affect investors’ ability to
identify and assess the strength of relationships between related financial statement items and, in
turn, how they affect risk assessments.
Investigating the effect of these presentation formats is important for several reasons. First,
standard setters continue to grapple with how to improve financial statement presentation for
related items. Linked presentation, in particular, has often been discussed as a possible format for
related items (FASB 2008, 2010; IASB 2010, 2014), but has rarely been implemented. Despite
extensive discussion of possible presentation methods and diversity in current standards,
standard setters have thus far not articulated an overarching principle for how related items are to
be presented, and there is little academic research to guide the development of such a principle.

2
Our study thus provides new theory and empirical evidence on possible presentation formats as
input to standard setters considering how to present related financial statement items.1
Second, financial reports have become more voluminous and complex over time (ACCA
2009; Libby and Emmett 2014; Loughran and McDonald 2014). Because of this, it arguably
becomes more difficult for investors to observe relationships between financial statement items.
Thus, investigating presentation formats that make these relationships easier to identify and
assess provides important input to regulators and standard setters as they consider how to
manage complexity and potentially simplify financial reports, while maintaining or improving
their usefulness for investors (e.g., FASB 2015; SEC 2013)
To investigate these issues, we first develop a theoretical framework in which to address how
presentation can help investors to better understand how financial statement accounts are related.
To do this, we draw on causal reasoning theory from psychology. This theory states that two
cues to causality—contiguity and congruity—help individuals understand relationships among
items (Einhorn and Hogarth 1986). Contiguity refers to the proximity in location or time in
which events are observed or occur, while congruity refers to similarity in the strength or
magnitude of the events. We hypothesize that investors’ ability to appropriately judge risk will
be maximized when contiguity is at an intermediate level (i.e., linked presentation), as in that
circumstance they will maximize the ease with which they can judge congruity (i.e., discriminate
between low and high hedge effectiveness).
1 We do not address the question of what items in the financial statements are related. To some degree, all items are related given that most businesses carry out a cohesive set of activities to earn profits. On the other hand, some items within the financial statements are more related than others. For example, cash and accounts payable are arguably more related than are accounts payable and accumulated depreciation.

3
The basis for this argument is grounded in our hypothesis that the relationship between
contiguity and the ease of judging congruity is an inverse U-shape. That is, when contiguity is
low (i.e., two items are presented separately), it is difficult for investors to ascertain that those
two items are necessarily related. Because of this, they will be unlikely to judge congruity (i.e.,
ascertain hedge effectiveness). At the other extreme, when contiguity is high (i.e., two items are
presented net), investors can easily ascertain that two items are related, but they are unable to
judge congruity. That is, although they can see changes in the net amount of the two items, such
changes may result from changes in either or both items. Thus, it is difficult to precisely
ascertain the effectiveness of the hedging relationship. Only in the case where contiguity is at an
intermediate level (i.e., linked presentation) will investors’ ability to judge congruity be
maximized. In this case, they can easily judge the two items that are related by their close
physical location; in addition, because the items are separately reported (i.e., disaggregated), they
can also easily judge congruity (i.e., ascertain hedge effectiveness).
To investigate our ideas, we conduct an experiment set within a derivatives context—
specifically, a fair value hedging context. Our experiment relies on a 3 × 2 between-participants
design. Our first manipulation is whether two accounts relevant to hedging—namely, inventory
and derivatives—are presented in a linked, separate or net presentation format. Our second
manipulation is whether hedge effectiveness is high (100% effective) or low (50% effective). We
ask participants, who have prior experience with investing and prior knowledge about financial
instruments, to render judgments about the risk associated with the value of the inventory. We
focus on risk assessments as they represent a critical judgment in both valuation and contracting
decisions (Penman 2013).

4
The results from the experiment support our prediction. We find that investors’ risk
assessments reflect the consequences of hedge effectiveness (i.e., low versus high) only under
linked presentation. In contrast, when presentation is separate or net, investors’ risk assessments
do not discriminate between the two levels of hedge effectiveness. Results from other measures
also support the theory underlying our hypothesis. For example, we find evidence in support of
the inverse U-shaped relation between contiguity and investors’ ability to judge congruity.
Specifically, as investors’ perceptions of contiguity increase from separate to linked to net
presentation, the ease with which they are able to judge the relation between the hedged item and
the hedging instrument first increases (from separate to linked) and then decreases (from linked
to net). Overall, results support the theoretical prediction that linked presentation allows
investors to both identify related items and determine the strength of the relationship between
those items, while separate and net presentations only allow one of these aspects to be
ascertained.
A follow-on experiment tests the possibility that providing additional information, outside of
the balance sheet, might allow investors given net presentation to overcome the extreme
contiguity between the two accounts which, in turn, affects their ability to judge congruity. To
address this idea, we relied on the same instrument described earlier and conducted a 2 × 2
between-participants design with hedge effectiveness at two levels (high and low) and
presentation at two levels (linked presentation and net presentation with note disclosure). Results
indicate that additional note disclosure does, to some extent, overcome the difficulties faced by
investors with net presentation. While investors with net presentation and note disclosure render
risk judgments that mimic those of investors provided with linked presentation, their projections
of the hedging instrument’s future value still reflect difficulties with judging congruity.

5
Our study has implications for standard setters and researchers. For standard setters, we
provide empirical evidence in an area where inconsistency currently exists in practice and where
an overarching principle has not yet been articulated. Inconsistency currently exists in areas as
simple as receivables and fixed assets, as both linked presentation and net presentation are now
used for presentation of the related contra-accounts (i.e., allowance for doubtful accounts;
accumulated depreciation). Although standard setters have and continue to deliberate these
presentation formats, they have made little headway. For example, linked presentation has been
discussed as an alternative to both separate and net presentation for variable interest/special
interest entities (FASB 2008), lessor accounting (FASB 2010), hedging (IASB 2010), and
emissions trading (IASB 2014).
Our study informs standard setters because we show that investors must be able to first
identify the related accounts before they can assess the strength of that relationship. Our theory
and results reveal that linked presentation maximizes investors’ ability to do both (i.e.,
identification and strength assessment). While we investigate linked presentation in a hedging
context, our results have the potential to influence policy for a broad range of financial reporting
issues where identification of relationships and assessment of their strength is important, such as
those areas, noted above, where linked presentation has already been discussed.
For researchers, our study contributes to the literature on financial statement presentation
effects. We extend the literature by offering a new theoretical framework for understanding
linked, separate and net presentation formats. Specifically, we develop the new insight about
how two cues to causality—contiguity and congruity—interact to affect investors’ ability to
make various forward-looking judgments, including risk assessment. Moreover, we add to the
literature by demonstrating that not all types of disaggregated data presentations have the same

6
effects on investors’ judgments. That is, while both separate and linked presentation formats
represent disaggregated presentations, they affect investors’ judgments quite differently.
This paper is organized as follows. In Section 2, we define the three presentation formats in
more detail, review the relevant professional and academic literature, and develop our theoretical
prediction. Section 3 describes our primary experiment, and Section 4 presents its results.
Section 5 discusses an additional experiment. Section 6 concludes the paper.
2. Background and Theory
2.1 Separate, net and linked presentation—definitions
Although there is diversity in standards regarding the presentation of various items in
financial statements, neither the FASB nor the IASB has articulated an overarching principle for
how items are to be presented. Further, neither have provided a complete set of definitions for
these formats (a noteworthy exception being the FASB’s definition of net presentation, which we
discuss further below).
We offer definitions of the presentation formats that are currently found in practice. Separate
presentation involves items presented in different locations; either in different financial
statements, in different sections of a single financial statement, or in the same financial statement
and section but not adjacent to one another. For example, cash and accounts payable are
normally presented separately, as cash is within assets and accounts payable is within liabilities
on the balance sheet.
Net presentation involves items being aggregated and presented in the financial statements as
a single amount. This definition is similar to the FASB’s definition of net presentation as “all
circumstances when an item could be presented separately as an element of financial statements
and is combined would be considered, for our discussion, a net presentation” (FASB 2012). For

7
example, accounts receivable and the related allowance for doubtful accounts are often disclosed
on the balance sheet in net presentation format.
Finally, linked presentation involves presenting items adjacent to one another, perhaps also
with indentation or other formatting that links the items. For example, the allowance for doubtful
accounts is sometimes not netted against accounts receivable but is shown as a separate line item
in what we would refer to as linked presentation. Linked presentation thus captures elements of
both separate and net presentation. Specifically, like separate presentation, linked presentation is
a form of gross presentation that does not aggregate accounts. Unlike separate presentation, but
similar to net presentation, linked presentation clearly presents items as being related.
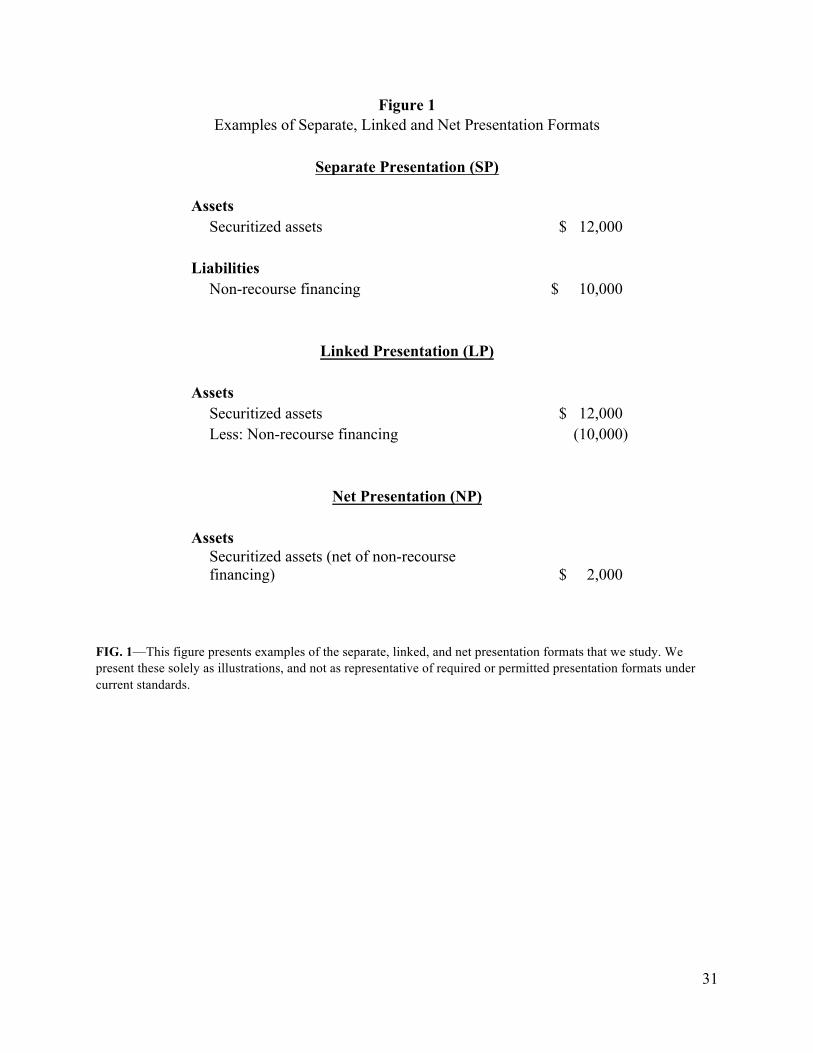
To illustrate the three concepts, Figure 1 provides examples of separate, linked and net
presentation for non-recourse financing and securitized assets.
------------------------------------ Insert Figure 1 about here
------------------------------------
2.2 Linked presentation in accounting standards
Linked presentation has been discussed by standard setters for several types of related
financial statement items. Table 1 presents five areas where linked presentation has received
significant consideration.2 Specifically, the UK Accounting Standards Board (ASB) adopted
linked presentation for non-recourse financing arrangements in the old UK GAAP standard FRS
5 (ASB 1994). Subsequently, linked presentation has been considered, but thus far not adopted,
by the FASB and the IASB in several areas, including variable interest and special purpose
2 Although linked presentation is commonly observed in practice for the allowance for doubtful accounts (linked to accounts receivable) and accumulated depreciation (linked to depreciable assets), linked presentation is not explicitly defined or addressed in standards for these items. In both cases, US GAAP requires only that the amount be disclosed “separately on the balance sheet or in a note thereto” (ASC 210-10-S99-1 [FASB 2016]).

8
entities (FASB 2008), leases (FASB 2010), hedging (IASB 2010), and emissions trading (IASB
2014).
------------------------------------ Insert Table 1 about here
------------------------------------
As shown in the final two columns of Table 1, standard setters have conjectured about both
benefits and potential problems associated with linked presentation. Benefits focus on linked
presentation as a middle ground between separate and net presentation, highlighting the
relationship between linked items while also providing information about their separate amounts.
Potential problems have focused on measurement issues and users’ ability to interpret linked
items appropriately. However, standard setters have thus far had little theory or empirical
evidence on which to base discussions of linked presentation.
2.3 Prior literature on disaggregation
Disaggregation plays a role in distinguishing among separate, net, and linked presentation.
Specifically, separate and linked presentation show information in a disaggregated format (but in
different locations), while that same information is shown in an aggregated format in net
presentation.
The notion of disaggregation has been studied in the prior literature, but with some lack of
specificity about the location of disaggregated items. For example, Hales, Venkataraman and
Wilks (2011) operationalize disaggregation as two line items presented adjacent to each other
(i.e., linked presentation under our definition). However, Bonner et al. (2014) define
disaggregation as “separately presenting the underlying components of one or more items in the
financial statements.” Because this definition does not specify the degree of separation among

9
the underlying components, it could include both linked and separate presentation formats
according to our definitions.
Further, the ways in which disaggregated information influences investors have been
investigated in a number of other studies. Briefly, this prior research on aggregation and
disaggregation indicates that disaggregated information is perceived to be more reliable,
credible, and transparent (Hirst, Koonce and Venkataraman 2007; Barth and Schipper 2008;
Libby and Brown 2012), and can make certain information more salient (Elliott, Hobson and
Jackson 2011; Clor-Proell, Proell and Warfield 2014), especially when disaggregated
information is paired with cohesive classification (Bloomfield, Hodge, Hopkins and Rennekamp
2014). Investors are also less likely to fixate on summary measures when information is
disaggregated (Elliott et al. 2011; Hales et al. 2012).
In sum, because the prior studies do not investigate the issue of location of the disaggregated
information (as we do), they are unable to address the issue of how the presentation of related
accounts influences investors. Our study shows that not all disaggregation has the same impact
on investors’ judgments.
2.4 Theory and hypothesis development
2.4.1 Causal reasoning theory
Causal reasoning is the process by which people infer causal relations. Theory on causal
reasoning indicates that individuals assess causal relationships by using “cues to causality”
(Einhorn and Hogarth 1982, 1986; Koonce, Seybert and Smith 2011). These cues include
covariation, temporal order, contiguity in time and space, and congruity (or similarity) between
the length and strength of causally-related events. Individuals use these cues to assess the logic
and strength of potential causal relations. Because the relation between each cue and causality is

10
probabilistic rather than deterministic, individuals may use more than one cue to assess a
relationship. When multiple cues point to a similar relationship between a suspected cause and
effect, the judged certainty and strength of the causal relationship increase (Koonce et al. 2011).
Two cues to causality—contiguity and congruity—are particularly relevant in a financial
statement context. Contiguity refers to the proximity in time or space in which events occur or
are observed. For example, consider the time and space between pressing a car’s brake pedal and
the car stopping. The closer in time (i.e., the car stops immediately after the brake is pressed
versus not immediately after) and space (i.e., the brake pedal is physically located in the car that
stops versus being somewhere outside the car), the stronger the association between the brake
pedal and stopping appears to be. Thus, higher contiguity is often associated with a stronger or
more likely causal relation. However, this is only true up to a point. Theory also suggests that
“too much” contiguity could weaken the causal inference. In other words, when contiguity is
extreme (i.e., the cause and effect are isomorphic and no longer distinguishable from each other),
then the cue is no longer meaningful (Einhorn and Hogarth 1986).
Congruity refers to the similarity between cause and effect, either in the degree of physical
resemblance or in magnitude. Without this cue, it is more difficult to distinguish stronger
relationships from weaker ones. In the car example above, congruity is the similarity between the
force with which the brake pedal is pressed and the rate at which the car decelerates and stops. In
this case, high congruity means that when the brake pedal is pressed with greater force, the car
stops faster. Individuals generally expect causes and effects to be related in this way (Einhorn
and Hogarth 1986).
11
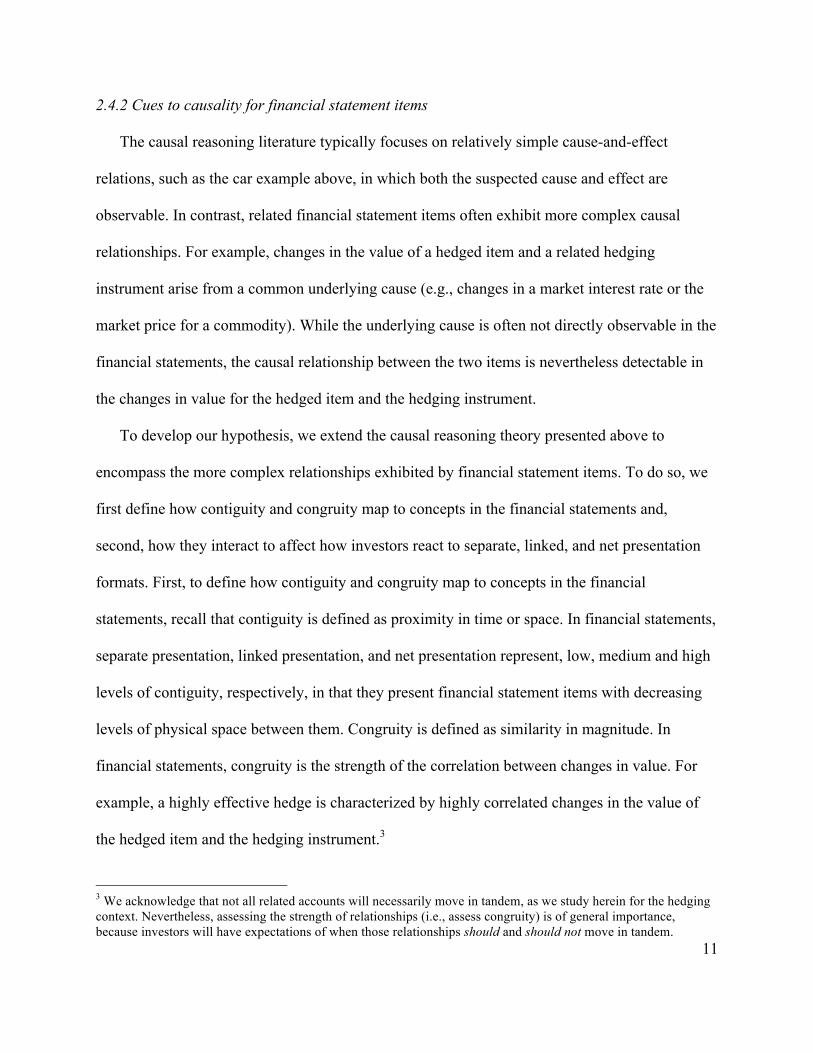
2.4.2 Cues to causality for financial statement items
The causal reasoning literature typically focuses on relatively simple cause-and-effect
relations, such as the car example above, in which both the suspected cause and effect are
observable. In contrast, related financial statement items often exhibit more complex causal
relationships. For example, changes in the value of a hedged item and a related hedging
instrument arise from a common underlying cause (e.g., changes in a market interest rate or the
market price for a commodity). While the underlying cause is often not directly observable in the
financial statements, the causal relationship between the two items is nevertheless detectable in
the changes in value for the hedged item and the hedging instrument.
To develop our hypothesis, we extend the causal reasoning theory presented above to
encompass the more complex relationships exhibited by financial statement items. To do so, we
first define how contiguity and congruity map to concepts in the financial statements and,
second, how they interact to affect how investors react to separate, linked, and net presentation
formats. First, to define how contiguity and congruity map to concepts in the financial
statements, recall that contiguity is defined as proximity in time or space. In financial statements,
separate presentation, linked presentation, and net presentation represent, low, medium and high
levels of contiguity, respectively, in that they present financial statement items with decreasing
levels of physical space between them. Congruity is defined as similarity in magnitude. In
financial statements, congruity is the strength of the correlation between changes in value. For
example, a highly effective hedge is characterized by highly correlated changes in the value of
the hedged item and the hedging instrument.3
3 We acknowledge that not all related accounts will necessarily move in tandem, as we study herein for the hedging context. Nevertheless, assessing the strength of relationships (i.e., assess congruity) is of general importance, because investors will have expectations of when those relationships should and should not move in tandem.
12
Second, in terms of how contiguity and congruity interact to affect investors, we posit the
original idea that the relationship between contiguity and investors’ ability to judge congruity is
an inverse U-shape. This relationship is depicted in Figure 2.
------------------------------------ Insert Figure 2 about here
------------------------------------
Under separate presentation, contiguity is low, as noted above. We argue that in this
situation, it will be difficult for investors to ascertain that the two items are necessarily related.
Because they are unlikely to associate the two accounts, they naturally will not be inclined to
judge congruity. That is, in a hedging context, they will be less likely to ascertain hedge
effectiveness.
In contrast, when two items are presented in a net fashion, contiguity is high. In fact,
contiguity is so high in the case of net presentation that the two items cannot be separately
identified. In this situation, investors can easily ascertain that two items are related (as they are
so close physically), but they will have much more difficulty judging congruity. Because of the
effects of netting, they will only observe the net change in the value of the underlying two
financial statement items. That is, they are unable to observe whether changes in value are
caused by the hedged item, the hedging instrument, or a combination of both. As a result, it is
more difficult to judge similarity in magnitude—the effectiveness of the hedge.
Finally, in the case of linked presentation, contiguity is at an intermediate level. Hence,
investors will be likely to judge that two items are related given their relatively close physical
location. Further, because they are presented in a disaggregated fashion, they will be able to
easily judge congruity. That is, they will find it easy to ascertain hedge effectiveness.

13
Because hedge effectiveness can affect the volatility of a company’s performance, investors
who ascertain hedge effectiveness are likely to make different risk assessments than those who
do not ascertain hedge effectiveness. Thus, we expect investors’ risk assessments to differ based
on whether two items in a hedging relationship are presented in separate, linked or net
presentation format. Specifically, we expect the largest difference between high and low hedge
effectiveness when the hedged items are presented in linked presentation format. These ideas are
summarized in the following hypothesis.
Hypothesis: Under linked presentation format, the difference in investors’ risk assessments between high versus low hedge effectiveness is significantly larger than under separate or net presentation format.
3. Experiment 3.1 Participants
One hundred seventy individuals participated in the study in return for a small fixed
payment. The participants had an average of 7.2 years of work experience. Sixty-six percent of
participants had previously made investments in common stocks, and ninety-two percent had
either invested or planned to invest in common stocks in the future. Participants—who were
enrolled in a part-time weekend MBA program—had taken an average of 3.6 finance and 2.8
accounting classes. Participants were paid $10 in return for their participation.
3.2 Design and Manipulations
Our experiment had a 3 × 2 between-participants design. As explained in more detail below,
we manipulated both presentation format (separate, linked, and net) and hedge effectiveness
(high and low). The experimental materials focused on an energy company. Participants were
told that the company’s largest asset was its inventory, as the company held a large amount of
inventory in oil-related resources. Furthermore, they were told that the company held financial

14
instruments such as derivatives that the company actively utilized to reduce the impact of market
fluctuations on the value of all of its inventory due to expected fluctuations in oil prices.
All participants then received excerpts from quarterly balance sheets for the four quarters of
the most recent fiscal year and were reminded again that these balance sheets include the
company’s positions in oil-related inventories and derivatives. These quarterly balance sheets
contained our two manipulations (see appendix for details).
The presentation format manipulation followed our earlier definitions. The separate
presentation format displayed the inventory and derivative contracts accounts in a disaggregated
fashion in two different locations—specifically, in the asset and liability sections. The linked
presentation format displayed the inventory and derivative contracts accounts at their separate
amounts adjacent to each other, with the line item labeled “Less: Derivative contracts” directly
underneath the “Inventory” line item. The net presentation format showed the inventory account
balance net of the derivative account balance, with the label “Inventory (net of derivative
contracts).”
We manipulated hedge effectiveness at two levels: 100% (high effectiveness) and 50% (low
effectiveness). We held constant the inventory account balances across all conditions, and varied
the value of the derivative contract. At 100% hedge effectiveness, changes in the inventory
account were completely offset by the changes in the derivative contracts account. At 50% hedge
effectiveness, the changes in the derivative contracts account only offset half of the changes in
the inventory account. We chose 100% and 50% effectiveness to facilitate participants’ assess-
ments of hedge effectiveness, while also representing an economically meaningful difference.

15
3.3 Procedure and dependent measures
Participants first read a brief description of the company and provided an initial judgment
about the overall risk they believe the company faced with respect to the value of the company’s
inventory. Consistent with prior literature (e.g. Koonce, Lipe and McAnally 2005, 2008),
participants made these risk assessments on 101-point scales, with 0 labeled “very low risk” and
100 labeled “very high risk.” Following the initial risk assessment, participants were randomly
assigned to one of the six conditions that varied by presentation format and hedge effectiveness.
After reviewing the quarterly balance sheets, participants again assessed the risk that the
company faced with respect to the value of the company’s inventory, on the same 101-point
scales described above. By collecting both pre- and post-manipulation judgments about risk, we
are able to control for each participant’s initial risk assessment, thereby capturing the strength of
each participant’s reaction to the disclosure containing our manipulations.
Participants then responded to several additional questions. These included measures
designed to capture the contiguity and congruity constructs underlying our theory, as well as
some additional questions that allow us to provide further evidence on linked presentation as a
causal cue. Finally, participants completed manipulation checks and provided demographic
information.
4. Results 4.1 Manipulation and comprehension checks
We asked two questions to confirm that our manipulations were successful. To confirm that
our presentation format manipulation was successful, we asked participants to select the
presentation format they saw in the company’s quarterly balance sheets from three layouts that
corresponded to the separate, linked, and net presentation formats in our materials. Over 95% of

16
participants correctly selected the presentation format they were given, indicating a successful
manipulation of presentation format.
To confirm that the hedge effectiveness manipulation was successful, we asked participants
to recall the account balances they saw earlier and select between two sets of account balances
that corresponded to the high and low hedge effectiveness manipulation. Over 98% of the
participants correctly selected the account balances to which they were assigned, indicating a
successful manipulation of hedge effectiveness.4
Finally, as a comprehension check to ensure that all participants understood the concept of a
fair value hedge as described in the background information, we also asked how likely it was that
changes in the values of both the inventory and derivative accounts were linked to oil-price
fluctuations. Participants responded on a 101-point scale, with endpoints of 0 (“Not at all likely”)
and 100 (“Very likely). The overall mean was 75.68—which was significantly higher than the
midpoint of the scale (t168 = 15.61, p < 0.01)—indicating a high level of understanding that both
account values were linked to changes in oil prices. Further, responses to this comprehension
check did not differ across conditions (all p > 0.10), as one would expect.
4.2 Hypothesis tests
Our hypothesis predicts that compared with separate or net presentation, linked presentation
will lead to a greater difference between risk assessments under high and low hedge
effectiveness. In statistical terms, this prediction implies a significant two-way interaction (of a
particular form) between presentation format and hedge effectiveness.
4The results of our hypothesis test are inferentially identical if we exclude responses from participants who failed these manipulation checks.
17
Our primary dependent variable in testing our hypothesis is participants’ risk assessments
after reviewing the company’s balance sheets, while controlling statistically for their pre-
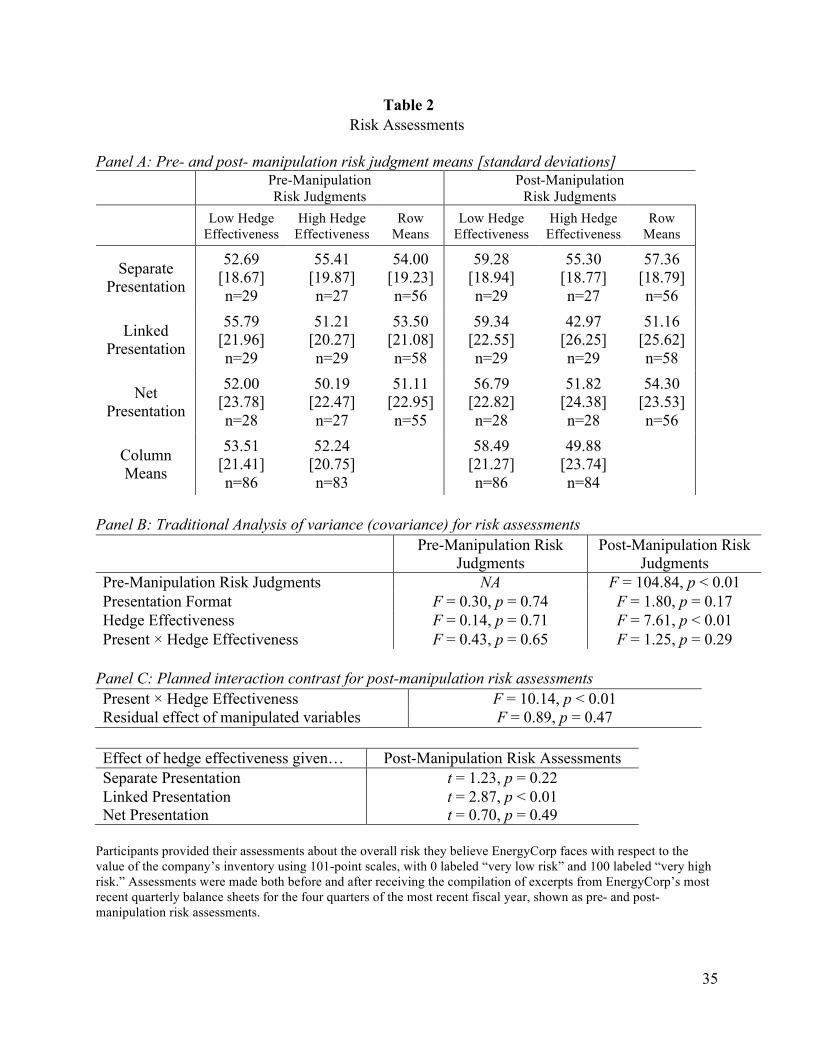
manipulation risk assessments.5 Panel A of Table 2 presents descriptive statistics for the pre- and
post-manipulation risk assessments, while Figure 3 graphs the post-manipulation risk assessment
means.
-------------------------------------------- Insert Table 2 & Figure 3 about here --------------------------------------------
Panel B of Table 2 shows the conventional analysis of variance (ANOVA) for the pre-
manipulation risk assessments and the conventional analysis of covariance (ANCOVA) for the
post-manipulation risk assessments using pre-manipulation risk assessments as a covariate.
These conventional analyses present default main effects and a disordinal interaction test.
Accordingly, Panel C of Table 2 is most pertinent to our purposes and presents the results of a
specific interaction contrast that we hypothesize as well as the follow-up simple effect tests.
Because we predict an ordinal interaction—that is, an asymmetric pattern of cell means—
contrast coding is the most appropriate ad most powerful means of testing our hypotheses
(Buckless and Ravenscroft 1990; Guggenmos et al 2017). Consistent with our predictions,
contrast weights are 1 and -1 in the two separate presentation conditions, 1 and -1 in the two net
presentation conditions, and 3 and -3 in the two linked presentation conditions. With these
contrast codes, we not only allow for a main effect between the high and low hedge effectiveness
5 Recall that participants made risk assessments both before and after reviewing balance sheets for the four quarters of the most recent fiscal year. One participant did not respond to the pre-risk measure. Thus analyses that include this measure are based on 169 participants. In addition, results of analyses using the change from pre- to post-manipulation risk assessments as the dependent measure are inferentially identical to those reported here.

18
conditions (which is shown in the conventional analysis of variance) but also a specific type of
interaction effect between hedge effectiveness and presentation.6
As shown in Panel C, we see that the planned interaction contrast is statistically significant
(F1,162 = 10.14, p < 0.01), consistent with our main and interaction effect prediction. Further, the
residual variation not captured by the planned contrast is insignificant (F4,162 = 0.89, p = 0.47),
indicating that our joint main and interaction effect contrast adequately explains the variation in
our risk assessment measure.
While this significant two-way interaction and the pattern of cell means in Figure 3 appear to
support our hypothesis, we next turn to simple effect tests to analyze more precisely how hedge
effectiveness affected risk assessments in separate, linked and net presentation conditions. Panel
C of Table 2 reports simple main effect tests for hedge effectiveness by presentation format
condition. Recall that we predict that participants are more likely to distinguish high and low
hedge effectiveness under linked presentation compared with either separate or net presentation.
Because low hedge effectiveness is consistent with higher risk, we would generally expect higher
(lower) risk assessments for low (high) hedge effectiveness, albeit with a greater difference
between low and high hedge effectiveness for linked presentation than for separate or net
presentation. Consistent with this prediction, participants’ risk assessments are significantly
different between low (mean of 59.34) and high (mean of 42.97) hedge effectiveness (t(167) =
2.87, p < 0.01) for linked presentation. In contrast, in the separate condition, the mean risk
assessments are not statistically different for low (mean of 59.28) and high (mean of 55.30)
hedge effectiveness (t(167) = 1.23, p = 0.22). For the net condition, the mean risk assessments are
6 We verify that our hypothesis is robust to alternative contrast coding schemes that meet the requirement that the low versus high hedge effectiveness difference between the two linked presentation conditions is greater than the same differences in the separate and net presentation conditions (all p-values < 0.01).

19
also insignificantly different for low (mean of 56.79) and high (mean of 51.82) hedge
effectiveness (t(167) = 0.70, p = 0.49). Collectively, these results are fully consistent with our
hypothesis. Only in the case of linked presentation do participants discriminate between high and
low hedge effectiveness.
4.3 Evidence of inverse U-shape relation
Our hypothesis is based on a theorized inverse U-shaped relation between contiguity (i.e. the
physical closeness of the items in the hedge relationship) and investors’ ability to judge
congruity (i.e., the strength of the relationship between the items). To provide evidence of this
relation, we measured participants’ perceptions of these two constructs. To measure perceptions
of contiguity, we asked participants to judge the physical separation between the two accounts.
To measure perceptions of their ability to judge congruity, we asked participants about the ease
of seeing the relationship between the two accounts. Panel A of Table 3 presents descriptive
statistics for these measures and Panels B through D present ANOVAs along with the relevant
simple main effect tests.
-------------------------------------------- Insert Table 3 about here
--------------------------------------------
Turning first to the contiguity measure, our expectation was that there should be a
presentation main effect. That is, we expected to see the highest judged physical separation
judgments in the separate presentation condition, followed by those in the linked presentation
condition, and then the net presentation condition. As seen in Table 3, the ANOVA shows a
significant presentation main effect as follows from our expectation (F = 20.69, p < 0.01).
Higher scores indicate more judged physical separation. For this measure, judged physical
separation was greatest in the separate condition (mean of 55.30), followed by the linked

20
condition (mean of 44.62), which in turn was greater than the net condition (mean of 23.59) (all
simple main effect p-values < 0.05). These results are consistent with our expectation.
Turning next to the ease of seeing the relationship question, our expectation was that these
judgments would exhibit the theorized inverse U-shape. Thus, we expected responses to be
higher in the linked presentation condition than in the separate and net conditions. Results, in
which higher scores mean that it was easier to see the relationship, are consistent with this
expectation. Specifically, we observe that participants in the linked condition found it the easiest
(mean of 73.03) to see the relationship between the inventory and derivatives accounts, with both
the separate condition (mean of 59.93) and the net condition (mean of 20.84) significantly lower.
Not surprisingly, there is a significant main effect of presentation (F = 58.51, p < 0.01) with
follow-up simple effect tests revealing that the linked condition mean is significantly different
than each of the two other conditions (both p-values < 0.01).
Combined, these measures provide evidence of the inverse U-shaped relation between
contiguity and the ease of judging congruity. That is, as contiguity increases from separate to
linked to net presentation, the ease with which investors can judge congruity first increases (from
separate to linked) and then decreases (from linked to net).
4.4 Further evidence of the causal cues in linked presentation
The results presented thus far are consistent with our theory that that linked presentation
provides the causal cues indicating that the inventory and derivative accounts are related which,
in turn, suggests use of the disaggregated data to discern hedge effectiveness. Given this logic, it
should follow that if participants in the separate presentation conditions are prompted to consider
the relationship between the two accounts, they should be able to judge hedge effectiveness,
similar to those in the linked condition. However, similar prompting in the net presentation

21
condition is unlikely to allow those participants to discern hedge effectiveness as they lack the
disaggregated account balances to judge congruity.
To test this idea, we prompted participants in all conditions about a possible relationship
between the inventory and derivatives accounts—through a series of questions in the latter half
of the experiment. Specifically, we asked about the extent to which changes in the derivatives
account offset changes in the inventory account and the actual strength of the relationship
between the inventory and derivatives accounts. Given this prompting, we then test our
conjecture described above by asking all participants the following question: By what amount
would the derivatives account change if the inventory account were to change by $1,000 in the
next quarter? Table 3 presents statistics for this balance prediction measure.
Results indicate that, when prompted, participants in both the linked and separate
presentation conditions were able to distinguish between high and low hedge effectiveness in
their responses to this balance prediction question (both p-values < 0.01). Specifically, for the
linked conditions, mean judgments about the likely change in the derivatives account given a
$1,000 future change in the inventory account were $612.31 and $965.34 for the low and high
hedge effectiveness conditions, respectively (t = 4.11, p < 0.01). For the separate conditions,
these mean judgments were $518.62 and $844.23 for low and high hedge effectiveness,
respectively (t =3.68, p < 0.01). Not surprisingly, though, participants in the net condition were
unable to distinguish between the low and high hedge effectiveness conditions, even after the
prompting questions. Their mean judgments about how much the derivatives account would
change given a $1,000 future change in the inventory account (means of $550.00 and $642.71 for
low and high hedge effectiveness, respectively) did not differ statistically (t = 1.06, p = 0.29).

22
Overall, these results imply that linked presentation works as we conjectured—that is, the
close physical nature of the accounts serves as a causal cue (or prompt) to allow users to realize
that the two accounts are related; once they identify that there is a relationship, the disaggregated
account balances enables them to use that information to make judgments that reflect the nature
of the relationship (i.e., in our case, discriminate between low and high hedge effectiveness). The
fact that outside prompting allows those in the separate presentation conditions to identify the
relationship between the inventory and derivatives accounts and, thus, make judgments similar to
those in linked presentation conditions suggests that the close physical proximity of accounts in
the linked conditions serves as a causal cue.
5. Additional Experiment
We collected data from an additional group of participants to ascertain the extent to which the
lack of disaggregated data about the inventory and derivatives accounts influenced the judgments
of participants in the net presentation conditions. That is, will providing additional information,
outside of the balance sheet, allow investors to overcome the extreme contiguity between the two
accounts which, in turn, affects their ability to judge congruity? Although prior research on
footnote versus recognition suggests that outside-of-the-balance-sheet information is unlikely to
be a complete substitute for clear presentation on the balance sheet (Aboody 1996; Barth, Clinch
and Shibano 2003; Ahmed, Kilic and Lobo 2006; Frederickson, Hodge, and Pratt 2006), we
nevertheless subject this idea to empirical testing.
To address this question, we relied on the same instrument described earlier and conducted a
2 × 2 between-participants design with hedge effectiveness at two levels (high and low) and
presentation at two levels (linked presentation and net presentation with note disclosure). By
adding the note disclosure to the net condition, participants in the net conditions had available to

23
them disaggregated information about the inventory and derivative account balances for the four
balance sheet periods presented. Importantly, though, this information was presented away from
the balance sheet (i.e., on a separate page), thereby simulating a footnote disclosure.
The results of this additional experimentation, using 258 participants (100 individuals with
similar backgrounds as those in the main experiment and 158 individuals with significant
investing experience) reveals similar results for the theorized relation between contiguity and
investors’ ability to assess congruity reported in the main experiment. That is, those in the linked
presentation conditions again found it easier to see the relationship between the accounts in the
linked conditions than the net (with note) conditions (F = 20.10, p < 0.01).
Despite these results being similar to those in the main experiment, the results for both the
risk and balance prediction judgments show that the additional note disclosure does, to some
extent, mitigate the lack of disaggregated data on the balance sheet (as provided in linked
presentation). Specifically, the risk judgment results reveal only a main effect for the hedge
effectiveness measure (t = 1.49, p = 0.07), and we do not observe that the difference in the mean
risk judgments for the linked presentation—between low and high hedge effectiveness—is
greater than for the separate presentation (with note) (F = 0.04, p = 0.84). For the balance
prediction judgments, we did observe a greater difference in judgments for those in the linked
presentation condition (means of $560.56 and 810.64 for low and high hedge effectiveness,
respectively) for than in the net (with note) presentation conditions (means of $583.09 and
$711.56). That is, while participants in both presentation conditions did discriminate between
low and high hedge effectiveness (both p-values < 0.01), participants in the linked presentation
conditions made a larger distinction than those in the net (with note) presentation conditions (t =
1.56, p = 0.06).
24
Taken as a whole, these results indicate that by providing additional information in the
footnotes about the underlying accounts involved in the hedging relationship, investors still
recognize the difficulties in judging congruity, but can somewhat undo the effects of the net
presentation for their risk judgments, arguably with additional effort on their part.
6. Conclusion
In this study, we develop and test theory about how separate, linked and net presentation of
related financial statement items affect investors’ judgments. Results of a controlled
experiment—set within a hedging context—reveal that linked presentation helps investors to
both identify the existence of a relationship between a hedged asset and a hedging instrument
and to assess the strength of the relationship. In contrast, when the related accounts are presented
separately or net, investors have trouble seeing the relationship and, thus, assessing its strength.
As a result, when judging risk, investors only distinguish between high and low hedge
effectiveness when the hedged item and the hedging instrument are presented in a linked format.
Our study offers several new theoretical and practical insights. First, we predict and find that
linked and separate presentation have different effects on investors’ judgments. Thus, we offer
the insight that all forms of disaggregated presentation should not be considered the same, as the
physical separation between the disaggregated information is also important. Second, we extend
causal reasoning theory by positing that contiguity (i.e., the proximity in space or time) between
causally related items has an inverse U-shaped relationship to people’s ability to judge the
congruity (i.e., the similarity in strength or magnitude) of the items. While we test this prediction
in a financial statement context, it is likely to generalize to many areas where people make causal
inferences. Third, our findings are likely of interest to standard setters, who have discussed
linked presentation as an alternative to separate or net presentation for related financial statement
25
items. However, standard setters have lacked theory and empirical evidence to underpin their
consideration of linked presentation. Our study thus provides scholarly input to standard setters
as they consider how to present related financial statement items.
Our study is, of course, subject to certain limitations, which in turn raise interesting questions
for future research. For example, our experiment was set in a hedging context in which investors
made risk judgments. Although the theory we test is quite general, it is nevertheless an empirical
question as to whether linked presentation would have similar effects in other areas or for other
judgments. Another potential limitation, specific to our context, is that we do not distinguish
between investors’ perceptions of hedged and unhedged risks. Standard setters have raised
concerns about whether investors can disentangle these risks, and whether presentation format
affects their ability to do so (e.g., IASB 2010). Thus, future research could investigate whether
separate, linked and net presentation affect investors’ ability to distinguish between different
types of risk.

26
References
Aboody, D. 1996. Recognition versus disclosure in the oil and gas industry. Journal of Accounting Research 34(Supplement): 21-32.
ACCA (Association of Chartered Certified Accountants). 2009. Complexity in Financial Reporting. Retrieved at http://www.accaglobal.com/content/dam/acca/global/PDF-technical/financial-reporting/tech-ms-com.pdf
Ahmed, A. S., E. Kilic, and G. J. Lobo. 2006. Does recognition versus disclosure matter? Evidence from value-relevance of banks’ recognized and disclosed derivative financial instruments. The Accounting Review 81(3): 567-588.
ASB (Accounting Standards Board). 1994. Financial Reporting Standard No. 5: Reporting the Substance of Transactions. Retrieved at https://frc.org.uk/Our-Work/Publications/ASB/FRS-5-Reporting-the-Substance-of-Transactions-File.pdf
Barth, M. E., G. Clinch, and T. Shibano. Market effects of recognition and disclosure. Journal of Accounting Research 41(4): 581-609.
Barth, M. E., and Schipper, K. 2008. Financial reporting transparency. Journal of Accounting, Auditing and Finance 23(2): 173-190.
Bloomfield, R., Hodge, F., Hopkins, P., and Rennekamp, K. 2014. Does coordinated presentation help credit analysts identify firm characteristics? Contemporary Accounting Research 32(2): 507-527.
Bonner, S. E., Clor-Proell, S. M., and Koonce, L. 2014. Mental accounting and disaggregation based on the sign and relative magnitude of income statement items. The Accounting Review 89(6): 2087-2114.
Clor-Proell, S. M., Proell, C. A., and Warfield, T. D. 2014. The effects of presentation salience and measurement subjectivity on nonprofessional investors' fair value judgments. Contemporary Accounting Research 31(1): 45-66.
Einhorn, H. J., and Hogarth, R. M. 1982. Prediction, diagnosis, and causal thinking in forecasting. Journal of Forecasting 1(1): 23-36.
Einhorn, H. J., and Hogarth, R. M. 1986. Judging probable cause. Psychological Bulletin 99(1): 3-19.
Elliott, W.B., Hobson, J.L., and Jackson, K.E., 2011. Disaggregating management forecasts to reduce investors’ susceptibility to earnings fixation. The Accounting Review 86 (1): 185–208.
FASB (Financial Accounting Standards Board). 2008. Exposure Draft: Accounting for Transfers of Financial Instruments. FASB: Norwalk, CT.
FASB (Financial Accounting Standards Board). 2010. Exposure Draft: Leases. FASB: Norwalk, CT.

27
FASB (Financial Accounting Standards Board). 2012. 2012 FASB/IASB Reporting Issues Conferences. FASB: Norwalk, CT.
FASB (Financial Accounting Standards Board). 2015. FASB’s simplification initiative: An update. Retrieved at http://www.fasb.org/jsp/FASB/Page/SectionPage&cid=1176165963019
FASB (Financial Accounting Standards Board). 2016. Balance Sheet: SEC Materials. Accounting Standards Codification Topic 210-10-S99-1. FASB: Norwalk, CT.
Frederickson, J. R., F. D. Hodge, and J. H. Pratt. 2006. The evolution of stock option accounting: Disclosure, voluntary recognition, mandated recognition, and management disavowals. The Accounting Review 81(5): 1073-1093.
Hales, J. W., Venkataraman, S., and Wilks, T. J. 2011. Accounting for lease renewal options: the informational effects of unit of account choices. The Accounting Review 87(1): 173-197.
Hirst, D., Koonce, L., and Venkataraman, S. 2007. How disaggregation enhances the credibility of management earnings forecasts. Journal of Accounting Research 45(4): 811-837.
IASB (International Accounting Standards Board). 2010. Staff Paper for IASB/FASB joint board meeting 17-18 November 2010. Retrieved at http://www.ifrs.org/Meetings/Documents/IASBNorwalkNov10/ETS1110b07Cobs.pdf
IASB (International Accounting Standards Board). 2014. Staff paper for emissions trading schemes. Retrieved at: http://www.ifrs.org/Meetings/MeetingDocs/IASB/2014/November/AP06A-Emissions-Trading-Schemes.pdf.
Koonce, L., M. G. Lipe, and M. L. McAnally. 2005. Judging the Risk of Financial Instruments: Problems and Potential Remedies. The Accounting Review 80(3): 871-895.
Koonce, L., M. G. Lipe, and M. L. McAnally. 2008. Investor Reactions to Derivative Use and Outcomes. Review of Accounting Studies 13(4): 571-597.
Koonce, L., Seybert, N., and Smith, J. 2011. Causal reasoning in financial reporting and voluntary disclosure. Accounting, Organizations and Society 36(4): 209-225.
Libby, R., and Emett, S. A. 2014. Earnings presentation effects on manager reporting choices and investor decisions. Accounting and Business Research 44(4): 410-438.
Libby, R. and Brown, T. 2012. Financial statement disaggregation decisions and auditors’ tolerance for misstatement. The Accounting Review 88(2), 641–665.
Loughran, T., and B. McDonald. 2014. Measuring readability in financial disclosures. The Journal of Finance 69(4): 1643-1671.
Penman, S. 2013. Financial Statement Analysis and Security Valuation. McGraw-Hill: New York, NY.
SEC (Securities and Exchange Commission). 2013. Report on Review of Disclosure Requirements in Regulation S-K. Retrieved at: https://www.sec.gov/news/studies/2013/reg-sk-disclosure-requirements-review.pdf.

28
Appendix Presentation Format and Hedge Effectiveness Manipulations
Panel A: Separate presentation (High hedge effectiveness)
(Low hedge effectiveness)
Quarter 1 Quarter 2 Quarter 3 Quarter 4Assets
Current assets 2,750$ 2,760$ 2,775$ 2,795$ Inventory 5,000 8,000 4,500 5,500 Other assets 3,275 3,325 3,425 3,525
LiabilitiesAccount payable 2,695 2,700 2,715 2,740 Other borrowings 4,325 4,340 4,390 4,465 Derivative contracts 1,000 4,000 500 1,500
EnergyCorpExcerpts from Quarterly Balance Sheets
(In Millions)
Quarter 1 Quarter 2 Quarter 3 Quarter 4Assets
Current assets 2,750$ 2,760$ 2,775$ 2,795$ Inventory 5,000 8,000 4,500 5,500 Other assets 3,275 3,325 3,425 3,525
LiabilitiesAccount payable 2,695 2,700 2,715 2,740 Other borrowings 4,325 4,340 4,390 4,465 Derivative contracts 1,000 2,500 750 1,250
EnergyCorpExcerpts from Quarterly Balance Sheets
(In Millions)

29
Panel B: Linked presentation (High hedge effectiveness)
(Low hedge effectiveness)
Quarter 1 Quarter 2 Quarter 3 Quarter 4Assets
Current assets 2,750$ 2,760$ 2,775$ 2,795$ Inventory 5,000 8,000 4,500 5,500 Less: Derivative contracts (1,000) (4,000) (500) (1,500) Other assets 3,275 3,325 3,425 3,525
LiabilitiesAccount payable 2,695 2,700 2,715 2,740 Other borrowings 4,325 4,340 4,390 4,465
EnergyCorpExcerpts from Quarterly Balance Sheets
(In Millions)
Quarter 1 Quarter 2 Quarter 3 Quarter 4Assets
Current assets 2,750$ 2,760$ 2,775$ 2,795$ Inventory 5,000 8,000 4,500 5,500 Less: Derivative contracts (1,000) (2,500) (750) (1,250) Other assets 3,275 3,325 3,425 3,525
LiabilitiesAccount payable 2,695 2,700 2,715 2,740 Other borrowings 4,325 4,340 4,390 4,465
EnergyCorpExcerpts from Quarterly Balance Sheets
(In Millions)

30
Panel C: Net presentation (High hedge effectiveness)
(Low hedge effectiveness)
Quarter 1 Quarter 2 Quarter 3 Quarter 4Assets
Current assets 2,750$ 2,760$ 2,775$ 2,795$ Inventory (net of derivative contracts) 4,000 4,000 4,000 4,000 Other assets 3,275 3,325 3,425 3,525
LiabilitiesAccount payable 2,695 2,700 2,715 2,740 Other borrowings 4,325 4,340 4,390 4,465
EnergyCorpExcerpts from Quarterly Balance Sheets
(In Millions)
Quarter 1 Quarter 2 Quarter 3 Quarter 4Assets
Current assets 2,750$ 2,760$ 2,775$ 2,795$ Inventory (net of derivative contracts) 4,000 5,500 3,750 4,250 Other assets 3,275 3,325 3,425 3,525
LiabilitiesAccount payable 2,695 2,700 2,715 2,740 Other borrowings 4,325 4,340 4,390 4,465
EnergyCorpExcerpts from Quarterly Balance Sheets
(In Millions)
31
Figure 1 Examples of Separate, Linked and Net Presentation Formats
Separate Presentation (SP)
Assets Securitized assets $ 12,000 Liabilities Non-recourse financing $ 10,000
Linked Presentation (LP) Assets Securitized assets $ 12,000 Less: Non-recourse financing (10,000)
Net Presentation (NP) Assets
Securitized assets (net of non-recourse financing) $ 2,000
FIG. 1—This figure presents examples of the separate, linked, and net presentation formats that we study. We present these solely as illustrations, and not as representative of required or permitted presentation formats under current standards.

32
Ability to Judge Congruity
Contiguity
Low (Separate Presentation)
Medium (Linked Presentation)
High (Net Presentation)
Figure 2
Theorized Relationship between Contiguity and Ability to Judge Congruity
FIG. 2—This figure illustrates our theorized “inverse U-shaped” relationship between contiguity and people’s ability to judge congruity. Contiguity refers to the proximity in location or time in which events are observed or occur, while congruity refers to similarity in the strength or magnitude of these events.

33
Figure 3 Results for Post-Manipulation Risk Assessments
FIG. 3—This figure illustrates results for the main dependent measure, post-manipulation risk assessments, showing how investors’ risk assessments are affected by our presentation format and hedge effectiveness manipulations. The least square means shown are adjusted for participants’ pre-manipulation risk assessments. Both pre- and post-manipulation risk assessments were made on 101-point scales. See Table 2 for descriptive and inferential statistics related to risk assessments.
59.28
59.34
56.79 55.30
42.97
51.82
40.00
45.00
50.00
55.00
60.00
65.00
Separate Presentation Linked Presentation Net Presentation
Low Hedge Effectiveness Mean High Hedge Effectiveness Mean

34
Table 1 Linked Presentation in Accounting Standards
Area Source Status Reasons in favor of linked presentation
Reasons against linked presentation
Non-recourse financing (securitized assets)
UK GAAP Standard FRS 5 (ASB 1994)
Adopted from 1994 to 2007
Shows assets and sources of finance at both gross amounts (which determine level of future income) and net amounts (which determine maximum loss).
Complex and difficult to understand.
Variable interest / special purpose entities
FASB Exposure Draft on transfers of financial assets (FASB 2008)
Discussed but not adopted
Highlights the relation between specific obligations and the assets whose cash flows are restricted to satisfy those obligations.
Linked presentation should not apply only to a subset of assets and liabilities. Measurement of linked assets and liabilities should be fair value, but applying fair value broadly needed further analysis. Ultimately considered too broad for this project.
Leases FASB Exposure Draft on Leasing (FASB 2010)
Discussed for lessors but not adopted (lessor accounting was left unchanged in final ASU).
Reflects interdependency of the underlying asset, the right to receive lease payment, and the lease liability, while acknowledging that the criteria to present net (i.e., right to offset) are not met. Reflects that lessor continues to own the asset. Alleviates concern that separate presentation overstates total assets and total liabilities.
Not discussed.
Hedging IASB Exposure Draft on Hedge Accounting (IASB 2010)
Discussed for fair value hedges but not adopted
Provides useful information about hedge relationships.
Does not differentiate between risks that are covered by the relationship and those that are not. Ratios based on linked presentation are not necessarily more appropriate because hedging affects only one risk but not all risks. Disclosures are better at communicating information about hedging relationships.
Emissions trading (cap and trade)
IASB Staff Paper (IASB 2014)
Could still be adopted
Net position can be readily seen, with greater transparency than net presentation about how net position is comprised.
Not explicitly discussed. Suggestion that linked presentation would not necessarily require the same measurement basis for assets and liabilities, whereas net presentation would require the same basis.
35
Table 2 Risk Assessments
Panel A: Pre- and post- manipulation risk judgment means [standard deviations]
Pre-Manipulation Risk Judgments
Post-Manipulation Risk Judgments
Low Hedge Effectiveness
High Hedge Effectiveness
Row Means
Low Hedge Effectiveness
High Hedge Effectiveness
Row Means
Separate Presentation
52.69 [18.67] n=29
55.41 [19.87] n=27
54.00 [19.23] n=56
59.28 [18.94] n=29
55.30 [18.77] n=27
57.36 [18.79] n=56
Linked Presentation
55.79 [21.96] n=29
51.21 [20.27] n=29
53.50 [21.08] n=58
59.34 [22.55] n=29
42.97 [26.25] n=29
51.16 [25.62] n=58
Net Presentation
52.00 [23.78] n=28
50.19 [22.47] n=27
51.11 [22.95] n=55
56.79 [22.82] n=28
51.82 [24.38] n=28
54.30 [23.53] n=56
Column Means
53.51 [21.41] n=86
52.24 [20.75] n=83
58.49
[21.27] n=86
49.88 [23.74] n=84
Panel B: Traditional Analysis of variance (covariance) for risk assessments Pre-Manipulation Risk
Judgments Post-Manipulation Risk
Judgments Pre-Manipulation Risk Judgments NA F = 104.84, p < 0.01 Presentation Format F = 0.30, p = 0.74 F = 1.80, p = 0.17 Hedge Effectiveness F = 0.14, p = 0.71 F = 7.61, p < 0.01 Present × Hedge Effectiveness F = 0.43, p = 0.65 F = 1.25, p = 0.29
Panel C: Planned interaction contrast for post-manipulation risk assessments Present × Hedge Effectiveness F = 10.14, p < 0.01
Residual effect of manipulated variables F = 0.89, p = 0.47 Effect of hedge effectiveness given… Post-Manipulation Risk Assessments Separate Presentation t = 1.23, p = 0.22
Linked Presentation t = 2.87, p < 0.01
Net Presentation t = 0.70, p = 0.49 Participants provided their assessments about the overall risk they believe EnergyCorp faces with respect to the value of the company’s inventory using 101-point scales, with 0 labeled “very low risk” and 100 labeled “very high risk.” Assessments were made both before and after receiving the compilation of excerpts from EnergyCorp’s most recent quarterly balance sheets for the four quarters of the most recent fiscal year, shown as pre- and post-manipulation risk assessments.

36
Table 3 Additional Measures
Panel A: Means [standard deviations] Physical Separation Question Easy to Judge Relationship Question Balance Prediction Question
Low Hedge Effectiveness
High Hedge Effectiveness
Row Means
Low Hedge Effectiveness
High Hedge Effectiveness Row Means Low Hedge
Effectiveness High Hedge
Effectiveness Row
Means
Separate Presentation
57.14 (18.76) n=29
53.33 (25.45) n=27
55.30 (22.12) n=56
56.31 (32.14) n=29
63.81 (29.82) n=27
59.93 (30.99) n=56
518.62 (291.08)
n=29
844.23 (320.96)
n=26
672.55 (344.30)
n=55
Linked Presentation
48.86 (24.44) n=29
40.38 (34.25) n=29
44.62 (29.80) n=58
65.48 (26.11) n=29
80.59 (22.33) n=29
73.03 (25.26) n=58
612.31 (332.19)
n=29
965.34 (171.21)
n=29
788.83 (316.72)
n=58
Net Presentation
20.86 (22.63) n=28
26.32 (30.49) n=28
23.59 (26.75)
n-56
15.79 (19.04) n=28
25.89 (28.76) n=28
20.84 (24.70) n=56
550.00 (341.04)
n=28
642.71 (450.39)
n=28
596.36 (398.58)
n=56
Column Means
42.53 (26.77) n=86
39.86 (31.97) n=84
46.21
(33.86) n=86
56.96 (35.38) n=84
560.43
(320.55) n=86
818.57 (355.80)
n=83
Panel B: Analysis of variance tests Physical Separation
Question Easy to Judge Relationship
Question Balance Prediction
Question Presentation Format F = 20.69, p < 0.01 F = 58.51, p < 0.01 F = 4.95, p < 0.01 Hedge Effectiveness F = 0.31, p = 0.58 F = 7.07, p < 0.01 F = 26.01, p < 0.01 Present × Hedge Effectiveness F = 1.02, p = 0.36 F = 0.30, p = 0.74 F = 2.69, p = 0.07

37
Panel C: Simple effects of presentation format Effect on presentation format comparing… Physical Separation
Question Easy to Judge
Relationship Question Balance Prediction
Question Separate vs. Linked Presentation t = 2.14, p = 0.03 t = 2.59, p = 0.01 t = 1.74, p = 0.08 Separate vs. Net Presentation t = 6.32, p < 0.01 t = 7.76, p < 0.01 t = 1.37, p = 0.17 Linked vs. Net Presentation t = 4.24, p < 0.01 t = 10.42, p < 0.01 t = 3.14, p < 0.01
Panel D: Simple main effects of hedge effectiveness Effect on hedge effectiveness comparing… Physical Separation
Question Easy to Judge
Relationship Question Balance Prediction
Question Separate Presentation t = 0.53, p = 0.59 t = 1.04, p = 0.30 t = 3.68, p < 0.01 Linked Presentation t = 1.22, p = 0.23 t = 2.15, p = 0.03 t = 4.11, p < 0.01 Net Presentation t = 0.78, p = 0.22 t = 1.41, p = 0.16 t = 1.06, p = 0.29
The physical separation asked, “How much physical separation was there between the inventory and the derivatives accounts on EnergyCorp’s balance sheet?” The response scale was 0 “no separation at all” and 100 “a lot of separation. The easy to judge relationship question asked, “Given EnergyCorp’s balance sheet presentation, how easy was it for you to see the relationship between the inventory and derivatives accounts?” with responses on 101-point scales with endpoints of 0 (“Not easy”) and 100 (“Very easy”). The balance prediction question asked, “If the value of EnergyCorp’s inventory account increases by $1,000 in the next quarter, by how much do you think the derivatives account would change?”