link.springer.com10.1007/s10021... · Web viewKON – First-flowering dates for 239 species...
28
Electronic Supporting Material:“Sensitivity of spring phenology to warming across temporal and spatial climate gradients in two independent databases” 1. Methods for NECTAR Database The Network of Ecological and Climatological Timings Across Regions (NECTAR) database was designed to bring together species-rich plant phenological records with a focus on non-clonal, non-cultivated species observations of wild communities. Towards this goal, in October 2009, we reviewed the literature for ground (not herbarium) observational studies of species phenology, searching ISI for topic: (plant phenolog*) and Topic: (observat*) and Topic: (time-series OR long-term). Combined with personal knowledge, we identified 61 datasets. Of these, 12 datasets met all the conditions for our analysis here: (1) phenological data with ≥8 years of observations and (2) close proximity to daily temperature and precipitation data from the Global Historical Climatology Network (GHCN). When possible, we worked with data holders or those very familiar with the data to guide quality control, merging, and taxonomy issues.
Transcript of link.springer.com10.1007/s10021... · Web viewKON – First-flowering dates for 239 species...

Electronic Supporting Material:“Sensitivity of spring phenology to warming across temporal and spatial climate gradients in two independent databases”
1. Methods for NECTAR Database
The Network of Ecological and Climatological Timings Across Regions (NECTAR) database was
designed to bring together species-rich plant phenological records with a focus on non-clonal,
non-cultivated species observations of wild communities. Towards this goal, in October 2009,
we reviewed the literature for ground (not herbarium) observational studies of species
phenology, searching ISI for topic: (plant phenolog*) and Topic: (observat*) and Topic: (time-
series OR long-term). Combined with personal knowledge, we identified 61 datasets. Of these,
12 datasets met all the conditions for our analysis here: (1) phenological data with ≥8 years of
observations and (2) close proximity to daily temperature and precipitation data from the Global
Historical Climatology Network (GHCN). When possible, we worked with data holders or those
very familiar with the data to guide quality control, merging, and taxonomy issues.
These 12 datasets covered a range of habitats and represented a mix of citizen science
observations and various initiatives by scientific organizations (see list below). Because datasets
were collected with a variety of objectives and methods, we took special care to merge them
into one database. The most common forms of data were first-leaf or first-flower dates (FLD and
FFD), and we adjusted more highly resolved data to these formats and excluded phenological
events, such as fruiting, for which we had little cross-site data. For sites with general monitoring
data (where species were regularly observed as ‘in-flower’ and so on), we took FLD and FFD as
the first occurrence of leaf or flower for each species each year. For GTH, LUQ, and SEV, we first
aggregated by plot level and then took FFD and FLD for each species in each year. For our site

with monitoring data and nearly year-round flowering (LUQ), we consulted with scientists
familiar with the site to set the start of year date for selecting FLD and FFD (January 1). For all
datasets we removed any species noted as cultivated in any way. After aggregating to FLD and
FFD by species and year we merged the 12 datasets using R version 2.12 (http://www.r-
project.org/) (R Development Core Team 2010).
Because the 12 NECTAR data sets represented a mix of observers, timeframes and
locations, we controlled for variation in taxonomic identification as much as possible. We
compared all names to a list from the International Plant Names Index (http://www.ipni.org/)
and, for any species that did not match, we checked spelling and established synonyms and
corrected names when possible. In a small number of cases correcting to a well-established
synonym led to duplicate observations of a given species at a given site within a year. In such
cases we took the first observation.
We review basic information on each dataset below, referring readers to the relevant
publications, metadata, and (where possible) raw data for more detailed information. Also
included are the location and identifier numbers for the associated GHCN station from which
daily climate data were taken. Where applicable, URL links have been embedded to provide
interested parties with direct access to the data or data providers. As mentioned in the main
text, GHCN station selection was based on both proximity to the site of the phenology data and
the temporal overlap between the phenological data and climate data.
2. Description of NECTAR datasets
2

• CHN – First-flowering dates for 384 species in and around (generally within several
kilometers, all observations within 80 kilometers) Chinnor, Oxfordshire, England (GR
SU7599) from 1954-2000, all recorded by R.S.R. Fitter (Fitter and Fitter 2002; Fitter and
others 2005). The complete dataset was published as supplemental material by Fitter
and Fitter (2002). Climate Data from GHCN Station UK000056225; 51.77oN, 1.27oE
• FAR – First-flowering dates for 675 species collected from the Great Plains (these data
cover North Dakota and Minnesota, USA). Data from 1910-1961 were collected by a
single observer (Orin A. Stevens) and are publicly available through Ecological Archives
(Dunnell and Travers 2011; Travers and others 2009). NECTAR also includes data from
2007-2010 collected by S. E. Travers and colleagues. Climate Data from GHCN Station
USC00212142; 46.84oN, 95.84oW
• GTH – Every other day flower monitoring for 116 species (Inouye 2008; Lambert and
others 2010; Miller-Rushing and Inouye 2009) from a series of plots located at the Rocky
Mountain Biological Station (Gothic, Colorado) from 1973 to present (NECTAR includes
data up to 2009, but data collection annually is active). Data were graciously provided by
the data collector, David Inouye, who has monitored, or supervised monitoring, over the
past 37 years. Support for collection of these data came from NSF grant DEB 0922080.
Climate Data from GHCN Station USC00051959; 38.87oN, 106.98oW.
• HUB – Weekly observations of leaf phenological events of 3 tree plant species from
1989-2008 at Hubbard Brook Ecosystem Study, New Hampshire (USA). Data collection
headed by Amey Bailey. Data are publicly available
(http://www.hubbardbrook.org/data/dataset.php?id=51) following Long Term
Ecological Research nework (LTER) policies. Data were provided by the Long Term
3

Ecological Research (LTER) Program. Climate Data from GHCN Station USC00275995;
44.03oN, 71.14oW
• HVD – Weekly observations (during the early and late season, April-June and September
leaf-fall) of leaf phenological events of 33 woody plant species from 1990-2009 (with
fewer species recorded for the entire observation period) at Harvard Forest,
Massachusetts (USA). We consider first-leaf date to be the first observation for each
species for each year when the percentage of buds broken open was greater than zero
(BBRK >0) and first-flower date as the first observation when the percentage of flower
buds open was greater than zero (FOPN >0). Data are publicly available
(http://harvardforest.fas.harvard.edu:8080/exist/xquery/data.xq?id=hf003) following
LTER policies. Data were provided by the Long Term Ecological Research (LTER) Program.
Climate Data from GHCN Station USW00094746; 42.27oN, 71.87oW
• KON – First-flowering dates for 239 species recorded from Konza Prairie LTER from
2001-2009 by volunteers (http://www.usanpn.org/node/4215). Monitoring organized
by the Konza Environmental Education Program (KEEP). Climate Data from GHCN
Station USC00144972; 39.20oN, 96.58oW
• LUQ – Litter trap collections of fallen leaves, flowers, fruit and seeds from 86 species
from Luquillo Experimental Forest Long Term Ecological Research Network in Puerto
Rico (Zimmerman and others 2007). Baskets were arrayed in two forests: El Verde
(1992-2000 and 2006-2007 data) and Bisley (1992-1994). Data are publicly available
(http://luq.lternet.edu/data/luqmetadata88) following LTER policies. Special thanks to
Jess Zimmerman, Chris Nytch, Jimena Forero-Montañafor providing the data. Collection
of these data was supported by NSF DEB grants: #9411973, #0080538, #0218039,
4

#0620910, #0614659, #0218039. Climate Data from GHCN Station RQW00011641;
18.43oN, 66.01oW
• MHK – Observations (1928-2002) of first flowering date for 18 perennial species at
Mohonk Lake Resort and Preserve, outside of New Paltz, New York, USA (Cook and
others 2008). Observations were taken along pre-determined routes at daily intervals
during the spring to minimize observer biases. Climate Data from GHCN Station
USC00305426; 41.77oN, 74.15oW
• SEV – Data sets were provided by the Sevilleta Long Term Ecological Research (LTER)
Program. Significant funding for the collection of these data was provided by the
National Science Foundation Long Term Ecological Research program (NSF Grant
numbers BSR 88-11906, DEB 9411976, DEB 0080529 and DEB 0217774). Data for this
analysis were drawn from a combination of two datasets of 182 species recorded from
1991-1994 (‘Phenology transects’) and 2000- 2008 (‘Core site phenology’) including a
variety of phenological events. Core site phenological data were collected every month
on four transects and included data on the first 10 individuals of each species
encountered. Transects were collected weekly during June-August and at least monthly
for the rest of the year from 3-4 transects each in four different habitat types. Data are
publicly available following LTER policies (available through
http://knb.ecoinformatics.org/knb/; metacat/knb-lter-sev.13700.1, metacat/knb-lter-
sev.4895.1, metacat/knb-lter-sev.4894.1, metacat/knb-lter-sev.4893.1, metacat/knb-
lter-sev.48.1, metacat/knb-lter-sev.4892.1). Climate Data from GHCN Station
USC00292436; 32.25oN, 107.75oW
• UWM – Weekly observations of leaf phenological events of 27 woody species from
2000-2009 at University of Wisconsin-Milwaukee Field Station, located in Saukville,
5

Wisconsin (Schwartz and Hanes 2010). Methods closely followed those of Harvard
Forest (USA). Climate Data from GHCN Station USC00473058; 43.24oN, 88.12oW
• WAU – First leaf and first bloom dates from Wauseon, Ohio recorded by Thomas
Mikesell from 1883-1912 for 26 tree species (Smith 1915). These data have been used in
a number of comparative phenological studies (Hunter and Lechowicz 1992; Morin and
others 2009). Climate Data from GHCN Station USC00338822; 41.52oN, 84.15oW
• WDC – First-flowering dates recorded by over one hundred volunteers for 778 species in
the Washinton, DC metropolitan area (USA) from 1985-2007 (Abu-Asab and others
2001). Data collections were guided by A. Goldberg and J. Wurdack and organized
through the Department of Botany, Smithsonian National Museum of National History
with data available online (http://botany.si.edu/dcflora/springflowers/index.htm). The
complete dataset is far greater and more species-rich than the one included in NECTAR
—we reduced the data by removing species that were flagged as cultivated. Climate
Data from GHCN Station USW00013721; 38.30oN, 76.42oW
3. PEP725 Data
Please see the main text for a full description of, and references for, the PEP725 database.
Descriptions of the PEP725 data we used for this analysis, including species names and
phenological phases, are in ESM Table 1 (for FFD related phases) and ESM Table 2 (For FLD
related phases).
6
3. Sensitivity Tests
We conducted a suite of sensitivity tests to determine the robustness of our results to outliers,
the standardization period chosen for the climate predictors, and the minimum sample size
threshold that we used.
To test the sensitivity of our results to outliers, we repeated our main analysis of the
NECTAR database, using two levels of outlier screening to remove observations that lay beyond
2-sigma or 3-sigma standard deviations from the mean. In general, our results in terms of the
percentage of significant responders (ESM Table 3) and mean site sensitivity (ESM Table 4) are
robust to the level of outlier screening we choose, including the default (no screening) in the
manuscript. Largest site differences are found for SEV and LUQ using the more restrictive 2-
sigma screening level. These two sites have the lowest proportion of significant temperature
responders: as with the standardization period test (see below), the overall low number of
significant responders at this site means any slight change in the significant responders will have
a relatively large impact on the percentage of significant responders and the mean calculated
sensitivity. Importantly, our cross-site regression (percentage of significant responders versus
mean annual temperature) is also robust, irrespective of the outlier filtering used (ESM Table 5
and 6). Our full regression (All Sites) is still significant at the p<0.01 level, with similar
explanatory power (R2), and a similar slope (beta coefficient). Results are also similar for the
alternate regression, in which SEV and LUQ are removed. From these analyses, we conclude that
our overall results are insensitive to choices we make regarding outliers.
7

To test the robustness of our results to the standardization periods used, we repeated
our main analyses, but restricted the temporal range to the last 30 years of the 20 th century
(1970-1999). For this analysis, only 7 NECTAR sites had at least 8 observations during this
interval: CHN, GTH, HUB, HVD, LUQ, MHK, and WDC (ESM Table 7). The temperature record for
HUB begins in 1975, but at these other 6 sites the temperature data is 100% serially complete
over the entire 1970-1999 interval. This allows us to use a standardization time frame for the
GDDsum predictors common to all these sites (except HUB), analogous to the procedure used for
standardizing the PEP725 climate predictors. The percentage of significant responders and the
mean sensitivities were similar between this analysis and the original, where we used all the
data and standardized each site using different time periods (ESM Tables 8 and 9). The greatest
difference is in the mean sensitivity for LUQ: the overall low number of significant responders at
this site means any slight change in the significant responders will have a large impact on the
mean calculated sensitivity. From this additional analysis, we conclude that our results and
conclusions are largely insensitive to the standardization period chosen for the GDDsum
predictors.
The primary reason we chose a minimum time series length of 8 observations was so
that we could include several important sites that contain many short records (for example,
Konza, Sevilleta, and University of Wisconsin; median time series lengths are contained in Table
1 of the main manuscript). To test the robustness of our results, we have now repeated our
initial analysis, using longer minimum series lengths of 15 and 20 years. This more restrictive
length criteria limits the NECTAR sites we can use: CHN, FAR, GTH, HUB, HVD, MHK, and WDC.
And even for these sites, these new minimum length thresholds substantially reduced the
number of time series available (ESM Table 10). Notably, the number of time series available at
8

FAR, HVD, and WDC drop by approximately 40-60% with a requirement of n>=15. With the
higher n criteria, the percentage of significant responders does tend to increase (ESM Table 11).
The changes are relatively modest, however, and the cross-site ranking is generally retained: for
example, of these sites, WDC still has the lowest proportion of significant temperature
responders, whereas GTH still has the highest proportion. Notably, the sites with the largest
changes are also the sites where the new length criteria resulted in the largest declines in
available time series (FAR and WDC). It is unclear whether the increase in significant responders
is due to increased power with these longer time series, or undersampling of species that are
less sensitive to temperature. Mean sensitivities for the significant responders also generally
increase, although, like the percentages, have a similar magnitude regardless of the minimum n
chosen (ESM Table 12).
References
Abu-Asab MS, Peterson PM, Shetler SG, Orli SS (2001) Earlier plant flowering in spring as a response to global warming in the Washington, DC, area. Biodiversity and Conservation, 10, 597–612.
9

Cook BI, Cook ER, Huth PC, Thompson JE, Forster A, Smiley D (2008) A cross-taxa phenological dataset from Mohonk Lake, NY and its relationship to climate. International Journal of Climatology, 28, 1369–1383.
Dunnell KL, Travers SE (2011) Shifts in the flowering phenology of the Northern Great Plains: patterns over 100 years. American Journal of Botany, 98, 935–945.
Fitter AH, Fitter RSR (2002) Rapid changes in flowering time in British plants. Science, 296, 1689.
Fitter AH, Gilligan CA, Hollingworth K, Kleczkowski A, Twyman RM, Pitchford JW (2005) Biodiversity and ecosystem function in soil. Functional Ecology, 19, 369–377.
Hunter AF, Lechowicz MJ (1992) Predicting the timing of budburst in temperate trees. Journal of Applied Ecology, pp. 597–604.
Inouye DW (2008) Effects of climate change on phenology, frost damage, and floral abundance of montane wildflowers. Ecology, 89, 353–362.
Lambert AM, Miller-Rushing AJ, Inouye DW (2010) Changes in snowmelt date and summer precipitation affect the flowering phenology of Erythronium grandiflorum (glacier lily; liliaceae). American Journal of Botany, 97, 1431.
Miller-Rushing AJ, Inouye DW (2009) Variation in the impact of climate change on flowering phenology and abundance: An examination of two pairs of closely related wildflower species. American Journal of Botany, 96, 1821.
Morin X, Lechowicz MJ, Augspurger C, O’Keefe J, Viner D, Chuine I (2009) Leaf phenology in 22 North American tree species during the 21st century. Global Change Biology, 15, 961–975.
R Development Core Team (2010) R: A Language and Environment for Statistical Computing. R Foundation for Statistical Computing, Vienna, Austria. URL http://www.R-project.org/. ISBN 3-900051-07-0.
10

Schwartz MD, Hanes JM (2010) Intercomparing multiple measures of the onset of spring in eastern North America. International Journal of Climatology, 30, 1614–1626.
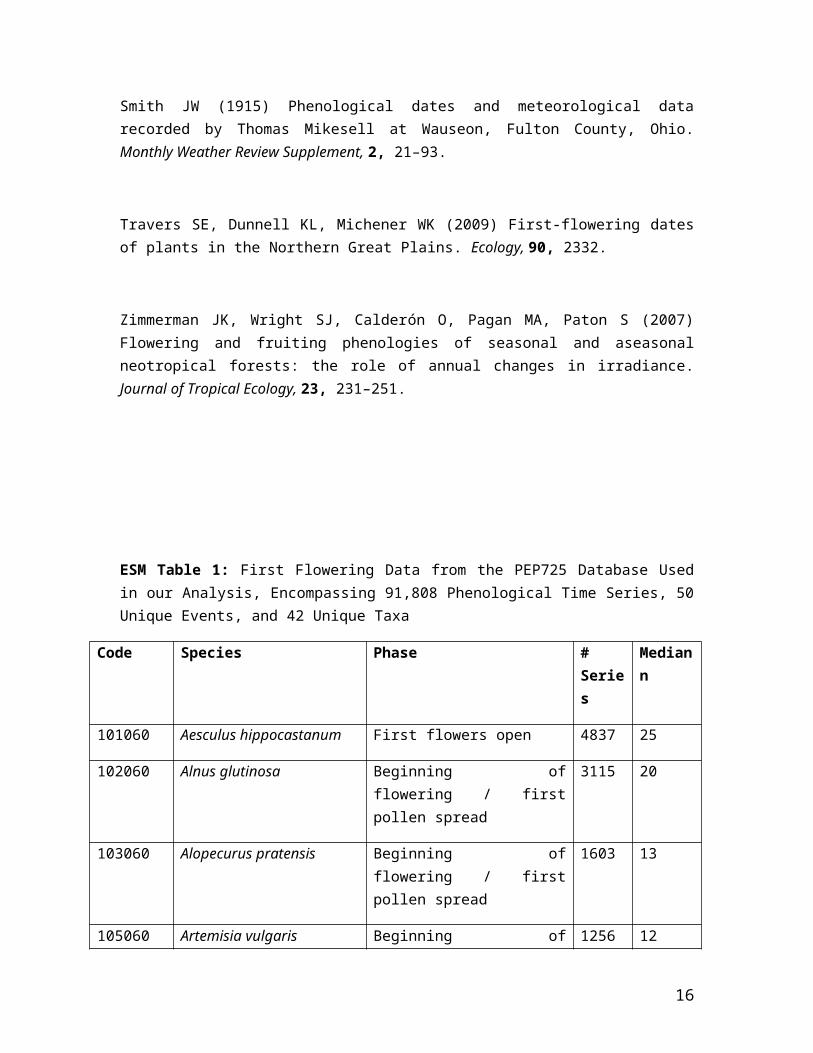
Smith JW (1915) Phenological dates and meteorological data recorded by Thomas Mikesell at Wauseon, Fulton County, Ohio. Monthly Weather Review Supplement, 2, 21–93.
Travers SE, Dunnell KL, Michener WK (2009) First-flowering dates of plants in the Northern Great Plains. Ecology, 90, 2332.
Zimmerman JK, Wright SJ, Calderón O, Pagan MA, Paton S (2007) Flowering and fruiting phenologies of seasonal and aseasonal neotropical forests: the role of annual changes in irradiance. Journal of Tropical Ecology, 23, 231–251.
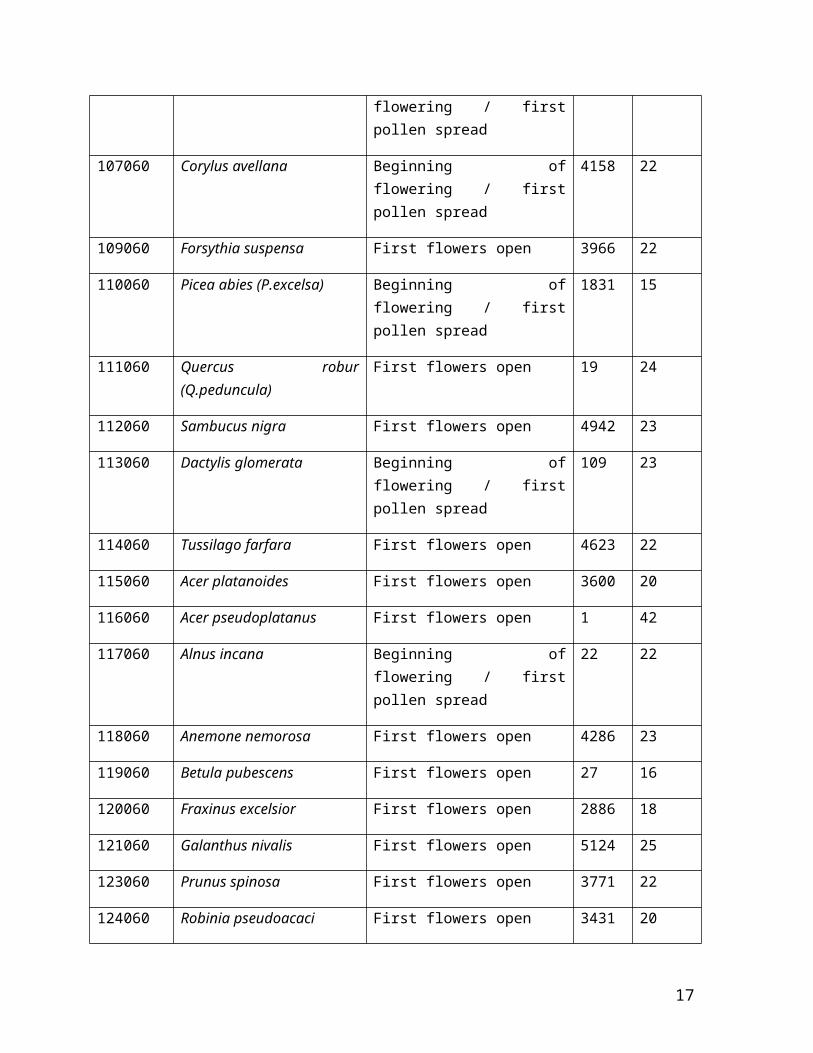
ESM Table 1: First Flowering Data from the PEP725 Database Used in our Analysis, Encompassing 91,808 Phenological Time Series, 50 Unique Events, and 42 Unique Taxa
Code Species Phase # Series
Median n
101060 Aesculus hippocastanum First flowers open 4837 25
102060 Alnus glutinosa Beginning of flowering / first pollen spread
3115 20
103060 Alopecurus pratensis Beginning of flowering / first pollen spread
1603 13
105060 Artemisia vulgaris Beginning of flowering / first pollen spread
1256 12
107060 Corylus avellana Beginning of flowering / first 4158 22
11

pollen spread
109060 Forsythia suspensa First flowers open 3966 22
110060 Picea abies (P.excelsa) Beginning of flowering / first pollen spread
1831 15
111060 Quercus robur (Q.peduncula) First flowers open 19 24
112060 Sambucus nigra First flowers open 4942 23
113060 Dactylis glomerata Beginning of flowering / first pollen spread
109 23
114060 Tussilago farfara First flowers open 4623 22
115060 Acer platanoides First flowers open 3600 20
116060 Acer pseudoplatanus First flowers open 1 42
117060 Alnus incana Beginning of flowering / first pollen spread
22 22
118060 Anemone nemorosa First flowers open 4286 23
119060 Betula pubescens First flowers open 27 16
120060 Fraxinus excelsior First flowers open 2886 18
121060 Galanthus nivalis First flowers open 5124 25
123060 Prunus spinosa First flowers open 3771 22
124060 Robinia pseudoacaci First flowers open 3431 20
125060 Salix caprea First flowers open 4744 25
126060 Sorbus aucuparia First flowers open 3575 20
127060 Syringa vulgaris First flowers open 4986 25
128060 Taraxacum officinale First flowers open 4915 25
129060 Tilia cordata First flowers open 2592 18
220060 Malus x domestica (e. cultivar)
First flowers open 1278 12
221060 Malus x domestica (l. cultivar) First flowers open 1315 11
12
222060 Prunus/Cerasus avium (e. cultivar)
First flowers open 190 29
223060 Prunus/Cerasus avium (l. cultivar)
First flowers open 11 44
224060 Vitis vinifera First flowers open 413 18
225060 Prunus domestica First flowers open 29 30
227060 Pyrus communis (e. cultivar) First flowers open 48 27.5
228060 Pyrus communis (l. cultivar) First flowers open 8 44
229060 Ribes rubrum First flowers open 4514 21
230060 Malus x domestica (u. cultivar)
First flowers open 119 23
232060 Prunus/Cerasus avium (u. cultivar)
First flowers open 145 20
235060 Prunus domestica (u. cultivar) First flowers open 105 21
237060 Pyrus communis (u. cultivar) First flowers open 96 23
332060 Secale cereale (winter) First flowers open 2561 14
332061 Secale cereale (winter) Beginning of flowering - first anthers vis
2546 13
337061 Helianthus annuus First flowering 238 11
660060 Calluna vulgaris First flowers open 3585 21
661060 Cornus mas First flowers open 11 44
663060 Fragaria vesca First flowers open 72 13
666060 Vaccinium myrtillus First flowers open 93 21
669060 Populus tremula First flowers open 3 12
780060 Laurus nobilis First flowers open 2 27
781060 Olea europea First flowers open 2 44.5
13
782060 Prunus amygdalis/dulcis First flowers open 4 44
783060 Rosmarinus officinalis First flowers open 1 44
Designators e./l./u. refer to early, late, and unknown cultivars, respectively. “Code” refers to the taxa/phase code in the PEP725 database, “Phase” is the descriptor given in the PEP725 database, “# Series” is the number of time series available for that taxa/phase code, and “Median n” is the median number of observations for all time series for that taxa/phase code.
ESM Table 2: Same as ESM Table 1, but for First Leafing Data from the PEP725 Database, Encompassing 24,700 Phenological Time Series, 15 Unique Events, and 14 Unique Taxa
Code Species Phase # Series
Median n
101011 Aesculus hippocastanum Leaf unfolding (first visible leaf stalk)
4841 25
102011 Alnus glutinosa Leaf unfolding (first visible leaf stalk)
3377 20
107011 Corylus avellana Leaf unfolding (first visible leaf stalk)
26 8
108011 Fagus sylvatica Leaf unfolding (first visible leaf stalk)
4207 22
111011 Quercus robur (Q.peduncula) Leaf unfolding (first visible leaf stalk)
4232 23
116011 Acer pseudoplatanus Leaf unfolding (first visible leaf stalk)
8 15
119011 Betula pubescens Leaf unfolding (first visible leaf stalk)
85 16
120011 Fraxinus excelsior Leaf unfolding (first visible leaf stalk)
3259 19
126011 Sorbus aucuparia Leaf unfolding (first visible leaf 1844 13
14
stalk)
129011 Tilia cordata Leaf unfolding (first visible leaf stalk)
2599 18
224011 Vitis vinifera Leaf unfolding 145 13
227011 Pyrus communis (e. cultivar) Leaf unfolding (first visible leaf stalk)
10 43
228011 Pyrus communis (l. cultivar) Leaf unfolding (first visible leaf stalk)
8 44
229011 Ribes rubrum Leaf unfolding 13 26
669011 Populus tremula Leaf unfolding (first visible leaf stalk)
46 22
ESM Table 3: Percentage of Significant Responders Based on No Outlier Screening, a 3-sigma Threshold, and a 2-sigma Threshold
Percentage of Significant Responders
Site No Screening 3-sigma 2-sigma
CHN 86.2 86.5 85.9
FAR 79.4 79.4 77.6
15
GTH 91.1 91.1 89.9
HUB 100 100 100
HVD 75.8 75.8 57.6
HVD 87.5 87.5 83.3
KON 58.6 58.6 52.6
LUQ 14.3 17.5 25.4
MHK 100 100 100
SEV 19.7 19.7 25.4
UWM 72 72 72
WDC 50.6 50.6 45.2
WAU 95.8 95.8 83.3
ESM Table 4: Same as ESM Table 3, but for the Mean Sensitivity of Significant Responders at Each Site
Mean Sensitivity, Significant Responders
Site No Screening 3-sigma 2-sigma
CHN -6.41 -6.24 -5.59
FAR -5.28 -5.32 -4.77
GTH -9.9 -9.86 -9.2
HUB -5.91 -4.96 -4.96
HVD, FFD -4 -4 -3.64
HVD, FLD -6.5 -6.5 -6.18
KON -5.3 -5.3 -5.12
16
LUQ -9.04 0.82 -3.73
MHK -4.93 -4.93 -4.38
SEV -0.07 -0.07 9.31
UWM -4.96 -4.96 -4.74
WDC -5.85 -5.7 -5.18
WAU -6.59 -6.55 -5.21
ESM Table 5: Results from the Cross Site NECTAR Regions (Proportion of Significant Responders versus Mean Annual Site Temperature) for our Default, 3-sigma, and 2-sigma Outlier Screening Cases
NECTAR Cross Site Regression; All Sites
No Screening 3-sigma 2-sigma
R2 0.679 0.663 0.61
p-value 0.001 0.001 0.002
Beta -3.8 -3.66 -3.22
ESM Table 6: Same as ESM Table 5, but for the Cross Site Regression Excluding SEV and LUQ
NECTAR Cross Site Regression; All Sites
No Screening 3-sigma 2-sigma
R2 0.304 0.303 0.33
p-value 0.079 0.079 0.065
17

Beta -2.54 -2.54 -2.99
ESM Table 7: Number of Time Series Available per NECTAR Site with n>=8 Observations for All Available Years (‘All Data’) and Over the Restricted Time Window of 1970-1999
Number of Time Series with n>=8 per site
Site All Data 1970-1999
CHN 384 384
GTH 79 70
HUB 3 3
HVD, FFD 33 33
HVD, FLD 24 20
LUQ 63 43
MHK 18 18
WDC 385 325
ESM Table 8: Same as ESM Table 7, but for the Percentages of Significant Responders at Each Site
18

Percentage of Significant Responders
Site All Data 1970-1999
CHN 86.2 81.5
GTH 91.1 92.9
HUB 100 100
HVD, FFD 75.8 75.8
HVD, FLD 87.5 85
LUQ 14.3 11.6
MHK 100 94.4
WDC 50.6 49.8
ESM Table 9: Same as ESM Table 7, but for the Mean Sensitivity of Significant Responders at Each Site
Mean Sensitivity, Significant Responders
Site All Data 1970-1999
CHN -6.41 -6.87
GTH -9.9 -6.42
HUB -5.91 -5.33
HVD, FFD -4 -3.76
HVD, FLD -6.5 -6.64
LUQ -9.04 4.83
MHK -4.93 -4.7
WDC -5.85 -6.55
19

ESM Table 10: Number of Time Series Available per Site, Based on Minimum Number Observations Thresholds of 8, 15, and 20 Years
Number of Time Series Per Site
Site n>=8 n>=15 n>=20
CHN 384 384 384
FAR 214 79 41
GTH 79 62 53
HUB 3 3 3
HVD, FFD 33 17 16
HVD, FLD 24 5 3
MHK 18 18 18
WDC 385 238 144
ESM Table 11: Same as ESM Table 10, but for the Percentages of Significant Responders at Each Site
Percentage of Significant Responders
Site n>=8 n>=15 n>=20
CHN 86.2 86.2 86.2
FAR 79.4 89.9 95.1
GTH 91.1 96.8 98.1
HUB 100 100 100
HVD, FFD 75.8 76.5 81.3
HVD, FLD 87.5 100 100
MHK 100 100 100
WDC 50.6 60.9 72.2
20

ESM Table 12: Same as ESM Table 10, but for the Mean Sensitivity of Significant Responders at Each Site
Mean Sensitivity, Significant Responders
Site n>=8 n>=15 n>=20
CHN -6.41 -6.41 -6.41
FAR -5.28 -5.71 -5.95
GTH -9.9 -9.87 -9.97
HUB -5.91 -5.91 -5.91
HVD, FFD -4 -4.32 -4.32
HVD, FLD -6.5 -6.09 -5.76
MHK -4.93 -4.93 -4.93
WDC -5.85 -5.69 -5.93
21