Lineage-specific and single-cell chromatin accessibility...
14
© 2016 Nature America, Inc. All rights reserved. NATURE GENETICS ADVANCE ONLINE PUBLICATION ARTICLES The human hematopoietic system is maintained by a small number of self-renewing multipotent hematopoietic stem cells (HSCs). More than 200 billion blood cells are produced in a single day 1 , highlight- ing the need for exquisite regulation that balances self-renewal of upstream stem cells with downstream production of differentiated effector cells. Previous studies have profiled gene expression patterns in mouse 2,3 and human 4,5 hematopoiesis, providing a rich resource for characterizing these cellular states. However, measuring gene expres- sion alone provides limited information regarding regulators of cell identity. Alternatively, genome-wide chromatin-based assays are sen- sitive methods for assessing the activity of trans-acting factors and cis- regulatory elements. Recently, several methods have been developed to profile the epigenomes of rare cellular populations 3,6,7 , enabling the identification of regulatory elements in mouse hematopoiesis 3 . These methods have not yet been used to profile epigenomes for rare progenitor populations in human hematopoiesis. Dysregulation of the regulatory networks governing the human hematopoietic system has a critical role in the development of hematological malignancies 8 . The long lifespan of HSCs makes them susceptible to the accumulation of mutations over time 9,10 . In particu- lar, in the case of AML, HSCs isolated from patients with leukemia have been shown to harbor some but not all of the genetic alterations found in leukemic cells. These cells, termed preleukemic HSCs 11–13 , provide insight into the earliest stages of dysregulation of normal hematopoiesis leading to AML. We previously described an assay for transposase-accessible chro- matin using sequencing (ATAC-seq), a method capable of measuring chromatin accessibility in rare cellular populations 6 . Here we report the development of an improved ATAC-seq protocol, optimized for human blood cells, that allows for more rapid high-quality measurements. We apply this optimized protocol to cells isolated from 9 healthy human donors and 12 patients with AML, studying a total of 137 samples representing 16 of the major cell types of the normal hematopoietic and leukemic hierarchies. In addition, we measure the transcriptomes of 96 samples from the same healthy and leukemic donors to derive paired expression data. This reference map highlighted the effects of both early mutations in epigenetic modifiers and late mutations in proliferation-inducing oncogenes on the leukemogenic process. Our results provide key insights into the evolutionary process of leuke- mogenesis and identify important regulatory programs that could be targeted to disrupt this process during its earliest stages. RESULTS Fast-ATAC is an optimized ATAC-seq protocol for blood cells We created a reference regulome and transcriptome map of the normal hematopoietic hierarchy (Fig. 1a, b). We developed an Lineage-specific and single-cell chromatin accessibility charts human hematopoiesis and leukemia evolution M Ryan Corces 1–3,11 , Jason D Buenrostro 3–5,11,12 , Beijing Wu 4 , Peyton G Greenside 4,6 , Steven M Chan 7 , Julie L Koenig 1,2 , Michael P Snyder 3,4 , Jonathan K Pritchard 4,8,9 , Anshul Kundaje 4,10 , William J Greenleaf 3,4 , Ravindra Majeti 1,2,12 & Howard Y Chang 3,12 We define the chromatin accessibility and transcriptional landscapes in 3 human primary blood cell types that span the hematopoietic hierarchy. Exploiting the finding that the enhancer landscape better reflects cell identity than mRNA levels, we enable ‘enhancer cytometry’ for enumeration of pure cell types from complex populations. We identify regulators governing hematopoietic differentiation and further show the lineage ontogeny of genetic elements linked to diverse human diseases. In acute myeloid leukemia (AML), chromatin accessibility uncovers unique regulatory evolution in cancer cells with a progressively increasing mutation burden. Single AML cells exhibit distinctive mixed regulome profiles corresponding to disparate developmental stages. A method to account for this regulatory heterogeneity identified cancer-specific deviations and implicated HOX factors as key regulators of preleukemic hematopoietic stem cell characteristics. Thus, regulome dynamics can provide diverse insights into hematopoietic development and disease. 1 Institute for Stem Cell Biology and Regenerative Medicine, Stanford University School of Medicine, Stanford, California, USA. 2 Division of Hematology, Department of Medicine, Stanford University School of Medicine, Stanford, California, USA. 3 Center for Personal Dynamic Regulomes, Stanford University School of Medicine, Stanford, California, USA. 4 Department of Genetics, Stanford University, Stanford, California, USA. 5 Broad Institute of MIT and Harvard, Harvard University, Cambridge, Massachusetts, USA. 6 Program in Biomedical Informatics, Stanford University School of Medicine, Stanford, California, USA. 7 Princess Margaret Cancer Centre, University Health Network, Toronto, Ontario, Canada. 8 Department of Biology, Stanford University, Stanford, California, USA. 9 Howard Hughes Medical Institute, Chevy Chase, Maryland, USA. 10 Department of Computer Science, Stanford University, Stanford, California, USA. 11 These authors contributed equally to this work. 12 These authors jointly directed this work. Correspondence should be addressed to R.M. ([email protected]) or H.Y.C. ([email protected]). Received 16 November 2015; accepted 18 July 2016; published online 15 August 2016; doi:10.1038/ng.3646
-
Upload
doankhuong -
Category
Documents
-
view
214 -
download
0
Transcript of Lineage-specific and single-cell chromatin accessibility...

©20
16N
atu
re A
mer
ica,
Inc.
All
rig
hts
res
erve
d.
Nature GeNetics ADVANCE ONLINE PUBLICATION �
A rt i c l e s
The human hematopoietic system is maintained by a small number of self-renewing multipotent hematopoietic stem cells (HSCs). More than 200 billion blood cells are produced in a single day1, highlight-ing the need for exquisite regulation that balances self-renewal of upstream stem cells with downstream production of differentiated effector cells. Previous studies have profiled gene expression patterns in mouse2,3 and human4,5 hematopoiesis, providing a rich resource for characterizing these cellular states. However, measuring gene expres-sion alone provides limited information regarding regulators of cell identity. Alternatively, genome-wide chromatin-based assays are sen-sitive methods for assessing the activity of trans-acting factors and cis-regulatory elements. Recently, several methods have been developed to profile the epigenomes of rare cellular populations3,6,7, enabling the identification of regulatory elements in mouse hematopoiesis3. These methods have not yet been used to profile epigenomes for rare progenitor populations in human hematopoiesis.
Dysregulation of the regulatory networks governing the human hematopoietic system has a critical role in the development of hematological malignancies8. The long lifespan of HSCs makes them susceptible to the accumulation of mutations over time9,10. In particu-lar, in the case of AML, HSCs isolated from patients with leukemia have been shown to harbor some but not all of the genetic alterations found in leukemic cells. These cells, termed preleukemic HSCs11–13,
provide insight into the earliest stages of dysregulation of normal hematopoiesis leading to AML.
We previously described an assay for transposase-accessible chro-matin using sequencing (ATAC-seq), a method capable of measuring chromatin accessibility in rare cellular populations6. Here we report the development of an improved ATAC-seq protocol, optimized for human blood cells, that allows for more rapid high-quality measurements. We apply this optimized protocol to cells isolated from 9 healthy human donors and 12 patients with AML, studying a total of 137 samples representing 16 of the major cell types of the normal hematopoietic and leukemic hierarchies. In addition, we measure the transcriptomes of 96 samples from the same healthy and leukemic donors to derive paired expression data. This reference map highlighted the effects of both early mutations in epigenetic modifiers and late mutations in proliferation-inducing oncogenes on the leukemogenic process. Our results provide key insights into the evolutionary process of leuke-mogenesis and identify important regulatory programs that could be targeted to disrupt this process during its earliest stages.
RESULTSFast-ATAC is an optimized ATAC-seq protocol for blood cellsWe created a reference regulome and transcriptome map of the normal hematopoietic hierarchy (Fig. 1a,b). We developed an
Lineage-specific and single-cell chromatin accessibility charts human hematopoiesis and leukemia evolutionM Ryan Corces1–3,11, Jason D Buenrostro3–5,11,12, Beijing Wu4, Peyton G Greenside4,6, Steven M Chan7, Julie L Koenig1,2, Michael P Snyder3,4, Jonathan K Pritchard4,8,9, Anshul Kundaje4,10, William J Greenleaf3,4, Ravindra Majeti1,2,12 & Howard Y Chang3,12
We define the chromatin accessibility and transcriptional landscapes in �3 human primary blood cell types that span the hematopoietic hierarchy. Exploiting the finding that the enhancer landscape better reflects cell identity than mRNA levels, we enable ‘enhancer cytometry’ for enumeration of pure cell types from complex populations. We identify regulators governing hematopoietic differentiation and further show the lineage ontogeny of genetic elements linked to diverse human diseases. In acute myeloid leukemia (AML), chromatin accessibility uncovers unique regulatory evolution in cancer cells with a progressively increasing mutation burden. Single AML cells exhibit distinctive mixed regulome profiles corresponding to disparate developmental stages. A method to account for this regulatory heterogeneity identified cancer-specific deviations and implicated HOX factors as key regulators of preleukemic hematopoietic stem cell characteristics. Thus, regulome dynamics can provide diverse insights into hematopoietic development and disease.
1Institute for Stem Cell Biology and Regenerative Medicine, Stanford University School of Medicine, Stanford, California, USA. 2Division of Hematology, Department of Medicine, Stanford University School of Medicine, Stanford, California, USA. 3Center for Personal Dynamic Regulomes, Stanford University School of Medicine, Stanford, California, USA. 4Department of Genetics, Stanford University, Stanford, California, USA. 5Broad Institute of MIT and Harvard, Harvard University, Cambridge, Massachusetts, USA. 6Program in Biomedical Informatics, Stanford University School of Medicine, Stanford, California, USA. 7Princess Margaret Cancer Centre, University Health Network, Toronto, Ontario, Canada. 8Department of Biology, Stanford University, Stanford, California, USA. 9Howard Hughes Medical Institute, Chevy Chase, Maryland, USA. 10Department of Computer Science, Stanford University, Stanford, California, USA. 11These authors contributed equally to this work. 12These authors jointly directed this work. Correspondence should be addressed to R.M. ([email protected]) or H.Y.C. ([email protected]).
Received 16 November 2015; accepted 18 July 2016; published online 15 August 2016; doi:10.1038/ng.3646

©20
16N
atu
re A
mer
ica,
Inc.
All
rig
hts
res
erve
d.
� ADVANCE ONLINE PUBLICATION Nature GeNetics
A rt i c l e s
optimized protocol for use on primary blood cells, termed Fast-ATAC, which relies on a one-step membrane permeabilization and transposition using the lysis reagent digitonin. We found that this simplified protocol requires just 5,000 cells, provides high-qual-ity data with reduced noise (Supplementary Fig. 1a–c), reduces the frequency of mitochondrial reads by ~5-fold (Supplementary
Fig. 1d), and offers an approximately 5-fold improvement in fragment yield per cell (Supplementary Fig. 1e).
Using Fast-ATAC and RNA-seq, we profiled the chromatin accessibility landscapes (regulomes) and transcriptomes of 13 dis-tinct cellular populations from the human hematopoietic hierarchy isolated via FACS (Fig. 1a and Supplementary Figs. 2–4). Cells were
e fd g
DNase CD34+
log2 (fragments)
4 6 8 10 12
AT
AC
CD
34+
log 2
(fra
gmen
ts)
4
6
8
10
12
r = 0.73
HSClog2 (fragments)
4 6 8 10 12
CD
34+
log 2
(fra
gmen
ts)
4
6
8
10
12
r = 0.77
HSC patient 1log2 (fragments)
4 6 8 10 12
HS
C p
atie
nt 2
log 2
(fra
gmen
ts)
4
6
8
10
12
r = 0.97
HSC replicate 1log2 (fragments)
4 6 8 10 12
HS
C r
eplic
ate
2lo
g 2 (f
ragm
ents
)
4
6
8
10
12
r = 0.98
10 kb 10 kb 10 kb 10 kb 10 kb
a
Humanbone marrow
b
Diff
eren
tiatio
n
HSC
MPP
CLP
CMP
MEPGMP
Gran
LMPP
MegaCD4 CD8 B NK Mono Ery
FACS
5,000cells
High-throughputsequencing
c
Insert size
Cou
nt
Qualitycontrol
TSSEnr
ichm
ent
Enhancer cytometrywith CIBERSORT
Diseaseontogeny
TFnetworks
Fast-ATACHuman
AML
CD
34+ H
SP
Cs
GATA2 LINC01272CEBPB
GYPA BCL11B BLK
HSPC Monocyte Erythroid T/NK cell CLP/B cell
CLPn = 5
Monon = 6
NKn = 6
HSCn = 7
MPPn = 6
LMPPn = 3
CMPn = 8
GMPn = 7
MEPn = 7
CD4n = 5
CD8n = 5
Bn = 4
Eryn = 8
Cell typeNumber ofreplicates
n = 2CD34ATAC
CD34DNase
Figure 1 Interrogation of chromatin landscapes in primary blood cells. (a) Schematic of the human hematopoietic hierarchy showing the 13 primary cell types analyzed in this work. Granulocytes and megakaryocytes were excluded. The cell types comprising CD34+ HSPCs are indicated. Colors used in this schematic are consistent throughout the figures. Mono, monocyte; gran, granulocyte; ery, erythroid; mega, megakaryocyte; CD4, CD4+ T cell; CD8, CD8+ T cell; B, B cell; NK, natural killer cell. (b) Diagram of the analyses performed using paired ATAC-seq and RNA-seq data in both primary human blood cells and primary patient-derived AML cells. (c) Normalized ATAC-seq profiles at developmentally important genes. Profiles represent the union of all technical and biological replicates for each cell type. See supplementary table 1 for the exact number of technical and biological replicates for each cell type. Genomic coordinates for the loci: GATA2, chr. 3: 128,197,777–128,218,433; CEBPB, chr. 20: 48,800,260–48,904,715; GYPA, chr. 4: 145,020,689–145,070,000; BCL11B, chr. 14: 99,513,898–99,796,947; BLK, chr. 8: 11,343,117–11,429,285. All y-axis scales range from 0–10 in normalized arbitrary units. The x-axis scale is indicated by the scale bars. (d–g) Scatterplots showing correlation of technical replicates (d), different human donors (e), ATAC-seq and DNase-seq data derived from CD34+ HSPCs (f), and ATAC-seq data for HSCs and bulk CD34+ HSPCs (g). The r values reported were calculated from correlation of all peaks. Plots show 50,000 random peaks, each with at least five reads.

©20
16N
atu
re A
mer
ica,
Inc.
All
rig
hts
res
erve
d.
Nature GeNetics ADVANCE ONLINE PUBLICATION 3
A rt i c l e s
taken directly from donor bone marrow or peripheral blood without further manipulation (Supplementary Table 1). The cell populations isolated included seven unique stem and progenitor and six differ-entiated cell types spanning the myeloid, erythroid, and lymphoid lineages14–17. Altogether, we performed ATAC-seq and RNA-seq on 3–4 adult donors for each cell population, generating a total of 49 transcriptomes and 77 regulomes (Fig. 1c, Supplementary Figs. 1f and 5a,b, and Supplementary Table 1).
With this data set, we identified a total of 590,650 accessible peaks. We found Fast-ATAC profiles to be highly reproducible across tech-nical (r = 0.98; Fig. 1d) and biological (r = 0.97; Fig. 1e) replicates in HSCs. In addition, we found similarly high concordance across all other cell types for all technical and biological replicates (mean r = 0.94 and 0.91, respectively; Supplementary Fig. 1g,h), except for erythroblast cells (technical replicates, r = 0.55; biological replicates, r = 0.50). Each individual cell type of the hematopoietic hierarchy displayed a set of uniquely expressed genes and uniquely accessible chromatin regions mapping to genes known to be involved in cel-lular functions important for the given cell type (Fig. 1c and Supplementary Fig. 6a–c).
We also observed reasonable correlation (r = 0.73) between Fast-ATAC and DNase-seq18 results for CD34+ hematopoietic stem and progenitor cells (HSPCs) (Fig. 1f). Notably, we found that HSCs, a CD34+ subpopulation, could have different ATAC-seq profiles
than the bulk CD34+ HSPC pool (r = 0.77 observed versus r = 0.91 expected for replicates of the same cell type; Fig. 1g), highlighting the value of highly purified stem and progenitor cell subpopulations for epigenomic analysis.
Distal element accessibility is highly cell type specificUnsupervised hierarchical clustering of our RNA-seq and ATAC-seq data showed robust classification of cell types among technical and biological replicates (Fig. 2a–d and Supplementary Fig. 7a–d). In this analysis, we observed that chromatin accessibility was more adept than mRNA expression levels at classifying cell types, as quan-tified by cluster purity19, suggesting that chromatin accessibility is more cell type specific and better captures cell identity. However, we note that RNA information from enhancer transcription, splicing, or other features that require optimized methods and deeper sequenc-ing may improve cell type classification. When regulatory elements were subdivided as gene promoters or distal elements (>1,000 bp away from a transcription start site (TSS)), we found that distal elements provided significantly improved cell type classification in comparison to promoters (Fig. 2e,f), similar to previous observa-tions using DNase-seq and ChIP-seq data20,21. This observation is clearly illustrated by the region surrounding the TET2 gene. Despite the invariant expression of TET2 and ubiquitous accessibility of the TET2 promoter, we found highly diverse accessibility profiles within
a d
g
RNA-seq (n = 49)
b 0 1Pearson
0.7 1Pearson
Promoters (n = 77) Distal elements (n = 77)
e fCluster purity = 77.6% Cluster purity = 85.7%
Cluster purity = 67.5% Cluster purity = 90.9%
ATAC-seq (n = 77)
NK
CD4CD8
MPP
HSC
CMPGMP LMPP
MEP
Mono
Ery
B
CLP
ATAC-seqRNA-seq
HSC
MPP
CMPGMPLMPP
MEP
Mono
EryB
CLP
CD8 CD4NK
HSCMPPLMPPCMPGMPMEPMono
CD4CD8BNK
CLPEry
0 1Pearson
0 1Pearson
HSCMPPLMPPCMPGMPMEPMono
CD4CD8BNK
CLPEry
ATAC-seq RNA-seq
Normalizedcounts(TET2)
NK HSPC TSS Lymphoid
TET2
HSC
CMP
GMP
MEP
CD8
NK
0 4,000 8,000
c
Figure 2 Distal regulatory elements enable accurate classification of the hematopoietic hierarchy. (a,b) Unsupervised hierarchical clustering of RNA-seq (a) and ATAC-seq (b) data from all replicates of 13 normal hematopoietic cell types. Values shown are Pearson correlation coefficients. Cluster purity quantifies the degree that cells of the same lineage are clustered together. For RNA-seq, clustering was performed using variance-stabilizing transform–normalized expression data for all expressed annotated genes. For ATAC-seq, clustering was performed on all peaks using quantile-normalized quantitative read coverage data. (c,d) Phylogenetic dendrograms of RNA-seq (c) and ATAC-seq (d) data showing correlations between cell types. Length of tree branches represents Euclidean distance. Data represent the union of all technical and biological replicates for each cell type. (e,f) Hierarchical clustering of ATAC-seq profiles mapping to promoters (e) and distal regulatory elements (f). Values shown are Pearson correlation coefficients. Promoter-proximal peaks are defined as peaks within 1 kb of an annotated TSS. Distal element peaks are defined as peaks greater than 1 kb from an annotated TSS. (g) ATAC-seq peaks in the TET2 locus show highly variable distal regulatory landscapes (left) and relatively constitutive expression of TET2 (right). Data represent the union of all technical and biological replicates for each cell type: HSC, 7; CMP, 8; GMP, 7; MEP, 7; CD8, 5; NK, 6. Error bars, 1 s.d. Genomic coordinates: chr. 4: 106,031,731–106,073,198. The y-axis scales range from 0–10 in normalized arbitrary units. Boxed regions show cell-type-specific or constitutive peaks around the TET2 gene.

©20
16N
atu
re A
mer
ica,
Inc.
All
rig
hts
res
erve
d.
� ADVANCE ONLINE PUBLICATION Nature GeNetics
A rt i c l e s
nearby distal regulatory elements, clearly distinguishing HSPCs, natural killer (NK) cells, and T cells (Fig. 2g).
Enhancer cytometry deconvolves complex cell populationsGiven the accuracy with which distal regulatory landscapes delineate cell types, we hypothesized that Fast-ATAC data can be used to deconvolve highly complex cellular populations, such as CD34+ HSPCs, into their constitutive subsets (Fig. 3a). The highly cell-type-specific nature of our ATAC-seq data enabled the development of a strategy we term ‘enhancer cytometry’, wherein we enumerate the frequency of cell types in complex cellular mixtures in silico on the basis of chromatin accessibility data. To do this, we employ the deconvolution algorithm CIBERSORT22 to quantify the contribution of each individual cell type to the ensem-ble profile (Online Methods). Using a filtered peak list, we applied CIBERSORT to define a set of cell-type-specific regulatory elements (Fig. 3b and Supplementary Table 2). We validated this approach using leave-one-out cross-validation and found that enhancer cytom-etry was able to classify all normal hematopoietic cell types (Fig. 3c,d and Supplementary Fig. 8a–g). One exception was the discrimination of HSCs and multipotent progenitor cells (MPPs), which have similar epigenomic profiles and therefore showed reasonable but lower accu-racy than other cell types (Supplementary Fig. 8a,g). Comparison of enhancer cytometry on bulk CD34+ HSPCs to ground truth flow cytometry data showed accurate enumeration of the constituent cell types (r2 = 0.95; Fig. 3e,f). Notably, cell type deconvolution of CD34+
HSPCs using all regulatory elements, including promoters, was not as accurate (r2 = 0.91; Supplementary Fig. 8h). In addition, we found that enhancer cytometry could also be used to deconvolve CD34+ DNase-seq data (Supplementary Fig. 8i), suggesting that ATAC-seq with enhancer cytometry may be a general strategy for identifying and enumerating cell types within existing epigenomic data from complex cellular mixtures.
Regulatory networks of normal hematopoiesisTo better understand the mechanisms governing these diverse regulatory landscapes, we sought to quantify the effect of specific trans-acting factors at each developmental transition. We adapted a computational framework to measure gain or loss of accessibility across regulatory elements sharing a feature or annotation, for exam-ple, a transcription factor motif (Online Methods)23. For subsequent visualization, we clustered similar motifs to create a non-redundant list we call ‘hematopoiesis transcription factor motifs’ (n = 46; Fig. 4a and Online Methods). We found transcription factor motifs such as GATA, RUNX, and SPI1 to be dominant regulators of chromatin accessibility, consistent with published results24–26 (Fig. 4a and Supplementary Fig. 9a). We found that activation of these transcription factors was cell type specific, often displaying stepwise gains across developmental lineages (Supplementary Table 3). This is exemplified by the GATA and PAX motifs, which were strongly enriched in erythroid and lymphoid lineages, respectively (Fig. 4b,c). To validate this approach for determining global transcription factor motif regulators of cell
HSC
MPP
CLP
CMP
MEP
GMP
LMPP
CD34+
DNaseHNRNPD LOC439933MIR1915PTPRG-AS1
11%
10%
8%
17%
22%
11%
21%
Percentageof CD34+ cells
a
De�ne signaturematrix
~500,000ATAC-seq distal elements
Cell typedeconvolution
b
CIBERSORT(support vector regression)
Enhancer cytometryD
ista
l ele
men
ts
HS
C
MP
P
LMP
P
CM
P
GM
P
ME
P
Mon
o
Ery
CLP
CD
4
CD
8 B
NK
ec
0 0.1 0.2 0.3 0.40
0.1
0.2
0.3
0.4
CIBERSORT prediction
HSCMPP
LMPP
CMPGMP
MEP
r2 = 0.95
Flo
w c
ytom
etry
gro
und
trut
h
f
0
0.2
0.4
0.6
0.8
1.0
ATACCD34+ bone
marrow HSPCs
HSC
MPP
LMPP
CMP
GMP
MEPRel
ativ
e fr
actio
n
0
0.2
0.4
0.6
0.8
1.0
Sequential subtractionof cell types
0 0.2 0.4 0.60
0.2
0.4
0.6
CIBERSORT prediction
r2 = 0.84
Syn
thet
ic g
roun
d tr
uth
dHSCMPPLMPPCMPGMPMEPMono
CD4CD8BNK
CLPEry
CIB
ER
SO
RT
pre
dict
ion
HSCMPPLMPPCMPGMPMEPMono
CD4CD8BNK
CLPEry
0 500NormalizedATAC signal
Figure 3 Enhancer cytometry allows for deconvolution of the hematopoietic hierarchy. (a) Normalized ATAC-seq profiles of HSPC subsets and ensemble CD34+ HSPC DNase-seq profiles illustrating heterogeneity among CD34+ HSPC subpopulations. Predicted cell fractions based on flow cytometry of six healthy bone marrow donors are shown on the left, and the nearest annotated genes are shown below. Genomic coordinates: PTPRG-AS1, chr. 3: 62,194,000–62,196,000; LOC439933, chr. 4: 35,761,750–35,763,750; MIR1915, chr. 10: 21,639,750–21,641,750; HNRNPD, chr. 4: 83,205,250–83,207,250. The y-axis scales range from 0–10 in normalized arbitrary units. (b) Schematic of enhancer cytometry with cell-type-specific distal elements (n = 735; right). The signature matrix heat map has an upper bound of 500, and all elements with signal greater than 500 appear red. (c,d) Benchmarking of enhancer cytometry using randomly permuted synthetic mixtures to test robustness to sequential subtraction (c) and randomized mixture content (d). Test data and training data are non-overlapping. In c, synthesized ‘ground truths’ following subtraction are equal mixtures of the remaining cell types. In the leftmost column, all cell types are present in equal parts in the ground truth data. Cell types are then sequentially subtracted from the synthesized ground truth, starting with HSCs, until only NK cells remain. Error bars, s.d. from 100 random permutations. (e) Enhancer cytometry of ATAC-seq data derived from FACS-purified bone marrow CD34+ HSPCs. (f) Correlation of the fractional contribution for each HSPC cell type predicted by enhancer cytometry versus flow cytometry ground truth data for input CD34+ cells. The x axis presents the same data as in e.

©20
16N
atu
re A
mer
ica,
Inc.
All
rig
hts
res
erve
d.
Nature GeNetics ADVANCE ONLINE PUBLICATION �
A rt i c l e s
identity, we compared GATA transcription factor footprints27 between megakaryocyte–erythroid progenitor cells (MEPs) (GATA high) and common lymphoid progenitors (CLPs) (GATA low) and found that CLPs had no detectable binding at GATA sites when compared to MEPs (Fig. 4d).
We next reasoned that the accessibility of a given transcription factor motif should correlate with the expression of the associated transcription factor throughout hematopoiesis. However, the underly-ing motif sequence did not identify the precise causative regulator of accessibility at those motif instances. This is a common issue in epig-enomic studies and is particularly important for cases in which many factors share identical or near-identical transcription factor motifs. To assign motifs to transcription factors, we integrated our ATAC-seq and RNA-seq data to predict causative regulators of motif accessibil-ity (Online Methods, Supplementary Fig. 9b–e, and Supplementary Table 4). Using this approach, we found a striking correlation of motif
usage with the expression of known master regulators of hematopoi-esis (Fig. 4e). For example, the expression of GATA1 and PAX5 was highly correlated with accessibility at GATA and PAX motifs, respec-tively (r = 0.75, P = 1 × 10⁻¹⁸ and r = 0.88, P = 1 × 10−230; Fig. 4e–g and Supplementary Fig. 9f). Interestingly, for some motifs, such as HOX, we found many putative regulators with weak correlations (n = 11; Supplementary Fig. 9g,h), suggesting that regulation of HOX accessi-bility is more complex. We provide the complete list of non-redundant transcription factor deviations, transcription factor motif–gene asso-ciation table, and gene correlation analysis as an associated resource (Supplementary Tables 3 and 4, and Supplementary Data).
Regulome profiles chart the ontogeny of human diseasesIn addition to enhancing understanding of developmental gene regula-tion, the hematopoietic regulome can trace the ontogeny of activity in the noncoding genome that influences human disease. Many genome-wide
h i j k
–2
7
Relativedeviation
MCV GWAS
HSC
MPP
CLP
CMP
MEPGMP
LMPP
CD4 CD8 B NK Mono Ery
Rheumatoid arthritis GWAS
HSC
MPP
CLP
CMP
MEPGMP
LMPP
CD4 CD8 B NK Mono Ery
–2
6
Relativedeviation
Alopecia areata GWAS
HSC
MPP
CLP
CMP
MEPGMP
LMPP
CD4 CD8 B NK Mono Ery
0
7
Relativedeviation
Alzheimer GWAS
HSC
MPP
CLP
CMP
MEPGMP
LMPP
CD4 CD8 B NK Mono Ery
–0.5
4.5
Relativedeviation
e f gd
Position relative to GATA motif (bp)–200 –100 0 100
Nor
mal
ized
tran
spos
ition
dens
ity (
×10
4 )
0.5
1.0
1.5
2.0
2.5
MEPCLP
–200
3.0
Correlation (Pearson)–1 –0.5 0 0.5 1
Sig
nific
ance
–lo
g 10 (
P v
alue
)
0
100
200
300
PAX1
PAX5
01020304050
GATA1
GATA2GATA3
All TFsPutative regulators
–2
12log2 (counts)
GATA1 expression
HSC
MPP
CLP
CMP
MEPGMP
LMPP
CD4 CD8 B NK Mono Ery
PAX5 expression
HSC
MPP
CLP
CMP
MEPGMP
LMPP
CD4 CD8 B NK Mono Ery
–2
12log2 (counts)
a b
–20
50
Relativedeviation
c
TCF3
NR2F1
MEIS1
ROR
REL
ELF1
CEBPB STAT3
MECOM
JUN
RUNX
FOS
GATA
HOX
TAL1-TCF3
STAT4
ESRRB NR4A2
CTCF
PAX5
PAX6
T-box
EBF1
ZEB1FEV
IRF2IRF1
SPI1
GFI1
EHF
HNF4A
ERG
PRDM1
TAL1-GATA
HLF
MYB
GATA motif usage
HSC
MPP
CLP
CMP
MEPGMP
LMPP
CD4 CD8 B NK Mono Ery
PAX5 motif usage
HSC
MPP
CLP
CMP
MEPGMP
LMPP
CD4 CD8 B NK Mono Ery
0
25
Relativedeviation
Figure 4 Integrative analysis of the hematopoietic regulome refines the transcriptional circuitry driving cell specification and enriches understanding of human disease. (a) Transcription factor dynamics showing major transcription factors driving hematopoietic regulomes. The size of each circle represents the effect of the corresponding motif in driving accessibility in human blood cells. The relative distance between circles represents the co-occurrence of motifs throughout hematopoietic differentiation (Online Methods). (b,c) Usage of GATA (b) and PAX5 (c) motifs throughout hematopoietic differentiation. Values represent the relative deviation of motif accessibility, a measure of motif usage in comparison to that in HSCs. (d) Footprint analysis of the GATA motif in MEP and CLP cells. (e) Pearson correlation of motif accessibility with transcription factor (TF) expression plotted against the significance of this correlation for GATA (top) and PAX (bottom) motifs. Red dots correspond to DNA-binding factors found in the analysis in supplementary Figure 9b to bind the given motif. Gray dots represent all other DNA-binding factors. (f,g) Expression of GATA1 (f) and PAX5 (g) phenocopies usage of GATA (b) and PAX5 (c) motifs throughout hematopoietic differentiation. (h–k) Relative deviation scores of chromatin accessibility within hematopoietic regulatory elements with GWAS SNPs for MCV (h), rheumatoid arthritis (i), alopecia areata (j), and Alzheimer disease (k) (Online Methods). Darker red color is representative of enrichment of GWAS SNPs in open chromatin regions of the given cell type.
©20
16N
atu
re A
mer
ica,
Inc.
All
rig
hts
res
erve
d.
� ADVANCE ONLINE PUBLICATION Nature GeNetics
A rt i c l e s
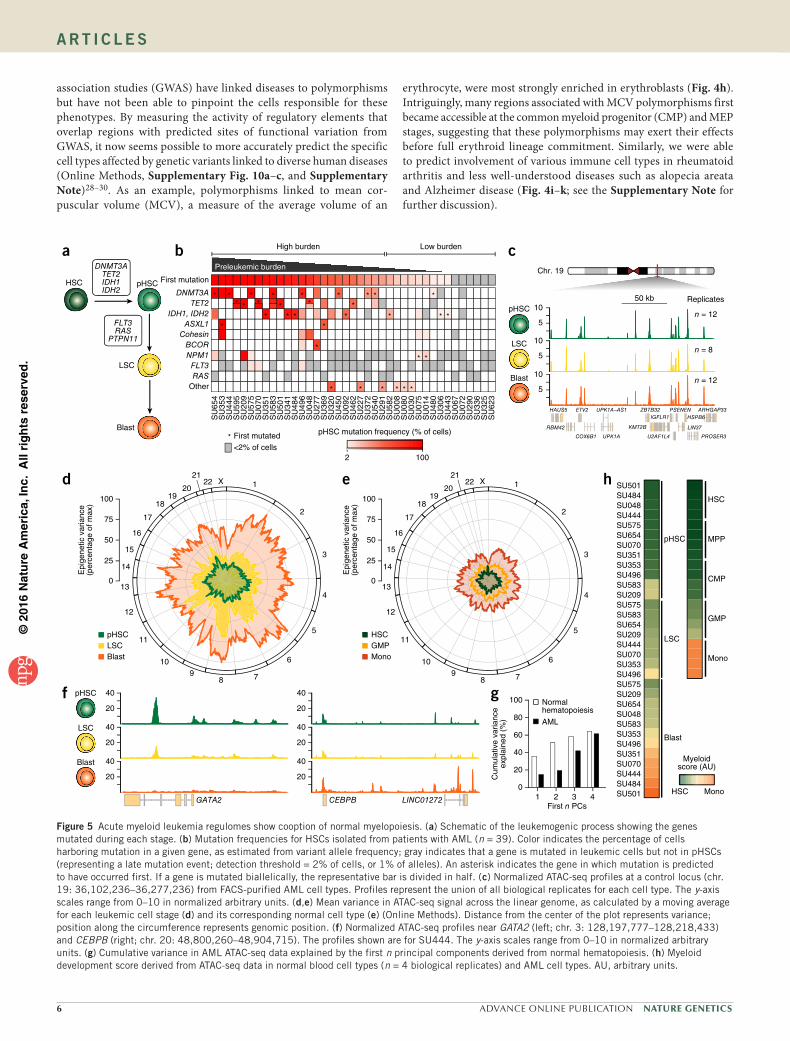
association studies (GWAS) have linked diseases to polymorphisms but have not been able to pinpoint the cells responsible for these phenotypes. By measuring the activity of regulatory elements that overlap regions with predicted sites of functional variation from GWAS, it now seems possible to more accurately predict the specific cell types affected by genetic variants linked to diverse human diseases (Online Methods, Supplementary Fig. 10a–c, and Supplementary Note)28–30. As an example, polymorphisms linked to mean cor-puscular volume (MCV), a measure of the average volume of an
erythrocyte, were most strongly enriched in erythroblasts (Fig. 4h). Intriguingly, many regions associated with MCV polymorphisms first became accessible at the common myeloid progenitor (CMP) and MEP stages, suggesting that these polymorphisms may exert their effects before full erythroid lineage commitment. Similarly, we were able to predict involvement of various immune cell types in rheumatoid arthritis and less well-understood diseases such as alopecia areata and Alzheimer disease (Fig. 4i–k; see the Supplementary Note for further discussion).
a b
<2% of cells* First mutated
SU
654
SU
353
SU
444
SU
595
SU
209
SU
575
SU
070
SU
351
SU
583
SU
501
SU
341
SU
484
SU
496
SU
048
SU
277
SU
369
SU
320
SU
450
SU
092
SU
462
SU
227
SU
372
SU
540
SU
291
SU
582
SU
008
SU
080
SU
030
SU
075
SU
014
SU
480
SU
306
SU
443
SU
067
SU
072
SU
290
SU
336
SU
325
SU
623
Other
BCOR
RASFLT3
NPM1
CohesinASXL1
IDH1, IDH2
DNMT3A
First mutation
Preleukemic burden
* * * * * *
* **
* ** * * * * **
* * * * * * * * ** ** * * *
High burden Low burden
TET2
pHSC mutation frequency (% of cells)
2 100
c
PROSER3U2AF1L4
ARHGAP33
UPK1A
PSENENETV2
COX6B1
ZBTB32
KMT2B
HAUS5
LIN37RBM42
IGFLR1 HSPB6UPK1A−AS1
50 kb
5
10
Chr. 19
Replicates
n = 12
5
10
5
10
pHSC
LSC
Blast
n = 8
n = 12
pHSC
LSC
Blast
HSC
DNMT3ATET2IDH1IDH2
FLT3RAS
PTPN11
d
g
1 2 3 40
20
40
60
80
100
First n PCs
Normalhematopoiesis
AML
Cum
ulat
ive
varia
nce
expl
aine
d (%
)
h
Myeloidscore (AU)
HSC Mono
HSC
MPP
CMP
GMP
Mono
pHSC
LSC
Blast
SU501SU484SU444SU070SU351SU496SU353SU583SU048SU654SU209SU575SU496SU353SU070SU444SU209SU654SU583SU575SU209SU583SU496SU353SU351SU070SU654SU575SU444SU048SU484SU501
f
CEBPBGATA2
20
40
20
40
20
40
20
40
20
40
20
40
LINC01272
pHSC
LSC
Blast
1
2
3
4
5
6
789
10
11
12
13
14
15
16
17
1819
20
2122 X1
2
3
4
5
6
789
10
11
12
13
14
15
16
17
1819
20
2122 X
Epi
gene
tic v
aria
nce
(per
cent
age
of m
ax)
100
75
50
25
0
pHSCLSCBlast
Epi
gene
tic v
aria
nce
(per
cent
age
of m
ax)
100
75
50
25
0
HSCGMPMono
e
Figure 5 Acute myeloid leukemia regulomes show cooption of normal myelopoiesis. (a) Schematic of the leukemogenic process showing the genes mutated during each stage. (b) Mutation frequencies for HSCs isolated from patients with AML (n = 39). Color indicates the percentage of cells harboring mutation in a given gene, as estimated from variant allele frequency; gray indicates that a gene is mutated in leukemic cells but not in pHSCs (representing a late mutation event; detection threshold = 2% of cells, or 1% of alleles). An asterisk indicates the gene in which mutation is predicted to have occurred first. If a gene is mutated biallelically, the representative bar is divided in half. (c) Normalized ATAC-seq profiles at a control locus (chr. 19: 36,102,236–36,277,236) from FACS-purified AML cell types. Profiles represent the union of all biological replicates for each cell type. The y-axis scales range from 0–10 in normalized arbitrary units. (d,e) Mean variance in ATAC-seq signal across the linear genome, as calculated by a moving average for each leukemic cell stage (d) and its corresponding normal cell type (e) (Online Methods). Distance from the center of the plot represents variance; position along the circumference represents genomic position. (f) Normalized ATAC-seq profiles near GATA2 (left; chr. 3: 128,197,777–128,218,433) and CEBPB (right; chr. 20: 48,800,260–48,904,715). The profiles shown are for SU444. The y-axis scales range from 0–10 in normalized arbitrary units. (g) Cumulative variance in AML ATAC-seq data explained by the first n principal components derived from normal hematopoiesis. (h) Myeloid development score derived from ATAC-seq data in normal blood cell types (n = 4 biological replicates) and AML cell types. AU, arbitrary units.

©20
16N
atu
re A
mer
ica,
Inc.
All
rig
hts
res
erve
d.
Nature GeNetics ADVANCE ONLINE PUBLICATION �
A rt i c l e s
Leukemogenesis and cancer evolution in AMLTo characterize the evolution of AML31 in the context of normal hematopoiesis, we identified three distinct stages of AML evolution—preleukemic HSCs (pHSCs), leukemia stem cells (LSCs), and leukemic blast cells (blasts)—that can be enriched by FACS (Supplementary Fig. 11a,b). Current data indicate that HSCs serve as the reservoir for mutation acquisition during the early phases of leukemogenesis (Fig. 5a). Acquisition of founder mutations creates pHSCs that expand to create a preleukemic clone. Subsequent acquisition of progressor mutations generates LSCs that are capable of self-renewal and the production of AML blasts32 (Fig. 5a).
Notably, the population of HSCs isolated from patients with leukemia by FACS represents a heterogeneous mixture of healthy, non-mutated HSCs and pHSCs. To quantify this heterogeneity, we define ‘preleukemic burden’ as the percentage of HSCs isolated
from a patient with leukemia that harbor at least the first mutation. We profiled the frequency of known leukemogenic driver mutations in HSCs, T cells, and blasts from 39 patients with AML (Supplementary Fig. 11c and Supplementary Table 5). Preleukemic burden was highly variable in this cohort, with some patients exhibiting a com-plete repopulation of the HSC compartment with preleukemic cells and others exhibiting undetectable levels of preleukemic mutations (Fig. 5b and Supplementary Fig. 11d).
AML represents a cooption of normal myelopoiesisThe AML leukemogenic process provides a new system to study the genesis and evolution of cancer. The Fast-ATAC protocol produced robust accessibility profiles from cryopreserved patient-derived primary AML cells (Fig. 5c). We found that the level of variance in DNA accessibility across all samples of the same cell type increased
i
SU353 blast, log2 (fragments)
GM
P, l
og2
(fra
gmen
ts)
SU353 blast, log2 (fragments)
Syn
thet
ic n
orm
al,
log 2
(fra
gmen
ts)
g h
Per
cent
of p
eaks
attr
ibut
edto
mye
loid
diff
eren
tiatio
n Closest normal
SU
444
SU
353
SU
070
SU
654
SU
484
SU
048
SU
575
SU
501
SU
209
SU
583
SU
351
SU
496
SU
353
SU
444
SU
209
SU
070
SU
583
SU
654
SU
575
SU
496
SU
501
SU
484
SU
444
SU
654
SU
583
SU
070
SU
209
SU
496
SU
351
SU
575
SU
048
SU
353
pHSC LSC Blast
HSCMPPLMPPGMPMono
0
20
40
60
4 6 8 10 12
4
6
8
10
12
r = 0.84n = 709
n = 899
4 6 8 10 12
4
6
8
10
12
r = 0.80n = 1,107
n = 1,791
HSCMPPLMPPCMPGMPMEPMono
CD4CD8BNK
CLPEry
a
Rel
ativ
e fr
actio
n
SU
070
SU
501
SU
575
SU
484
SU
583
SU
444
SU
654
SU
496
SU
209
SU
351
SU
353
SU
048
SU
654
SU
209
SU
583
SU
575
SU
353
SU
444
SU
070
SU
496
SU
048
SU
575
SU
209
SU
353
SU
654
SU
583
SU
484
SU
351
SU
501
SU
070
SU
444
SU
496
pHSC LSC Blast
0
0.2
0.4
0.6
0.8
1.0
Cell captureFACS Transposition
scATAC-seq
PCR
Barcode andpool libraries
High-throughputsequencing
Single cellProjection
Cell typeprediction using
enhancer cytometry
b
c
PC3 (×104) (11.62%)–1 0 1 2
PC
4 (×
104 )
(8.
59%
)
–2
–1
0
1
2
HSC
GMP
Mono
B
CLP
PC3 (×104) (11.62%)–1 0 1 2
PC
4 (×
104 )
(8.
59%
)
–2
–1
0
1
2
HSC
GMP
Mono
B
CLPSingle SU070 LSC
d e fSingle SU070 blast
HS
CM
PP
LMP
P
GM
P
Mon
o
0
0.2
0.4
0.6
0.8
Myeloid progression (AU)
Rela
tive d
ensi
ty
SU070-LSCSU070-blastSU353-LSCSU353-blast
HS
CM
PP
LMP
P
GM
P
Mon
o
0
0.2
0.4
0.6
0.8
Myeloid progression (AU)
Rela
tive d
ensi
ty
MonoLMPP
Figure 6 Enhancer cytometry and single-cell regulomes support a model of regulatory heterogeneity and allow for deconvolution of AML-specific biology. (a) Enhancer cytometry deconvolution showing the predicted contribution of various normal cell types to the regulatory landscape of different AML cell types. (b) Schematic of the scATAC-seq protocol and analysis (Online Methods). (c,d) Projection of ATAC-seq data derived from single SU070 LSCs (n = 71) (c) and single SU070 blasts (n = 42) (d) onto principal components derived from the normal hematopoietic hierarchy. (e,f) Relative densities of single LMPPs (n = 68) and monocytes (n = 90) (e) and of single SU070 LSCs (n = 62), SU070 blasts (n = 42), SU353 LSCs (n = 36), and SU353 blasts (n = 52) (f) projected onto a one-dimensional representation of myeloid developmental progression. AU, arbitrary units. (g,h) Scatterplots showing the correlation of ATAC-seq data derived from SU353 blasts with the closest normal cell type (GMP) (g) and enhancer cytometry–defined synthetic normal (h). The cutoff for differential peaks was a log2 (fold change) greater than 3. The r values reported were calculated from correlation of all peaks. Plots show 50,000 random peaks, each with at least five reads. (i) Comparison of AML cell types to synthetic normal analogs. For each sample, the closest normal cell type is indicated by the color of the bar. The percentage of the total significant peaks (called by comparison to the closest normal) that were removed by comparison to synthetic normal analogs is plotted for each sample.

©20
16N
atu
re A
mer
ica,
Inc.
All
rig
hts
res
erve
d.
� ADVANCE ONLINE PUBLICATION Nature GeNetics
A rt i c l e s
through progressive stages of leukemia evolution (Fig. 5d and Online Methods). All AML cell types exhibited more between-donor sample-to-sample variance than the corresponding normal hemat-opoietic cells (Fig. 5e). This may be a manifestation of the point along the normal hematopoietic hierarchy at which the particular AML cell types exist. Indeed, key developmentally associated genes such as GATA2 and CEBPB showed variation among the AML cell types consistent with different developmental stages (Fig. 5f), and we found that the first four principal components derived from normal hematopoietic differentiation accounted for much of the variation observed in our leukemia samples (Fig. 5g and Online Methods). Assigning a score to the myeloid differentiation component of our ATAC-seq data, we found that the various stages of AML spread across the trajectory from HSC to monocyte, indicating that the process of
leukemogenesis largely mirrors the process of normal myelopoi-esis (Fig. 5h and Supplementary Fig. 11e,f). Consistent with their functional ability to produce both lymphoid and myeloid cells in xenotransplantation assays11–13, pHSCs were most closely related to HSCs and MPPs (Fig. 5h). As shown previously33, LSCs exhibited strong similarity to granulocyte–macrophage progenitor cells (GMPs) and lymphoid–primed multipotent progenitor cells (LMPPs) and leukemic blasts showed a wider distribution, with less differentiated blasts clustering with GMP cells and more differentiated blasts cluster-ing with monocytes34,35 (Fig. 5h).
AML cell types exhibit regulatory heterogeneityThe observed developmental positions across myelopoiesis suggest that each patient-specific AML might harbor a unique collection
0
SU070
SU353
SU444
SU484
SU575
CB HSPC
BM H
SPC
SU070
SU353
SU444
SU484
SU575
CB HSPC
BM H
SPC
20
40
60
80
100 **
Ret
entio
n of
ste
mne
ss(%
CD
34+C
D33
– )
0
20
40
60
80
100**
Ret
entio
n of
ste
mne
ss(%
CD
34+C
D33
– )
0
0.5
1.0
1.5
2.0
2.5***
Fol
d ch
ange
in p
erce
nt C
D34
+
(nor
mal
ized
to s
hNT
)
Non-targeting 1 2 3
shHOXA9
f g****
2
4
6
8
Fol
d ch
ange
in p
erce
nt C
D34
+
(nor
mal
ized
to s
hNT
)
pHSC erythroid differentiation
Cord blood CD34+ cell myeloid differentiation Cord blood CD34+ cell erythroid differentiation
h
i
0 500 1,000 1,500 2,000 2,500 3,0000
20
40
60
80
100
Days elapsed
Per
cent
sur
viva
l Low pHSC
High pHSC
0
20
40
60
80
100
Days elapsed
P = 0.01HR = 3.30
P = 0.03HR = 2.99
Per
cent
sur
viva
l
Relapse-free survival
d epHSC myeloid differentiation
Non-targeting 1 2 3
shHOXA9
0 500 1,000 1,500 2,000 2,500 3,000
Low pHSC
High pHSC
1
3
Overall survival
a b c
Mod
ule
–5 5log2 (fold change)
1
2
3
4
5
6
7
pHSC LSC Blast
1
6
5
4
2
3
7
Stage
HSC pHSC LSC Blast
log 2
(fol
d ch
ange
)
–4
–3
–2
–1
0
1
2
Module
31234567
Enrichm
ent
FOS
BACH1
NFE2l2
CEBPBHLF
RUNXHOX
TCF3
TAL1-G
ATA
Figure 7 Early chromatin accessibility alterations in pHSCs cause defects in differentiation that correlate with adverse patient outcomes. (a) k-means clustering was used to identify seven clusters of covarying peaks, termed regulatory modules (Online Methods). (b) Enrichment of each regulatory module from a at each stage of leukemia evolution. All biological replicates for each AML cell type were merged. Error bars, 1 s.d. across all samples of that given cell type. (c) Enrichment and hierarchical clustering of transcription factor motifs enriched in each of the seven AML-specific regulatory modules. (d,e) Retention of CD34 expression, as measured by flow cytometry analysis, after 6 d of enforced differentiation down the myeloid (d) or erythroid (e) lineage. Error bars, 1 s.d. Experiments were performed in triplicate. (f,g) Fold change in the percentage of cells expressing CD34 as measured by flow cytometry analysis of cord blood–derived HSCs transduced with shRNAs targeting HOXA9 (shHOXA9) or a non-targeting control. CD34 expression was measured after 6 d of differentiation down the myeloid (f) or erythroid (g) lineage. Only GFP-positive transduced cells were analyzed. Error bars, 1 s.d. Experiments were carried out in triplicate. P values in d–g were derived from two-tailed t tests: **P < 0.01, ***P < 0.001, ****P < 0.0001. (h,i) Overall (h) and relapse-free (i) survival of patients stratified by preleukemic burden (high burden, n = 24; low burden, n = 15). High preleukemic burden was defined by >20% of HSCs harboring at least the first preleukemic mutation. P values comparing the two Kaplan–Meier survival curves were calculated using the log-rank (Mantel–Cox) test. Hazard ratios (HRs) were determined using the Mantel–Haenszel approach.

©20
16N
atu
re A
mer
ica,
Inc.
All
rig
hts
res
erve
d.
Nature GeNetics ADVANCE ONLINE PUBLICATION �
A rt i c l e s
of multiple distinct normal regulatory programs. Using enhancer cytometry, we quantified the contribution of each normal cell type to each leukemic sample assayed (Fig. 6a, Supplementary Fig. 12a, and Supplementary Table 6). We found that each patient, at each stage of leukemogenesis, harbored regulatory contributions from multiple distinct normal cell types that are often developmentally distinct from each other. This result raises the intriguing possibility that individual AML cells might either (i) exist in mixed cell states that are not typically maintained during normal hematopoiesis or (ii) show cellular heterogeneity, wherein a mixture of cell states exists within the leukemic clone. Notably, we found that the majority of the patient donors had AML blasts that were clonally derived and harbored all the leukemic mutations at comparable allele frequencies (Supplementary Table 5), suggesting that the epigenomic diversity observed through enhancer cytometry is not related to genetic het-erogeneity of AML cells.
To discriminate between these two possibilities, we performed single- cell ATAC-seq (scATAC-seq) on purified LSCs and blasts from two patients with AML and compared these samples to myeloid cells from healthy donors. We then performed enhancer cytometry using principal-component analysis (PCA) trained on our ensemble ATAC-seq data (Fig. 6b and Online Methods). This analytical framework was validated by projection of downsampled bulk ATAC-seq data (Supplementary Fig. 12b,c) and enabled accurate projection of single-cell accessibility profiles onto hematopoietic principal com-ponents (Fig. 6c,d and Supplementary Fig. 12d,e). The relationship between developmental progression and single-cell chromatin acces-sibility could be further visualized as a one-dimensional histogram (Fig. 6e,f, Online Methods, and Supplementary Fig. 12f).
For normal physiological comparison, we performed scATAC-seq on normal monocytes (n = 88) and LMPPs (n = 94) isolated from healthy donors. Single LMPP and monocyte cells showed myelopoietic developmental projection scores centered at the predicted ensemble scores (Fig. 6e). In contrast, AML cells were either uniformly centered at developmentally intermediate states (for example, SU070 LSCs with unimodal peaks located between normal LMPPs and mono-cytes in Fig. 6f) or alternatively showed broad bimodal distributions representing regulomes from both intermediate and developmentally normal cell states (for example, SU353 LSCs and blasts; Fig. 6f). In addition, widely used cell lines, such as the AML line HL60, also showed a unimodal and mixed normal cell regulome, observed by ensemble and single-cell ATAC-seq (Supplementary Fig. 12g–i). These results show that the regulatory heterogeneity observed in the ensemble profiles of AML samples can arise from both single-cell intra- and intercellular heterogeneity (see the Supplementary Note for an extended discussion).
Synthetic normal analogs uncover AML-specific biologyThe ability to accurately quantify the contribution of each normal cell regulome to the epigenetic profile of a leukemic cell type enables more robust identification of AML-specific regulatory elements. In particular, analyses of leukemic cell types in the past have relied on comparing malignant cells to a carefully chosen normal cell type (for example, GMPs). Here, because of the regulatory heterogeneity in AML, we reasoned that an effective normal cell comparison would be possible with the generation of ‘synthetic normals’ that represent admixtures of various normal cells defined by enhancer cytometry (Online Methods). Although comparison of AML cell types to their closest normal cell analogs yielded a high correlation (r = 0.80; Fig. 6g), comparison of AML cell types to their synthetic normal ana-logs yielded higher correlation (r = 0.84; Fig. 6h and Supplementary
Fig. 13a) and, more notably, led to a reduction in the number of AML-specific peaks identified (n = 899 compared to n = 1,791; Fig. 6i and Supplementary Fig. 13b,c). Moreover, comparing samples to the synthetic normal from each individual AML cell type reduced global measures of epigenetic variance (Supplementary Fig. 13d compared to Fig. 5d).
To identify clusters of coordinately regulated elements, fold change values between each AML and its synthetic normal were clustered using k-means clustering to identify seven distinct regulatory mod-ules (Fig. 7a, Online Methods, and Supplementary Fig. 14a). Usage of these modules was tracked through leukemogenesis to identify patterns related to specific AML cell types (Fig. 7b). Each module showed enrichment for peaks associated with different key tran-scription factors (Fig. 7c). For example, modules 6 and 7 showed strong enrichment for JUN and FOS activity. Similar observations of increased JUN/FOS accessibility have been made from DNase-seq data in FLT3-ITD–positive AML20, suggesting that this result may be related to the high prevalence of FLT3 mutations in our patient cohort. This increase in accessibility of JUN/FOS motifs was reflected by an increase in expression of these factors by RNA-seq (Supplementary Fig. 14b) and was maintained through the stages of leukemogenesis, identifying inhibition of these pathways as a potential therapeutic strategy in AML (Supplementary Fig. 14c–e). This observation is consistent with previous publications that identified overexpression of JUN in AML36 and found c-JUN N-terminal kinase (JNK) inhibi-tion to be a putative therapeutic strategy37,38 and indicate that similar strategies may prove efficacious in targeting pHSCs.
Mechanism and consequences of pHSC clonal advantageUsing ATAC-seq and enhancer cytometry, we show that pHSCs share many regulatory programs with HSCs and MPPs (Fig. 6a). Nevertheless, comparison to synthetic normal analogs identified dis-tinct regulatory modules (modules 1 and 2) that showed decreased accessibility in pHSCs, representing the earliest known event of AML evolution (Fig. 7b). These repressed regulatory modules are enriched for motifs associated with HSPCs (HOX, RUNX, and GATA) and provide direct evidence to support a model in which pHSCs maintain a unique epigenetic and functional state.
To better understand the consequences of loss in accessibility at motifs associated with HSPCs, we probed pHSCs for phenotypic changes related to self-renewal and differentiation. When pHSCs were induced to differentiate down the myeloid and erythroid line-ages (Supplementary Fig. 14f), pHSCs showed strong resistance to differentiation, instead favoring maintenance of the stem cell immunophenotype as indicated by retention of CD34 expression (Fig. 7d,e). We hypothesized that the observed decreased accessibil-ity at HOX transcription factor motifs might mediate the observed retention of stem cell immunophenotype. Indeed, depletion of one such HOX factor, HOXA9, by short hairpin RNA (shRNA)-mediated knockdown (Supplementary Fig. 14g and Supplementary Table 7) in umbilical cord blood CD34+ HSPCs led to retention of stem cell immunophenotype in the context of both myeloid (Fig. 7f) and erythroid (Fig. 7g) differentiation. Moreover, a concomitant decrease in differentiated granulocytes and erythroid cells was also observed (Supplementary Fig. 14h–j), consistent with results from mouse models of HOXA9 deficiency39,40. Together, these results suggest that decreased HOX accessibility in pHSCs may promote retention of stem cell characteristics and prevent differentiation of these cells. Additional HOX factors may have a role in defective pHSC differentiation, as the role of HOXA9 in hematopoiesis and leukemogenesis is complex39–41.

©20
16N
atu
re A
mer
ica,
Inc.
All
rig
hts
res
erve
d.
�0 ADVANCE ONLINE PUBLICATION Nature GeNetics
A rt i c l e s
pHSC resistance to differentiation potentially explains the obser-vation that pHSCs outcompete their normal HSC counterparts in vivo (Fig. 5b and Supplementary Fig. 14k). pHSCs would gain an evolutionary advantage while promoting an HSC-like state and thus increase the likelihood of acquiring additional leukemogenic mutations. One implication of this model is that preleukemic burden may have adverse effects on patient survival, despite the fact that pHSCs do not confer disease in xenograft transplant assays11–13. Characterization of our patient cohort showed that preleukemic burden inversely correlated with overall and relapse-free survival (hazard ratio = 3.30 for overall survival and 2.99 for relapse-free sur-vival, P < 0.05; Fig. 7h,i). These results further implicate pHSCs in AML pathology and suggest a mechanism whereby AML arises from a preleukemic clone that is capable of outcompeting its normal HSC counterparts (Supplementary Fig. 14k), which predisposes patients to more aggressive or therapy-refractory leukemia.
DISCUSSIONHere we report a rich resource charting the epigenomic and tran-scriptomic landscape of 16 unique blood cell types. This resource relies on accurate and precise determination of the regulome land-scapes in primary human blood cells, made possible by Fast-ATAC. Unsupervised clustering of accessible chromatin regions, specifically distal elements, groups individual cell types with high cluster purity (91% for ATAC-seq in comparison to 78% for RNA-seq), suggesting that these distal regulatory elements more precisely define cell iden-tity and developmental trajectory. Enhancer cytometry harnesses this specificity and enumerates the frequencies of pure cell types in complex cell mixtures. This technique may be applicable to address cell type heterogeneity in other contexts of stem cell biology or cell therapy.
Additionally, this atlas of human hematopoiesis enriches the interpretation of GWAS results in several ways. We identify strong associations of disease-linked polymorphisms with the open chro-matin landscapes of specific hematopoietic cell types, potentially uncovering the developmental contexts in which the disease- relevant elements first become active. In the case of MCV, the strongest association occurs in erythroblast cells, but a significant association can be seen as early as the CMP stage. These results are consistent with the concept that many enhancers are developmen-tally primed before their activation following cell differentiation3. Our resource further provides a platform to identify specific trans regulators that drive blood cell identity and function. Integration of ATAC-seq and RNA-seq data improves motif–transcription factor pairing and can facilitate the determination of causative regulators of chromatin accessibility throughout hematopoietic differentiation. We anticipate that this combined data set, which represents a dynamic developmental process, will be a rich resource for continued efforts to build computational tools that model both cis42 and trans43 deter-minants of chromatin accessibility and gene expression.
Application of this resource to the study of three distinct time points in AML evolution sheds light on the biology and stepwise progression of leukemia evolution. A longstanding debate in cancer biology is how cancer cells violate cell lineage rules44,45, for example, by maintaining self-renewal in an otherwise differentiated cell state. By using our comprehensive map of hematopoiesis, patient-matched AML cell subsets, and scATAC-seq data for hundreds of individual leukemic and normal cells, we show evidence of regulatory heteroge-neity in the epigenome—a single cell with several normally distinct regulatory programs (Supplementary Note). We find that such mixed
regulatory programs may be the result of both intra- and intercellular regulatory heterogeneity.
This regulatory heterogeneity suggests that there might be no appropriate ‘normal’ for tumor–normal comparisons in epigenomic and transcriptomic studies. Instead, we use enhancer cytometry to construct synthetic normals—proportionally matching the predicted fractional contribution of cell-type-specific regulomes from normal hematopoiesis—to pinpoint cancer-specific aberrations. This approach led us to identify loss of HOX-mediated accessibility as the most con-sistent defect in pHSCs. We found that loss of a HOX factor can, in fact, cause defects in differentiation similar to those observed in pHSCs and potentially confer an evolutionary advantage. Notably, higher pre-leukemic burden is predictive of poor overall and relapse-free survival in AML, indicating an important role for pHSCs in pathogenesis.
The methodologies developed here for the study of AML have important implications for the study of other blood and solid tumor malignancies. We anticipate that regulatory heterogeneity is a wide-spread phenomenon in many types of cancer and that our integrative approach using enhancer cytometry to construct synthetic normal analogs could be broadly applicable to many pathologies. Future stud-ies harnessing the power of enhancer cytometry to understand other cancer-specific regulatory networks could provide key insights into the aberrations that drive the formation and persistence of malignant disease. Thus, we believe that this work provides a methodological framework for the paradigm of mapping regulomes of normal tissues to better understand the ontogeny of human disease.
URLs. JASPAR, http://jaspar.genereg.net/; UCSC Genome Browser Track Hub, https://s3-us-west-1.amazonaws.com/chang-public-data/2016_NatGen_ATAC-AML/hub.txt.
METHODSMethods and any associated references are available in the online version of the paper.
Accession codes. All ensemble ATAC-seq and RNA-seq data are avail-able under Gene Expression Omnibus (GEO) accession GSE74912. We provide raw sequencing reads, processed BAM files, and fully processed count matrices for ATAC-seq and RNA-seq under this accession. All scATAC-seq data are available under GEO accession GSE74310. All analyses and coordinates referenced here are for the hg19 human reference genome.
Note: Any Supplementary Information and Source Data files are available in the online version of the paper.
ACKnoWLeDGMentSWe thank C. Mazumdar and A. Raj for assistance with RNA-seq, A. Newman for expert assistance with CIBERSORT, and our laboratory members for discussion. We thank the Stanford Hematology Division Tissue Bank and the patients for donating their samples. M.R.C. acknowledges NIH training grant R25CA180993 and NIH F31 Predoctoral fellowship F31CA180659. J.D.B. acknowledges National Science Foundation Graduate Research Fellowships and NIH training grant T32HG000044 for support. M.P.S. acknowledges the NIH and NHGRI for funding through 5U54HG00455805. Research was also supported by the NIH (P50HG007735 to H.Y.C., W.J.G., and M.P.S.), UH2AR067676 (H.Y.C.), the Stanford Cancer Center (H.Y.C.), the Howard Hughes Medical Institute (H.Y.C. and J.K.P.), the Stinehart-Reed Foundation (R.M.), the Ludwig Institute (R.M.), and the NIH (R01CA18805 to R.M.). R.M. is a New York Stem Cell Foundation Robertson Investigator.
AUtHoR ContRIBUtIonSM.R.C., J.D.B., R.M., and H.Y.C. conceived the project. M.R.C. performed all cell sorting, RNA-seq, and CIBERSORT analysis, AML cell culture experiments, and

©20
16N
atu
re A
mer
ica,
Inc.
All
rig
hts
res
erve
d.
Nature GeNetics ADVANCE ONLINE PUBLICATION ��
A rt i c l e s
mouse experiments. J.D.B. performed all ATAC-seq data analysis and regulatory network analysis, and oversaw all ATAC-seq library generation and protocol optimization performed by B.W. M.R.C. and J.L.K. performed DNA genotyping for patients with AML. J.D.B., P.G.G., and A.K. performed GWAS correlation analyses. W.J.G., M.P.S., and J.K.P. assisted with sequencing and study design. S.M.C. collected patient follow-up data and performed all survival analyses. M.R.C., J.D.B., R.M., and H.Y.C. wrote the manuscript with input from all authors.
CoMPetInG FInAnCIAL InteReStSThe authors declare competing financial interests: details are available in the online version of the paper.
Reprints and permissions information is available online at http://www.nature.com/reprints/index.html.
1. Quesenberry, P.J. & Colvin, G.A. in Williams Hematology 153–174 (McGraw-Hill, 2005).
2. Ji, H. et al. Comprehensive methylome map of lineage commitment from haematopoietic progenitors. Nature 467, 338–342 (2010).
3. Lara-Astiaso, D. et al. Chromatin state dynamics during blood formation. Science 345, 943–949 (2014).
4. Chen, L. et al. Transcriptional diversity during lineage commitment of human blood progenitors. Science 345, 1251033 (2014).
5. Novershtern, N. et al. Densely interconnected transcriptional circuits control cell states in human hematopoiesis. Cell 144, 296–309 (2011).
6. Buenrostro, J.D., Giresi, P.G., Zaba, L.C., Chang, H.Y. & Greenleaf, W.J. Transposition of native chromatin for fast and sensitive epigenomic profiling of open chromatin, DNA-binding proteins and nucleosome position. Nat. Methods 10, 1213–1218 (2013).
7. Jin, W. et al. Genome-wide detection of DNase I hypersensitive sites in single cells and FFPE tissue samples. Nature 528, 142–146 (2015).
8. Shih, A.H. et al. The role of mutations in epigenetic regulators in myeloid malignancies. Nat. Rev. Cancer 12, 599–612 (2012).
9. Genovese, G. et al. Clonal hematopoiesis and blood-cancer risk inferred from blood DNA sequence. N. Engl. J. Med. 371, 2477–2487 (2014).
10. Jaiswal, S. et al. Age-related clonal hematopoiesis associated with adverse outcomes. N. Engl. J. Med. 371, 2488–2498 (2014).
11. Jan, M. et al. Clonal evolution of preleukemic hematopoietic stem cells precedes human acute myeloid leukemia. Sci. Transl. Med. 4, 149ra118 (2012).
12. Corces-Zimmerman, M.R., Hong, W.-J., Weissman, I.L., Medeiros, B.C. & Majeti, R. Preleukemic mutations in human acute myeloid leukemia affect epigenetic regulators and persist in remission. Proc. Natl. Acad. Sci. USA 111, 2548–2553 (2014).
13. Shlush, L.I. et al. Identification of pre-leukaemic haematopoietic stem cells in acute leukaemia. Nature 506, 328–333 (2014).
14. Majeti, R., Park, C.Y. & Weissman, I.L. Identification of a hierarchy of multipotent hematopoietic progenitors in human cord blood. Cell Stem Cell 1, 635–645 (2007).
15. Manz, M.G., Miyamoto, T., Akashi, K. & Weissman, I.L. Prospective isolation of human clonogenic common myeloid progenitors. Proc. Natl. Acad. Sci. USA 99, 11872–11877 (2002).
16. Kohn, L.A. et al. Lymphoid priming in human bone marrow begins before expression of CD10 with upregulation of L-selectin. Nat. Immunol. 13, 963–971 (2012).
17. Seita, J. & Weissman, I.L. Hematopoietic stem cell: self-renewal versus differentiation. Wiley Interdiscip. Rev. Syst. Biol. Med. 2, 640–653 (2010).
18. Roadmap Epigenetics Consortium. et al. Integrative analysis of 111 reference human epigenomes. Nature 518, 317–330 (2015).
19. Manning, C.D., Raghavan, P. & Schutze, H. Introduction to Information Retrieval (Cambridge University Press, 2008).
20. Cauchy, P. et al. Chronic FLT3–ITD signaling in acute myeloid leukemia is connected to a specific chromatin signature. Cell Rep. 12, 821–836 (2015).
21. Heinz, S. et al. Simple combinations of lineage-determining transcription factors prime cis-regulatory elements required for macrophage and B cell identities. Mol. Cell 38, 576–589 (2010).
22. Newman, A.M. et al. Robust enumeration of cell subsets from tissue expression profiles. Nat. Methods 12, 453–457 (2015).
23. Buenrostro, J.D. et al. Single-cell chromatin accessibility reveals principles of regulatory variation. Nature 523, 486–490 (2015).
24. Weiss, M.J. & Orkin, S.H. GATA transcription factors: key regulators of hematopoiesis. Exp. Hematol. 23, 99–107 (1995).
25. Burns, C.E., Traver, D., Mayhall, E., Shepard, J.L. & Zon, L.I. Hematopoietic stem cell fate is established by the Notch–Runx pathway. Genes Dev. 19, 2331–2342 (2005).
26. Nerlov, C. & Graf, T. PU.1 induces myeloid lineage commitment in multipotent hematopoietic progenitors. Genes Dev. 12, 2403–2412 (1998).
27. Neph, S. et al. An expansive human regulatory lexicon encoded in transcription factor footprints. Nature 489, 83–90 (2012).
28. Gjoneska, E. et al. Conserved epigenomic signals in mice and humans reveal immune basis of Alzheimer’s disease. Nature 518, 365–369 (2015).
29. Farh, K.K. et al. Genetic and epigenetic fine mapping of causal autoimmune disease variants. Nature 518, 337–343 (2015).
30. Maurano, M.T. et al. Systematic localization of common disease-associated variation in regulatory DNA. Science 337, 1190–1195 (2012).
31. Döhner, H., Weisdorf, D.J. & Bloomfield, C.D. Acute myeloid leukemia. N. Engl. J. Med. 373, 1136–1152 (2015).
32. Bonnet, D. & Dick, J.E. Human acute myeloid leukemia is organized as a hierarchy that originates from a primitive hematopoietic cell. Nat. Med. 3, 730–737 (1997).
33. Goardon, N. et al. Coexistence of LMPP-like and GMP-like leukemia stem cells in acute myeloid leukemia. Cancer Cell 19, 138–152 (2011).
34. Bennett, J.M. et al. Proposals for the classification of the acute leukaemias. French-American-British (FAB) co-operative group. Br. J. Haematol. 33, 451–458 (1976).
35. van’t Veer, M.B. The diagnosis of acute leukemia with undifferentiated or minimally differentiated blasts. Ann. Hematol. 64, 161–165 (1992).
36. Rangatia, J. et al. Elevated c-Jun expression in acute myeloid leukemias inhibits C/EBPα DNA binding via leucine zipper domain interaction. Oncogene 22, 4760–4764 (2003).
37. Volk, A. et al. Co-inhibition of NF-κB and JNK is synergistic in TNF-expressing human AML. J. Exp. Med. 211, 1093–1108 (2014).
38. Hartman, A.D. et al. Constitutive c-Jun N-terminal kinase activity in acute myeloid leukemia derives from Flt3 and affects survival and proliferation. Exp. Hematol. 34, 1360–1376 (2006).
39. Magnusson, M., Brun, A.C.M., Lawrence, H.J. & Karlsson, S. Hoxa9/Hoxb3/Hoxb4 compound null mice display severe hematopoietic defects. Exp. Hematol. 35, 1421–1428 (2007).
40. Lawrence, H.J. et al. Mice bearing a targeted interruption of the homeobox gene HOXA9 have defects in myeloid, erythroid, and lymphoid hematopoiesis. Blood 89, 1922–1930 (1997).
41. Thorsteinsdottir, U. et al. Overexpression of the myeloid leukemia–associated Hoxa9 gene in bone marrow cells induces stem cell expansion. Blood 99, 121–129 (2002).
42. González, A.J., Setty, M. & Leslie, C.S. Early enhancer establishment and regulatory locus complexity shape transcriptional programs in hematopoietic differentiation. Nat. Genet. 47, 1249–1259 (2015).
43. Whitaker, J.W., Chen, Z. & Wang, W. Predicting the human epigenome from DNA motifs. Nat. Methods 12, 265–272 (2015).
44. Macedo, A. et al. Characterization of aberrant phenotypes in acute myeloblastic leukemia. Ann. Hematol. 70, 189–194 (1995).
45. Tiacci, E. et al. PAX5 expression in acute leukemias: higher B-lineage specificity than CD79a and selective association with t(8;21)-acute myelogenous leukemia. Cancer Res. 64, 7399–7404 (2004).

©20
16N
atu
re A
mer
ica,
Inc.
All
rig
hts
res
erve
d.
Nature GeNetics doi:10.1038/ng.3646
ONLINE METHODSAvailability of sequencing data. All sequencing data are available through the Gene Expression Omnibus (GEO) via accession GSE74912. Additionally, the data from normal hematopoietic cells have been made available as a UCSC Genome Browser Track Hub (see URLs) and as a Washington University EpiGenome Browser session (ID XVqu0IKMi1).
Human samples. Normal donor human bone marrow and peripheral blood cells were obtained fresh from AllCells or the Stanford Blood Center. All normal blood cell populations were sorted fresh. Human AML samples were obtained from patients at the Stanford Medical Center with informed consent, according to institutional review board (IRB)-approved proto-cols (Stanford IRB, 18329 and 6453). Mononuclear cells from each sample were isolated by Ficoll separation, resuspended in 90% FBS + 10% DMSO, and cryopreserved in liquid nitrogen. All analyses conducted here on AML cells used freshly thawed cells. The criteria for inclusion of AML samples were pre-established. Samples were selected solely on the basis of the availability of an adequate number of cells. For normal donors, no exclusion criteria were used.
Definition of cell types isolated. Here we isolated HSCs, LSCs, and blasts from patients with AML. These cells were defined by immunophenotype (Supplementary Table 1), as demonstrated previously46. The patients exam-ined by ATAC-seq and RNA-seq in this study were selected in such a way that >80% of the HSCs were preleukemic.
Additionally, we isolated multiple different normal cell types from healthy donors (Supplementary Table 1). Mature granulocytes were excluded from our analyses because of high endogenous RNase and protease levels. Mature megakaryocytes proved difficult to isolate at adequate cell numbers and were similarly excluded.
Cell lines. Cell line data were downloaded from GEO accession GSE65360.
Flow cytometry analysis and cell sorting. All antibodies used for flow cytom-etry are detailed in Supplementary Table 1.
To prepare cells for FACS, all cells were recovered for 20 min at 37 °C in the presence of 200 U/ml DNase (Worthington Biochemical) in IMDM with 10% FBS. After recovery, viable mononuclear cells were separated by a Ficoll density gradient (GE Healthcare). When necessary, CD34-based enrichment was performed using paramagnetic MACS beads (Miltenyi Biotech) according to the manufacturer’s protocol.
FACS sorting was performed on a Becton Dickinson FACSAria II. All cells were resuspended in and sorted into cold FACS buffer (PBS + 2% FBS + 2 mM EDTA) containing propidium iodide at 1 µg/ml or DAPI at 1 µg/ml. All cell sorting steps were validated using post-sort analyses to verify the purity of the sorted cell populations (Supplementary Table 1).
Transcriptome sequencing. RNA was isolated from 1,000–100,000 FACS-purified cells using the Qiagen RNeasy Plus Micro kit. RNA quality was veri-fied on an Agilent Bioanalyzer Pico Eukaryote chip. Five microliters of total RNA (300 pg–80 ng) was used as input for the NuGen Ovation V2 cDNA synthesis kit. SPIA-amplified cDNA was sheared using a Covaris S2 sonicator as follows: 10% duty cycle, 5 intensity, 100 cycles/burst, 5 min, 120-µl volume. Sheared cDNA was purified and size selected using AMPure XP beads at a 0.9:1 beads-to-sample ratio. After cleanup, Illumina TruSeq adaptors were ligated onto the cDNA using the NEBNext Ultra library preparation kit according to the manufacturer’s instructions. Library quality and concentration were determined using an Agilent Bioanalyzer HS DNA chip and a Qubit fluor-ometer. Libraries were sequenced to an average depth of 12 million read pairs per sample.
Transcriptome data analysis. RNA-seq data were aligned to the human refer-ence genome (GRCh37/hg19) using STAR with standard input parameters. Aligned reads were filtered for reads that mapped uniquely to non-mitochondrial regions. Duplicate reads were removed using Picard MarkDuplicates. Transcript counts were produced using HTseq against the UCSC refGene transcriptome. Transcript counts were processed using DESeq2, normalizing
for both library size and transcript GC content using conditional quantile normalization47. Differential expression was determined without the use of a Cooks cutoff. All downstream analyses on RNA-seq data were performed on variance-stabilizing transformed data obtained from DESeq2.
Fast-ATAC sequencing. This protocol has been optimized for blood cells. We note that digitonin is a gentle detergent and this protocol may not be ideal for cell lines and other cell types that are more resistant to lysis. Five thousand sorted cells in FACS buffer were pelleted by centrifugation at 500g RCF for 5 min at 4 °C in a precooled fixed-angle centrifuge. All supernatant was removed using two pipetting steps, being careful to not disturb the cell pellet, which was not visible. Fifty microliters of transposase mixture (25 µl of 2× TD buffer, 2.5 µl of TDE1, 0.5 µl of 1% digitonin, and 22 µl of nuclease- free water) (FC-121-1030, Illumina; G9441, Promega) was added to the cells, and the pellet was disrupted by pipetting. Transposition reactions were incubated at 37 °C for 30 min in an Eppendorf ThermoMixer with agitation at 300 rpm. Transposed DNA was purified using a QIAGEN MinElute Reaction Cleanup kit (28204), and purified DNA was eluted in 10 µl of elution buffer (10 mM Tris-HCl, pH 8). Transposed fragments were amplified and purified as described previously48 with modified primers23. Libraries were quantified using qPCR before sequencing. All Fast-ATAC libraries were sequenced using paired-end, dual-index sequencing on a NextSeq instrument with 76 × 8 × 8 × 76 cycle reads.
ATAC-seq data analysis. ATAC-seq data were processed as previously described23 with notable exceptions. In brief, reads were trimmed using a custom script and aligned using Bowtie 2. To call peaks, data were aggregated by each unique cell type, and peak summits were called using MACS2 and filtered using a custom blacklist, as previously described23.
To generate a non-redundant list of hematopoiesis- and cancer-related peaks, we first extended summits to 500-bp windows (±250 bp). We then ranked the 500-bp peaks by summit significance value (defined by MACS2) and chose a list of non-overlapping, maximally significant peaks. The com-plete data set comprised a total of 590,650 peaks. To annotate peaks with promoter and distal labels and the nearest gene, we used the HOMER pack-age with command annotatePeaks.pl. As described previously23, we counted fragments for each sample across all 590,650 peaks to provide a count matrix. To obtain normalized fragment counts, which were used for all downstream processing, we first performed quantile normalization followed by GC content normalization (CQN R package47). Data tracks, used solely for visualization, were normalized to the number of fragments falling within all peaks for each sample. Coverage tracks were visualized using the Gviz R package. Fragment yield (Supplementary Fig. 1e) was computed by multiplying the library diver-sity calculated using Picard tools by the number of reads falling within peaks; values were then divided by the number of cells used in each assay.
For information on transcription factor–based analyses, see the Supplementary Note.
Unsupervised hierarchical clustering. Unless otherwise stated, all hierarchi-cal clustering was unsupervised, using Pearson correlation as the distance metric, and was performed on all relevant features (for ex. all genes for RNA-seq or all peaks for ATAC-seq). All clustering analyses were performed on normalized data.
Cluster purity. Cluster purity was calculated as described previously19. Briefly, 13 clusters were defined as branches of the dendrogram, representing all indi-vidual replicates without overlap. Each cluster was assigned to the cell type that was most frequent in the cluster. In this way, there was one cluster (branch) that was assigned to represent each cell type. For each cluster, the accuracy of this assignment was measured by counting the number of correctly assigned experiments. For example, if the HSC cluster contained three HSC experi-ments and two MPP experiments, this cluster would be given a value of three. The sum of the number of correctly assigned experiments was divided by the total number of experiments to obtain cluster purity.
GWAS analysis. Using a list of blood-enriched GWAS, we applied the devia-tion pipeline (as described in the Supplementary Note for transcription

©20
16N
atu
re A
mer
ica,
Inc.
All
rig
hts
res
erve
d.
Nature GeNeticsdoi:10.1038/ng.3646
factor motifs), using an identical approach in which each GWAS disease was analogous to a transcription factor motif and each GWAS peak association was analogous to an individual transcription factor motif occurrence in a peak. For more information, see the Supplementary Note.
CIBERSORT application, benchmarking, and signature matrix generation. CIBERSORT v1.0.1 was used as recommended by the authors. Test set data and training set data represented unique non-overlapping samples. Benchmarking was performed using randomly permuted synthetic data. For each test, a unique signature matrix was generated from n – 1 replicates of each cell type (leave one out). This signature matrix was used to deconvolve ten randomly permuted cellular mixtures derived from the replicate that was excluded from the training set and signature matrix. One hundred unique permutations were performed, ten permutations each on ten different training sets.
The curated CIBERSORT signature matrix (Supplementary Table 2) was generated using default CIBERSORT parameters. To define a list of distal elements for input into CIBERSORT, we filtered peaks by removing peaks mapping to sex chromosomes, promoter and TSS regions (±1 kb), and regions found to be highly accessible in AML samples when compared to the closest normal cell type. Artifactual peaks were also removed using a custom blacklist. These regions were removed to prevent bias based on donor sex, to enhance cell-type-specific patterns, and to avoid overfitting of AML samples to normal cell types respectively.
Generation of synthetic normal analogs. Synthetic normal analogs were generated on the basis of fractional contributions predicted by CIBERSORT (Supplementary Table 6). For each AML sample, a synthetic normal analog was generated by multiplying the fractional contribution of each normal cell type by the normalized fragment number for that cell type. This was done on a peak-by-peak basis, and values were summed for each peak to give the synthetic normal value. For example, assuming a given sample has fractional contributions of 0.3 for HSCs, 0.5 for MPPs, 0.2 for CMPs, and 0 for all other cell types, a synthetic normal analog for peak 1 would be constructed by tak-ing the sum of the average HSC normalized fragments multiplied by 0.3, the MPP normalized fragments multiplied by 0.5, the CMP normalized fragments multiplied by 0.2, and zero for all other cell types. Synthetic normal analogs were then quantile normalized with the leukemic sample of interest.
Cancer modules. To calculate differences for tumor–synthetic normal pairs, we computed log2 (fold change) values from the AML sample of interest to the corresponding synthetic normal. Notably, samples SU209-pHSC and SU583-pHSC were removed from this analysis. These samples appeared to be outliers in that they were more developmentally mature and exhibited an unexpectedly large number of differential peaks (Supplementary Fig. 13b). To determine unique cancer-specific regulatory modules, we first filtered for significantly altered peaks using a cutoff of log2 (fold change) greater than 4 or less than −4, resulting in 6,752 peaks. To determine AML-specific regu-latory modules, we used k-means analysis to cluster the significantly altered peaks. k = 7 was selected by analyzing the mean centroid distances for each cluster (Euclidean) for k values increasing from 1 to 20 (Supplementary Fig. 14a) where k = 7 approximated much of the peak dynamics observed. To determine motif enrichments within each module, we calculate the fraction of motif instances in a given module peak set and divide by all motif instances in all observed peaks.
AML sample genotyping. All samples from the patients with AML described here were genotyped either by whole-exome sequencing using SeqCap EZ Exome SR kit v3.0 (Roche/NimbleGen) or by customized hybrid capture sequencing of the 130 genes most frequently mutated in AML49 using the SeqCap EZ Choice kit (Roche/NimbleGen). Sequencing was performed on an Illumina HiSeq 2000, HiSeq 2500, or NextSeq 500 instrument. Sequence data were aligned to the hg19 human reference genome using BWA (v0.5.9) for global alignment and GATK (v2.8-1) for local realignment. Aligned reads were processed for downstream mutation calling using SAMtools (v0.1.12a). SNPs were called using GATK and Varscan (v2.3.7). All data derived from customized hybrid capture did not have a matched normal genome and were compared instead to the hg19 human reference genome. Putative SNPs were
filtered for (i) minimum sequence depth of 50 reads, (ii) less than 90% variant strand bias, (iii) nonsynonymous variants, (iv) a MAF less than 1%, if the SNP was observed in dbSNP, and (v) a minimum variant frequency of 5%. Indels were called using GATK50 and Varscan51. Putative indels were filtered for (i) minimum sequence depth of 25, (ii) minimum variant frequency of 5%, (iii) less than 90% variant strand bias, and (iv) absence from dbSNP. Large-scale genomic events such as translocations were called using FACTERA52 (v1.3) with no additional filtering. FLT3 internal tandem duplications were called using Pindel53 (v0.2.4) with no additional filtering. Manual observation was used to clarify borderline mutation calls. Additional weight was given to muta-tions called by more than one algorithm. All mutations were validated by targeted amplicon sequencing.
Targeted amplicon sequencing of leukemia-associated mutations. Targeted amplicon sequencing was performed as described previously12.
Epigenetic variance calculation. Epigenetic variance was calculated as the sum of the squares of the distance from the mean divided by the number of samples. This is equivalent to the VAR.P function in Microsoft Excel. This variance was calculated for each individual peak. To obtain genome-wide vari-ance, the rolling mean of 10,000 sequential peaks was calculated across the linear genome in chromosomal order. For calculations of epigenetic variance, some samples with high background were omitted.
Analysis of DNase data. DNase CD34 data, made available by the Epigenomics Roadmap Consortium, were downloaded from Sequence Read Archive (SRA) accessions SRR066150, SRR066151, SRR066152, SRR066351, SRR097542, SRR327476, and SRR327477. Single-end DNase data were aligned, filtered, and normalized using the methods described in ATAC-seq data analysis.
Correlating transcription factor motif deviation scores to expressed genes. Genes were first filtered for putative transcription factors (n = 1,820)54. log2 (fold change) and s.e.m. were computed using DESeq2. To determine robust correlation coefficients (Pearson) and P values for genes and transcription factor deviation scores, we permutated (n = 1,000) log2 (fold change) values according to the measurement error as determined by s.e.m. Reported Pearson correlation coefficients represent mean across for the sampled data. Reported P values represent a z-test statistic across the permutations.
To determine putative direct regulators of the given motif, we down-loaded all available in vitro and inferred position weight matrices (PWMs) from CIS-BP55. We then calculated correlation coefficients (Pearson) for all CIS-BP PWMs (n = 7,592) with the unique set of hematopoiesis PWMs (n = 46). To account for offsets, we took the maximum calculated correlation coefficient after aligning two motifs in both orientations (reverse complement) and all possible offsets of length k. To filter the complete CIS-BP database (n = 7,592) to a non-redundant gene list (n = 806), we choose the motif with the maximum similarity (Pearson) to any hematopoiesis transcription factor motif (Supplementary Fig. 9b and Supplementary Table 4). To find putative direct regulators of human hematopoiesis, we filtered for transcription factors with a PWM correlation coefficient >0.8 (Supplementary Fig. 9e). Although we found that many transcription fac-tors could be correlated with their motif usage, we report the most corre-lated transcription factor (Supplementary Fig. 9g,h) and the complete list in Supplementary Table 4.
Single-cell ATAC-seq analysis and enhancer cytometry. scATAC-seq and enhancer cytometry analysis were performed as described in the Supplementary Note.
Survival analysis. Overall survival was defined as the time from diagnosis to death from any cause. Relapse-free survival was defined as the time from complete morphological remission to the date of relapse of AML or death from any cause, whichever came first. Survival analysis was performed using the Kaplan–Meier estimate method. All patients were included for the analysis regardless of their treatment. P values comparing two Kaplan–Meier survival curves were calculated using the log-rank (Mantel–Cox) test. Hazard ratios were determined using the Mantel–Haenszel approach.
©20
16N
atu
re A
mer
ica,
Inc.
All
rig
hts
res
erve
d.
Nature GeNetics doi:10.1038/ng.3646
In vitro culture of primary AML cells for analysis of drug sensitivity. Primary AML blasts were cultured in Myelocult H5100 (Stemcell Technologies) with 20 ng/ml FLT3L, SCF, TPO, IL-3, and IL-6 and 0.5 µg/ml hydrocortisone. Blasts were cultured at 1 million cells/ml for a total of 6 d with no medium changes. Drug sensitivity was measured by flow cytometry analysis of Annexin V–negative, DAPI-negative live cells.
In vitro culture assays on HSPCs. FACS-purified HSPCs were plated into either myeloid differentiation medium (Myelocult H5100 with 20 ng/ml FLT3L, IL-3, TPO, SCF, and, GM-CSF and 0.5 µg/ml hydrocortisone) or eryth-roid differentiation medium (StemSpan SFEM II (Stemcell Technologies) with Erythroid Expansion Supplement (Stemcell Technologies)) and cultured for 6 d with medium changes as necessitated by cellular proliferation. Stemness retention medium was composed of HPGM (Lonza) containing 20 ng/ml FLT3L, SCF, and TPO.
Knockdown of HOXA9. HOXA9 knockdown was achieved using the pRSI9 lentiviral backbone (Cellecta), which allows for constitutive expression of shRNA from a U6 promoter. The shRNA target sequences can be found in Supplementary Table 7.
Determination of half-maximal inhibitory concentration in primary AML cells. Cell death in response to pharmacological inhibition was mea-sured by Annexin V staining using an Annexin V–Alexa Fluor 647 conjugate
(Life Technologies) according to the manufacturer’s instructions. Responses were measured in relation to a vehicle-treated control.
46. Jan, M. et al. Prospective separation of normal and leukemic stem cells based on differential expression of TIM3, a human acute myeloid leukemia stem cell marker. Proc. Natl. Acad. Sci. USA 108, 5009–5014 (2011).
47. Hansen, K.D., Irizarry, R.A. & Wu, Z. Removing technical variability in RNA-seq data using conditional quantile normalization. Biostatistics 13, 204–216 (2012).
48. Buenrostro, J.D., Wu, B., Chang, H.Y. & Greenleaf, W.J. ATAC-seq: a method for assaying chromatin accessibility genome-wide. Curr. Protoc. Mol. Biol. 109, 21.29.1–21.29.9 (2015).
49. Cancer Genome Atlas Research Network. Genomic and epigenomic landscapes of adult de novo acute myeloid leukemia. N. Engl. J. Med. 368, 2059–2074 (2013).
50. McKenna, A. et al. The Genome Analysis Toolkit: a MapReduce framework for analyzing next-generation DNA sequencing data. Genome Res. 20, 1297–1303 (2010).
51. Koboldt, D.C. et al. VarScan: variant detection in massively parallel sequencing of individual and pooled samples. Bioinformatics 25, 2283–2285 (2009).
52. Newman, A.M. et al. FACTERA: a practical method for the discovery of genomic rearrangements at breakpoint resolution. Bioinformatics 30, 3390–3393 (2014).
53. Ye, K., Schulz, M.H., Long, Q., Apweiler, R. & Ning, Z. Pindel: a pattern growth approach to detect break points of large deletions and medium sized insertions from paired-end short reads. Bioinformatics 25, 2865–2871 (2009).
54. Vaquerizas, J.M., Kummerfeld, S.K., Teichmann, S.A. & Luscombe, N.M. A census of human transcription factors: function, expression and evolution. Nat. Rev. Genet. 10, 252–263 (2009).
55. Weirauch, M.T. et al. Determination and inference of eukaryotic transcription factor sequence specificity. Cell 158, 1431–1443 (2014).