limited brands annual report 2004 financials
51
COMPANY AND BRAND HIGHLIGHTS FINANCIAL SUMMARY MANAGEMENT’S DISCUSSION AND ANALYSIS CONSOLIDATED STATEMENTS OF INCOME CONSOLIDATED BALANCE SHEETS CONSOLIDATED STATEMENTS OF SHAREHOLDERS’ EQUITY CONSOLIDATED STATEMENTS OF CASH FLOWS NOTES TO CONSOLIDATED FINANCIAL STATEMENTS MANAGEMENT’S REPORT ON INTERNAL CONTROL OVER FINANCIAL REPORTING REPORTS OF INDEPENDENT REGISTERED PUBLIC ACCOUNTING FIRM MARKET PRICE AND DIVIDEND INFORMATION OFFICERS AND BOARD OF DIRECTORS COMPANY INFORMATION SOCIAL RESPONSIBILITY 26 29 30 48 49 50 51 52 69 70 72 73 74 76 FINANCIAL RESULTS
-
Upload
finance26 -
Category
Economy & Finance
-
view
700 -
download
0
Transcript of limited brands annual report 2004 financials
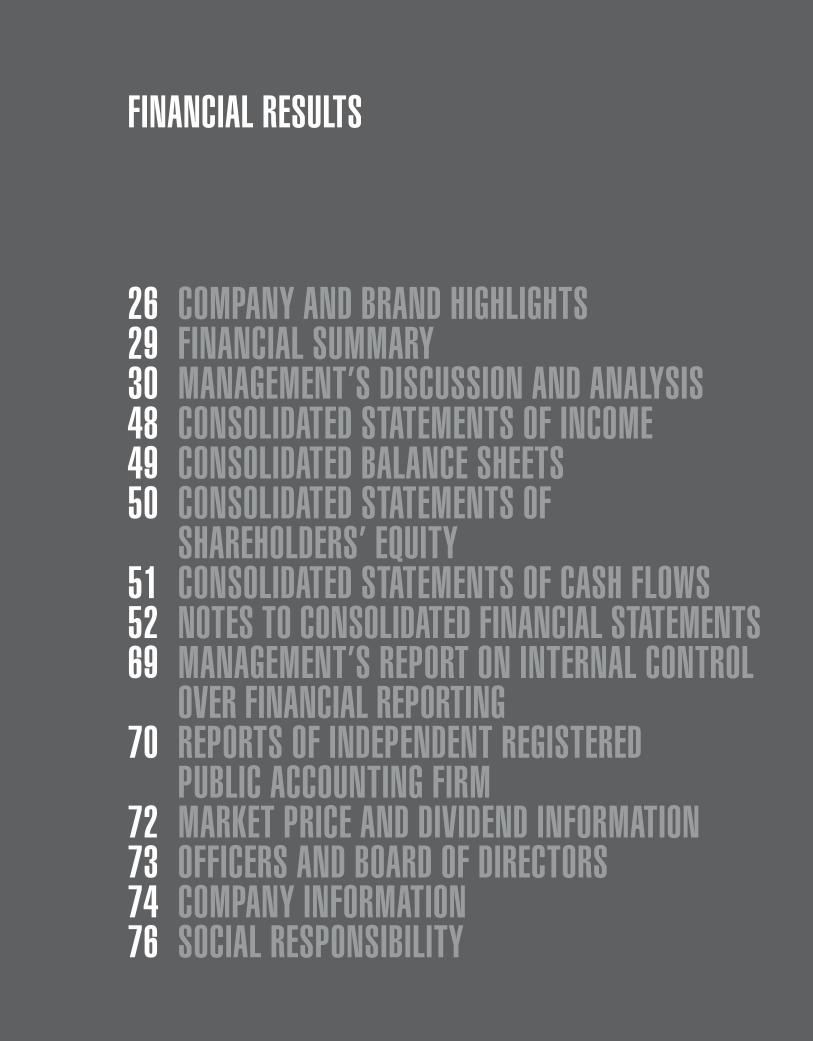
COMPANY AND BRAND HIGHLIGHTS FINANCIAL SUMMARY MANAGEMENT’S DISCUSSION AND ANALYSISCONSOLIDATED STATEMENTS OF INCOMECONSOLIDATED BALANCE SHEETSCONSOLIDATED STATEMENTS OFSHAREHOLDERS’ EQUITY CONSOLIDATED STATEMENTS OF CASH FLOWSNOTES TO CONSOLIDATED FINANCIAL STATEMENTSMANAGEMENT’S REPORT ON INTERNAL CONTROLOVER FINANCIAL REPORTINGREPORTS OF INDEPENDENT REGISTERED PUBLIC ACCOUNTING FIRMMARKET PRICE AND DIVIDEND INFORMATIONOFFICERS AND BOARD OF DIRECTORS COMPANY INFORMATIONSOCIAL RESPONSIBILITY
262930484950
515269
70
72737476
FINANCIAL RESULTS
0490_Fin5 3/30/05 09:26 AM Page 25

26 Limited Brands 2004 Annual Report
OPERATING RESULTSCOMPARABLE STORE SALES INCREASE (DECREASE) 2004 2003 2002
Victoria’s Secret 9% 4% 6%
Bath & Body Works 12% 8% (3%)
Apparel (7%) 0% 3%
Total Limited Brands 4% 4% 3%
NET SALES (millions) 2004 2003 2002
Victoria’s Secret $4,232 $3,817 $3,586
Bath & Body Works 2,169 1,934 1,781
Apparel 2,490 2,697 2,711
Other 517 486 367
Total Limited Brands $9,408 $8,934 $8,445
ADJUSTED OPERATING INCOME (millions) 2004 2003 ▲ 2002
Victoria’s Secret $799 $711 $614
Bath & Body Works 400 355 300
Apparel 16 91 115
Other (188) (194) (157)
Total Limited Brands $1,027 $963 $872
Adjusted net income per diluted share ▲ $1.33 $1.11 $0.99
NUMBER OF STORES 2004 2003 2002
Victoria’s Secret 1,001 1,009 1,014
Bath & Body Works 1,569 1,604 1,639
Apparel 1,207 1,297 1,382
Other 2 1 1
Total Limited Brands 3,779 3,911 4,036
SELLING SQUARE FEET (thousands) 2004 2003 2002
Victoria’s Secret 4,868 4,735 4,663
Bath & Body Works 3,556 3,542 3,568
Apparel 7,340 7,726 8,031
Other 37 35 35
Total Limited Brands 15,801 16,038 16,297
SALES PER AVERAGE SELLING SQUARE FOOT 2004 2003 2002
Victoria’s Secret $648 $600 $581
Bath & Body Works 611 544 507
Apparel 331 342 331
Total Limited Brands $491 $464 $440
▲
Adjusted amounts give effect to certain significant
transactions and events impacting operating income
in 2002 and net income per share in 2004, 2003
and 2002. See the “Adjusted Data” section for a
discussion of these items.
0490_Fin5 3/30/05 09:26 AM Page 26
27
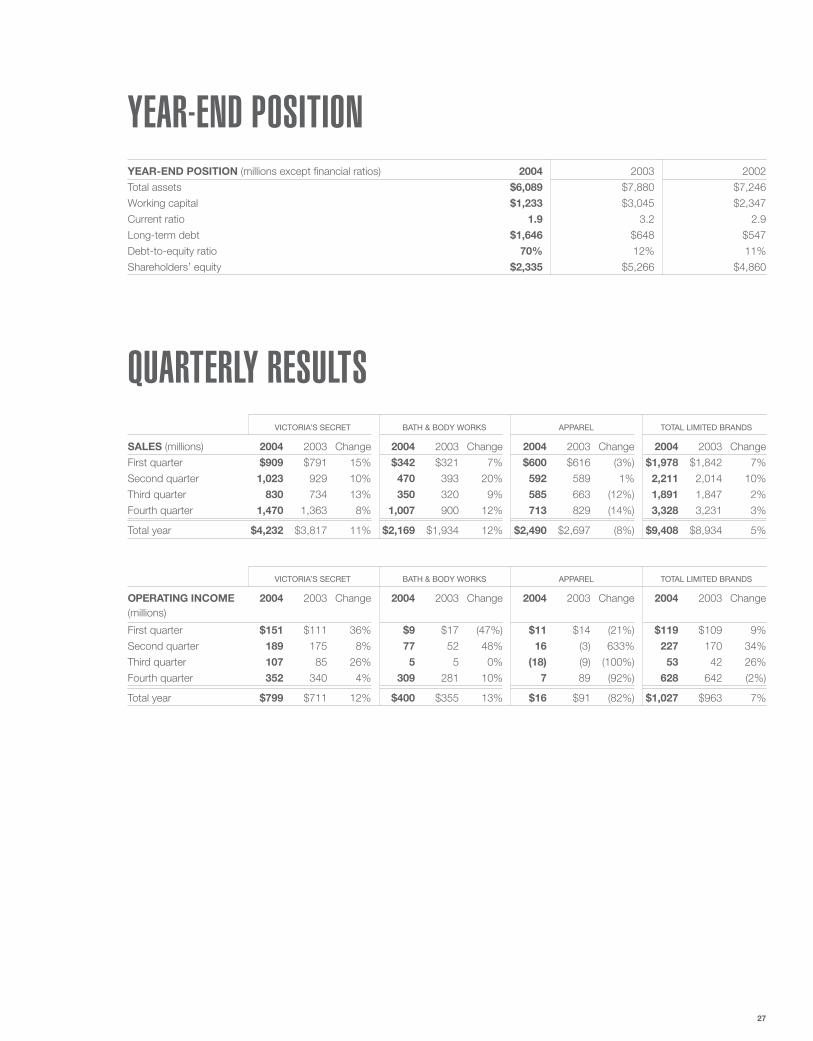
YEAR-END POSITIONYEAR-END POSITION (millions except financial ratios) 2004 2003 2002
Total assets $6,089 $7,880 $7,246
Working capital $1,233 $3,045 $2,347
Current ratio 1.9 3.2 2.9
Long-term debt $1,646 $648 $547
Debt-to-equity ratio 70% 12% 11%
Shareholders’ equity $2,335 $5,266 $4,860
QUARTERLY RESULTSVICTORIA’S SECRET BATH & BODY WORKS APPAREL TOTAL LIMITED BRANDS
SALES (millions) 2004 2003 Change 2004 2003 Change 2004 2003 Change 2004 2003 Change
First quarter $909 $791 15% $342 $321 7% $600 $616 (3%) $1,978 $1,842 7%
Second quarter 1,023 929 10% 470 393 20% 592 589 1% 2,211 2,014 10%
Third quarter 830 734 13% 350 320 9% 585 663 (12%) 1,891 1,847 2%
Fourth quarter 1,470 1,363 8% 1,007 900 12% 713 829 (14%) 3,328 3,231 3%
Total year $4,232 $3,817 11% $2,169 $1,934 12% $2,490 $2,697 (8%) $9,408 $8,934 5%
VICTORIA’S SECRET BATH & BODY WORKS APPAREL TOTAL LIMITED BRANDS
OPERATING INCOME 2004 2003 Change 2004 2003 Change 2004 2003 Change 2004 2003 Change(millions)
First quarter $151 $111 36% $9 $17 (47%) $11 $14 (21%) $119 $109 9%
Second quarter 189 175 8% 77 52 48% 16 (3) 633% 227 170 34%
Third quarter 107 85 26% 5 5 0% (18) (9) (100%) 53 42 26%
Fourth quarter 352 340 4% 309 281 10% 7 89 (92%) 628 642 (2%)
Total year $799 $711 12% $400 $355 13% $16 $91 (82%) $1,027 $963 7%
0490_Fin5 3/30/05 09:26 AM Page 27

VICTORIA’S SECRET STORES (Lingerie and Beauty) 2004 2003 2002
Sales (millions) $3,113 $2,822 $2,647
Comparable store sales 9% 4% 6%
Number of stores 1,001 1,009 1,014
Selling square feet (thousands) 4,868 4,735 4,663
Sales per average selling square foot $648 $600 $581
Average store size (selling square feet) 4,863 4,693 4,599
VICTORIA’S SECRET DIRECT 2004 2003 2002
Sales (millions) $1,119 $995 $939
% Change 12% 6% 8%
Circulation (millions of books) 403 394 394
% Change 2% 0% 6%
EXPRESS 2004 2003 2002
Sales (millions) $1,913 $2,071 $2,073
Comparable store sales (8%) 0% 2%
Number of stores 884 956 1,031
Selling square feet (thousands) 5,392 5,626 5,852
Sales per average selling square foot $347 $361 $348
Average store size (selling square feet) 6,100 5,885 5,676
THE LIMITED 2004 2003 2002
Sales (millions) $577 $626 $638
Comparable store sales (5%) 0% 7%
Number of stores 323 341 351
Selling square feet (thousands) 1,948 2,100 2,179
Sales per average selling square foot $285 $292 $284
Average store size (selling square feet) 6,031 6,158 6,208
28 Limited Brands 2004 Annual Report
BRAND RESULTS
BATH & BODY WORKS 2004 2003 2002
Sales (millions) $2,169 $1,934 $1,781
Comparable store sales 12% 8% (3%)
Number of stores 1,569 1,604 1,639
Selling square feet (thousands) 3,556 3,542 3,568
Sales per average selling square foot $611 $544 $507
Average store size (selling square feet) 2,266 2,208 2,177
0490_Fin5 3/30/05 09:26 AM Page 28

29
FINANCIAL SUMMARYSUMMARY OF OPERATIONS ▲ 2004 2003 2002 ◆ 2001 ★ 2000
(millions except per share amounts, ratios, store and associate data)
Net sales $9,408 $8,934 $8,445 $8,423 $9,080
Gross income $3,378 $3,251 $3,094 $3,016 $3,185
Gross income as a percentage of sales 35.9% 36.4% 36.6% 35.8% 35.1%
Operating income ● $1,027 $963 $838 $896 $832
Operating income as a percentage of sales ● 10.9% 10.8% 9.9% 10.6% 9.2%
Income from continuing operations + $705 $717 $496 $506 $407
Income from continuing operations as a percentage of sales + 7.5% 8.0% 5.9% 6.0% 4.5%
PER SHARE RESULTS
Income per basic share: continuing operations + $1.50 $1.38 $0.97 $1.18 $0.95
Income per diluted share: continuing operations + $1.47 $1.36 $0.95 $1.16 $0.91
Dividends per share ✱ $1.71 $0.40 $0.30 $0.30 $0.30
Book value per share; end of year $5.74 $10.17 $9.28 $6.39 $5.44
Weighted average diluted shares outstanding 479 526 522 435 443
OTHER FINANCIAL INFORMATION
Total assets $6,089 $7,880 $7,246 $5,094 $4,487
Return on average assets + 10% 9% 8% 11% 9%
Working capital $1,233 $3,045 $2,347 $1,330 $1,034
Current ratio 1.9 3.2 2.9 1.9 1.9
Capital expenditures $431 $293 $306 $377 $487
Long-term debt $1,646 $648 $547 $250 $400
Debt-to-equity ratio 70% 12% 11% 9% 17%
Shareholders’ equity $2,335 $5,266 $4,860 $2,744 $2,316
Return on average shareholders’ equity + 19% 14% 13% 21% 19%
Comparable store sales increase (decrease) ■ 4% 4% 3% (3%) 5%
STORES AND ASSOCIATES AT END OF YEAR
Number of stores 3,779 3,911 4,036 4,614 5,129
Selling square feet (thousands) 15,801 16,038 16,297 20,146 23,224
Number of associates 115,300 111,100 98,900 100,300 123,700
▲
As a result of its sale on November 27, 2002, New York
& Company’s (formerly Lerner New York) operating
results have been reflected as discontinued operations.
Accordingly, New York & Company’s results are
excluded for all periods presented (see Note 3 to the
Consolidated Financial Statements).
◆
Includes the results of Lane Bryant through its
disposition date of August 16, 2001.
★
Fifty-three-week fiscal year.
In 2004, income per basic and diluted share includes
accretion of $0.13 and $0.12, respectively, related to
share repurchases during the year (see Note 1 to the
Consolidated Financial Statements).
●
Operating income includes the effect of the
following items:
1. In 2004, a $61 million non-cash charge to correct
the Company’s accounting for straight-line rent and
the depreciation and amortization of leasehold
improvements and certain landlord allowances
(see Note 1 to the Consolidated Financial Statements);
2. In 2002, a $34 million non-cash charge for vested
stock awards related to the Intimate Brands, Inc. (“IBI”)
recombination (see Note 4 to the Consolidated
Financial Statements);
3. In 2001, a $170 million gain related to the sale of
Lane Bryant;
4. In 2000, a $10 million charge to close Bath & Body
Works’ nine stores in the United Kingdom.
✱
In 2004, dividends per share include a special dividend
of $1.23 per share (see Note 1 to the Consolidated
Financial Statements).
+
In addition to the items previously discussed in ● ,
income includes the effect of the following pretax
non-operating gains:
1. In 2004, $90 million related to New York & Company
and $18 million related to Galyan’s Trading Company,
Inc. (“Galyan’s”) (see Note 1 and Note 3 to the
Consolidated Financial Statements);
2. In 2003, $208 million related to Alliance Data Systems
Corporation (“ADS”) (see Note 1 to the Consolidated
Financial Statements);
3. In 2002, $6 million related to Charming Shoppes, Inc.
(see Note 1 to the Consolidated Financial Statements);
4. In 2001, $62 million related to ADS and Galyan’s.
■
A store is typically included in the calculation of comparable
store sales when it has been open 12 months or more
and it has not had a change in selling square footage of
20% or more. Additionally, stores of a given brand are
excluded if total selling square footage for the brand in
the mall changes by 20% or more through the opening
or closing of a second store.
0490_Fin5 3/30/05 09:26 AM Page 29

EXECUTIVE OVERVIEW
Limited Brands, Inc. (the “Company”) operates in the highly competitive specialty retail business. The Company sells women’s intimate
apparel, personal care and beauty products, and women’s and men’s apparel through its retail stores (primarily mall-based) and direct
response (catalogue and e-commerce) businesses.
STRATEGY
During 2004, the Company focused on its core intimate apparel, personal care and beauty, and apparel brands as it continues its
transformation from a multi-divisional apparel retailer to a high-value branded consumer packaged goods company. The Company also
continued to focus on shareholder value, returning $3.8 billion to shareholders through share repurchases and dividends and increasing its
quarterly dividend by 25% to $0.15 per share at the end of the year.
The Company is accelerating growth in its intimate apparel, personal care and beauty brands, while at the same time repositioning its
apparel brands as full-priced businesses with disciplined promotional strategies. The Company is increasing its product innovation activity to
support accelerated growth in future periods and intends to use its control of its channels of distribution to quickly transform new ideas into
profitable growth. After a disappointing apparel performance in 2004, the Company has focused on improving the apparel brands’ product
assortments to ensure better fashion and more attractive price points.
To support this strategic focus, the Company continues to emphasize brands, talent and capability.
Brands
The Company’s focus on innovation and speed to market provides the foundation for growth. The Company’s enterprise-wide “creative
team” has accelerated the transformation of ideas into new products, such as the Tutti Dolci product line at Bath & Body Works, while
continuing to develop extensions of existing product lines to drive repeat purchases, most notably the expansion of the Henri Bendel Home
Fragrance product line. In addition, the Company began testing two new standalone brand concepts during the year: C.O. Bigelow, focusing
on upscale body care, face care, fragrances and beauty products; and Henri Bendel, bringing the brand’s iconic New York heritage to
personal care, beauty and lingerie. The Company also continued to see growth in new product introductions from prior years, most notably
the Editor Pant at Express and the PINK sub-brand at Victoria’s Secret, which has potential as a standalone brand concept.
Talent
One of the Company’s key imperatives is to attract, develop and retain talent on a continuing basis. This talent pool is critical to the
Company’s ability to implement the strategies that are essential to its continued growth. Accordingly, the talent initiative continues to be
a major focus of the Company and involves identifying and building the capabilities required to manage the business today and just as
importantly, to manage the business in the future. The Company continued to expand its talent pool during the year, most notably through
the addition of three key members to its executive team in January 2005. Jay Margolis, who has extensive experience with fashion
businesses, has been hired to lead our apparel businesses and to assist in returning these brands to growing, profitable businesses.
Martyn Redgrave, who has been responsible for acquisitions, joint ventures and transactions for other major corporations and has led
significant enterprise level business transformations, will serve as the Company’s new Chief Administrative Officer, bringing an enhanced
level of stability and experience to the Company. Deborah Fine, who has significant experience in the development of new brands and
businesses, will be responsible for leading the Company’s efforts to develop the PINK sub-brand into a full lifestyle brand.
Capability
During the year, the Company accelerated its pursuit of enhanced capabilities, focusing on a number of strategic initiatives that will support
future growth and provide returns to shareholders.
Disparate financial systems across the Company are being consolidated and will be supported by a new shared services center. Other
operational systems, including the demand chain, merchandise planning and allocation, and customer information systems are also being
redesigned. These changes are expected to improve operational efficiencies, allowing brands and corporate functions to spend more time
on their strategic activities. In addition, new systems will enable increased speed to market, enhance the Company’s ability to deliver
customer-centric store assortments, and improve the Company’s in-store capabilities.
In addition, the Company is developing plans to expand its direct response capabilities beyond Victoria’s Secret to Bath & Body Works and
Express, providing an important new channel for growth at these brands.
MANAGEMENT’S DISCUSSION AND ANALYSIS
30 Limited Brands 2004 Annual Report
0490_Fin5 3/30/05 09:26 AM Page 30
31
2004 RESULTS
The Company’s operating results are generally impacted by changes in the overall U.S. economy, and therefore, management monitors
the retail environment using, among other things, certain key industry performance indicators such as the University of Michigan Consumer
Sentiment Index (which measures consumers’ views on the future course of the U.S. economy), the National Retail Traffic Index (which
measures traffic levels in approximately 190 malls nationwide) and National Retail Sales (which reflects sales volumes of 5,000 businesses
as measured by the U.S. Census Bureau). These indices provide insight into consumer spending patterns and shopping behavior in the
current retail environment and assist management in assessing the Company’s performance as well as the potential impact of industry
trends on its future operating results. Generally, the trends, as measured by these indicators, were positive for the Company in 2004.
For the year, the Company had generally good performance, with operating income up 24% through the third quarter. Fourth quarter
results were mixed, with operating income down 2% driven by a poor fashion assortment primarily at Express. In addition, the Company,
in consultation with its independent auditors, recorded a $61 million one-time charge in the fourth quarter to correct its accounting for
straight-line rent and the depreciation and amortization of leasehold improvements and certain landlord allowances. These corrections do
not impact the Company’s historical or future cash flows or the timing of lease related payments. The impact on the Company’s historical
years’ net income, earnings per share and shareholders’ equity is immaterial. See “Lease Related Accounting” section and Note 1 to the
Consolidated Financial Statements for further discussion.
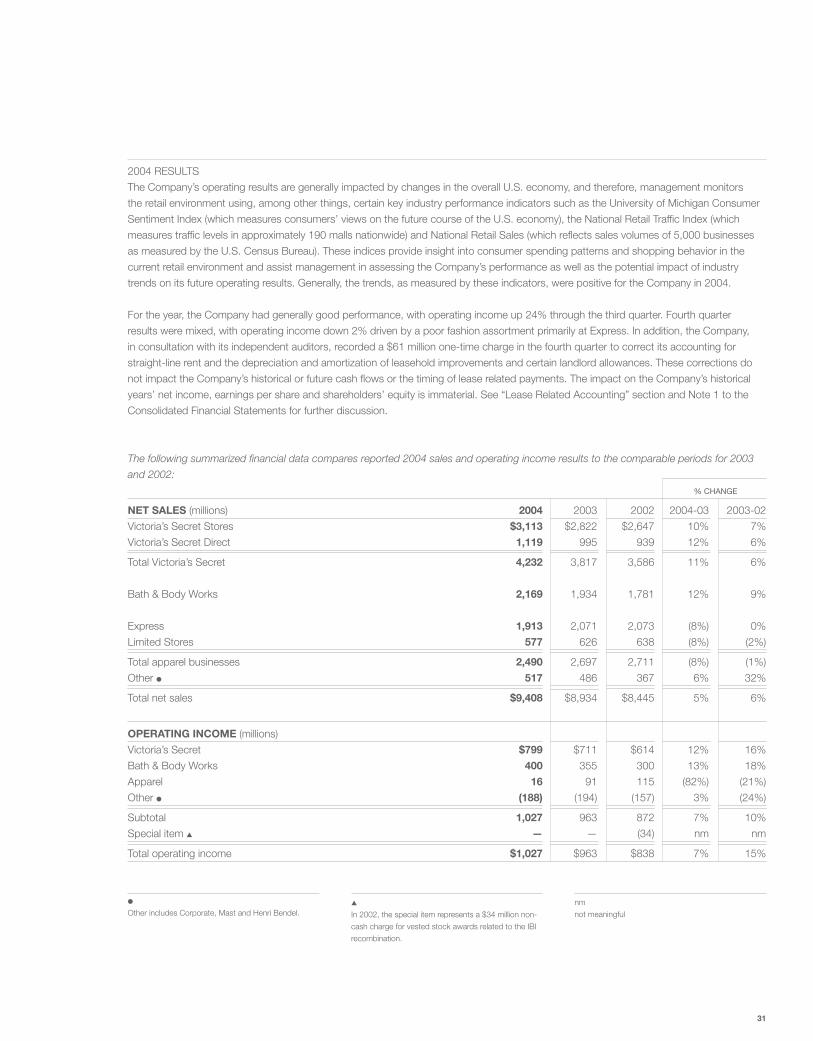
The following summarized financial data compares reported 2004 sales and operating income results to the comparable periods for 2003
and 2002:
% CHANGE
NET SALES (millions) 2004 2003 2002 2004-03 2003-02
Victoria’s Secret Stores $3,113 $2,822 $2,647 10% 7%
Victoria’s Secret Direct 1,119 995 939 12% 6%
Total Victoria’s Secret 4,232 3,817 3,586 11% 6%
Bath & Body Works 2,169 1,934 1,781 12% 9%
Express 1,913 2,071 2,073 (8%) 0%
Limited Stores 577 626 638 (8%) (2%)
Total apparel businesses 2,490 2,697 2,711 (8%) (1%)
Other ● 517 486 367 6% 32%
Total net sales $9,408 $8,934 $8,445 5% 6%
OPERATING INCOME (millions)
Victoria’s Secret $799 $711 $614 12% 16%
Bath & Body Works 400 355 300 13% 18%
Apparel 16 91 115 (82%) (21%)
Other ● (188) (194) (157) 3% (24%)
Subtotal 1,027 963 872 7% 10%
Special item ▲ — — (34) nm nm
Total operating income $1,027 $963 $838 7% 15%
●
Other includes Corporate, Mast and Henri Bendel.▲
In 2002, the special item represents a $34 million non-
cash charge for vested stock awards related to the IBI
recombination.
nm
not meaningful
0490_Fin5 3/30/05 09:26 AM Page 31

The following summarized financial data compares reported 2004 results to the comparable periods for 2003 and 2002:
COMPARABLE STORE SALES 2004 2003 2002
Victoria’s Secret 9% 4% 6%
Bath & Body Works 12% 8% (3%)
Express (8%) 0% 2%
Limited Stores (5%) 0% 7%
Total apparel businesses (7%) 0% 3%
Henri Bendel 9% 8% 7%
Total comparable store sales 4% 4% 3%
% CHANGE
STORE DATA 2004 2003 2002 2004-03 2003-02
Sales per average selling square foot Victoria’s Secret $648 $600 $581 8% 3%
Bath & Body Works $611 $544 $507 12% 7%
Apparel $331 $342 $331 (3%) 3%
Sales per average store (thousands) Victoria’s Secret $3,097 $2,789 $2,626 11% 6%
Bath & Body Works $1,367 $1,193 $1,095 15% 9%
Apparel $1,989 $2,013 $1,898 (1%) 6%
Average store size (selling square feet) Victoria’s Secret 4,863 4,693 4,599 4% 2%
Bath & Body Works 2,266 2,208 2,177 3% 1%
Apparel 6,081 5,957 5,811 2% 3%
Selling square feet (thousands) Victoria’s Secret 4,868 4,735 4,663 3% 2%
Bath & Body Works 3,556 3,542 3,568 0% (1%)
Apparel 7,340 7,726 8,031 (5%) (4%)
VICTORIA’S SECRET BATH & BODY WORKS APPAREL
NUMBER OF STORES ▲ 2004 2003 2002 2004 2003 2002 2004 2003 2002
Beginning of year 1,009 1,014 1,002 1,604 1,639 1,615 1,297 1,382 1,474
Opened 13 10 33 10 6 51 15 8 22
Closed (21) (15) (21) (45) (41) (27) (105) (93) (114)
End of year 1,001 1,009 1,014 1,569 1,604 1,639 1,207 1,297 1,382
▲
Excludes Henri Bendel store locations (2 in 2004 and
1 in 2003 and 2002).
32 Limited Brands 2004 Annual Report
MANAGEMENT’S DISCUSSION AND ANALYSIS
0490_Fin5 3/30/05 09:26 AM Page 32

33
NET SALES FOURTH QUARTER
The change in net sales for the fourth quarter of 2004 compared to 2003 was as follows:
2004 COMPARED TO 2003
At Victoria’s Secret, the 5% increase in comparable store sales was primarily driven by the new PINK sub-brand, and by continued growth
in the bra category and the Beauty business, partially offset by declines in casual sleepwear. Sales increases in the bra category were driven
by new introductions in the Very Sexy and Body by Victoria product lines. Growth in the Beauty business was primarily driven by the
continued success of the Very Sexy for Her 2 fragrance, the recent introduction of the Basic Instinct fragrance and from an expanded color
and hair care product offering. The 11% increase in net sales at Victoria’s Secret Direct was driven by growth in almost all product categories,
including woven separates, bras, knit tops and beauty and cosmetics.
At Bath & Body Works, the 12% increase in comparable store sales was driven by sales growth in the home fragrance and anti-bac
product lines, as well as the successful launch of the Tutti Dolci product line. Sales increases were also supported by an increase in
purchase-with-purchase promotions, as well as a one-week extension of the semi-annual sale.
At the apparel businesses, the 14% decrease in comparable store sales primarily resulted from significant declines at Express. Express
continues to focus on repositioning the brand as a full-priced business, but the Fall season assortment did not meet the preferences of the
Company’s customers both in terms of fashion selection and price points, resulting in significant declines in women’s casual clothing,
particularly knit tops and denim, and in declines in men’s sweaters and denim. These decreases were partially offset by increases in
women’s wear-to-work pants, driven by the continued success of the Editor pant. At Limited Stores, the 5% decrease in comparable store
sales was primarily driven by significant declines in sweaters and knit tops.
The change in net sales for the fourth quarter of 2003 compared to 2002 was as follows:
NET SALES FOURTH QUARTER 2004 vs 2003 (millions) VICTORIA’S BATH & BODY APPAREL OTHER TOTAL
Increase (decrease)SECRET WORKS
2003 Net sales $1,363 $900 $829 $139 $3,231
Comparable store sales 46 96 (98) — 44
Sales associated with new, closed and non-comparable remodeled stores, net 26 10 (18) — 18
Victoria’s Secret Direct 35 — — — 35
2004 Net sales $1,470 $1,006 $713 $139 $3,328
NET SALES FOURTH QUARTER 2003 vs 2002 (millions) VICTORIA’S BATH & BODY APPAREL OTHER TOTAL
Increase (decrease) SECRET WORKS
2002 Net sales $1,282 $777 $806 $101 $2,966
Comparable store sales 39 119 28 — 186
Sales associated with new, closed and non-comparable remodeled stores, net 14 4 (5) — 13
Victoria’s Secret Direct 28 — — — 28
Mast third-party sales and other — — — 38 38
2003 Net sales $1,363 $900 $829 $139 $3,231
0490_Fin5 3/30/05 09:26 AM Page 33
34 Limited Brands 2004 Annual Report
MANAGEMENT’S DISCUSSION AND ANALYSIS
2003 COMPARED TO 2002
At Victoria’s Secret, the 4% increase in comparable store sales was driven by growth in the bra category, specifically the Angels and
Very Sexy sub-brands, and the Beauty business driven by holiday gift sets, the launch of the Breathless fragrance and the promotion of
the Garden product line. The 9% increase in net sales at Victoria’s Secret Direct was driven by growth in the clothing category, particularly
sweaters, outerwear and shoes.
At Bath & Body Works, the 16% increase in comparable store sales was primarily due to an improved holiday assortment and a larger
post-Christmas semi-annual sale, with significant growth in the home fragrance and anti-bac categories as well as gift sets. The introduction
of the Pure Simplicity product line also contributed to the improvement.
At the apparel businesses, the 4% increase in comparable store sales at Express was driven by growth in knit tops, woven pants and
sweaters in the Women’s business and woven shirts in the Men’s business, partially offset by declines in the lingerie category. Comparable
store sales at Limited Stores increased 5% driven primarily by sales growth in sweaters and casual pants, partially offset by the exit of the
accessory category and declines in woven tops.
The net sales increase at Mast was primarily driven by sales to New York & Company, which became a third-party customer upon its
disposition in November 2002.
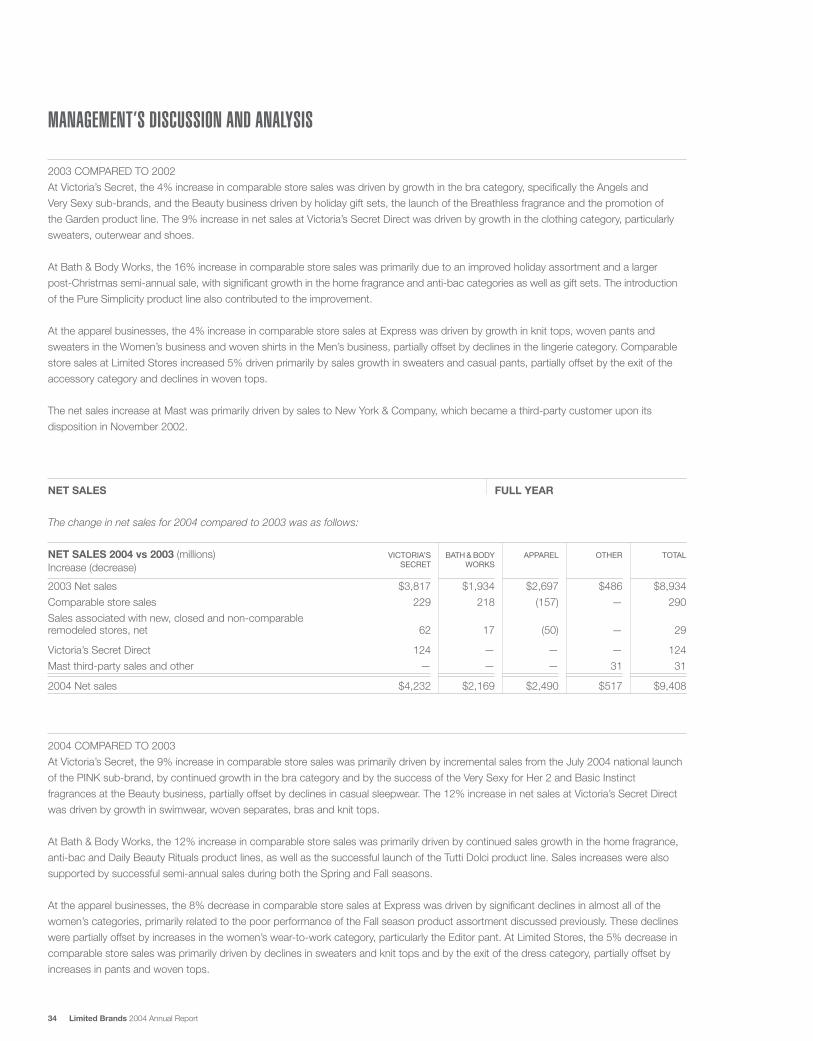
NET SALES FULL YEAR
The change in net sales for 2004 compared to 2003 was as follows:
NET SALES 2004 vs 2003 (millions) VICTORIA’S BATH & BODY APPAREL OTHER TOTAL
Increase (decrease) SECRET WORKS
2003 Net sales $3,817 $1,934 $2,697 $486 $8,934
Comparable store sales 229 218 (157) — 290
Sales associated with new, closed and non-comparable remodeled stores, net 62 17 (50) — 29
Victoria’s Secret Direct 124 — — — 124
Mast third-party sales and other — — — 31 31
2004 Net sales $4,232 $2,169 $2,490 $517 $9,408
2004 COMPARED TO 2003
At Victoria’s Secret, the 9% increase in comparable store sales was primarily driven by incremental sales from the July 2004 national launch
of the PINK sub-brand, by continued growth in the bra category and by the success of the Very Sexy for Her 2 and Basic Instinct
fragrances at the Beauty business, partially offset by declines in casual sleepwear. The 12% increase in net sales at Victoria’s Secret Direct
was driven by growth in swimwear, woven separates, bras and knit tops.
At Bath & Body Works, the 12% increase in comparable store sales was primarily driven by continued sales growth in the home fragrance,
anti-bac and Daily Beauty Rituals product lines, as well as the successful launch of the Tutti Dolci product line. Sales increases were also
supported by successful semi-annual sales during both the Spring and Fall seasons.
At the apparel businesses, the 8% decrease in comparable store sales at Express was driven by significant declines in almost all of the
women’s categories, primarily related to the poor performance of the Fall season product assortment discussed previously. These declines
were partially offset by increases in the women’s wear-to-work category, particularly the Editor pant. At Limited Stores, the 5% decrease in
comparable store sales was primarily driven by declines in sweaters and knit tops and by the exit of the dress category, partially offset by
increases in pants and woven tops.
0490_Fin5 3/30/05 09:26 AM Page 34

35
The change in net sales for 2003 compared to 2002 was as follows:
NET SALES 2003 vs 2002 (millions) VICTORIA’S BATH & BODY APPAREL OTHER TOTAL
Increase (decrease) SECRET WORKS
2002 Net sales $3,586 $1,781 $2,711 $367 $8,445
Comparable store sales 103 135 3 — 241
Sales associated with new, closed and non-comparable remodeled stores, net 72 18 (17) — 73
Victoria’s Secret Direct 56 — — — 56
Mast third-party sales and other — — — 119 119
2003 Net sales $3,817 $1,934 $2,697 $486 $8,934
2003 COMPARED TO 2002
At Victoria’s Secret, the 4% increase in comparable store sales was primarily driven by growth in the bra and panty categories, the PINK
sub-brand and the Beauty business, partially offset by declines in sleepwear. The 6% increase in net sales at Victoria’s Secret Direct was
driven by sales increases in the clothing, accessory and panty categories.
At Bath & Body Works, the 8% increase in comparable store sales was primarily driven by the home fragrance category, the True Blue Spa
product line and gift sets. The introduction of the Pure Simplicity product line also contributed to the improvement.
At the apparel businesses, the slight decrease in net sales was driven by the net decrease in sales associated with closed, new and
non-comparable remodeled stores of $17 million. Comparable store sales were flat for the year at both Express and Limited Stores.
In addition, the Company changed the promotional cadence at the apparel businesses, shifting from store-wide percentage-off direct mail
and coupon activity to key item promotions and quarterly clearance sales.
The net sales increase at Mast was primarily driven by sales to New York & Company (formerly Lerner New York), which became a third-party
customer upon its disposition in November 2002.
GROSS INCOME FOURTH QUARTER
2004 COMPARED TO 2003
For the fourth quarter of 2004, the gross income rate (expressed as a percentage of net sales) decreased to 38.8% from 41.5% in 2003,
as the previously discussed fourth quarter 2004 lease related accounting charge drove an increase in the buying and occupancy rate across
the enterprise.
At Victoria’s Secret, the gross income rate decreased due to the buying and occupancy expense rate increase, partially offset by an
increase in the merchandise margin rate. The increase in the merchandise margin rate was driven by lower markdowns in the sleepwear
and panty categories, partially offset by lower margins at the Beauty business, which were driven by incremental sales from the expansion
of the lower margin hair care and color product lines. Excluding the impact of the lease related accounting charge, buying and occupancy
expense was leveraged on a 5% increase in comparable store sales.
At Bath & Body Works, the gross income rate decreased due to a decrease in the merchandise margin rate and an increase in the buying
and occupancy expense rate. The decrease in the merchandise margin rate is primarily the result of an increase in markdowns to clear
gift set inventories and an increase in purchase-with-purchase promotions. In addition, a change in product mix from higher margin Daily
Beauty Rituals products to lower margin home fragrance products contributed to the rate decline. Excluding the impact of the lease related
accounting charge, buying and occupancy expense was leveraged on a 12% increase in comparable store sales.
0490_Fin5 3/30/05 09:26 AM Page 35
36 Limited Brands 2004 Annual Report
MANAGEMENT’S DISCUSSION AND ANALYSIS
At the apparel businesses, the gross income rate decreased from last year due to a decrease in the merchandise margin rate and an
increase in the buying and occupancy expense rate at both Express and Limited Stores. The decrease in the merchandise margin rate was
driven by higher markdowns for all significant product categories to clear slow-moving inventories related to the poor performance of the
Fall product assortment discussed previously. The increase in the buying and occupancy expense rate resulted from the fourth quarter 2004
lease related accounting charge and the inability to leverage expenses due to the 14% decline in comparable store sales.
2003 COMPARED TO 2002
For the fourth quarter of 2003, the gross income rate decreased to 41.5% from 41.6% in 2002. The rate decrease was primarily driven by
declines at Bath & Body Works and Victoria’s Secret, partially offset by improvement at the apparel businesses. The decrease in the gross
income rate at Victoria’s Secret was primarily the result of a decrease in the merchandise margin rate driven by higher markdowns
particularly in the sleepwear and panty categories.
At Bath & Body Works, the gross income rate decreased due to a decline in the merchandise margin rate partially offset by a decrease in the
buying and occupancy expense rate. The decrease in the merchandise margin rate is primarily the result of higher markdowns resulting from
a larger semi-annual sale compared to 2002, as well as a shift in product mix to lower margin gift sets and Home Fragrance products. The
decrease in the buying and occupancy expense rate was driven by expense leverage achieved on a comparable store sales increase of 16%.
At the apparel businesses, the gross income rate increased compared to 2002 due to a decrease in the buying and occupancy expense
rate and an increase in the merchandise margin rate. The decrease in the buying and occupancy expense rate resulted from the ability to
leverage expenses on a comparable store sales increase of 4%. The increase in the merchandise margin rate was primarily driven by
lower markdowns.
GROSS INCOME FULL YEAR
2004 COMPARED TO 2003
In 2004, the gross income rate declined to 35.9% from 36.4% as a result of the fourth quarter lease related accounting charge previously
discussed and merchandise margin declines at Bath & Body Works and the apparel businesses.
At Victoria’s Secret, the gross income rate was flat as an increase in the merchandise margin rate was offset by an increase in the buying
and occupancy expense rate related to the fourth quarter lease related accounting charge discussed previously. The increase in the
merchandise margin rate was driven by lower markdowns in the sleepwear and panty categories, an increase in margins for the bra
category, and improved performance for almost all categories at Victoria’s Secret Direct, including swimwear, woven separates, knit tops,
bras, shoes and accessories. These increases were partially offset by lower margins at the Beauty business, which were driven by
incremental sales from the expansion of the lower margin hair care and color product lines.
At Bath & Body Works, the gross income rate decreased due to a decline in the merchandise margin rate partially offset by a decrease
in the buying and occupancy expense rate. The decrease in the merchandise margin rate was primarily driven by the fourth quarter results
previously described. The decrease in the buying and occupancy expense rate resulted from leverage achieved on a comparable store
sales increase of 12%, partially offset by the fourth quarter lease related accounting charge discussed previously.
At the apparel businesses, the gross income rate decreased over last year due to a decline in the merchandise margin rate and an increase
in the buying and occupancy expense rate, both of which were driven by the fourth quarter results discussed previously.
2003 COMPARED TO 2002
In 2003, the gross income rate decreased to 36.4% from 36.6% in 2002. The decrease in the gross income rate was due to a decline in
the merchandise margin rate at Bath & Body Works, Express and Mast, partially offset by a decrease in the buying and occupancy expense
rate at Victoria’s Secret and Bath & Body Works.
At Victoria’s Secret, the gross income rate increased primarily due to the ability to leverage buying and occupancy expenses on a
comparable store sales increase of 4%. The merchandise margin rate was flat for the year.
0490_Fin5 3/30/05 09:26 AM Page 36

37
At Bath & Body Works, the gross income rate increased slightly as the decrease in the buying and occupancy expense rate resulting
from leverage on a comparable store sales increase of 8% was partially offset by higher markdowns, particularly in the fourth quarter as
previously described.
At Express, the gross income rate decreased primarily due to higher promotional activity and markdowns related to a weak assortment,
and the inability to leverage buying and occupancy expenses on comparable store sales that were flat to 2002. The decrease in the gross
income rate at Mast was driven primarily by a decrease in joint venture income resulting from the sale of certain joint ventures and transition
costs associated with the home office relocation to Columbus, Ohio from Andover, Massachusetts.
GENERAL, ADMINISTRATIVE AND STORE OPERATING EXPENSES FOURTH QUARTER
2004 COMPARED TO 2003
For the fourth quarter of 2004, the general, administrative and store operating expense rate (expressed as a percentage of net sales)
improved to 19.9% from 21.7% last year, primarily driven by an improvement at Bath & Body Works, the apparel brands and corporate
functions. The improvement was due to the ability to leverage store selling expenses at Bath & Body Works, Express and Limited Stores,
and by decreases in marketing and incentive compensation expenses across the Company. This improvement was partially offset by
increased spending on technology and process initiatives.
2003 COMPARED TO 2002
For the fourth quarter of 2003, the general, administrative and store operating expense rate decreased to 21.7% from 21.8% in 2002.
Decreases in the general, administrative and store operating expense rate at Bath & Body Works and Victoria’s Secret, driven by the ability
to leverage expenses on comparable store sales increases of 16% and 4%, respectively, were substantially offset by an overall increase in
incentive compensation and an accrual for litigation.
GENERAL, ADMINISTRATIVE AND STORE OPERATING EXPENSES FULL YEAR
2004 COMPARED TO 2003
In 2004, the general, administrative and store operating expense rate improved to 25.0% from 25.6% in 2003. This improvement was
driven by the ability to leverage store selling expenses across all retail segments, partially offset by increased spending on technology and
process initiatives.
2003 COMPARED TO 2002
In 2003, the general, administrative and store operating expense rate decreased to 25.6% from 26.3% in 2002. The decrease in the
general, administrative and store operating expense rate was primarily driven by the ability to leverage expenses on comparable store sales
increases of 8% at Bath & Body Works and 4% at Victoria’s Secret. The general, administrative and store operating expense rate at the
apparel businesses was about flat for the year.
SPECIAL ITEM
During the first quarter of 2002, in connection with the acquisition of the Intimate Brands, Inc. (“IBI”) minority interest (see Note 2 to the
Consolidated Financial Statements), vested IBI stock options and restricted stock were exchanged for Limited Brands stock awards with
substantially similar terms. In accordance with Emerging Issues Task Force Issue No. 00-23, “Issues Related to the Accounting for Stock
Compensation under APB Opinion No. 25 and FASB Interpretation No. 44,” the exchange was accounted for as a modification of a
stock-based compensation arrangement. As a result, the Company recorded a pretax, non-cash charge of $34 million in the first quarter
of 2002.
0490_Fin5 3/30/05 09:26 AM Page 37

38 Limited Brands 2004 Annual Report
MANAGEMENT’S DISCUSSION AND ANALYSIS
INTEREST EXPENSE
The average daily borrowings and average borrowing rates for the fourth quarters and years ended January 29, 2005, January 31, 2004
and February 1, 2003 were as follows:
In 2004, the Company incurred interest expense of $21 million and $58 million for the fourth quarter and the year, respectively, compared
to $12 million and $62 million for the same periods in 2003. The increase for the fourth quarter is primarily due to additional debt issued in
conjunction with the Company’s $2 billion tender offer and $500 million special dividend in December 2004. The decrease for the year
relates to $13 million of expense in 2003 associated with the early retirement of the Company’s $250 million 7.5% debentures due in 2023,
partially offset by an increase in average borrowings.
In 2003, the Company incurred interest expense of $12 million and $62 million for the fourth quarter and the year, respectively, compared
to $8 million and $30 million for the same periods in 2002. The increases were primarily due to an increase in average daily borrowings,
partially offset by a decrease in average borrowing rates. In addition, interest expense in 2003 included $13 million associated with the
retirement of the Company’s $250 million 7.5% debentures due in 2023, which included the payment of a call premium and the write-off
of unamortized discounts and fees.
INTEREST INCOME
In 2004, interest income decreased to $7 million and $30 million for the fourth quarter and the year, respectively, compared to $9 million
and $63 million for the same periods in 2003. The decrease in the fourth quarter is primarily due to a decrease in average invested cash
balances, partially offset by an increase in average effective interest rates. The decrease for the year primarily relates to an interest refund
of $30 million received in 2003 related to a tax settlement (see Note 9 to the Consolidated Financial Statements).
In 2003, interest income was $9 million and $63 million for the fourth quarter and the year, respectively, compared to $9 million and
$29 million for the same periods in 2002. The full year increase primarily relates to the $30 million interest refund from the fourth quarter tax
settlement discussed previously.
OTHER INCOME (LOSS)
In 2004, other income (loss) increased to $4 million and $99 million for the fourth quarter and the year, respectively, compared to ($4) million
and ($6) million for the same periods in 2003. The fourth quarter increase primarily relates to losses from unconsolidated entities in 2003.
The full year increase primarily relates to gains of $90 million related to the early collection of the New York & Company note receivable,
New York & Company’s purchase of its warrants held by the Company and additional proceeds from the New York & Company initial public
offering (see Note 3 to the Consolidated Financial Statements).
FOURTH QUARTER (millions) 2004 2003 2002
Average daily borrowings $1,474 $650 $451
Average borrowing rate 5.6% 6.6% 7.0%
YEAR (millions)
Average daily borrowings $863 $675 $342
Average borrowing rate 6.1% 6.6% 7.4%
0490_Fin5 3/30/05 09:26 AM Page 38
39
GAINS ON INVESTEES’ STOCK
During the second quarter of 2004, the Company sold its remaining ownership interest in Galyan’s Trading Company, Inc. (“Galyan’s”) for
$65 million, resulting in a pretax gain of $18 million. Prior to the sale of Galyan’s shares, the Company accounted for its investment using the
equity method.
During the first quarter of 2003, the Company sold approximately one-half of its ownership interest in Alliance Data Systems Corporation
(“ADS”) for $131 million resulting in a pretax gain of $80 million. During the third quarter of 2003, the Company sold its remaining ownership
interest in ADS for $193 million resulting in a pretax gain of $128 million. Prior to these sales of ADS shares, the Company accounted for its
investment using the equity method.
During the third quarter of 2002, the Company recognized a pretax gain of $6 million resulting from the sale of its Charming Shoppes, Inc.
common stock for $65 million. The stock was received in connection with the Company’s sale of Lane Bryant during the third quarter of 2001.
ADJUSTED DATA
Adjusted income information provides non-GAAP financial measures and gives effect to certain significant transactions and events
that impact the comparability of the Company’s results in 2004, 2003 and 2002. Specifically, certain non-operating items and the IBI
recombination do not relate to the core performance of the Company’s business. Accordingly, to improve comparability, the following table
adjusts net income for such transactions and events in determining the adjusted results, and reconciles the adjusted results to net income
reported in accordance with U.S. generally accepted accounting principles.
Management believes that the adjusted results provide useful information as to the Company’s underlying business performance and
assessment of ongoing operations. The adjusted income information should not be construed as an alternative to the reported results
determined in accordance with generally accepted accounting principles. Further, the Company’s definition of adjusted income information
may differ from similarly titled measures used by other companies.
0490_Fin5 3/30/05 09:26 AM Page 39

40 Limited Brands 2004 Annual Report
MANAGEMENT’S DISCUSSION AND ANALYSIS
ADJUSTED INCOME INFORMATION (millions except per share amounts)
2004 2003 2002
REPORTED ADJUSTMENTS ADJUSTED REPORTED ADJUSTMENTS ADJUSTED REPORTED ADJUSTMENTS ADJUSTED
Net sales $9,408 — $9,408 $8,934 — $8,934 $8,445 — $8,445
Gross income 3,378 — 3,378 3,251 — 3,251 3,094 — 3,094
General, administrative andstore operating expenses (2,351) — (2,351) (2,288) — (2,288) (2,222) — (2,222)
Special item — — — — — — (34) ▲ $34 —
Operating income 1,027 — 1,027 963 — 963 838 34 872
Interest expense (58) — (58) (62) — (62) (30) — (30)
Interest income 30 — 30 63 — 63 29 ★ 6 35
Other income (loss) 99 ■ ($90) 9 (6) — (6) — — —
Minority interest — — — — — — (6) ◆ 6 —
Gains on investees’ stock 18 ● (18) — 208 ● ($208) — 6 ● (6) —
Income from continuing operations before income taxes 1,116 (108) 1,008 1,166 (208) 958 837 40 877
Provision for income taxes 411 (40) 371 449 (75) 374 341 8 349
Income from continuing operations 705 (68) 637 717 (133) 584 496 32 528
Income from discontinued operations (including loss on disposal of $4 million in 2002), net of tax — — — — — — 6 ★ (6) —
Net income $705 ($68) $637 $717 ($133) $584 $502 $26 $528
Income per diluted share:
Continuing operations $1.47 $1.33 $1.36 $1.11 $0.95 $0.99
Discontinued operations — — — — 0.01 —
Net income per diluted share $1.47 $1.33 $1.36 $1.11 $0.96 $0.99
Weighted average shares outstanding 479 479 526 526 522 ◆ 11 533
■
In 2004, the Company recognized a $45 million
gain resulting from the early collection of a long-term
note receivable and the sale of New York & Company
warrants held by the Company and a $45 million
gain resulting from the initial public offering of New
York & Company (see Note 3 to the Consolidated
Financial Statements).
●
The gains on investees’ stock were as follows (see
Note 1 to the Consolidated Financial Statements):
1. In 2004, $18 million resulting from the sale of the
Company’s remaining ownership interest in Galyan’s;
2. In 2003, $208 million resulting from the sale of the
Company’s investment in ADS;
3. In 2002, $6 million resulting from the sale of
Charming Shoppes, Inc. common stock.
▲
In 2002, the special item represents a $34 million non-
cash charge for vested stock awards related to the IBI
recombination (see Note 4 to the Consolidated
Financial Statements).
★
As a result of its sale on November 27, 2002, New
York & Company results have been reflected in
discontinued operations and were excluded in
determining adjusted results for 2002. In addition, the
adjusted results reflect the addition of interest income
(at 10% per annum) which would have been earned
on the $75 million note received from New York &
Company in connection with the sale (see Note 3 to
the Consolidated Financial Statements).
◆
On March 21, 2002, the Company completed a tender
offer and merger that resulted in the acquisition of the
IBI minority interest. The adjusted results: (1) eliminate
the minority interest in earnings of IBI and (2) increase
total weighted average Class A common stock
outstanding, using the exchange rate of 1.1 shares
of Limited Brands common stock for each share of IBI
Class A common stock (see Note 2 to the Consolidated
Financial Statements).
0490_Fin5 3/30/05 09:26 AM Page 40

41
LIQUIDITY AND CAPITAL RESOURCES
Cash generated from operating activities provides the primary resources to support current operations, projected growth, seasonal funding
requirements and capital expenditures. In addition, the Company has funds available from an unsecured revolving credit facility as well as
a commercial paper program which is backed by the credit facility. The Company has not issued commercial paper or drawn on its credit
facility during the three years ended January 29, 2005. However, changes in consumer spending patterns, consumer preferences and
overall economic conditions could impact the availability of future operating cash flows.
A summary of the Company’s working capital position and capitalization as of January 29, 2005, January 31, 2004 and February 1, 2003
was as follows:
The Company considers the following to be relevant measures of liquidity and capital resources:
The Company’s operations are seasonal in nature and consist of two principal selling seasons: Spring (the first and second quarters) and
Fall (the third and fourth quarters). The fourth quarter, including the holiday period, accounted for approximately one-third of net sales in
2004, 2003 and 2002. Accordingly, cash requirements are highest in the third quarter as the Company’s inventory builds in anticipation of
the holiday period, which generates a substantial portion of the Company’s operating cash flow for the year.
OPERATING ACTIVITIES
In 2004, the decrease in net cash provided by operating activities was primarily driven by an increase in inventory and a decrease in income
taxes payable, partially offset by an increase in accounts payable and accrued expenses. At year-end 2004, inventory levels and accounts
payable were higher to support new product launches at Bath & Body Works and Victoria’s Secret. The decrease in income taxes payable
resulted from an increase in tax payments compared to 2003. The increase in accrued expenses resulted from an increase in deferred
revenue related to gift card sales.
In 2003, the increase in net cash provided by operating activities was primarily driven by a decrease in inventory and an increase in income
taxes payable. In 2003, inventory levels were reduced as a result of successful end-of-season clearance sales at all brands resulting in an
overall decrease in inventory per selling square foot of 2% at January 31, 2004. The increase in income taxes payable in 2003 is primarily
due to an increase in fourth quarter pretax income compared to 2002.
WORKING CAPITAL POSITION AND CAPITALIZATION (millions) 2004 2003 2002
Cash provided by operating activities $933 $1,063 $795
Working capital $1,233 $3,045 $2,347
Capitalization:
Long-term debt $1,646 $648 $547
Shareholders’ equity 2,335 5,266 4,860
Total capitalization $3,981 $5,914 $5,407
Additional amounts available under long-term credit agreements $1,000 $1,250 $1,250
LIQUIDITY AND CAPITAL RESOURCES 2004 2003 2002
Debt-to-equity ratio (long-term debt divided by shareholders’ equity) 70% 12% 11%
Debt-to-capitalization ratio (long-term debt divided by total capitalization) 41% 11% 10%
Cash flow to capital investment (net cash provided by operating activities divided by capital expenditures) 216% 363% 260%
0490_Fin5 3/30/05 09:26 AM Page 41

42 Limited Brands 2004 Annual Report
INVESTING ACTIVITIES
In 2004, investing activities primarily included $431 million in capital expenditures (see “Capital Expenditures” section) and a $27 million
investment in a personal care products business. These cash outflows were partially offset by cash proceeds of $141 million from the early
collection of a New York & Company long-term note receivable and the sale of New York & Company warrants held by the Company, $65 million
from the sale of the Company’s remaining ownership interest in Galyan’s and $25 million related to non-operating real estate investments.
In 2003, investing activities primarily included cash proceeds of $324 million from the sale of the Company’s investment in ADS, partially
offset by $293 million in capital expenditures.
In 2002, investing activities included $306 million in capital expenditures and cash inflows of $79 million from the sale of New York & Company,
$65 million from the sale of Charming Shoppes, Inc. common stock, $34 million from the sale of joint ventures, $18 million related to
non-operating real estate investments and $30 million primarily related to the collection of a long-term note receivable.
FINANCING ACTIVITIES
In 2004, the Company repurchased 125 million shares of common stock for $3.1 billion, at an average price of $24.92 per share. Specifically,
the Company repurchased (1) 69.0 million shares of common stock for $2 billion through the Company’s modified Dutch Auction tender
offer in December 2004, (2) 50.6 million shares of common stock for $1 billion through the Company’s modified Dutch Auction tender offer
in April 2004 and (3) 5.8 million shares of common stock for $115 million related to the Company’s share repurchase programs. Financing
activities also included dividend payments of $500 million for the Company’s fourth quarter special dividend, and $0.48 per share or
$224 million for the Company’s quarterly dividends. These uses of cash were partially offset by (1) $498 million in net proceeds related to the
issuance of the Company’s $500 million 5.25% notes due 2014, (2) $500 million in proceeds related to the Company’s term loan agreement
(the “Term Loan”) that became effective in November 2004 and (3) $166 million in proceeds primarily from the exercise of stock options.
In 2003, financing activities included the redemption of $250 million in debentures, dividend payments of $0.40 per share or $208 million
and the repurchase of 9.9 million shares of common stock for $150 million, partially offset by the issuance of $350 million in long-term debt.
In 2002, financing activities included $300 million in proceeds from the issuance of long-term debt and $55 million in proceeds primarily
from the exercise of stock options, offset by the repayment of $150 million of long-term debt and dividend payments of $0.30 per share
or $150 million.
The Company has available a $1 billion unsecured revolving credit facility (the “Facility”), none of which was used as of January 29, 2005.
The Facility is available to support the Company’s commercial paper and letter of credit programs, which may be used from time to time to
fund working capital and other general corporate requirements. Borrowings outstanding under the Facility, if any, are due in November 2009.
Fees payable under the Facility are based on the Company’s long-term credit ratings, and are currently 0.15% of the committed amount
per year.
The Facility and the Term Loan have several interest rate options, which are based in part on the Company’s long-term credit ratings. The
interest rate on the Term Loan was 3.39% at January 29, 2005. These agreements also require the Company to maintain certain specified
fixed charge and debt-to-earnings ratios and prohibit certain types of liens on property or assets. The Company was in compliance with the
covenant requirements as of January 29, 2005.
The principal amount outstanding under the Term Loan is due in quarterly installments of $25 million from March 2007 to December 2008
and $75 million from March 2009 to December 2009. The Company continually evaluates its capital needs, financial condition, operating
strategies and possible uses of its cash. Accordingly, on February 24, 2005, the Company’s Board of Directors authorized the repurchase of
up to $100 million of the Company’s outstanding common stock. Through March 23, 2005, 1.1 million shares have been repurchased
under this program for $26.8 million, at an average price of $24.33 per share.
In addition, on February 24, 2005, the Company announced that its quarterly dividend will increase 25% to $0.15 per share from $0.12 per
share in 2004.
MANAGEMENT’S DISCUSSION AND ANALYSIS
0490_Fin5 3/30/05 09:26 AM Page 42

43
STORES AND SELLING SQUARE FEET
A summary of stores and selling square feet by business follows:
END OF YEAR CHANGE
▲ PLAN 2005 2004 2003 2005 VS. 2004 2004 VS. 2003
Victoria’s Secret Stores Stores 995 1,001 1,009 (6) (8)
Selling square feet 4,956,000 4,868,000 4,735,000 88,000 133,000
Bath & Body Works Stores 1,541 1,569 1,604 (28) (35)
Selling square feet 3,532,000 3,556,000 3,542,000 (24,000) 14,000
Express Women’s Stores 402 468 562 (66) (94)
Selling square feet 2,480,000 2,888,000 3,503,000 (408,000) (615,000)
Express Men’s Stores 168 223 290 (55) (67)
Selling square feet 685,000 904,000 1,179,000 (219,000) (275,000)
Express Dual Gender Stores 245 193 104 52 89
Selling square feet 1,954,000 1,600,000 944,000 354,000 656,000
Total Express Stores 815 884 956 (69) (72)
Selling square feet 5,119,000 5,392,000 5,626,000 (273,000) (234,000)
Limited Stores Stores 280 323 341 (43) (18)
Selling square feet 1,654,000 1,948,000 2,100,000 (294,000) (152,000)
Total apparel businesses Stores 1,095 1,207 1,297 (112) (90)
Selling square feet 6,773,000 7,340,000 7,726,000 (567,000) (386,000)
Henri Bendel Stores 2 2 1 — 1
Selling square feet 37,000 37,000 35,000 — 2,000
Total retail businesses Stores 3,633 3,779 3,911 (146) (132)
Selling square feet 15,298,000 15,801,000 16,038,000 (503,000) (237,000)
▲
Data for stores and selling square feet for 2005
represents the Company’s best estimate as of
January 29, 2005, and is subject to the risks related
to forward-looking statements outlined in the
Company’s Safe Harbor Statement.
0490_Fin5 3/30/05 09:26 AM Page 43

44 Limited Brands 2004 Annual Report
MANAGEMENT’S DISCUSSION AND ANALYSIS
CAPITAL EXPENDITURES
Capital expenditures amounted to $431 million, $293 million and $306 million for 2004, 2003 and 2002, of which $381 million, $230 million
and $259 million were for new stores and for the remodeling of and improvements to existing stores. Remaining capital expenditures were
primarily related to information technology.
The Company anticipates spending approximately $600 million for capital expenditures in 2005, the majority of which relates to the
remodeling of and improvements to existing stores and to new financial and operational systems. The anticipated increase in capital
spending in 2005 is primarily driven by an increase related to the Company’s efforts to centralize and upgrade systems and capabilities in
the areas of finance, customer relationship marketing, merchandise planning and allocation, and demand chain. The Company expects that
2005 capital expenditures will be funded principally by net cash provided by operating activities.
EASTON INVESTMENT
The Company has land and other investments in Easton, a 1,300 acre planned community in Columbus, Ohio, that integrates office,
hotel, retail, residential and recreational space. These investments, at cost, totaled $57 million at January 29, 2005 and $68 million at
January 31, 2004.
Included in the Company’s Easton investments is an equity interest in Easton Town Center, LLC (“ETC”), an entity that owns and has
developed a commercial entertainment and shopping center. The Company’s investment in ETC was $14 million at January 29, 2005 and
$13 million at January 31, 2004, which the Company accounts for using the equity method. The Company has a majority financial interest
in ETC, but another member that is unaffiliated with the Company is the managing member. Certain significant decisions regarding ETC
require the consent of the unaffiliated members in addition to the Company.
Total assets of ETC were approximately $238 million as of January 29, 2005 and $234 million as of January 31, 2004. ETC’s principal
funding source is a $210 million secured bank loan, all of which was outstanding at January 29, 2005. The loan is payable in full on
January 28, 2006, with the option of two 12-month extensions if certain requirements are met. The Company has guaranteed $25 million
of the principal of this loan. If ETC does not meet the debt service coverage ratio or appraised property values required by covenants in the
loan agreement, the Company has the option to (1) guarantee an additional amount of the loan, (2) provide an irrevocable letter of credit on
behalf of ETC, (3) make a principal payment or (4) lease additional retail space. Otherwise, the bank may call the loan under the agreement’s
default provisions. The Company expects that ETC will meet the financial covenants of this loan.
CONTINGENT LIABILITIES AND CONTRACTUAL OBLIGATIONS
In connection with the disposition of certain businesses, the Company has remaining guarantees of approximately $370 million related
to lease payments of Abercrombie & Fitch, Too, Inc. (formerly Limited Too), Dick’s Sporting Goods (formerly Galyan’s), Lane Bryant and
New York & Company under the current terms of noncancelable leases expiring at various dates through 2015 (see Note 7 to the Consolidated
Financial Statements). These guarantees include minimum rent and additional payments covering taxes, common area costs and certain
other expenses, and relate to leases that commenced prior to the disposition of the businesses. In certain instances, the Company’s
guarantee may remain in effect if the term of a lease is extended. The Company believes the likelihood of material liability being triggered
under these guarantees, with respect to existing and extended leases, is remote. Contingent liabilities also include the $25 million guarantee
related to Easton as previously discussed.
The following table includes aggregated information about the Company’s contractual obligations. These contractual obligations impact the
Company’s short and long-term liquidity and capital resource needs. The table includes information about payments due under specified
contractual obligations, aggregated by type of contractual obligation, including the maturity profile of the Company’s long-term debt,
operating leases and other long-term liabilities as of January 29, 2005.
0490_Fin5 3/30/05 09:26 AM Page 44

45
LEASE RELATED ACCOUNTING
Like other companies in the retail industry, the Company, in consultation with its independent auditors, has concluded that its previous
accounting practices related to the accounting for straight-line rent and the depreciation and amortization of leasehold improvements and
certain landlord allowances were not correct. Accordingly in the fourth quarter of 2004, the Company recorded a one-time pretax charge
of $61 million, which is included in cost of goods sold, buying and occupancy in the Consolidated Statements of Income, to reflect the
corrections more fully described below (see Note 1 to the Consolidated Financial Statements).
Historically, the Company recognized straight-line rent expense for leases beginning on the earlier of the store opening date or lease
commencement date, resulting in the exclusion of the store build-out period (“Rent Holiday”) from the period over which it amortizes its rent
expense. In the fourth quarter of 2004, the Company adjusted its straight-line rent accrual for all applicable leases to reflect the recognition
of rent expense over a period that includes the Rent Holiday period, resulting in cumulative additional rent expense of $31 million.
In addition, the Company had previously depreciated leasehold improvements over a period of up to 10 years, which, primarily due to store
remodeling activity, resulted in certain leasehold improvements being depreciated over a period beyond the contractual lease term. In the
fourth quarter of 2004, the Company adjusted the net book value of its leasehold improvements to reflect useful lives equal to the lesser
of the estimated useful lives of the assets, or the contractual term of the lease, resulting in cumulative additional depreciation expense of
$39 million. In addition, the Company had previously amortized certain landlord allowances beyond the contractual lease term. The Company
adjusted these landlord allowances to reflect amortization over the contractual term of the lease, resulting in a cumulative reduction in rent
expense of $9 million.
The Company evaluated the impact of these revised accounting practices from a quantitative and qualitative perspective. From a quantitative
perspective, had the revised accounting practices been applied retroactively, reported pretax income from continuing operations would
have increased by $7 million and $1 million in 2004 and 2003, respectively, and would have decreased by $2 million in 2002. Additionally,
these corrections do not impact the Company’s historical or future cash flows or the timing of lease related payments. From a qualitative
perspective, the retroactive application of these revised accounting practices would not have had a significant impact on earnings trends,
individual segment results, earnings expectations or debt covenants or other contractual requirements. Based on this evaluation, the
Company concluded that a restatement of prior period results was not required as the impact of these corrections is not material to the
Company’s historical results or cashflows.
PAYMENTS DUE BY PERIOD
CONTRACTUAL OBLIGATIONS (millions) TOTAL LESS THAN 1–3 YEARS 4–5 YEARS MORE THAN OTHER
1 YEAR 5 YEARS
Long-term debt obligations ■ $2,815 $64 $273 $559 $1,919 —
Operating lease obligations ▲ 3,253 547 919 692 1,095 —
Purchase obligations ● 1,334 1,114 158 53 9 —
Other long-term liabilities ★ 145 — — — — $145
Total $7,547 $1,725 $1,350 $1,304 $3,023 $145
■
Long-term debt obligations relate to principal and
interest payments for the Company’s outstanding
notes, debentures and Term Loan (see Note 10 to the
Consolidated Financial Statements). Interest payments
have been estimated based on the coupon rate for
fixed rate obligations or the variable rate in effect at
January 29, 2005 for the Term Loan. Interest obligations
exclude amounts which have been accrued through
January 29, 2005.
▲
Operating lease obligations primarily relate to minimum
payments due under store lease agreements (see Note 7
to the Consolidated Financial Statements).
●
Purchase obligations primarily include purchase orders
for merchandise inventory and other agreements to
purchase goods or services that are enforceable and
legally binding and that specify all significant terms,
including: fixed or minimum quantities to be purchased;
fixed, minimum or variable price provisions; and the
approximate timing of the transactions.
★
Other long-term liabilities reflect future payments
relating to the Company’s nonqualified supplemental
retirement plan and have been reflected under “Other”
as the timing of these future payments is not known
until an associate leaves the Company or otherwise
requests an in-service distribution (see Note 12 to the
Consolidated Financial Statements).
0490_Fin5 3/30/05 09:26 AM Page 45

46 Limited Brands 2004 Annual Report
RECENTLY ISSUED ACCOUNTING PRONOUNCEMENTS
In December 2004, the Financial Accounting Standards Board issued SFAS No. 123R, “Share-Based Payment” (“SFAS No. 123R”), which
replaces SFAS No. 123 “Accounting for Stock-Based Compensation” (“SFAS No. 123”) and supersedes APB Opinion No. 25. SFAS No. 123R
requires all share-based payments to employees, including grants of employee stock options, to be measured at their fair values at the date
of grant and recognized as expense over the service period, which is generally the vesting period. SFAS No. 123R is effective for the first
interim period beginning after June 15, 2005, which, for the Company, will be the third quarter of 2005. SFAS No. 123R provides two
alternatives for adoption: (1) a "modified prospective" method in which compensation cost is recognized for all awards granted subsequent
to the effective date of this statement as well as for the unvested portion of awards outstanding as of the effective date; or (2) a “modified
retrospective” method which follows the approach in the “modified prospective” method, but also permits entities to restate prior periods
to record compensation cost calculated under SFAS No. 123 for the pro forma disclosure. The Company has not yet determined which
method of adoption it will apply.
The adoption of SFAS No. 123R is expected to have a significant impact on our results of operations, although it will have no impact on
our overall financial position. The impact of adopting SFAS No. 123R cannot be accurately estimated at this time, as it will depend on the
market value and the amount of share based awards granted in future periods. However, had we adopted SFAS No. 123R in a prior period,
the impact would approximate the impact of SFAS No. 123 as described in the disclosure of pro forma net income and earnings per share
in Note 1 to the Consolidated Financial Statements.
MARKET RISK
Management believes the Company’s exposure to interest rate and market risk associated with financial instruments (such as investments
and borrowings) is not material.
IMPACT OF INFLATION
The Company’s results of operations and financial condition are presented based on historical cost. While it is difficult to measure accurately
the impact of inflation due to the imprecise nature of the estimates required, the Company believes the effects of inflation, if any, on the
results of operations and financial condition have been minor.
CRITICAL ACCOUNTING POLICIES AND ESTIMATES
The preparation of financial statements in conformity with generally accepted accounting principles requires management to make
estimates and assumptions that affect the reported amounts of assets and liabilities at the date of the financial statements and the reported
amounts of revenues and expenses during the reporting period, as well as the related disclosure of contingent assets and liabilities at the
date of the financial statements. On an on-going basis, management evaluates its estimates and judgments, including those related to
inventories, long-lived assets and contingencies. Management bases its estimates and judgments on historical experience and various
other factors that are believed to be reasonable under the circumstances. Actual results may differ from these estimates. Management has
discussed the development and selection of its critical accounting policies and estimates with the Audit Committee of its Board of Directors
and believes the following assumptions and estimates are most significant to reporting its results of operations and financial position.
INVENTORIES
Inventories are principally valued at the lower of average cost or market, on a weighted average cost basis, using the retail method. The
Company records a charge to cost of goods sold for all inventory on hand when a permanent retail price reduction is reflected in its stores.
In addition, management makes estimates and judgments regarding, among other things, initial markup, markdowns, future demand and
market conditions, all of which significantly impact the ending inventory valuation. Inventory valuation at the end of the first and third quarters
reflects adjustments for estimated inventory markdowns for the Spring and Fall selling seasons. If actual future demand or market conditions
are different than those projected by management, future period merchandise margin rates may be unfavorably or favorably affected. Other
significant estimates related to inventory include shrink and obsolete and excess inventory which are also based on historical results and
management’s operating projections.
MANAGEMENT’S DISCUSSION AND ANALYSIS
0490_Fin5 3/30/05 09:26 AM Page 46

47
VALUATION OF LONG-LIVED ASSETS
Long-lived assets are reviewed for impairment whenever events or changes in circumstances indicate that the carrying amount of an asset
may not be recoverable. When a decision has been made to dispose of property and equipment prior to the end of the previously estimated
useful life, depreciation estimates are revised to reflect the use of the asset over the shortened estimated useful life. Intangible assets not
subject to amortization are reviewed for impairment annually by comparing the fair value to the carrying value. Goodwill is reviewed annually for
impairment by comparing each reporting unit’s carrying value to its fair value. Factors used in the valuation of long-lived assets, intangible
assets and goodwill include, but are not limited to, management’s plans for future operations, brand initiatives, recent operating results and
projected cash flows. If future economic conditions are different than those projected by management, impairment charges may be required.
CLAIMS AND CONTINGENCIES
The Company is subject to various claims and contingencies related to lawsuits, insurance, regulatory and other matters arising out of
the normal course of business. The Company’s determination of the treatment of claims and contingencies in the Consolidated Financial
Statements is based on management’s view of the expected outcome of the applicable claim or contingency. The Company consults with
legal counsel on matters related to litigation and seeks input from other experts both within and outside the Company with respect to
matters in the ordinary course of business. The Company accrues a liability if the likelihood of an adverse outcome is probable and the
amount is estimable. If the likelihood of an adverse outcome is only reasonably possible (as opposed to probable), or if an estimate is not
determinable, disclosure of a material claim or contingency is made in the Notes to the Consolidated Financial Statements.
INCOME TAXES
Significant judgment is required in determining the provision for income taxes and related accruals, deferred tax assets and liabilities. In the
ordinary course of business, there are transactions and calculations where the ultimate tax outcome is uncertain. Additionally, the Company’s
tax returns are subject to audit by various domestic and foreign tax authorities. Although the Company believes that its estimates are
reasonable, actual results could differ from these estimates resulting in a final tax outcome that may be materially different from that which
is reflected in the Company’s Consolidated Financial Statements.
REVENUE RECOGNITION
While the Company’s recognition of revenue does not involve significant judgment, revenue recognition represents an important
accounting policy of the Company. The Company recognizes revenue upon customer receipt of the merchandise, which for catalogue
and e-commerce revenues reflects an estimate for shipments that have not been received by the customer based on shipping terms.
The Company also provides a reserve for projected merchandise returns based on prior experience.
SAFE HARBOR STATEMENT UNDER THE PRIVATE SECURITIES LITIGATION REFORM ACT OF 1995
The Company cautions that any forward-looking statements (as such term is defined in the Private Securities Litigation Reform Act of 1995)
contained in this report or made by the Company or management of the Company involve risks and uncertainties and are subject to change
based on various important factors, many of which may be beyond the Company’s control. Accordingly, the Company’s future performance
and financial results may differ materially from those expressed or implied in any such forward-looking statements. Words such as “estimate,”
“project,” “plan,” “believe,” “expect,” “anticipate,” “intend,” “planned,” “potential” and similar expressions may identify forward-looking
statements. The following factors, among others, in some cases have affected and in the future could affect the Company’s financial
performance and actual results and could cause actual results for 2005 and beyond to differ materially from those expressed or implied in
any forward-looking statements included in this report or otherwise made by the Company or management: changes in consumer spending
patterns, consumer preferences and overall economic conditions; the potential impact of national and international security concerns on
the retail environment, including any possible military action, terrorist attacks or other hostilities; our ability to service our debt, any debt we
draw down under our credit facilities, and any other debt we incur, and the restrictions the agreements related to such debt impose upon
us; the impact of competition and pricing; changes in weather patterns; political stability; postal rate increases and charges; paper and
printing costs; risks associated with the seasonality of the retail industry; risks related to consumer acceptance of the Company’s products
and the ability to develop new merchandise and enhance the Company’s brand image; the ability to retain, hire and train key personnel and
management; risks associated with the possible inability of the Company’s manufacturers to deliver products in a timely manner or meet
quality standards; risks associated with relying on foreign sources of production, including risks related to the disruption of imports by labor
disputes; and risks associated with the possible lack of availability of suitable store locations on appropriate terms. The Company does not
undertake to publicly update or revise its forward-looking statements even if experience or future changes make it clear that any projected
results expressed or implied therein will not be realized.
0490_Fin5 3/30/05 09:26 AM Page 47

CONSOLIDATED STATEMENTS OF INCOMECONSOLIDATED STATEMENTS OF INCOME 2004 2003 2002(millions except per share amounts)
Net sales $9,408 $8,934 $8,445
Costs of goods sold, buying and occupancy (6,030) (5,683) (5,351)
Gross income 3,378 3,251 3,094
General, administrative and store operating expenses (2,351) (2,288) (2,222)
Special item — — (34)
Operating income 1,027 963 838
Interest expense (58) (62) (30)
Interest income 30 63 29
Other income (loss) 99 (6) —
Minority interest — — (6)
Gains on investees’ stock 18 208 6
Income from continuing operations before income taxes 1,116 1,166 837
Provision for income taxes 411 449 341
Income from continuing operations 705 717 496
Income from discontinued operations (including loss on disposal of $4 in 2002), net of tax — — 6
Net income $705 $717 $502
Income per basic share:
Continuing operations $1.50 $1.38 $0.97
Discontinued operations — — 0.01
Net income per basic share $1.50 $1.38 $0.98
Income per diluted share:
Continuing operations $1.47 $1.36 $0.95
Discontinued operations — — 0.01
Net income per diluted share $1.47 $1.36 $0.96
The accompanying Notes are an integral part of these Consolidated Financial Statements.
48 Limited Brands 2004 Annual Report
0490_Fin5 3/30/05 09:26 AM Page 48

49
CONSOLIDATED BALANCE SHEETSCONSOLIDATED BALANCE SHEETS (millions except per share amounts)
ASSETS JANUARY 29, 2005 JANUARY 31, 2004
Current assets
Cash and equivalents $1,161 $3,130
Accounts receivable 128 112
Inventories 1,142 943
Other 253 248
Total current assets 2,684 4,433
Property and equipment, net 1,484 1,460
Goodwill 1,338 1,311
Trade names and other intangible assets, net 462 441
Other assets 121 235
Total assets $6,089 $7,880
LIABILITIES AND SHAREHOLDERS’ EQUITY
Current liabilities
Accounts payable $496 $428
Accrued expenses and other 726 681
Income taxes 229 279
Total current liabilities 1,451 1,388
Deferred income taxes 177 134
Long-term debt 1,646 648
Other long-term liabilities 447 444
Commitments and contingencies (see Note 7)
Minority interest 33 —
Shareholders’ equity
Preferred stock - $1.00 par value; 10 shares authorized; none issued — —
Common stock - $0.50 par value; 1,000 shares authorized; 524 shares issued in 2004 and 2003 262 262
Paid-in capital 1,649 1,674
Retained earnings 3,392 3,417
Less: treasury stock, at average cost; 117 and 6 shares in 2004 and 2003 (2,968) (87)
Total shareholders’ equity 2,335 5,266
Total liabilities and shareholders’ equity $6,089 $7,880
The accompanying Notes are an integral part of these Consolidated Financial Statements.
0490_Fin5 3/30/05 09:26 AM Page 49

CONSOLIDATED STATEMENTS OF SHAREHOLDERS’ EQUITYCONSOLIDATED STATEMENTS OF
SHAREHOLDERS’ EQUITY (millions)
Balance, February 2, 2002 429 $216 $46 $2,552 ($70) $2,744
Net income — — — 502 — 502
Cash dividends ($0.30 per share) — — — (150) — (150)
Acquisition of Intimate Brands, Inc. minority interest 89 44 1,587 — — 1,631
Exchange of Intimate Brands, Inc. stock awards — — 59 — — 59
Exercise of stock options and other 5 1 1 2 70 74
Balance, February 1, 2003 523 $261 $1,693 $2,906 — $4,860
Net income — — — 717 — 717
Cash dividends ($0.40 per share) — — — (208) — (208)
Repurchase of common stock (10) — — — (150) (150)
Exercise of stock options and other 5 1 (19) 2 63 47
Balance, January 31, 2004 518 $262 $1,674 $3,417 ($87) $5,266
Net income — — — 705 — 705
Special dividend ($1.23 per share) — — — (500) — (500)
Cash dividends ($0.48 per share) — — — (224) — (224)
Repurchase of common stock (125) — — — (3,115) (3,115)
Exercise of stock options and other 14 — (25) (6) 234 203
Balance, January 29, 2005 407 $262 $1,649 $3,392 ($2,968) $2,335
The accompanying Notes are an integral part of these Consolidated Financial Statements.
COMMON COMMON PAID-IN RETAINED TREASURY TOTALSTOCK SHARES STOCK CAPITAL EARNINGS STOCK, AT SHAREHOLDERS’
OUTSTANDING PAR VALUE AVERAGE COST EQUITY
50 Limited Brands 2004 Annual Report
0490_Fin5 3/30/05 09:26 AM Page 50

51
CONSOLIDATED STATEMENTS OF CASH FLOWSCONSOLIDATED STATEMENTS OF CASH FLOWS (millions)
OPERATING ACTIVITIES 2004 2003 2002
Net income $705 $717 $502
Adjustments to reconcile net income to net cash provided by operating activities:
Depreciation and amortization 333 288 276
Straight-line rent adjustment 31 — —
Gain on sale of third-party warrants (65) — —
Gain on early collection of long-term note receivable (25) — —
Gains on investees’ stock (18) (208) (6)
Gains on sale of property (10) (1) (3)
Deferred income taxes 47 23 59
Stock compensation expense 9 18 85
Tax benefit on the exercise of non-qualified stock options 32 3 14
Loss on sale of joint ventures — 8 —
Debt extinguishment costs — 6 —
Special item — — 34
Loss on disposal of discontinued operations — — 10
Changes in assets and liabilities:
Accounts receivable (14) 41 (39)
Inventories (194) 23 (144)
Accounts payable, accrued expenses and other 105 43 77
Income taxes payable (54) 69 (110)
Other assets and liabilities 51 33 40
Net cash provided by operating activities 933 1,063 795
INVESTING ACTIVITIES
Capital expenditures (431) (293) (306)
Proceeds from settlement of long-term note receivable 75 — —
Proceeds from sale of New York & Company warrants 66 — —
Proceeds from sale of investees’ stock 65 324 65
Acquisition, net of minority interest (27) — —
Proceeds from sale of subsidiary — — 79
Proceeds from sale of joint ventures — 8 34
Net proceeds (expenditures) related to non-operating real estate investments 25 (4) 18
Other investing activities — — 30
Net cash (used for) provided by investing activities (227) 35 (80)
FINANCING ACTIVITIES
Proceeds from issuance of long-term debt 998 350 300
Repayment of long-term debt — (250) (150)
Repurchase of common stock (3,115) (150) —
Dividends paid (724) (208) (150)
Proceeds from exercise of stock options and other 166 28 52
Net cash (used for) provided by financing activities (2,675) (230) 52
Net (decrease) increase in cash and equivalents (1,969) 868 767
Cash and equivalents, beginning of year 3,130 2,262 1,495
Cash and equivalents, end of year $1,161 $3,130 $2,262
The accompanying Notes are an integral part of these Consolidated Financial Statements.
0490_Fin5 3/30/05 09:26 AM Page 51
NOTES TO CONSOLIDATED FINANCIAL STATEMENTS1 SUMMARY OF SIGNIFICANT ACCOUNTING POLICIES
PRINCIPLES OF CONSOLIDATION
Limited Brands, Inc. (the “Company”) sells women’s intimate apparel, personal care and beauty products, and women’s and men’s apparel
under various trade names through its specialty retail stores and direct response (catalogue and e-commerce) businesses.
The Consolidated Financial Statements include the accounts of the Company and its subsidiaries. All significant intercompany balances
and transactions have been eliminated in consolidation. The Consolidated Financial Statements include the results of Intimate Brands, Inc.
(“IBI”), an 84%-owned subsidiary through March 21, 2002, when the Company purchased the remaining minority interest (see Note 2); and
New York & Company (formerly Lerner New York) through November 27, 2002, when it was sold to a third-party. New York & Company’s
results are reflected as discontinued operations in 2002 (see Note 3).
Investments in unconsolidated entities over which the Company exercises significant influence but does not have control are accounted for
using the equity method. The Company’s share of the net income or loss of unconsolidated entities from which the Company purchases
merchandise or merchandise components is included in cost of goods sold. The Company’s share of the net income or loss of all other
unconsolidated entities is included in other income (loss).
LEASE RELATED ACCOUNTING
Like other companies in the retail industry, the Company, in consultation with its independent auditors, has concluded that its previous
accounting practices related to the accounting for straight-line rent and the depreciation and amortization of leasehold improvements and
certain landlord allowances were not correct. Accordingly in the fourth quarter of 2004, the Company recorded a one-time pretax charge
of $61 million, which is included in cost of goods sold, buying and occupancy in the Consolidated Statements of Income, to reflect the
corrections more fully described below.
Historically, the Company recognized straight-line rent expense for leases beginning on the earlier of the store opening date or lease
commencement date, resulting in the exclusion of the store build-out period (“Rent Holiday”) from the period over which it amortizes its rent
expense. In the fourth quarter of 2004, the Company adjusted its straight-line rent accrual for all applicable leases to reflect the recognition
of rent expense over a period that includes the Rent Holiday period, resulting in cumulative additional rent expense of $31 million.
In addition, the Company had previously depreciated leasehold improvements over a period of up to 10 years, which, primarily due to store
remodeling activity, resulted in certain leasehold improvements being depreciated over a period beyond the contractual lease term. In the fourth
quarter of 2004, the Company adjusted the net book value of its leasehold improvements to reflect useful lives equal to the lesser of the
estimated useful lives of the assets, or the contractual term of the lease, resulting in cumulative additional depreciation expense of $39 million.
In addition, the Company had previously amortized certain landlord allowances beyond the contractual lease term. The Company adjusted these
landlord allowances to reflect amortization over the contractual term of the lease, resulting in a cumulative reduction in rent expense of $9 million.
The Company evaluated the impact of these revised accounting practices from a quantitative and qualitative perspective. From a quantitative
perspective, had the revised accounting practices been applied retroactively, reported pretax income from continuing operations would have
increased by $7 million and $1 million in 2004 and 2003, respectively, and would have decreased by $2 million in 2002. Additionally, these
corrections do not impact the Company’s historical or future cash flows or the timing of lease related payments. From a qualitative
perspective, the retroactive application of these revised accounting practices would not have had a significant impact on earnings trends,
individual segment results, earnings expectations or debt covenants or other contractual requirements. Based on this evaluation, the
Company concluded that a restatement of prior period results was not required as the impact of these corrections is not material to the
Company’s historical results or cash flows.
FISCAL YEAR
The Company’s fiscal year ends on the Saturday closest to January 31. Fiscal years are designated in the Consolidated Financial Statements
and Notes by the calendar year in which the fiscal year commences. The results for fiscal years 2004, 2003 and 2002 represent the
fifty-two-week periods ended January 29, 2005, January 31, 2004 and February 1, 2003.
52 Limited Brands 2004 Annual Report
0490_Fin5 3/30/05 09:26 AM Page 52

53
CASH AND EQUIVALENTS
Cash and equivalents include amounts on deposit with financial institutions and money market investments with original maturities
of less than 90 days. Accounts payable includes $142 million and $137 million of outstanding checks at January 29, 2005 and
January 31, 2004, respectively.
INVENTORIES
Inventories are principally valued at the lower of average cost or market, on a weighted-average cost basis, using the retail method.
STORE SUPPLIES
The initial shipment of selling-related supplies (including primarily hangers, signage, security tags and packaging) is capitalized at the store
opening date. Subsequent shipments are expensed, except for new merchandise presentation programs, which are capitalized. Store
supplies are adjusted as appropriate for changes in actual quantities or costs.
DIRECT RESPONSE ADVERTISING
Direct response advertising relates primarily to the production and distribution of the Company’s catalogues and is amortized over the
expected future revenue stream, which is generally three months from the date catalogues are mailed. The Company had capitalized direct
response advertising of $33 million at January 29, 2005 and $28 million at January 31, 2004. All other advertising costs are expensed at the
time the promotion first appears in media or in the store. Catalogue and advertising costs amounted to $484 million in 2004, $465 million
in 2003 and $428 million in 2002.
LONG-LIVED ASSETS
Depreciation of property and equipment is computed for financial reporting purposes on a straight-line basis, using service lives generally
ranging from 10 to 15 years for non-store related building and leasehold improvements, 3 to 10 years for store related property and
equipment, with leaseholds and improvements over the shorter of the useful life or lease term, and 20 years for other property and equipment.
When a decision has been made to dispose of property and equipment prior to the end of the previously estimated useful life, depreciation
estimates are revised to reflect the use of the asset over the shortened estimated useful life. The cost of assets sold or retired and the
related accumulated depreciation are removed from the accounts with any resulting gain or loss included in net income. Maintenance and
repairs are charged to expense as incurred. Major renewals and betterments that extend service lives are capitalized.
Intangible assets subject to amortization are amortized over the estimated useful life of the asset. License agreements are amortized based
on the sell-through of the related products, over the shorter of the term of the license agreement or the estimated useful life of the asset, not
to exceed 10 years. Trade names and other intangible assets subject to amortization are amortized on a straight-line basis.
Long-lived assets are reviewed for impairment whenever events or changes in circumstances indicate that the carrying amount of the asset
may not be recoverable. If the undiscounted future cash flows from the long-lived assets are less than the carrying value, the Company
recognizes a loss equal to the difference between the carrying value and the discounted future cash flows of the asset. Goodwill is reviewed
annually for impairment by comparing each reporting unit’s carrying value to its fair value. Intangible assets not subject to amortization are
reviewed for impairment annually by comparing the fair value to the carrying value. Factors used in the valuation of long-lived assets,
intangible assets and goodwill include, but are not limited to, management’s plans for future operations, brand initiatives, recent operating
results and projected cash flows.
INCOME TAXES
The Company accounts for income taxes using the asset and liability method. Under this method, deferred tax assets and liabilities are
recognized based on the difference between the financial statement carrying amounts of existing assets and liabilities and their respective
tax bases. Deferred tax assets and liabilities are measured using enacted tax rates in effect in the years when those temporary differences
are expected to reverse. The effect on deferred taxes of a change in tax rates is recognized in income in the period that includes the
enactment date.
0490_Fin5 3/30/05 09:26 AM Page 53

SELF INSURANCE
The Company is self-insured for medical, worker’s compensation, general liability and automobile benefits up to certain stop-loss limits.
Such costs are accrued based on known claims and an estimate of incurred but not reported (“IBNR”) claims. IBNR claims are estimated
using historical claim information and actuarial estimates.
MINORITY INTEREST
In January 2005, the Company and an investment partner acquired a personal care products business. Net assets of the acquired company,
based on a preliminary valuation, consisted primarily of $29 million of intangible assets subject to amortization and $27 million of goodwill.
Based on the contractual rights and obligations of the Company and the investment partner, the Company is required to consolidate the
acquired company, in accordance with Financial Accounting Standards Board Interpretation No. 46R, “Consolidation of Variable Interest
Entities.” The investment partner’s equity interest in the acquired company has been reflected as minority interest in the Consolidated
Balance Sheet and will be increased or decreased based on future earnings, capital contributions and distributions from the acquired company.
SHAREHOLDERS’ EQUITY
In February 2004, the Company’s Board of Directors authorized the repurchase of $1 billion of the Company’s common stock under a
modified Dutch Auction tender offer, which was completed in April 2004. Under this tender offer, the Company repurchased 50.6 million
shares of common stock at a purchase price of $19.75 per share.
In May 2004, the Company’s Board of Directors authorized the repurchase of $100 million of the Company’s common stock. The
Company completed this repurchase by acquiring approximately 5.1 million shares of its common stock at an average price per share
of approximately $19.42.
In August 2004, the Company’s Board of Directors authorized the repurchase of an additional $250 million of the Company’s common stock.
Before this repurchase was superseded by the $2 billion tender offer announced in October 2004, the Company repurchased approximately
0.7 million shares of its common stock under this authorization for $15 million at an average price per share of approximately $21.04.
In October 2004, the Company’s Board of Directors authorized the repurchase of $2 billion of common stock under a modified Dutch
Auction tender offer, superseding the Company’s $250 million share repurchase program. The Company completed this tender offer in
December 2004, repurchasing 69.0 million shares of common stock at a purchase price of $29 per share. Upon the completion of this
tender offer, the Board of Directors declared a $500 million special dividend, or $1.23 per share, which was paid in January 2005.
In January 2003, the Company’s Board of Directors authorized the repurchase of $150 million of the Company’s common stock. During
2003, the Company completed the $150 million repurchase by acquiring approximately 9.9 million shares of its common stock at an average
price per share of approximately $15.
REVENUE RECOGNITION
The Company recognizes sales upon customer receipt of the merchandise, which for catalogue and e-commerce revenues reflects
an estimate of shipments that have not yet been received by the customer based on shipping terms. Shipping and handling revenues are
included in net sales and the related costs are included in costs of goods sold, buying and occupancy. Revenue for gift certificate and
gift card sales as well as store credits is recognized at redemption. A reserve is provided for projected merchandise returns based on
prior experience.
COST OF GOODS SOLD, BUYING AND OCCUPANCY
Cost of goods sold includes merchandise costs, net of discounts and allowances, freight and inventory shrinkage. Buying and occupancy
expenses primarily include payroll, benefit costs and operating expenses for the Company’s buying departments and distribution network,
rent, common area maintenance, real estate taxes, utilities, maintenance, catalogue amortization and depreciation for the Company’s
stores, warehouse facilities and equipment.
54 Limited Brands 2004 Annual Report
NOTES TO CONSOLIDATED FINANCIAL STATEMENTS
0490_Fin5 3/30/05 09:26 AM Page 54
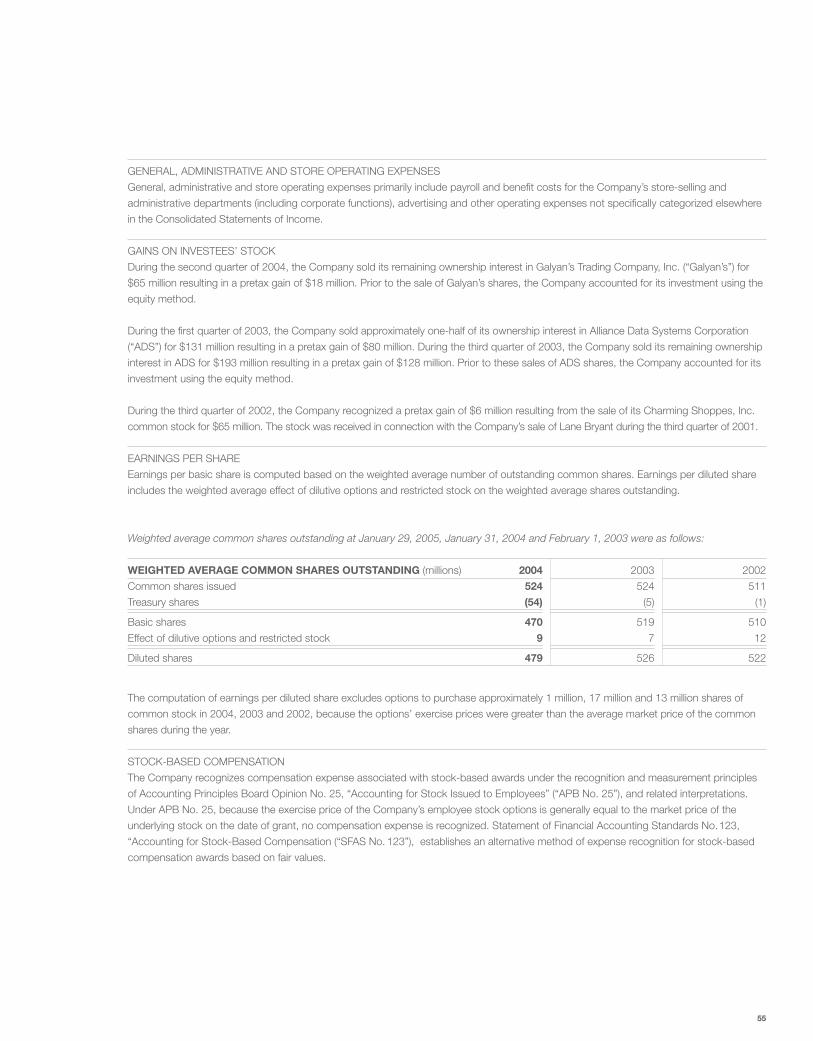
55
GENERAL, ADMINISTRATIVE AND STORE OPERATING EXPENSES
General, administrative and store operating expenses primarily include payroll and benefit costs for the Company’s store-selling and
administrative departments (including corporate functions), advertising and other operating expenses not specifically categorized elsewhere
in the Consolidated Statements of Income.
GAINS ON INVESTEES’ STOCK
During the second quarter of 2004, the Company sold its remaining ownership interest in Galyan’s Trading Company, Inc. (“Galyan’s”) for
$65 million resulting in a pretax gain of $18 million. Prior to the sale of Galyan’s shares, the Company accounted for its investment using the
equity method.
During the first quarter of 2003, the Company sold approximately one-half of its ownership interest in Alliance Data Systems Corporation
(“ADS”) for $131 million resulting in a pretax gain of $80 million. During the third quarter of 2003, the Company sold its remaining ownership
interest in ADS for $193 million resulting in a pretax gain of $128 million. Prior to these sales of ADS shares, the Company accounted for its
investment using the equity method.
During the third quarter of 2002, the Company recognized a pretax gain of $6 million resulting from the sale of its Charming Shoppes, Inc.
common stock for $65 million. The stock was received in connection with the Company’s sale of Lane Bryant during the third quarter of 2001.
EARNINGS PER SHARE
Earnings per basic share is computed based on the weighted average number of outstanding common shares. Earnings per diluted share
includes the weighted average effect of dilutive options and restricted stock on the weighted average shares outstanding.
Weighted average common shares outstanding at January 29, 2005, January 31, 2004 and February 1, 2003 were as follows:
The computation of earnings per diluted share excludes options to purchase approximately 1 million, 17 million and 13 million shares of
common stock in 2004, 2003 and 2002, because the options’ exercise prices were greater than the average market price of the common
shares during the year.
STOCK-BASED COMPENSATION
The Company recognizes compensation expense associated with stock-based awards under the recognition and measurement principles
of Accounting Principles Board Opinion No. 25, “Accounting for Stock Issued to Employees” (“APB No. 25”), and related interpretations.
Under APB No. 25, because the exercise price of the Company’s employee stock options is generally equal to the market price of the
underlying stock on the date of grant, no compensation expense is recognized. Statement of Financial Accounting Standards No.123,
“Accounting for Stock-Based Compensation (“SFAS No. 123”), establishes an alternative method of expense recognition for stock-based
compensation awards based on fair values.
WEIGHTED AVERAGE COMMON SHARES OUTSTANDING (millions) 2004 2003 2002
Common shares issued 524 524 511
Treasury shares (54) (5) (1)
Basic shares 470 519 510
Effect of dilutive options and restricted stock 9 7 12
Diluted shares 479 526 522
0490_Fin5 3/30/05 09:26 AM Page 55

The stock compensation cost recorded by the Company primarily relates to restricted stock expense and compensation expense resulting
from the exchange of both vested and unvested IBI stock awards in connection with the IBI recombination (see Note 2). Stock compensation
expense related to the IBI recombination was recognized in accordance with Emerging Issues Task Force Issue No. 00-23, “Issues Related
to the Accounting for Stock Compensation under APB Opinion No. 25 and FASB Interpretation No. 44” (“EITF No. 00-23”).
The weighted average per share fair value of options granted by the Company ($6.25, $4.08 and $5.31 for 2004, 2003 and 2002) was used
to calculate the pro forma compensation expense under SFAS No. 123. The fair value was estimated using the Black-Scholes option-pricing
model with the following weighted average assumptions for 2004, 2003 and 2002: dividend yields of 2.6%, 3.2% and 2.8%; volatility of
44%, 44% and 42%; risk-free interest rates of 3%, 2% and 3%; and expected lives of 5.3 years, 5.2 years and 4.4 years.
RECENTLY ISSUED ACCOUNTING PRONOUNCEMENTS
In December 2004, the Financial Accounting Standards Board issued SFAS No. 123R, “Share-Based Payment” (“SFAS No. 123R”), which
replaces SFAS No. 123 and supersedes APB Opinion No. 25. SFAS No. 123R requires all share-based payments to employees, including
grants of employee stock options, to be measured at their fair values at the date of grant and recognized as expense over the service
period, which is generally the vesting period. SFAS No. 123R is effective for the first interim period beginning after June 15, 2005, which,
for the Company, will be the third quarter of 2005. SFAS No. 123R provides two alternatives for adoption: (1) a “modified prospective”
method in which compensation cost is recognized for all awards granted subsequent to the effective date of this statement as well as for
the unvested portion of awards outstanding as of the effective date; or (2) a “modified retrospective” method which follows the approach
in the “modified prospective” method, but also permits entities to restate prior periods to record compensation cost calculated under
SFAS No. 123 for the pro forma disclosure. The Company has not yet determined which method of adoption it will apply.
The adoption of SFAS No. 123R is expected to have a significant impact on our results of operations, although it will have no impact on
our overall financial position. The impact of adopting SFAS No. 123R cannot be accurately estimated at this time, as it will depend on the
market value and the amount of share based awards granted in future periods. However, had we adopted SFAS No. 123R in a prior period,
the impact would approximate the impact of SFAS No. 123 as described in the disclosure of pro forma net income and earnings per share
in the above disclosure.
The following table illustrates the effect on net income and earnings per share if the Company had applied the fair value recognition
provisions of SFAS No. 123:
PRO FORMA NET INCOME AND EARNINGS PER SHARE 2004 2003 2002
(millions except per share amounts)
Net income, as reported $705 $717 $502
Add: stock compensation cost recorded under APB No. 25, net of tax 5 12 58
Deduct: stock compensation cost calculated under SFAS No. 123, net of tax (33) (38) (50)
Pro forma net income $677 $691 $510
Earnings per share:
Basic, as reported $1.50 $1.38 $0.98
Basic, pro forma $1.44 $1.33 $1.00
Diluted, as reported $1.47 $1.36 $0.96
Diluted, pro forma $1.42 $1.32 $0.99
56 Limited Brands 2004 Annual Report
NOTES TO CONSOLIDATED FINANCIAL STATEMENTS
0490_Fin5 3/30/05 09:26 AM Page 56

57
USE OF ESTIMATES IN THE PREPARATION OF FINANCIAL STATEMENTS
The preparation of financial statements in conformity with generally accepted accounting principles requires management to make
estimates and assumptions that affect the reported amounts of assets and liabilities at the date of the financial statements and the reported
amounts of revenues and expenses during the reporting period. Because actual results may differ from those estimates, the Company
revises its estimates and assumptions as new information becomes available.
RECLASSIFICATIONS
Certain prior year amounts have been reclassified to conform to the current year presentation.
ACQUISITION OF INTIMATE BRANDS, INC. MINORITY INTEREST
In March 2002, the Company completed a tax-free tender offer and merger, which resulted in the acquisition of the IBI minority interest.
The acquisition resulted in the recombination of IBI and Limited Brands. The total purchase price was approximately $1.6 billion, based on
approximately 89 million Limited Brands common shares issued in the transaction and the average closing price of Limited Brands common
stock over the three-day period before and after the transaction date.
The acquisition was effected through an offer to exchange 1.1 shares of Limited Brands common stock for each share of IBI Class A
common stock followed by a merger in which all publicly-held shares not tendered were exchanged for the same consideration. As a result,
IBI became a wholly-owned subsidiary of Limited Brands and the former public shareholders of IBI became shareholders of Limited Brands.
The acquisition was accounted for using the purchase method of accounting, as prescribed by SFAS No. 141, “Business Combinations.”
The Company allocated the purchase price to the minority interest portion of the fair values of identifiable intangible assets acquired.
The purchase price allocation included $411 million of acquired intangible assets related to trade names with indefinite lives. In accordance
with SFAS No. 142, “Goodwill and Other Intangible Assets,” these intangible assets are not being amortized. The remaining purchase price
allocation included the fair market value adjustments related to customer relationships and lists, property and equipment, leases, long-term
debt and deferred rent. These adjustments are being amortized over their respective useful lives (primarily five years) resulting in non-cash
expense of approximately $5 million per year. In addition, the acquisition resulted in approximately $1.2 billion of goodwill. None of these
amounts are deductible for tax purposes.
SALE OF NEW YORK & COMPANY
On November 27, 2002, the Company sold one of its apparel businesses, New York & Company, to an investor group led by the business
unit’s President and Chief Executive Officer and affiliates of Bear Stearns Merchant Banking. Under the terms of the agreement, the
Company received $79 million in cash, a $75 million 10% subordinated note due November 2009 (the “New York & Company Note”) and
warrants for approximately 13% of the common equity of the new company (the “New York & Company Warrants”). A $26 million discount
was recorded on the New York & Company Note, which was being accreted to income over the term of the note.
During 2003, the Company received approximately $38 million in additional cash consideration based on New York & Company’s net
working capital at closing.
The transaction resulted in an after-tax loss of approximately $4 million, which reflected transaction costs and an estimated lease guarantee
liability. The Company’s financial statements reflect New York & Company’s operating results (including the transaction loss) as a discontinued
operation in 2002 in accordance with SFAS No. 144, “Accounting for the Impairment or Disposal of Long-Lived Assets.” New York &
Company’s net sales and pretax income reported in discontinued operations were $708 million and $15 million in 2002. The Company did
not allocate interest expense to discontinued operations.
3
2
0490_Fin5 3/30/05 09:26 AM Page 57

During the first quarter of 2004, the Company recognized a $45 million gain resulting from New York & Company’s early repayment of the
New York & Company Note and purchase of the New York & Company Warrants. The note and warrants had a carrying value, including
accrued interest, of $60 million.
In connection with the agreement to prepay the note and to purchase the warrants, as amended on August 5, 2004, New York & Company
agreed to make an additional payment to Limited Brands if (1) New York & Company completed an initial public offering pursuant to a
registration statement filed on or before December 31, 2004 or was sold pursuant to an agreement entered into on or before December 31,
2004 and (2) the implied equity value of New York & Company based upon one of the above transactions exceeded $157 million. During
the third quarter of 2004, New York & Company completed an initial public offering and the Company received the agreed upon payment of
$45 million, at which time the Company recognized a $45 million pretax, non-operating gain.
The Company will continue to provide certain corporate services to New York & Company under service agreements which expire at various
dates through 2007.
SPECIAL ITEM
During the first quarter of 2002, in connection with the acquisition of the IBI minority interest (see Note 2), vested IBI stock options and
restricted stock were exchanged for Limited Brands stock awards with substantially similar terms. In accordance with EITF No. 00-23, the
exchange was accounted for as a modification of a stock-based compensation arrangement. As a result, the Company recorded a pretax,
non-cash charge of $34 million in the first quarter of 2002.
PROPERTY AND EQUIPMENT, NET
Property and equipment, net at January 29, 2005 and January 31, 2004 was as follows:
5
4
PROPERTY AND EQUIPMENT, NET (millions) 2004 2003
Land, buildings and improvements $426 $420
Furniture, fixtures and equipment 2,180 2,213
Leaseholds and improvements 1,138 1,090
Construction in progress 38 21
Total 3,782 3,744
Less: accumulated depreciation (2,298) (2,284)
Property and equipment, net $1,484 $1,460
58 Limited Brands 2004 Annual Report
NOTES TO CONSOLIDATED FINANCIAL STATEMENTS
0490_Fin5 3/30/05 09:26 AM Page 58

59
GOODWILL, TRADE NAMES AND OTHER INTANGIBLE ASSETS, NET
Goodwill of $690 million related to Victoria’s Secret and $621 million related to Bath & Body Works primarily resulted from the
March 2002 acquisition of the IBI minority interest (see Note 2). An additional $27 million of goodwill was recorded as a result of the
Company’s January 2005 acquisition of an interest in a personal care products business (see Note 1).
Intangible assets, not subject to amortization, represent trade names that were recorded in connection with the acquisition of the IBI
minority interest and were $411 million as of January 29, 2005 and January 31, 2004.
Intangible assets, subject to amortization, were as follows:
Amortization expense was $8 million in 2004, $8 million in 2003 and $6 million in 2002. Estimated future annual amortization expense will
be approximately $11 million in 2005, $10 million in 2006, $8 million in 2007, $3 million in 2008 and 2009 and $16 million thereafter.
LEASED FACILITIES, COMMITMENTS AND CONTINGENCIES
Annual store rent consists of a fixed minimum amount and/or contingent rent based on a percentage of sales exceeding a stipulated amount.
Rent expense for the years ended January 29, 2005, January 31, 2004 and February 1, 2003 was as follows:
In 2004, fixed minimum store rent expense includes a $22 million pretax non-cash charge to correct the Company’s accounting for leases
(see Note 1). For leases that contain predetermined fixed escalations of the minimum rentals and/or rent abatements subsequent to taking
possession of the leased property, the Company recognizes the related rent expense on a straight-line basis and records the difference
between the recognized rental expense and amounts payable under the leases as deferred lease credits, which are included in other
long-term liabilities. This liability amounted to $95 million and $69 million at January 29, 2005 and January 31, 2004, respectively.
7
RENT EXPENSE (millions) 2004 2003 2002
Store rent:
Fixed minimum $517 $492 $479
Contingent 56 46 43
Total store rent 573 538 522
Equipment and other 38 42 34
Gross rent expense 611 580 556
Sublease rental income (19) (20) (20)
Total rent expense $592 $560 $536
INTANGIBLE ASSETS, NET (millions) 2004 2003
Gross carrying amount $85 $56
Accumulated amortization (34) (26)
Intangible assets, net $51 $30
6
0490_Fin5 3/30/05 09:26 AM Page 59

Landlord allowances received upon entering into certain store leases are recorded as a long-term deferred credit and are amortized
on a straight-line basis as a reduction to rent expense over the lease term. The unamortized portion of landlord allowances is included
in other long-term liabilities and amounted to $160 million and $170 million at January 29, 2005 and January 31, 2004, respectively.
At January 29, 2005, the Company was committed to noncancelable leases with remaining terms generally from one to ten years.
A substantial portion of these commitments consists of store leases generally with an initial term of ten years. Store lease terms generally
require additional payments covering taxes, common area costs and certain other expenses. The obligations for these additional payments
are excluded from the table that follows.
The Company’s minimum rent commitments under noncancelable leases is as follows:
At January 29, 2005, the Company’s future sublease income under noncancelable subleases is $43 million, which includes $16 million of
rent commitments related to disposed businesses under master lease arrangements.
In connection with the disposition of certain businesses, the Company has remaining guarantees of approximately $370 million related
to lease payments of Abercrombie & Fitch, Too Inc. (formerly Limited Too), Dick’s Sporting Goods (formerly Galyan’s), Lane Bryant and
New York & Company under the current terms of noncancelable leases expiring at various dates through 2015. These guarantees include
minimum rent and additional payments covering taxes, common area costs and certain other expenses and relate to leases that commenced
prior to the disposition of the businesses. In certain instances, the Company’s guarantee may remain in effect if the term of a lease is
extended. The Company believes the likelihood of material liability being triggered under these guarantees, with respect to existing and
extended leases, is remote.
The Company has land and other investments in Easton, a 1,300 acre planned community in Columbus, Ohio, that integrates office,
hotel, retail, residential and recreational space. These investments, at cost, totaled $57 million at January 29, 2005 and $68 million at
January 31, 2004.
Included in the Company’s Easton investments is an equity interest in Easton Town Center, LLC (“ETC”), an entity that owns and has
developed a commercial entertainment and shopping center. The Company’s investment in ETC was $14 million at January 29, 2005 and
$13 million at January 31, 2004, which the Company accounts for using the equity method. The Company has a majority financial interest
in ETC, but another member that is unaffiliated with the Company is the managing member. Certain significant decisions regarding ETC
require the consent of the unaffiliated members in addition to the Company.
Total assets of ETC were approximately $238 million as of January 29, 2005 and $234 million as of January 31, 2004. ETC’s principal
funding source is a $210 million secured bank loan, all of which was outstanding at January 29, 2005. The loan is payable in full on
January 28, 2006, with the option of two 12-month extensions if certain requirements are met. The Company has guaranteed $25 million of
the principal of this loan. If ETC does not meet the debt service coverage ratio or appraised property values required by covenants in the
loan agreement, the Company has the option to (1) guarantee an additional amount of the loan, (2) provide an irrevocable letter of credit on
behalf of ETC, (3) make a principal payment or (4) lease additional retail space. Otherwise, the bank may call the loan under the agreement’s
default provisions. The Company expects that ETC will meet the financial covenants of this loan.
The Company is subject to various claims and contingencies related to lawsuits, income taxes, insurance, regulatory and other matters
arising out of the normal course of business. Management believes that the ultimate liability arising from such claims and contingencies,
if any, is not likely to have a material adverse effect on the Company’s results of operations, financial condition or cash flows.
MINIMUM RENT COMMITMENTS (millions)
2005 $547
2006 495
2007 424
2008 361
2009 331
Thereafter 1,095
60 Limited Brands 2004 Annual Report
NOTES TO CONSOLIDATED FINANCIAL STATEMENTS
0490_Fin5 3/30/05 09:26 AM Page 60

61
ACCRUED EXPENSES AND OTHER
Accrued expenses and other at January 29, 2005 and January 31, 2004 were as follows:
INCOME TAXES
The components of the Company’s provision for income taxes for the years ended January 29, 2005, January 31, 2004 and
February 1, 2003 were as follows:
The 2002 tax provision reflects the nondeductible expense related to the exchange of vested IBI incentive stock options (see Note 4).
The foreign component of pretax income, arising principally from overseas sourcing operations, was $46 million in 2004, $34 million in 2003
and $56 million in 2002.
The reconciliation between the statutory federal income tax rate and the effective tax rate for the years ended January 29, 2005,
January 31, 2004 and February 1, 2003 follows:
9
PROVISION FOR INCOME TAXES (millions) 2004 2003 2002
Currently payable:
Federal $285 $357 $251
State 74 64 49
Foreign 5 5 5
Total 364 426 305
Deferred:
Federal 74 25 30
State (27) (2) 6
Total 47 23 36
Provision for income taxes $411 $449 $341
RATE RECONCILIATION 2004 2003 2002
Federal income tax rate 35.0% 35.0% 35.0%
State income taxes, net of Federal income tax effect 4.2% 3.5% 4.3%
Other items, net (2.4%) — 1.4%
Effective tax rate 36.8% 38.5% 40.7%
ACCRUED EXPENSES AND OTHER (millions) 2004 2003
Deferred revenue $225 $184
Compensation, payroll taxes and benefits 144 150
Taxes, other than income 71 58
Returns reserve 42 37
Insurance 39 35
Rent 37 34
Interest 26 14
Other 142 169
Total accrued expenses and other $726 $681
8
0490_Fin5 3/30/05 09:26 AM Page 61

In 2004, the effective tax rate reflects a tax benefit of $18 million related to the resolution of certain state tax matters, which reduced the
Company’s effective rate by 1.4% and is included with other items, net in the rate reconciliation.
The Company’s effective tax rate has historically reflected and continues to reflect a provision related to the undistributed earnings of foreign
affiliates. The Company has recorded a deferred tax liability for those amounts, but the taxes are not paid until the earnings are deemed
repatriated to the United States. The Internal Revenue Service (“IRS”) has assessed the Company for taxes and interest for the years 1992
to 2000 on the basis that a portion of the foreign earnings had been repatriated. In September 1999, the United States Tax Court sustained
the position of the IRS with respect to the 1992 year. In connection with an appeal of the Tax Court judgment, in 1999 the Company made
a $112 million payment of taxes and interest for the years 1992 to 1998 that reduced deferred tax liabilities.
In March 2002, the U.S. Court of Appeals for the Sixth Circuit ruled in favor of the Company, reversing the previous Tax Court judgment
relating to the 1992 year. This ruling also applied to years 1993 and 1994. In the third quarter of 2003, the Company reached an agreement
with the IRS regarding the computation of interest and recognized interest income of $30 million related to the 1992 through 1994 years.
While the outcome cannot yet be determined, the Company is pursuing additional actions to obtain a refund of up to $85 million in tax plus
interest related to the 1995 through 2000 years. Any refund of tax received would be recorded as a deferred tax liability, representing future
taxes due on undistributed earnings of foreign affiliates.
On October 22, 2004, the American Jobs Creation Act (the “Act”) was passed, providing for a special one-time deduction of 85% of certain
foreign earnings that are repatriated to the United States provided certain criteria are met, including the implementation of a qualifying
reinvestment plan. Based on a preliminary review, it is reasonably possible that the Company may qualify to receive a tax benefit with
respect to the repatriation of foreign earnings through 2004. However, a substantial portion of the potential tax benefit is contingent upon
the successful resolution of the matters related to the 1995 through 2000 years described above. If the Company receives a refund related
to the 1995 through 2000 years and is able to implement a qualifying reinvestment plan, a tax benefit of up to $70 million could be
recognized as a reduction of income tax expense.
The Company continues to evaluate the impact of the Act and will finalize its assessment during 2005.
The effect of temporary differences that give rise to deferred income taxes at January 29, 2005 and January 31, 2004 was as follows:
As of January 29, 2005, the Company had available for state income tax purposes net operating loss carryforwards, which expire, if unused,
in years 2005 through 2024. The Company has determined that it is more likely than not that the state net operating loss carryforwards of
$72 million after-tax, will not be realized and, accordingly, a valuation allowance has been provided against the deferred tax asset for the
entire balance of state net operating loss carryforwards.
Income taxes payable included net current deferred tax liabilities of $74 million at January 29, 2005 and $70 million at January 31, 2004.
Income tax payments were $385 million in 2004, $352 million in 2003 and $376 million in 2002.
2004 2003
DEFERRED INCOME TAXES (millions) ASSETS LIABILITIES TOTAL ASSETS LIABILITIES TOTAL
Leases $38 — $38 $28 — $28
Non-qualified retirement plan 37 — 37 35 — 35
Inventory 6 — 6 15 — 15
Property and equipment — ($115) (115) — ($59) (59)
Trade names and other intangibles — (148) (148) — (150) (150)
Undistributed earnings of foreign affiliates — (40) (40) — (32) (32)
Other, net — (29) (29) — (41) (41)
Total deferred income taxes $81 ($332) ($251) $78 ($282) ($204)
62 Limited Brands 2004 Annual Report
NOTES TO CONSOLIDATED FINANCIAL STATEMENTS
0490_Fin5 3/30/05 09:26 AM Page 62
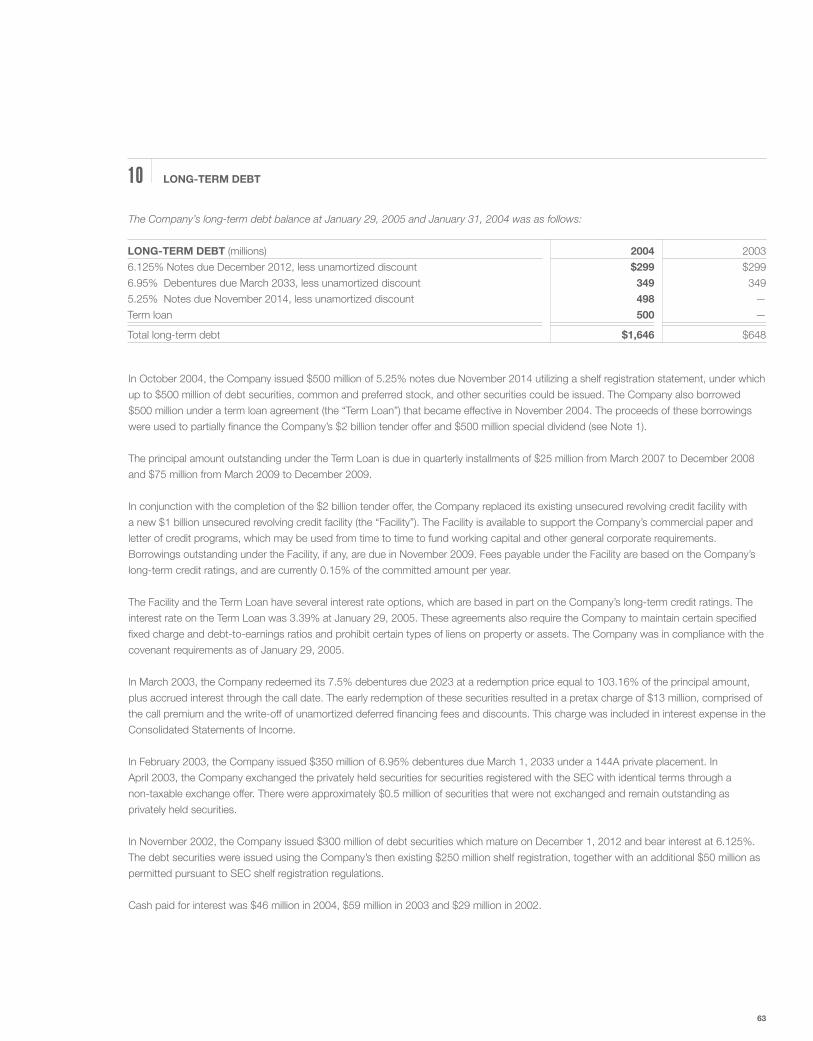
63
LONG-TERM DEBT
The Company’s long-term debt balance at January 29, 2005 and January 31, 2004 was as follows:
In October 2004, the Company issued $500 million of 5.25% notes due November 2014 utilizing a shelf registration statement, under which
up to $500 million of debt securities, common and preferred stock, and other securities could be issued. The Company also borrowed
$500 million under a term loan agreement (the “Term Loan”) that became effective in November 2004. The proceeds of these borrowings
were used to partially finance the Company’s $2 billion tender offer and $500 million special dividend (see Note 1).
The principal amount outstanding under the Term Loan is due in quarterly installments of $25 million from March 2007 to December 2008
and $75 million from March 2009 to December 2009.
In conjunction with the completion of the $2 billion tender offer, the Company replaced its existing unsecured revolving credit facility with
a new $1 billion unsecured revolving credit facility (the “Facility”). The Facility is available to support the Company’s commercial paper and
letter of credit programs, which may be used from time to time to fund working capital and other general corporate requirements.
Borrowings outstanding under the Facility, if any, are due in November 2009. Fees payable under the Facility are based on the Company’s
long-term credit ratings, and are currently 0.15% of the committed amount per year.
The Facility and the Term Loan have several interest rate options, which are based in part on the Company’s long-term credit ratings. The
interest rate on the Term Loan was 3.39% at January 29, 2005. These agreements also require the Company to maintain certain specified
fixed charge and debt-to-earnings ratios and prohibit certain types of liens on property or assets. The Company was in compliance with the
covenant requirements as of January 29, 2005.
In March 2003, the Company redeemed its 7.5% debentures due 2023 at a redemption price equal to 103.16% of the principal amount,
plus accrued interest through the call date. The early redemption of these securities resulted in a pretax charge of $13 million, comprised of
the call premium and the write-off of unamortized deferred financing fees and discounts. This charge was included in interest expense in the
Consolidated Statements of Income.
In February 2003, the Company issued $350 million of 6.95% debentures due March 1, 2033 under a 144A private placement. In
April 2003, the Company exchanged the privately held securities for securities registered with the SEC with identical terms through a
non-taxable exchange offer. There were approximately $0.5 million of securities that were not exchanged and remain outstanding as
privately held securities.
In November 2002, the Company issued $300 million of debt securities which mature on December 1, 2012 and bear interest at 6.125%.
The debt securities were issued using the Company’s then existing $250 million shelf registration, together with an additional $50 million as
permitted pursuant to SEC shelf registration regulations.
Cash paid for interest was $46 million in 2004, $59 million in 2003 and $29 million in 2002.
10
LONG-TERM DEBT (millions) 2004 2003
6.125% Notes due December 2012, less unamortized discount $299 $299
6.95% Debentures due March 2033, less unamortized discount 349 349
5.25% Notes due November 2014, less unamortized discount 498 —
Term loan 500 —
Total long-term debt $1,646 $648
0490_Fin5 3/30/05 09:26 AM Page 63

STOCK OPTION SUMMARY (thousands except per share amounts)
OPTIONS OUTSTANDING OPTIONS EXERCISABLE
RANGE OF NUMBER OUTSTANDING WEIGHTED AVERAGE WEIGHTED AVERAGE NUMBER EXERCISABLE WEIGHTED AVERAGE
EXERCISE PRICES REMAINING EXERCISE PRICE EXERCISE PRICE
CONTRACTUAL LIFE
$5 – $10 5,608 2.5 $9.41 5,415 $9.41
$11 – $15 12,524 6.0 $13.07 6,504 $13.36
$16 – $20 16,340 7.2 $17.65 5,248 $17.59
$21 – $26 612 6.9 $22.35 362 $21.89
$5 – $26 35,084 6.0 $14.78 17,529 $13.58
STOCK-BASED COMPENSATION
Under the Company’s stock plans, 100 million options and restricted shares have been authorized to be granted to associates at the market
price on the date of grant, of which approximately 29 million options and restricted shares were available for grant at January 29, 2005.
Options have a maximum term of 10 years and generally vest over periods from four to six years.
Prior to the acquisition of the IBI minority interest in 2002, associates were granted restricted shares and options under separate Limited
Brands and IBI stock plans. As a result of the recombination (see Note 2), the IBI stock plan was amended to reflect the conversion of IBI
stock options and restricted stock to Limited Brands stock awards with substantially similar terms. For the years ended January 29, 2005,
January 31, 2004 and February 1, 2003, the Company recognized $2 million, $11 million and $25 million, respectively, of pretax, non-cash
compensation expense related to these unvested awards. In addition, during the year ended February 1, 2003, the Company recorded a
pretax, non-cash charge of $34 million for vested awards under the IBI stock plan (see Note 4).
In connection with the $500 million special dividend in 2004 (see Note 1), the Company adjusted both the exercise price and the number
of stock-based awards outstanding as of the record date of the special dividend. As a result of this adjustment, both the aggregate intrinsic
value and the ratio of the exercise price to the market price were approximately equal immediately before and after the dividend record date.
As a result, no compensation expense was recognized for this adjustment.
The Company’s stock options outstanding at January 29, 2005 were as follows:
11
64 Limited Brands 2004 Annual Report
NOTES TO CONSOLIDATED FINANCIAL STATEMENTS
0490_Fin5 3/30/05 09:26 AM Page 64

65
The Company’s stock option activity for 2004, 2003 and 2002 was as follows:
STOCK OPTION ACTIVITY NUMBER OF SHARES WEIGHTED AVERAGE
(thousands except per share amounts) OPTION PRICE PER SHARE
2002 Outstanding at beginning of year 30,464 $13.61
Granted 7,952 17.59
Exchange of IBI options 13,871 12.86
Exercised (4,544) 10.95
Canceled (3,779) 14.51
Outstanding at end of year 43,964 $14.31
Options exercisable at end of year 20,060 $12.77
2003 Outstanding at beginning of year 43,964 $14.31
Granted 6,517 12.94
Exercised (4,206) 9.77
Canceled (2,806) 17.11
Outstanding at end of year 43,469 $14.36
Options exercisable at end of year 23,717 $13.40
2004 Outstanding at beginning of year 43,469 $14.36
Granted 6,470 19.13
Exercised (13,735) 13.31
Canceled (2,942) 16.05
Adjustment for special dividend 1,822 n/a
Outstanding at end of year 35,084 $14.78
Options exercisable at end of year 17,529 $13.58
Approximately 595,000, 869,000 and 559,000 restricted Limited Brands shares were granted in 2004, 2003 and 2002, with market values
at date of grant of $12 million in 2004, $12 million in 2003 and $10 million in 2002. Restricted shares generally vest over a period of three
to six years.
RETIREMENT BENEFITS
The Company sponsors a defined contribution retirement plan and a supplemental retirement plan.
Participation in the defined contribution plan is available to all associates who have completed 1,000 or more hours of service with the
Company during a 12-month period and who have attained the age of 21. This plan is a qualified plan and the Company contributes
amounts based on a percentage of the associates’ eligible annual compensation, which vest based on the associates’ years of service.
The plan also permits associates to contribute amounts to individual accounts up to the maximum amount allowable under the Internal
Revenue Code. The Company matches associate contributions based on a predetermined formula and are 100% vested at all times.
Total expense recognized related to this plan was $44 million in 2004, $42 million in 2003 and $45 million in 2002.
12
0490_Fin5 3/30/05 09:26 AM Page 65

Participation in the supplemental retirement plan is subject to service, job level and compensation requirements. This plan is an unfunded,
non-qualified plan and the Company contributes amounts based on a percentage of the associates’ eligible compensation. This plan permits
highly-compensated associates to defer a portion of their salaries beyond the Internal Revenue Code limits for the defined contribution
plan. The Company matches associate contributions according to a predetermined formula up to a maximum amount. Associates may elect
to defer additional, unmatched portions of their salaries, subject to limitations. Associate accounts are credited with interest using a rate
determined annually based on an evaluation of the 10-year and 30-year borrowing rates available to the Company. Associate contributions
and the related interest vest immediately. Company contributions and the related interest are subject to vesting based on the associates’
years of service. Unmatched associate contributions and the related interest can be distributed from the plan at any time through an
in-service withdrawal. The remaining vested balance can only be paid upon termination of employment in either a lump sum or in equal
annual installments over a 10-year period.
The annual activity for this plan and the Company’s year-end liability, which is included in other long-term liabilities, were as follows:
Total expense recognized related to this plan was $23 million during 2004, $22 million during 2003 and $22 million during 2002.
FAIR VALUE OF FINANCIAL INSTRUMENTS AND CONCENTRATION OF CREDIT RISK
FAIR VALUE OF FINANCIAL INSTRUMENTS
The carrying value of cash equivalents, accounts receivable, accounts payable and accrued expenses approximates fair value because of
their short maturity. The fair value of long-term debt is estimated based on the quoted market prices for the same or similar issues. The
estimated fair value of the Company’s long-term debt at January 29, 2005 and January 31, 2004 was $1.7 billion and $709 million compared
to the carrying value of $1.6 billion and $648 million, respectively.
CONCENTRATION OF CREDIT RISK
The Company maintains cash and equivalents with various major financial institutions, as well as corporate commercial paper. The
Company monitors the relative credit standing of these financial institutions and other entities and limits the amount of credit exposure with
any one entity. The Company also monitors the creditworthiness of the entities to which it grants credit terms in the normal course of business.
RETIREMENT BENEFITS (millions) 2004 2003
Balance at beginning of year $137 $111
Contributions:
Associate 16 11
Company 17 15
Interest 8 8
Distributions (31) (7)
Forfeitures (2) (1)
Balance at end of year $145 $137
13
66 Limited Brands 2004 Annual Report
NOTES TO CONSOLIDATED FINANCIAL STATEMENTS
0490_Fin5 3/30/05 09:26 AM Page 66

67
SEGMENT INFORMATION
The Company has three reportable segments: Victoria’s Secret, Bath & Body Works and Apparel.
The Victoria’s Secret segment derives its revenues from sales of women’s intimate and other apparel, personal care and beauty products,
and accessories marketed under the Victoria’s Secret brand name. Victoria’s Secret merchandise is sold through its stores and direct
response (catalogue and e-commerce) businesses. The Bath & Body Works segment derives its revenues from the sale of personal care
products and accessories and home fragrance products marketed under the Bath & Body Works and White Barn Candle Company brand
names as well as from sales of third-party brands. The Apparel segment derives its revenues from sales of women’s and men’s apparel
through Express and Limited Stores.
The Company’s segment information as of and for the years ended January 29, 2005, January 31, 2004 and February 1, 2003 was as follows:
SUBSEQUENT EVENT
On February 24, 2005, the Board of Directors of the Company authorized the repurchase of an additional $100 million of the Company’s
common stock. Through March 23, 2005, 1.1 million shares have been repurchased under this program for $26.8 million, at an average
price of $24.33 per share.
SEGMENT INFORMATION (millions) VICTORIA’S BATH & BODY APPAREL ■ OTHER TOTAL
SECRET WORKS
2004 Net sales $4,232 $2,169 $2,490 $517 $9,408
Depreciation and amortization 102 73 80 78 333
Operating income 799 400 16 (188) 1,027
Total assets 2,140 1,487 666 1,796 6,089
Capital expenditures 192 64 125 50 431
2003 Net sales $3,817 $1,934 $2,697 $486 $8,934
Depreciation and amortization 75 68 68 77 288
Operating income 711 355 91 (194) 963
Total assets 2,018 1,404 665 3,793 7,880
Capital expenditures 108 30 102 53 293
2002 Net sales $3,586 $1,781 $2,711 $367 ▲ $8,445
Depreciation and amortization 75 65 52 84 276
Operating income 614 300 115 ★ (191) ▲ 838
Total assets 1,991 1,477 685 3,093 7,246
Capital expenditures 117 39 89 61 306
■
Includes Corporate (including non-core real estate
and equity investments), Mast, Henri Bendel and New
York & Company (through November 27, 2002).
▲
As a result of its sale on November 27, 2002,
New York & Company’s results have been reflected in
discontinued operations and are excluded from net
sales and operating income in 2002.
★
Includes a $34 million special non-cash charge for
the exchange of vested stock awards related to the
IBI recombination.
14
15
0490_Fin5 3/30/05 09:26 AM Page 67

16 QUARTERLY FINANCIAL DATA (UNAUDITED)
Summarized quarterly financial data for 2004 and 2003 was as follows:
QUARTERLY FINANCIAL DATA (millions except per share amounts)
2004 QUARTERS ▲ FIRST ● SECOND + THIRD ◆ FOURTH
Net sales $1,978 $2,211 $1,891 $3,328
Gross income 676 798 614 1,290
Net income 97 148 78 382
Net income per share: ■
Basic $0.19 $0.31 $0.17 $0.89
Diluted 0.19 0.31 0.16 0.87
2003 QUARTERS ★ FIRST SECOND ★ THIRD FOURTH
Net sales $1,842 $2,014 $1,847 $3,231
Gross income 612 702 595 1,342
Net income 98 102 130 387
Net income per share: ■
Basic $0.19 $0.20 $0.25 $0.75
Diluted 0.19 0.19 0.25 0.74
■
Due to changes in stock prices during the year and
timing of issuances and repurchases of shares, the
cumulative total of quarterly net income per share
amounts may not equal the net income per share for
the year.
▲
Includes a $45 million pretax, non-operating gain
resulting from the early collection of a long-term note
receivable and the sale of New York & Company
warrants held by the Company.
●
Includes an $18 million pretax, non-operating gain
resulting from the sale of the Company’s remaining
ownership interest in Galyan’s.
+Includes a $45 million pretax, non-operating gain
resulting from the initial public offering of New York
& Company.
◆
Includes a $61 million pretax non-cash charge to
correct the Company’s accounting for straight-line rent
and the depreciation and amortization of leasehold
improvements and certain landlord allowances.
★
Includes pretax non-operating gains of $80 million and
$128 million in the first quarter and the third quarter,
respectively, related to the sale of the Company’s entire
ownership interest in ADS.
68 Limited Brands 2004 Annual Report
NOTES TO CONSOLIDATED FINANCIAL STATEMENTS
0490_Fin5 3/30/05 09:26 AM Page 68
69
Management is responsible for establishing and maintaining adequate internal control over financial reporting as defined in Rules 13a-15(f)
and 15d-15(f) under the Securities Exchange Act of 1934. The Company’s internal control system is designed to provide reasonable
assurance to the Company's management and Board of Directors regarding the preparation and fair presentation of published financial
statements. Because of its inherent limitations, internal control over financial reporting may not prevent or detect misstatements. Therefore,
even those systems determined to be effective can provide only reasonable assurance with respect to financial statement preparation
and presentation. Also, projections of any evaluation of effectiveness to future periods are subject to the risk that controls may become
inadequate because of changes in conditions, or that the degree of compliance with the policies or procedures may deteriorate.
Management assessed the effectiveness of the Company’s internal control over financial reporting as of January 29, 2005. In making this
assessment, management used the criteria established in Internal Control-Integrated Framework issued by the Committee of Sponsoring
Organizations of the Treadway Commission (the COSO criteria).
Based on our assessment and the COSO criteria, management believes that the Company maintained effective internal control over
financial reporting as of January 29, 2005.
The Company’s independent registered public accounting firm, Ernst & Young LLP, has issued an attestation report on management’s
assessment of the Company’s internal control over financial reporting. Ernst & Young LLP’s report appears on the following page
and expresses unqualified opinions on management’s assessment and on the effectiveness of the Company’s internal control over
financial reporting.
MANAGEMENT’S REPORT ON INTERNAL CONTROL OVER FINANCIAL REPORTING
0490_Fin5 3/30/05 09:26 AM Page 69
REPORTS OF INDEPENDENT REGISTERED PUBLIC ACCOUNTING FIRMTO THE BOARD OF DIRECTORS AND SHAREHOLDERS OF LIMITED BRANDS, INC.:
We have audited management’s assessment, included in the accompanying Management’s Report on Internal Control Over Financial
Reporting that Limited Brands, Inc. maintained effective internal control over financial reporting as of January 29, 2005, based on criteria
established in Internal Control—Integrated Framework issued by the Committee of Sponsoring Organizations of the Treadway Commission
(the COSO criteria). Limited Brands, Inc.’s management is responsible for maintaining effective internal control over financial reporting
and for its assessment of the effectiveness of internal control over financial reporting. Our responsibility is to express an opinion on
management’s assessment and an opinion on the effectiveness of the Company’s internal control over financial reporting based on our audit.
We conducted our audit in accordance with the standards of the Public Company Accounting Oversight Board (United States). Those
standards require that we plan and perform the audit to obtain reasonable assurance about whether effective internal control over financial
reporting was maintained in all material respects. Our audit included obtaining an understanding of internal control over financial reporting,
evaluating management’s assessment, testing and evaluating the design and operating effectiveness of internal control, and performing
such other procedures as we considered necessary in the circumstances. We believe that our audit provides a reasonable basis for
our opinion.
A company’s internal control over financial reporting is a process designed to provide reasonable assurance regarding the reliability of
financial reporting and the preparation of financial statements for external purposes in accordance with generally accepted accounting
principles. A company’s internal control over financial reporting includes those policies and procedures that (1) pertain to the maintenance
of records that, in reasonable detail, accurately and fairly reflect the transactions and dispositions of the assets of the company; (2) provide
reasonable assurance that transactions are recorded as necessary to permit preparation of financial statements in accordance with generally
accepted accounting principles, and that receipts and expenditures of the company are being made only in accordance with authorizations
of management and directors of the company; and (3) provide reasonable assurance regarding prevention or timely detection of unauthorized
acquisition, use, or disposition of the company’s assets that could have a material effect on the financial statements.
Because of its inherent limitations, internal control over financial reporting may not prevent or detect misstatements. Also, projections
of any evaluation of effectiveness to future periods are subject to the risk that controls may become inadequate because of changes in
conditions, or that the degree of compliance with the policies or procedures may deteriorate.
In our opinion, management’s assessment that Limited Brands, Inc. maintained effective internal control over financial reporting as
of January 29, 2005, is fairly stated, in all material respects, based on the COSO criteria. Also, in our opinion, Limited Brands, Inc.
maintained, in all material respects, effective internal control over financial reporting as of January 29, 2005, based on the COSO criteria.
We also have audited, in accordance with the standards of the Public Company Accounting Oversight Board (United States), the
Consolidated Balance Sheets of Limited Brands, Inc. as of January 29, 2005 and January 31, 2004, and the related Consolidated
Statements of Income, Shareholders’ Equity, and Cash Flows for the years then ended and our report dated March 23, 2005 expressed
an unqualified opinion thereon.
Columbus, Ohio
March 23, 2005
70 Limited Brands 2004 Annual Report
0490_Fin5 3/30/05 09:26 AM Page 70

71
TO THE BOARD OF DIRECTORS AND SHAREHOLDERS OF LIMITED BRANDS, INC.:
We have audited the accompanying Consolidated Balance Sheets of Limited Brands, Inc. and subsidiaries as of January 29, 2005 and
January 31, 2004, and the related Consolidated Statements of Income, Shareholders’ Equity, and Cash Flows for the years then ended.
These financial statements are the responsibility of the Company’s management. Our responsibility is to express an opinion on these
financial statements based on our audits. The Consolidated Financial Statements of Limited Brands, Inc. and subsidiaries for the year
ended February 1, 2003, were audited by other auditors whose report dated February 27, 2003, expressed an unqualified opinion on
those statements and included an explanatory paragraph that disclosed the change in the Company’s method of accounting for
discontinued operations.
We conducted our audits in accordance with the standards of the Public Company Accounting Oversight Board (United States). Those
standards require that we plan and perform the audit to obtain reasonable assurance about whether the financial statements are free of
material misstatement. An audit includes examining, on a test basis, evidence supporting the amounts and disclosures in the financial
statements. An audit also includes assessing the accounting principles used and significant estimates made by management, as well as
evaluating the overall financial statement presentation. We believe that our audits provide a reasonable basis for our opinion.
In our opinion, the fiscal year 2004 and 2003 consolidated financial statements referred to above present fairly, in all material respects,
the consolidated financial position of Limited Brands, Inc. and subsidiaries at January 29, 2005 and January 31, 2004, and the consolidated
results of their operations and their cash flows for the years then ended in conformity with U.S. generally accepted accounting principles.
We also have audited, in accordance with the standards of the Public Company Accounting Oversight Board (United States), the
effectiveness of Limited Brands, Inc.’s internal control over financial reporting as of January 29, 2005, based on criteria established in
Internal Control—Integrated Framework issued by the Committee of Sponsoring Organizations of the Treadway Commission and our
report dated March 23, 2005 expressed an unqualified opinion thereon.
Columbus, Ohio
March 23, 2005
0490_Fin5 3/30/05 09:26 AM Page 71

MARKET PRICE AND DIVIDEND INFORMATION The Company’s common stock is traded on the New York Stock Exchange (NYSE: LTD). On January 29, 2005, there were approximately
74,000 shareholders of record. However, when including active associates who participate in the Company’s stock purchase plan,
associates who own shares through Company-sponsored retirement plans and others holding shares in broker accounts under street
names, the Company estimates the shareholder base to be approximately 210,000.
The Company’s quarterly market prices and cash dividends per share for 2004 and 2003 were as follows:
MARKET PRICES & CASH DIVIDENDS PER SHARE
FISCAL YEAR 2004 MARKET PRICE MARKET PRICE CASH DIVIDENDHIGH LOW PER SHARE
Fourth quarter $27.89 $22.03 ■ $1.35
Third quarter 24.80 18.65 0.12
Second quarter 21.04 18.34 0.12
First quarter 21.65 18.21 0.12
FISCAL YEAR 2003
Fourth quarter $18.55 $16.68 $0.10
Third quarter 17.83 14.82 0.10
Second quarter 17.30 13.00 0.10
First quarter 14.88 10.88 0.10
■
Includes a special dividend of $1.23 per share.
72 Limited Brands 2004 Annual Report
0490_Fin5 3/30/05 09:26 AM Page 72

73
BOARD OF DIRECTORS
Leslie H. Wexner Chairman and Chief Executive Officer Columbus, Ohio
Limited Brands, Inc.
Leonard A. Schlesinger Vice Chairman and Chief Operating Officer Columbus, Ohio
Limited Brands, Inc.
V. Ann Hailey Executive Vice President and Columbus, Ohio
Chief Financial Officer
Limited Brands, Inc.
Eugene M. Freedman + • Investor and Consultant Natick, Massachusetts
E. Gordon Gee ■ Chancellor Nashville, Tennessee
Vanderbilt University
James L. Heskett ■ ▲ Baker Foundation Professor Boston, Massachusetts
Graduate School of Business Administration
Harvard University
Donna A. James + President / Strategic Investments Columbus, Ohio
Nationwide
David T. Kollat Chairman Westerville, Ohio
22, Inc.
William R. Loomis, Jr. Investor Santa Barbara, California
Donald B. Shackelford + ■ • ▲ Chairman of the Board Columbus, Ohio
Fifth Third Bank, Central Ohio
Allan R. Tessler + • ▲ Chairman of the Board Wilson, Wyoming
Epoch Investment Partners, Inc.
Abigail S. Wexner • Attorney at Law Columbus, Ohio
Raymond Zimmerman + • Chairman and Chief Executive Officer Boca Raton, Florida
99¢ Stuff, LLC
+Member of the Audit
Committee
■
Member of the
Compensation Committee
•Member of the Finance
Committee
▲
Member of the
Nominating and
Governance Committee
EXECUTIVE OFFICERS
Leslie H. Wexner Chairman and Chief Executive Officer
Group President / Lingerie
Leonard A. Schlesinger Vice Chairman and Chief Operating Officer
Group President / Beauty and Personal Care
Martyn R. Redgrave Executive Vice President and Chief Administrative Officer
V. Ann Hailey Executive Vice President and Chief Financial Officer
Jay Margolis Group President / Apparel
Sandra West Executive Vice President / Human Resources
OFFICERS AND BOARD OF DIRECTORS
0490_Fin5 3/30/05 09:26 AM Page 73

COMPANY INFORMATIONHEADQUARTERS Limited Brands, Inc. 614.415.7000
Three Limited Parkway www.LimitedBrands.com
Columbus, Ohio 43230
ANNUAL MEETING The Annual Meeting of Shareholders Three Limited Parkway
is scheduled for: Columbus, Ohio 43230
9:00 A.M., Monday, May 16, 2005
STOCK EXCHANGE LISTINGS New York Stock Exchange
Trading Symbol “LTD”
INDEPENDENT REGISTERED Ernst & Young LLP
PUBLIC ACCOUNTING FIRM Columbus, Ohio
OVERSEAS OFFICES Colombo Jakarta Mexico City Taipei
Guatemala City Karmiel Milan
Ho Chi Minh City London Seoul
Hong Kong Manila Shanghai
FORM 10-K AND A copy of the Company’s 2004 For information please call:
INFORMATION REQUESTS Form 10-K is available without charge 614.415.6400
at www.LimitedBrands.com, or upon
written request to:
Limited Brands, Inc.
Investor Relations
Three Limited Parkway
Columbus, Ohio 43230
STOCK TRANSFER AGENT, Wachovia Bank, N.A. 800.829.8432
REGISTRAR AND DIVIDEND AGENT 1525 West W.T. Harris Blvd., 3C3
Charlotte, North Carolina 28288
LIMITED BRANDS, INC. As of January 29, 2005: Founded 1963
Number of associates: 115,300 © 2005 Limited Brands, Inc.
Approximate shareholder base: 210,000
74 Limited Brands 2004 Annual Report
0490_Fin5 3/30/05 09:26 AM Page 74

75
ANTICIPATED MONTHLY SALES AND QUARTERLY EARNINGS DATES FOR 2005
February sales 3/3/05 August sales 9/1/05 1st Quarter Earnings 5/16/05
March sales 4/7/05 September sales 10/6/05 2nd Quarter Earnings 8/18/05
April sales 5/5/05 October sales 11/3/05 3rd Quarter Earnings 11/17/05
May sales 6/2/05 November sales 12/1/05 4th Quarter Earnings 2/23/06
June sales 7/7/05 December sales 1/5/06
July sales 8/4/05 January sales 2/2/06
Live webcasts of the quarterly earnings conference calls can be accessed through our website, www.LimitedBrands.com
Audio replays of both monthly sales and quarterly earnings conference calls can be accessed through our website,
www.LimitedBrands.com, or by dialing 800.337.6551 followed by the conference call passcode, LTD (or 583).
Our Chief Executive Officer and Chief Financial Officer have filed the certifications required by Section 302 of the Sarbanes-Oxley
Act of 2002 with the Securities and Exchange Commission as exhibits to our Form 10-K for the fiscal year ended January 29, 2005.
In addition, our Chief Executive Officer filed a separate annual certification with the New York Stock Exchange following our annual
shareholders’ meeting on May 17, 2004.
Environmentally responsible paper was used in the production of this annual report.
ANNUAL REPORT CONTRIBUTORS
Design Integrate Inc. in partnership with Limited Brands, Inc./Brand and Creative Services
www.integrateinc.com
Photography Walter Chin Stewart Shining Max Vadukul Steve Webster
Phil Poynter Will Shively
Illustration Mats Gustafson
Printing ColorDynamicswww.colordynamics.com
0490_Fin5 3/30/05 09:26 AM Page 75