LIMA GLOBAL LICENSING INDUSTRY SURVEY 2015 · PDF filecompanies subject matter expertise in...
25
www.licensing.org Commissioned by LIMA GLOBAL LICENSING INDUSTRY SURVEY 2015 REPORT Prepared by Brandar Consulting LLC
Transcript of LIMA GLOBAL LICENSING INDUSTRY SURVEY 2015 · PDF filecompanies subject matter expertise in...

www.licensing.org
Commissioned by
LIMA GLOBALLICENSING INDUSTRY SURVEY
2015 REPORTPrepared by Brandar Consulting LLC

Table of ConTenTs
From the LImA PresIdent ....................................................................................3
BACKGroUnd & stUdY sCoPe.............................................................................3
eXeCUtIVe sUmmArY ................................................................................................4
LICensInG trends ....................................................................................................6
ConCLUsIons .............................................................................................................9
stUdY methodoLoGY .............................................................................................9
CAteGorY deFInItIons .........................................................................................10
LICensInG reVenUe tABLes ...............................................................................12
APPendIX Product Category trends: A Brandar Analysis ...................................17
ABoUt LImA .................................................................................................................24

LIMa GLoBaL LICensInG InDUsTRY sURVeY 2015 RePoRT 3
fRoM The LIMa PResIDenTdear Licensing Colleague:
LImA is proud to present its first-ever detailed study of the global licensing industry to you. one of LImA’s main goals is to provide reliable fact-based statistical data to help licensing professionals successfully plan for the future. Accordingly, we feel this study will provide you with an excellent and relevant tool on which to base your future marketing plans.
this finished product is the result of months of preparation, collaboration, planning, surveying, collating and interpreting, conducted on LImA’s behalf by Brandar Consulting LLC. We selected Brandar based upon its long-standing expertise in the licensing business and in conducting high quality research. Brandar is an 8-year old consulting firm committed to providing companies subject matter expertise in the areas of Brand Licensing, market research, market Analysis, Brand extension and Business strategy. the firm specializes in helping organizations start or proactively expand Brand/trademark licensing programs. the key components in its suite of services are conducting brand equity & category extension research, in-licensing brand identification research, product market analysis, modeling brand royalty potential and conducting factor analysis to set priorities for Licensing Plans.
the survey process included an extensive online questionnaire in six languages, several hundred phone calls to key licensors and agents within all the different property categories, and the examination of a wide variety of publicly-available financial data, import figures and other source material.
As the authoritative voice of the worldwide licensing industry, LImA understands that knowledge and accurate information are the keys to success in this complex, diverse and competitive business. this definitive study is one of the many services provided by LImA to the worldwide licensing community.
For more information on LImA programs and activities, please visit us at www.licensing.org. For those of you who participated, we offer you our sincere thanks.
Best regards,
Charles m. riottoPresident, LImA
BaCKGRoUnD & sTUDY sCoPeIn early 2015, LImA contracted with Brandar Consulting, LLC to complete the challenging task of accurately sizing the global Licensing market. this inaugural analysis is a bottom-up model that sizes the worldwide licensing industry by property type and product category.
the data in this report was derived from a combination of responses to our own market research survey, which was fielded in April, 2015, and recent publicly reported industry data. some 325 companies responded to our survey: 110 licensors, 125 licensees and 90 agents/consultants. the survey was fielded on-line in 6 different languages and supplemented with in-language phone interviews that resulted in reported revenues representing all major geographic regions. In all, our analysis includes specific data from 490 companies spanning the globe in the licensing industry. on top of a regional view, our report also highlights Licensed Product retail revenue and royalty data from the top 50 countries worldwide.

LIMa GLoBaL LICensInG InDUsTRY sURVeY 2015 RePoRT 4
eXeCUTIVe sUMMaRYGlobal retail sales of licensed merchandise and services in 2014 reached $241.5B, generating $13.4B in royalty revenue for the owners of the trademarks.
the top licensing property type in our worldwide study is Character & entertainment coming in with a 44.4% share of the licensed retail market with disney’s properties being a key share driver in this category. the Corporate trademarks property segment also turned out to be very sizable at 22.4% of total retail revenues. Fashion was the next largest licensed property type at 12.7% of the market, while sports Properties registered at a 9.7% share. [see Chart A below.]
on the product side of our analysis, Apparel (16.2%), toys (13.5%) and Accessories (11.6%) were the clear leading retail revenue share categories of licensed products. the size of the home décor/domestics Category which was driven by the success of some large direct to retail licensing programs was a very healthy 7.2% of the market and we expect this category to grow in future years. [see Chart B on page 5.]
on a regional basis, north America is the dominant market for licensed goods, accounting for 58% of global retail sales, followed by northern europe (13.3%) and northern Asia (7.9%). [see Chart C on page 5.]
$107,185
$54,109
$30,784
$23,398
$12,876
$4,625 $3,359
$2,360 $1,761 $1,080 Entertain/Characters
Corporate/BrandFashionSportsPublishingCollegiateCelebrityMusicArtNon- Profit
(in millions US$)
Global Retail Sales of Licensed Merchandise, By Property Type, 2014
Chart A

LIMa GLoBaL LICensInG InDUsTRY sURVeY 2015 RePoRT 5
$39,049
$32,511
$27,944
$17,489 $15,095
$14,843
$10,699
$9,667
$8,568
$8,555
$8,525
$8,404
$7,925 $6,846
$6,282
$4,039 $3,780
$11,314
Apparel
Toys
Accessories- Fashion
Home Décor
Software/ Video games/apps
Food and Beverage
CE
Health and Beauty
Sports
Publishing
Footwear
Gifts
Paper Products
Music/Video
Housewares
Infant
Promotions
Other(in millions US$)
Global Retail Sales of Licensed Merchandise, By Product Category, 2014
$140,107
$32,231
$18,968
$15,531
$10,414
$9,633 $8,330 $5,420 $903
Global Retail Sales of Licensed Merchandise, By Region, 2014
N. America (58%)Northern Europe (13.3%)N Asia (7.9%)Southern Europe (6.4%)LATAM (4.3%)SEA/PAC (4.0%)Eastern Europe (3.4%)ME/Africa (2.2%)ROW (0.4%)
(in millions US$)
$140,107
$32,231
$18,968
$15,531
$10,414
$9,633 $8,330 $5,420 $903
Global Retail Sales of Licensed Merchandise, By Region, 2014
N. America (58%)Northern Europe (13.3%)N Asia (7.9%)Southern Europe (6.4%)LATAM (4.3%)SEA/PAC (4.0%)Eastern Europe (3.4%)ME/Africa (2.2%)ROW (0.4%)
(in millions US$)
Chart B
Chart C

LIMa GLoBaL LICensInG InDUsTRY sURVeY 2015 RePoRT 6
LICensInG TRenDsone of the most encouraging signs we saw in our study was the strong year over year growth in licensed product sales reported by survey respondents. since this was the first-ever LImA Global sizing study, we asked respondents to compare their 2014 licensed product sales with those they generated in 2013. here are their aggregate responses, broken down by region:
Country % chg. ’13 to ’14
Us/Canada 14.74%LAtAm 11.20%europe 6.51%n Asia 17.75%seA/PAC 10.49%me/Africa 21.45%total 15.00%
the greatest licensing sales growth was reported in developing regions of north Asia and me/Africa, while the slowest growth occurred in europe as the region slowly recovers from its recession.
We also asked respondents to let us know what percentage of their sales of licensed products occurred via brick & mortar retail vs. e-commerce. not surprisingly, responses showed continuing rapid growth in on-line sales. on-line sales in China, as a result of developing broadband connections throughout the country and the strength of Alibaba, account for 33% of retail sales of licensed goods, the highest in the world by a wide margin. China could be a microcosm as to how the rest of the developing world could quickly adopt e-commerce platforms over traditional brick & mortar retail product distribution models because of the efficiency advantages of the e-distribution model. We have seen indications in our research that India could be following China along this path.
Country Brick & mortar on-line
Us/Canada 74.3% 25.7%LAtAm 82.5% 17.5%europe 80.3% 19.7%n Asia 83.6% 16.4%seA/PAC 92.6% 7.4%me/Africa 92.5% 7.5%total 83.6% 16.4%
one major insight emerging from our analysis is that digital technology is clearly changing the way in which consumers play and entertain themselves. Certain licensed products are now predominantly purchased and distributed through electronic means and are starting to become a much more significant share of the overall licensed product market, with the tablet and smart phone even changing the way that kids are watching entertainment programming. the combining of disney’s consumer and interactive products divisions underscores the blurring of the lines of children’s entertainment and play. the Video Games/software/Apps, Publishing and music/Video categories, distributed mostly digitally now, taken together now compromise over 12% of licensed product share.
Interestingly, as these digital segments continue to grow, they are making licensed products much more accessible to the rest of the world due to their ease of distribution in broadband connected countries. As a result of this phenomenon, north America’s share (58.0%) of licensed product sales in our study came in lower than many have previously thought, with additional share being spread to places like europe (23.1%), Latin America (4.3%) and the middle east/Africa (2.2%). Furthermore, we anticipate share in the Asia Pac region (11.9%), given its huge population, will accelerate significantly over time as these countries continue to develop economically and broadband connections become more widespread. We believe increased broadband connectivity will allow not only for more digital consumption, but also more on-line ordering of licensed products from websites like Alibaba and Amazon’s international sites.
one important question we asked respondents to the survey was to let us know about licensing industry trends, both for the industry in general as well as for their own companies.

LIMa GLoBaL LICensInG InDUsTRY sURVeY 2015 RePoRT 7
General Industry Trends
• While many cited the overwhelming success of disney’s licensing of Frozen, it was viewed as both a blessing and a curse. on the positive side it “brought the understanding back to retailers that they can sell a character license throughout the store”. on the negative side for some, Frozen was viewed as “freezing out” other attractive licenses as retailers were too overwhelming in their support of the property at the expense of placing other licensed goods on the shelf.
• once a licensing flagship category, Pre-school licensing properties appear to be making a comeback as many respondents cited the re-emergence of this sector as an exciting trend with mattel being mentioned as the major presence in the category.
• Food & Beverage Category brand licensing continues to be strong and many respondents spoke of – in the words of one – a “strong move toward better-for-you and organic brands.”
• It continues to get harder to get high minimum guarantees or advances as licensees want licensing to be “a shared risk busi-ness proposition” with the Licensor.
• Licensees are expecting the Licensor to provide additional resources to sell licensed products into retail and then to support the branded products once they are on-shelf. many stated that licensed brands need to be supported and promoted at retail by the licensor as much as by the licensee. “there simply needs to be more involvement from Licensors and brand owners to make licensed brands relevant for retailers.”
• there continues to be strong interest from private equity or venture backed management firms in the acquisition of trademarks with strong equity that may have gone dormant or fallen on hard times.
• oversaturation of entertainment and Celebrity properties was mentioned as a negative trend minimizing available shelf space for all. one respondent coined this sheer “brand fatigue”.
• major concerns were voiced by licensees about the lack of licensors policing unofficial products being sold on-line.
• respondents also talked about piracy of licensed goods being a “big” problem and “raging” in the Asia region, which certainly poses a significant risk to brand owners.
• As the U.s. licensing market gets increasingly saturated, there is more of an emphasis on globalization as the key to future licensing growth. A number of respondents mentioned an uplift in licensing sales in europe as the economy improves there. still others talked about concentrating on growing India and China as new licensing markets. But some spoke of unfavorable foreign exchange rates and social and political strife as being gating factors mitigating international growth right now.
• some respondents cited the difficulty of growing the licensing business in south America because a number of countries do not allow in-country licensees or distributors of licensed products to pay royalties outside their country.
• mass market price deflation is forcing the need to add more value into the licensed product feature set for the same price as generics to gain a point of difference. Brand licensing also was cited as a point of difference that can hold pricing steady.
• more large brand owners are seeking out boutique licensing agencies because they feel they can get better focus and more dedicated resources from a smaller agent.
• the classic video game market has fallen off significantly around the world with the decline in sales of game consoles with many hoping newer consoles will help turn this tide.

LIMa GLoBaL LICensInG InDUsTRY sURVeY 2015 RePoRT 8
Distribution Trends
We also asked respondents to comment on the distribution trends for the industry at large, and for their own companies:
• the rapid growth in on-line sales over brick and mortar sales was an overwhelming trend here and reinforced by the numbers we reported above. one respondent mentioned part of what is feeding the trend is that “consumers are now more confident buying on-line that which they bought in stores in the past.”
• some spoke of the difficulties that come along with e-commerce, such as the challenge of conveying the quality of their prod-uct when it is only viewed on the web. Licensors also spoke of whether they should allow their licensees to control the on-line experience through several different websites or if it is better for the brand owner to centralize and standardize the direct on-line buying experience into one website they control.
• not a lot of sales happen on brand-owner-operated sites as most prefer to shop general websites like Amazon, but the licens-ee’s website is still viewed as one of the best sources of on-line research prior to purchase.
• the importance of incorporating younger generations of marketing professionals into your on-line marketing team was dis-cussed by some as they are more attune to social networking and the on-line Pr management issues (e-Pr).
• some respondents cited that on-line retailers internationally are asking for “huge amounts of listing and registration money.”
• Concerns were voiced that smaller and independent retailers are continuing to contract their store locations – another trend making it difficult for newer licensed brands to make it to the shelf. Less shelf space to manage is making these retailers less willing to carry licensed products than their larger competitors.
• more new licensed properties are willing to do direct-to-retail (dtr) deals just to get their licensing programs off the ground.
• And “more retailers are looking for dtr licensing opportunities, but are not necessarily equipped to manage the process.” so licensors need to go into these opportunities mindful that they will need to assist their partners in process management and quality control.
• some spoke of the constant change in buyers at retailers and therefore needing buy-in from top level management to ensure licensed programs get continuing retailer support even if buyers change. others viewed this as a favorable trend, causing more senior managers at retailers to approve multiple product lines for one brand at the same time.
• Pursuing a multi-channel approach and selling to the consumer via whatever channel or combination of channels that they wish to engage in is becoming vital to competing and even gaining an advantage on your competition.
• e-commerce growth in China and India was cited as a significant opportunity/challenge – as licensees have to engage with an entirely different set of e-retailers in those regions. Both countries have really embraced on-line retail as “retailers find it easier to list and sell on-line” vs. building out a brick and mortar infrastructure in those countries.
• some respondents noted that the “right” licensed product can get better positioning on shelf and get better locations in retail stores than their traditional branded competitors.
• As it gets more and more difficult for new licensed brands to get on-shelf at the major retail chains because of the retailers’ unwillingness to take risks on a property that is not a sure thing, more non-traditional channels are embracing newer licensed brands.
° “Grocery and convenience stores are increasing their assortments. “
° “QVC and hsn saw a big rise in personality brands last year.”
° “on-line retail, both traditional and flash sale sites, continues to grow.”
° “drug stores, such as Walgreens and rite Aid, are elevating their in-store aesthetic experience to be more of a destination for health and beauty products.”
° even off-price stores such as “tJX and ross are improving their perception as a destination for a wide assortment of brands.”
° one Ce Licensee even noted that they have “grown their business recently by successfully branching out from traditional Ce retailers into the Pharmacy and supermarket channels.”
• In an effort to improve margins, many manufacturers are distributing directly to retailers now.

LIMa GLoBaL LICensInG InDUsTRY sURVeY 2015 RePoRT 9
ConCLUsIonsthe worldwide licensing industry is becoming increasingly global with much of the new opportunity outside of the more saturated north American market. economies are finally starting to rebound on a more global basis leading to strong growth trends in the licensing industry. non-traditional retail channels and on-line commerce are and will be key sources of growth going forward. direct-to-retail license agreements continue to be an important mechanism to break into retail because they offer retailers something unique in a declining brick and mortar shelf space environment and enable new brands to gain a foothold into the retail market. As physical shelf space contracts, on-line shelf space is multiplying at a very rapid pace. the impact of digital product distribution is impacting the way we live, consume and entertain ourselves and that is serving to accelerate the globalization of our industry. And finally, on-line e-commerce is turning into the key distribution channel for licensed goods in developing markets as broadband infrastructure is being put in place ahead of traditional brick and mortar retail locations. LImA’s inaugural International Licensing market size study clearly shows in all facets that the $241 Billion licensing industry is alive and well and that’s exciting news for all industry participants.
sTUDY MeThoDoLoGYIn order to meet this year’s objective of estimating global retail licensing revenues and royalties, input from licensors, licensees and agents in all the major countries were needed. therefore, we used a multi-dimensional methodology to assure sufficient input to deliver accurate estimates.
PRIMARY RESEARCH
We first started with an anonymous on-line survey similar to the survey used in the past for the Us/Canada estimates. however, we needed to modify the survey to accommodate revenues from multiple countries and multiple languages. the survey and email invitations were prepared in 6 languages – english, French, Italian, German, spanish, Japanese and Chinese – with each respon-dent having the choice of language of the survey. email and postal invitations to the survey were mailed to members and non-members from LImA’s database. Additionally, press releases were issued with survey links in major industry communications.
to insure the best response rates, sIs International was contracted to conduct telephone interviews of companies in major coun-tries in the language of the respondent’s choice for those who did not have time or desire to complete the on-line survey. the on-line survey was active during the months of march and April 2015 with telephones interviews conducted during April 2015. Between the on-line survey and telephone interviews, data was collected from approximately 325 companies responded to our survey: 110 licensors, 125 licensees and 90 Agents/consultants reporting revenues in 24 countries and all major regions.
SECONDARY RESEARCH
the next step in the research process was to fill in the gaps for major companies in the licensing industry that did not participate in the surveys. top licensing revenue companies (licensors and licensees) were identified and compared to the respondents to the surveys. major companies that did not respond were researched for publicly available licensing data. We used sources that included IBIs World, morningstar, statista, and hoover’s along with company websites, annual reports and Pr releases. In total, 490 companies’ data was collected through both the primary and secondary research methods.
MODELING/MISSING DATA
even with the most thorough research not all information can be obtained in a study of this breadth. to fill in the gaps we used industry, government census and company level data. since this study includes 100% of the Global market we needed to account for countries that did not have directly reported data. In some cases companies only reported data at a regional level so we needed to allocate their revenues to individual countries. Where country level data was not available we used an allocation model that considered several sources including ItC Imports by product category, country level GdP and Global retail revenues by country as well as the results from the 330 participants who answered the survey. A similar model using additional sources was used to allocate high level revenues to Property types and Product Categories where needed. this process allows us to estimate Licensing retail revenue and royalties by product category within each property type by country.
ROYALTY REVENUES
our models concentrated on deriving Licensed retail revenues. this report also includes royalty revenues. When actual roy-alty revenues were not provided, we used a formula to calculate royalties from retail revenues. since royalties are calculated off wholesale revenues, we first used retail gross margins by product category to derive wholesale revenues. We then applied average royalty rates for each product category to derive estimated royalty revenues.

LIMa GLoBaL LICensInG InDUsTRY sURVeY 2015 RePoRT 10
CaTeGoRY DefInITIonsPROPERTY TYPES
ART
Art licensing encompasses everything from individual artists who support their artistic endeavors via licensing to well-established businesses that create art and design specifically to decorate a wide range of products, including prints, home décor, house-wares, textiles, publishing, giftware & apparel.
CELEBRITIES (ENTERTAINMENT/ETC.)
this property includes individuals/groups and the estates of individuals who are primarily well known in the fields of entertainment and other fields such as politics and business.
ENTERTAINMENT/ CHARACTERS
this category of licensing encompasses properties springing primarily from feature films, television shows, videogames and online entertainment. (Characters and franchises that are created via books are also a popular licensing category, but are gener-ally classified as “publishing” properties.)
COLLEGIATE
this property includes College and University logos, names and slogans. Licensing programs usually target alumni with greater variety of merchandise rather than just current college students.
FASHION
the licensing of designer fashion names and brands into such categories as apparel, fashion accessories, health & beauty aids and home goods is one of the best known facets of the business.
MUSIC
Product licensing and merchandising based on musical groups, musicians and their works. (does not include the licensing of music itself for advertising and other commercial purposes.)
NON-PROFIT
Licensing of non-profit organizations such as museums, churches, charity and special interest organizations such as the AsPCA.
SPORTS (LEAGUES/INDIVIDUALS)
this includes:
major sports leagues — i.e. national Football League, major League Baseball, national Basketball Association and the national hockey League – along with nAsCAr. each of those leagues runs the licensing business on behalf of its teams out of a central-ized league office.
smaller professional sports leagues – organizations such as the International olympic Committee and major sports events such as the olympics and FIFA World Cup, as well as athletes.
CORPORATE/BRAND NAME
the licensing of company names, logos, trademarks or brands (i.e. harley-davidson, Coca-Cola).
PUBLISHING
this type of property includes any brand or character that exists in print media (magazines, books, newspaper, etc.). once a pub-lishing property migrates to other media such as movies, tV, apps, video games the property is re-classified under entertainment/Characters Properties.

LIMa GLoBaL LICensInG InDUsTRY sURVeY 2015 RePoRT 11
PRODUCT CATEGORIES
Accessories, Fashion (e.g. small leather goods, jewelry, luggage, bag, purses, belts, hats, etc.)
Apparel (e.g. tops, bottoms, dresses, menswear, outerwear, etc.)
Consumer Electronics (e.g. audio and video equipment, computers and computer accessories, cellphone cases, headphones, etc.)
Food/Beverage (e.g. coffee, yogurt, breakfast cereal, cake mixes, soft drinks, wine & spirits etc.)
Footwear (e.g. slippers, sneakers, children’s shoes, etc.)
Gifts/Collectibles
Health/Beauty Products (e.g. fragrances, skin care, shaving goods, hair care, etc.)
Home Décor (e.g. Furniture/Furnishings, wall hangings, kitchen/bath/bed domestics, wall art, floor coverings, etc.)
Housewares (e.g. small electrics, kitchen accessories, cooking utensils, pots, pans, flatware, glassware etc.)
Infant Products (e.g. layette, diapers, infant apparel, baby care products, strollers etc.)
Music/Video (e.g. dVds, Cds, streams, etc.) *does not refer to the licensing of music itself i.e. for muzak, commercials, etc.
Paper Products/School Supplies (e.g. notebooks, party goods, greeting cards, posters, prints etc.)
Promotions (refers to licensing of a property for the purpose of promoting/advertising a product )
Publishing (e.g. books, comics, magazines, etc.)
Software and Video Games (e.g. apps, console-based games, mobile games, computer games, etc.)
Sporting Goods (e.g. athletic equipment, balls, etc.)
Toys/Games (not software/Video) (e.g. action figures, board games, toy vehicles, dolls etc.)
COUNTRY/REGIONS
REGION COUNTRIES FROM TOP 50 COUNTRIES FROM REST OF WORLD (ROW) (In order of Retail Sales volume)
north America Us and Canada
northern europe Germany, UK, the netherlands, Belgium, switzerland, sweden, norway, Ireland, denmark, Finland
southern europe France, Italy, spain, Austria, turkey, Portugal, Greece
eastern europe russia, Poland, Czech republic, slovakia, Ukraine, hungary, romania, Kazakhstan
Lithuania, Bulgaria, Belarus, Latvia, slovenia, Croatia, estonia, serbia, Bosnia and herzegovina, Georgia, Albania, moldova, macedonia, Armenia, montenegro
LAtAm mexico, Brazil, Chile, Columbia, Peru, Venezuela
Argentina, ecuador, Paraguay, Panama, dominica republic, Costa rica, Guatemala, el salvador, Uruguay, honduras, Jamaica, netherland Antilles, Bolivia, nicaragua, Aruba, Bahamas, trinidad and tobago, Cuba, Barbados, haiti, Bermuda, BVI, Cayman, Antigua and Barbuda, Belize, st Lucia, turk and Caicos, st Kitts, dominica, Grenada, st Vincent and Grenadines, Anguilla
n Asia China, hong Kong, Japan, taiwan north Korea, mongolia
southeast Asia/PAC Australia, new Zealand, south Korea, singapore, Viet nam, India, malaysia, thailand
Indonesia, Philippines, myanmar, Bangladesh, macao, Pakistan, tajikistan, sri Lanka, Kyrgyzstan, nepal, Brunei, new Caledonia, Cambodia, new Guinea, Lao, French Polynesia, Fiji, maldives, Cook Is, marshall Is. samoa, micronesia

LIMa GLoBaL LICensInG InDUsTRY sURVeY 2015 RePoRT 12
LICensInG ReVenUe TaBLes – GLoBaL LICensInG ReTaIL ReVenUesPr
oper
tyTo
tal
Acce
ssor
ies-
Fash
ion
Appa
rel
CEFo
od an
d Be
vera
geFo
otwe
arHe
alth
and
Beau
tyHo
me
Déco
rHo
usew
ares
Infa
ntMu
sic/V
ideo
Softw
are/
Vide
o ga
mes
/apps
Pape
r Pr
oduc
tsPu
blish
ing
Spor
tsTo
ysGi
ftsPr
omot
ions
Othe
r
Art
$ 1,7
61
$ 13
3
$ 19
2
$
21
$ 74
$ 8
$ 15
$ 16
7
$
129
$
21
$ 26
$ 33
$ 28
2
$
101
$ 18
$
195
$ 25
7
$
5
$
85
Celeb
rity $
3,359
$
444
$
696
$ 53
$
299
$ 12
6
$ 30
6
$ 18
3
$
227
$
51
$ 40
$ 80
$ 38
$ 18
1
$
158
$ 17
1
$
125
$ 44
$ 13
8
Enter
tain/C
hara
cters
$ 10
7,185
$ 8,5
07
$ 12,7
57
$ 3,5
15
$
5,541
$ 2,5
42
$
3,029
$
3,206
$ 1,3
15
$ 2,8
47
$
6,034
$
8,987
$
5,221
$ 6,6
32
$ 2,4
72
$
26,91
0
$ 3,8
04
$
2,592
$
1,273
Colle
giate
$ 4,6
25
$ 75
0
$ 85
0
$
2
$
7
$ 16
7
$ 2
$ 25
2
$
665
$
1
$
2
$
417
$ 85
$ 1
$
581
$ 50
6
$
332
$ 1
$ 4
Fash
ion $
30,78
4
$ 9,5
77
$ 8,4
28
$
624
$
177
$ 3,2
90
$
3,715
$
1,564
$ 56
9
$ 48
9
$ 30
$ 19
8
$
461
$ 41
9
$
72
$ 57
3
$
365
$ 10
2
$ 13
3
Music
$ 2,3
60
$ 38
5
$ 1,3
17
$
27
$ 68
$ 10
$
18
$
22
$ 28
$ 8
$ 30
$ 43
$ 29
$ 18
8
$
20
$ 98
$
22
$ 5
$ 43
Non-
Pro
fit $
1,080
$
134
$
167
$ 27
$
58
$
18
$ 77
$ 30
$
37
$
6
$
40
$
47
$
21
$
23
$
35
$ 12
1
$
60
$ 56
$ 12
3
Spor
ts $
23,39
8
$ 2,8
85
$ 6,8
03
$
373
$
212
$ 48
7
$ 54
$ 64
$
367
$
129
$
305
$
3,834
$
959
$ 23
4
$
3,254
$ 1,5
46
$
1,384
$ 18
0
$ 32
5
Corp
orate
/Bra
nd $
54,10
9
$ 4,9
95
$ 7,6
26
$
6,033
$ 8,3
70
$
1,799
$ 2,4
20
$ 1,3
70
$
2,824
$
471
$
335
$
1,427
$
810
$ 75
1
$
1,922
$ 2,3
43
$
2,028
$ 78
2
$ 7,8
04
Publi
shing
$ 12
,876
$
135
$
214
$ 25
$
37
$
77
$ 30
$ 10
,632
$
121
$
17
$ 4
$ 28
$ 20
$ 24
$ 37
$
48
$ 28
$
14
$
1,387
TOTA
L W
W $
241,5
38
$
27,94
4
$ 3
9,049
$ 1
0,699
$
14,84
3
$ 8,5
25
$
9,667
$
17,48
9
$ 6,2
82
$ 4,0
39
$
6,846
$
15,09
5
$ 7,9
25
$
8,555
$
8,568
$ 32
,511
$
8,404
$ 3,7
80
$ 11,3
14
Prop
erty
Tota
l %
Acce
ssor
ies-
Fash
ion
Appa
rel
CEFo
od an
d Be
vera
geFo
otwe
arHe
alth
and
Beau
tyHo
me
Déco
rHo
usew
ares
Infa
ntMu
sic/V
ideo
Softw
are/
Vide
o ga
mes
/apps
Pape
r Pr
oduc
tsPu
blish
ing
Spor
tsTo
ysGi
ftsPr
omot
ions
Othe
r
Art
100.0
%7.5
%10
.9%1.2
%4.2
%0.5
%0.9
%9.5
%7.3
%1.2
%1.5
%1.9
%16
.0%5.7
%1.0
%11
.1%14
.6%0.3
%4.8
%
Celeb
rity10
0.0%
13.2%
20.7%
1.6%
8.9%
3.8%
9.1%
5.4%
6.8%
1.5%
1.2%
2.4%
1.1%
5.4%
4.7%
5.1%
3.7%
1.3%
4.1%
Enter
tain/C
hara
cters
100.0
%7.9
%11
.9%3.3
%5.2
%2.4
%2.8
%3.0
%1.2
%2.7
%5.6
%8.4
%4.9
%6.2
%2.3
%25
.1%3.5
%2.4
%1.2
%
Colle
giate
100.0
%16
.2%18
.4%0.1
%0.2
%3.6
%0.0
%5.4
%14
.4%0.0
%0.0
%9.0
%1.8
%0.0
%12
.6%10
.9%7.2
%0.0
%0.1
%
Fash
ion10
0.0%
31.1%
27.4%
2.0%
0.6%
10.7%
12.1%
5.1%
1.8%
1.6%
0.1%
0.6%
1.5%
1.4%
0.2%
1.9%
1.2%
0.3%
0.4%
Music
100.0
%16
.3%55
.8%1.1
%2.9
%0.4
%0.8
%0.9
%1.2
%0.3
%1.3
%1.8
%1.2
%8.0
%0.8
%4.2
%0.9
%0.2
%1.8
%
Non-
Pro
fit10
0.0%
12.4%
15.4%
2.5%
5.4%
1.7%
7.1%
2.8%
3.4%
0.6%
3.7%
4.3%
1.9%
2.2%
3.3%
11.2%
5.5%
5.2%
11.4%
Spor
ts10
0.0%
12.3%
29.1%
1.6%
0.9%
2.1%
0.2%
0.3%
1.6%
0.5%
1.3%
16.4%
4.1%
1.0%
13.9%
6.6%
5.9%
0.8%
1.4%
Corp
orate
/Bra
nd10
0.0%
9.2%
14.1%
11.1%
15.5%
3.3%
4.5%
2.5%
5.2%
0.9%
0.6%
2.6%
1.5%
1.4%
3.6%
4.3%
3.7%
1.4%
14.4%
Publi
shing
100.0
%1.0
%1.7
%0.2
%0.3
%0.6
%0.2
%82
.6%0.9
%0.1
%0.0
%0.2
%0.2
%0.2
%0.3
%0.4
%0.2
%0.1
%10
.8%
TOTA
L W
W10
0.0%
11.6%
16.2%
4.4%
6.1%
3.5%
4.0%
7.2%
2.6%
1.7%
2.8%
6.2%
3.3%
3.5%
3.5%
13.5%
3.5%
1.6%
4.7%
Prop
erty
Tota
l WW
%Ac
cess
ories
- Fa
shio
n Ap
pare
lCE
Food
and
Beve
rage
Foot
wear
Healt
h an
d Be
auty
Hom
e Dé
cor
Hous
ewar
esIn
fant
Music
/Vid
eoSo
ftwar
e/ Vi
deo
gam
es/ap
psPa
per
Prod
ucts
Publ
ishin
gSp
orts
Toys
Gifts
Prom
otio
nsOt
her
Art
0.7%
0.5%
0.5%
0.2%
0.5%
0.1%
0.2%
1.0%
2.1%
0.5%
0.4%
0.2%
3.6%
1.2%
0.2%
0.6%
3.1%
0.1%
0.8%
Celeb
rity1.4
%1.6
%1.8
%0.5
%2.0
%1.5
%3.2
%1.0
%3.6
%1.3
%0.6
%0.5
%0.5
%2.1
%1.8
%0.5
%1.5
%1.2
%1.2
%
Enter
tain/C
hara
cters
44.4%
30.4%
32.7%
32.8%
37.3%
29.8%
31.3%
18.3%
20.9%
70.5%
88.1%
59.5%
65.9%
77.5%
28.8%
82.8%
45.3%
68.6%
11.2%
Colle
giate
1.9%
2.7%
2.2%
0.0%
0.0%
2.0%
0.0%
1.4%
10.6%
0.0%
0.0%
2.8%
1.1%
0.0%
6.8%
1.6%
4.0%
0.0%
0.0%
Fash
ion12
.7%34
.3%21
.6%5.8
%1.2
%38
.6%38
.4%8.9
%9.1
%12
.1%0.4
%1.3
%5.8
%4.9
%0.8
%1.8
%4.3
%2.7
%1.2
%
Music
1.0%
1.4%
3.4%
0.3%
0.5%
0.1%
0.2%
0.1%
0.4%
0.2%
0.4%
0.3%
0.4%
2.2%
0.2%
0.3%
0.3%
0.1%
0.4%
Non-
Pro
fit0.4
%0.5
%0.4
%0.2
%0.4
%0.2
%0.8
%0.2
%0.6
%0.2
%0.6
%0.3
%0.3
%0.3
%0.4
%0.4
%0.7
%1.5
%1.1
%
Spor
ts9.7
%10
.3%17
.4%3.5
%1.4
%5.7
%0.6
%0.4
%5.8
%3.2
%4.5
%25
.4%12
.1%2.7
%38
.0%4.8
%16
.5%4.8
%2.9
%
Corp
orate
/Bra
nd22
.4%17
.9%19
.5%56
.4%56
.4%21
.1%25
.0%7.8
%45
.0%11
.7%4.9
%9.5
%10
.2%8.8
%22
.4%7.2
%24
.1%20
.7%69
.0%
Publi
shing
5.3%
0.5%
0.5%
0.2%
0.2%
0.9%
0.3%
60.8%
1.9%
0.4%
0.1%
0.2%
0.2%
0.3%
0.4%
0.1%
0.3%
0.4%
12.3%
TOTA
L W
W10
0.0%
100.0
%10
0.0%
100.0
%10
0.0%
100.0
%10
0.0%
100.0
%10
0.0%
100.0
%10
0.0%
100.0
%10
0.0%
100.0
%10
0.0%
100.0
%10
0.0%
100.0
%10
0.0%
Glo
bal R
etai
l Sal
es o
f Lic
ense
d M
erch
andi
se, B
y Pr
oper
ty T
ype
and
Prod
uct C
ateg
ory,
2014
(in
mill
ions
of U
S$)
Glo
bal R
etai
l Sal
es o
f Lic
ense
d M
erch
andi
se, B
y Pr
oduc
t Cat
egor
y, 20
14 (a
s a
perc
enta
ge o
f Pro
pert
y)
Glo
bal R
etai
l Sal
es o
f Lic
ense
d M
erch
andi
se, B
y Pr
oper
ty T
ype,
201
4 (a
s a
perc
enta
ge o
f Pro
duct
Cat
egor
y)

LIMa GLoBaL LICensInG InDUsTRY sURVeY 2015 RePoRT 13
LICensInG ReVenUe TaBLes – GLoBaL LICensInG RoYaLTY ReVenUesPr
oper
tyTo
tal
Acce
ssor
ies-
Fash
ion
Appa
rel
CEFo
od an
d Be
vera
geFo
otwe
arHe
alth
and
Beau
tyHo
me
Déco
rHo
usew
ares
Infa
ntMu
sic/V
ideo
Softw
are/
Vide
o ga
mes
/apps
Pape
r Pr
oduc
tsPu
blish
ing
Spor
tsTo
ysGi
ftsPr
omot
ions
Othe
r
Art
$ 94
$
8
$
12
$
1
$
3
$ 0
$
1
$ 7
$ 7
$ 1
$
1
$
2
$ 16
$ 5
$
1
$ 12
$
13
$ 0
$
4
Celeb
rity $
184
$
26
$ 43
$ 2
$ 11
$ 7
$
17
$
8
$
12
$ 3
$
2
$
5
$ 2
$
10
$
8
$ 10
$
7
$ 3
$
7
Enter
tain/C
hara
cters
$ 6,2
43
$ 51
6
$ 81
6
$ 16
5
$ 21
0
$
139
$ 17
8
$
150
$
69
$ 16
0
$
324
$
589
$ 30
3
$
359
$ 13
4
$
1,701
$ 20
6
$
152
$ 73
Colle
giate
$ 26
4
$ 44
$
52
$
0
$
0
$ 9
$
0
$ 12
$
35
$ 0
$
0
$
27
$
5
$ 0
$
31
$ 31
$
18
$ 0
$
0
Fash
ion $
1,765
$
562
$
517
$
28
$ 6
$
176
$ 21
2
$
72
$ 30
$
27
$ 1
$ 13
$ 26
$ 22
$ 4
$
35
$ 20
$
6
$ 7
Music
$ 13
8
$ 23
$
81
$
1
$
2
$ 1
$
1
$ 1
$ 1
$ 0
$
1
$
3
$ 2
$
10
$
1
$ 6
$
1
$ 0
$
2
Non-
Pro
fit $
55
$ 6
$ 10
$ 1
$ 2
$
1
$ 2
$
1
$
2
$
0
$ 2
$ 3
$
1
$ 1
$
2
$ 7
$
3
$ 3
$
6
Spor
ts $
1,354
$
169
$
410
$
18
$ 8
$
26
$ 3
$
3
$
19
$ 7
$
15
$
236
$ 55
$ 12
$ 17
5
$
95
$ 74
$
10
$
18
Corp
orate
/Bra
nd $
2,710
$
290
$
466
$
264
$
283
$ 91
$
138
$ 62
$
129
$
24
$ 16
$ 89
$ 46
$ 40
$ 10
3
$
140
$ 10
6
$
45
$
379
Publi
shing
$ 61
5
$ 8
$ 13
$ 1
$ 1
$
4
$ 2
$
492
$
6
$
1
$ 0
$ 2
$
1
$ 1
$
2
$ 3
$
1
$ 1
$
75
TOTA
L W
W $
13,42
2
$
1,653
$ 2,42
0 $
482
$
526
$ 45
4
$
553
$ 80
8
$ 31
0
$ 22
3
$
364
$
969
$ 45
6
$
460
$ 46
1
$
2,041
$ 44
9
$
220
$ 57
2
Prop
erty
Tota
l %
Acce
ssor
ies-
Fash
ion
Appa
rel
CEFo
od an
d Be
vera
geFo
otwe
arHe
alth
and
Beau
tyHo
me
Déco
rHo
usew
ares
Infa
ntMu
sic/V
ideo
Softw
are/
Vide
o ga
mes
/apps
Pape
r Pr
oduc
tsPu
blish
ing
Spor
tsTo
ysGi
ftsPr
omot
ions
Othe
r
Art
100%
8.0%
12.5%
1.0%
2.9%
0.5%
0.9%
7.6%
7.0%
1.2%
1.4%
2.3%
16.7%
5.7%
1.0%
12.7%
14.1%
0.3%
4.3%
Celeb
rity10
0%14
.2%23
.2%1.3
%5.9
%3.7
%9.5
%4.6
%6.4
%1.5
%1.0
%2.8
%1.2
%5.2
%4.6
%5.7
%3.6
%1.4
%4.1
%
Enter
tain/C
hara
cters
100%
8.3%
13.1%
2.6%
3.4%
2.2%
2.8%
2.4%
1.1%
2.6%
5.2%
9.4%
4.8%
5.7%
2.2%
27.2%
3.3%
2.4%
1.2%
Colle
giate
100%
16.7%
19.7%
0.0%
0.1%
3.4%
0.0%
4.4%
13.1%
0.0%
0.0%
10.2%
1.8%
0.0%
11.8%
11.8%
6.7%
0.0%
0.1%
Fash
ion10
0%31
.9%29
.3%1.6
%0.4
%10
.0%12
.0%4.1
%1.7
%1.5
%0.1
%0.7
%1.5
%1.3
%0.2
%2.0
%1.1
%0.3
%0.4
%
Music
100%
16.3%
58.4%
0.9%
1.8%
0.4%
0.8%
0.7%
1.0%
0.3%
1.0%
2.0%
1.2%
7.2%
0.8%
4.4%
0.8%
0.2%
1.7%
Non-
Pro
fit10
0%11
.0%18
.5%2.2
%3.8
%1.7
%4.0
%2.5
%3.5
%0.6
%3.5
%5.5
%2.2
%2.2
%3.4
%13
.4%5.8
%5.8
%10
.4%
Spor
ts10
0%12
.5%30
.3%1.4
%0.6
%1.9
%0.2
%0.2
%1.4
%0.5
%1.1
%17
.4%4.0
%0.9
%12
.9%7.0
%5.5
%0.8
%1.3
%
Corp
orate
/Bra
nd10
0%10
.7%17
.2%9.7
%10
.4%3.3
%5.1
%2.3
%4.8
%0.9
%0.6
%3.3
%1.7
%1.5
%3.8
%5.2
%3.9
%1.7
%14
.0%
Publi
shing
100%
1.3%
2.1%
0.2%
0.2%
0.7%
0.3%
80.0%
1.0%
0.1%
0.0%
0.3%
0.2%
0.2%
0.3%
0.5%
0.2%
0.1%
12.2%
TOTA
L W
W10
0%12
.3%18
.0%3.6
%3.9
%3.4
%4.1
%6.0
%2.3
%1.7
%2.7
%7.2
%3.4
%3.4
%3.4
%15
.2%3.3
%1.6
%4.3
%
Prop
erty
Tota
l WW
%Ac
cess
ories
- Fa
shio
n Ap
pare
lCE
Food
and
Beve
rage
Foot
wear
Healt
h an
d Be
auty
Hom
e Dé
cor
Hous
ewar
esIn
fant
Music
/Vid
eoSo
ftwar
e/ Vi
deo
gam
es/ap
psPa
per
Prod
ucts
Publ
ishin
gSp
orts
Toys
Gifts
Prom
otio
nsOt
her
Art
0.7%
0.5%
0.5%
0.2%
0.5%
0.1%
0.1%
0.9%
2.1%
0.5%
0.3%
0.2%
3.4%
1.2%
0.2%
0.6%
3.0%
0.1%
0.7%
Celeb
rity1.4
%1.6
%1.8
%0.5
%2.1
%1.5
%3.2
%1.0
%3.8
%1.3
%0.5
%0.5
%0.5
%2.1
%1.8
%0.5
%1.5
%1.1
%1.3
%
Enter
tain/C
hara
cters
46.5%
31.2%
33.7%
34.2%
39.8%
30.6%
32.1%
18.5%
22.2%
71.7%
89.2%
60.8%
66.3%
77.9%
29.1%
83.3%
45.9%
69.0%
12.8%
Colle
giate
2.0%
2.7%
2.2%
0.0%
0.0%
2.0%
0.0%
1.4%
11.2%
0.0%
0.0%
2.8%
1.1%
0.0%
6.7%
1.5%
4.0%
0.0%
0.0%
Fash
ion13
.1%34
.0%21
.4%5.8
%1.2
%38
.9%38
.2%9.0
%9.6
%12
.0%0.4
%1.3
%5.8
%4.8
%0.8
%1.7
%4.3
%2.7
%1.3
%
Music
1.0%
1.4%
3.3%
0.3%
0.5%
0.1%
0.2%
0.1%
0.5%
0.2%
0.4%
0.3%
0.4%
2.2%
0.2%
0.3%
0.3%
0.1%
0.4%
Non-
Pro
fit0.4
%0.4
%0.4
%0.2
%0.4
%0.2
%0.4
%0.2
%0.6
%0.2
%0.5
%0.3
%0.3
%0.3
%0.4
%0.4
%0.7
%1.5
%1.0
%
Spor
ts10
.1%10
.3%17
.0%3.8
%1.5
%5.8
%0.6
%0.4
%6.2
%3.2
%4.1
%24
.4%12
.0%2.7
%37
.9%4.6
%16
.5%4.7
%3.1
%
Corp
orate
/Bra
nd20
.2%17
.6%19
.3%54
.7%53
.7%20
.0%24
.9%7.6
%41
.8%10
.5%4.5
%9.2
%10
.1%8.6
%22
.3%6.9
%23
.5%20
.4%66
.3%
Publi
shing
4.6%
0.5%
0.5%
0.2%
0.3%
0.9%
0.3%
60.9%
2.0%
0.4%
0.0%
0.2%
0.2%
0.3%
0.4%
0.1%
0.3%
0.4%
13.1%
TOTA
L W
W10
0.0%
100.0
%10
0.0%
100.0
%10
0.0%
100.0
%10
0.0%
100.0
%10
0.0%
100.0
%10
0.0%
100.0
%10
0.0%
100.0
%10
0.0%
100.0
%10
0.0%
100.0
%10
0.0%
Glo
bal R
oyal
ties
from
Lic
ense
d M
erch
andi
se, B
y Pr
oper
ty T
ype
and
Prod
uct C
ateg
ory,
2014
(in
mill
ions
of U
S$)
Glo
bal R
oyal
ties
from
Lic
ense
d M
erch
andi
se, B
y Pr
oduc
t Cat
egor
y, 20
14 (a
s a
perc
enta
ge o
f Pro
pert
y Ty
pe)
Glo
bal R
oyal
ties
Lice
nsed
Mer
chan
dise
, By
Prop
erty
Typ
e, 2
014
(as
a pe
rcen
tage
of P
rodu
ct C
ateg
ory)

LIMa GLoBaL LICensInG InDUsTRY sURVeY 2015 RePoRT 14
LICensInG ReVenUe TaBLes – LICenseD PRoPeRTY ReTaIL ReVenUes BY CoUnTRY
Country Total Art Celebrity Ent/Char Collegiate Fashion Music Non-Profit Sports Corp/Brand Publishing
US $ 133,267 $ 955 $ 1,602 $ 41,623 $ 4,163 $ 16,666 $ 988 $ 958 $ 16,478 $ 37,580 $ 12,255 Japan $ 12,198 $ 125 $ 205 $ 7,492 $ 34 $ 1,405 $ 186 $ -00 $ 956 $ 1,750 $ 44 United Kingdom $ 11,944 $ 73 $ 144 $ 7,665 $ 30 $ 1,394 $ 110 $ -00 $ 891 $ 1,580 $ 57 Germany $ 9,345 $ 50 $ 115 $ 5,439 $ 37 $ 1,179 $ 97 $ -00 $ 1,041 $ 1,318 $ 69 Canada $ 6,840 $ 64 $ 219 $ 4,044 $ 20 $ 440 $ 170 $ -00 $ 455 $ 1,346 $ 82 Hong Kong and China $ 6,139 $ 72 $ 108 $ 3,416 $ 27 $ 1,180 $ 81 $ -00 $ 184 $ 1,031 $ 40 France $ 5,563 $ 35 $ 78 $ 3,320 $ 26 $ 863 $ 65 $ -00 $ 291 $ 851 $ 34 Brazil $ 4,255 $ 21 $ 49 $ 2,473 $ 5 $ 685 $ 37 $ -00 $ 311 $ 670 $ 4 Italy $ 3,649 $ 24 $ 56 $ 2,022 $ 15 $ 644 $ 46 $ -00 $ 279 $ 542 $ 21 Netherlands $ 3,085 $ 16 $ 39 $ 1,929 $ 13 $ 311 $ 30 $ -00 $ 255 $ 475 $ 17 Spain $ 3,069 $ 23 $ 46 $ 1,789 $ 12 $ 461 $ 41 $ -00 $ 238 $ 441 $ 17 Russian Federation $ 2,986 $ 20 $ 47 $ 1,875 $ 15 $ 471 $ 33 $ -00 $ 101 $ 403 $ 20 Australia $ 2,688 $ 21 $ 33 $ 1,697 $ 12 $ 292 $ 22 $ 106 $ 158 $ 332 $ 15 Belgium $ 2,268 $ 15 $ 38 $ 1,409 $ 11 $ 280 $ 25 $ -00 $ 108 $ 368 $ 14 Mexico $ 2,198 $ 12 $ 25 $ 1,407 $ 8 $ 212 $ 16 $ -00 $ 203 $ 309 $ 6 United Arab Emirates $ 1,718 $ 12 $ 29 $ 1,051 $ 9 $ 281 $ 25 $ -00 $ 64 $ 232 $ 14 Korea, Republic of $ 1,492 $ 12 $ 30 $ 894 $ 9 $ 150 $ 23 $ -00 $ 136 $ 231 $ 7 Sweden $ 1,389 $ 8 $ 19 $ 891 $ 6 $ 154 $ 14 $ -00 $ 77 $ 215 $ 5 Switzerland $ 1,332 $ 8 $ 20 $ 750 $ 7 $ 202 $ 17 $ -00 $ 81 $ 238 $ 9 Poland $ 1,192 $ 8 $ 17 $ 773 $ 6 $ 139 $ 13 $ -00 $ 50 $ 180 $ 5 India $ 1,023 $ 8 $ 16 $ 638 $ 4 $ 166 $ 10 $ -00 $ 35 $ 142 $ 4 Turkey $ 1,003 $ 7 $ 19 $ 568 $ 6 $ 163 $ 12 $ -00 $ 51 $ 172 $ 5 Denmark $ 993 $ 6 $ 15 $ 627 $ 5 $ 124 $ 12 $ -00 $ 48 $ 151 $ 4 Austria $ 919 $ 6 $ 15 $ 536 $ 7 $ 128 $ 12 $ -00 $ 59 $ 151 $ 5 Singapore $ 885 $ 8 $ 19 $ 582 $ 4 $ 80 $ 9 $ -00 $ 31 $ 150 $ 3 Saudi Arabia $ 865 $ 6 $ 14 $ 544 $ 5 $ 125 $ 11 $ -00 $ 28 $ 128 $ 5 Norway $ 828 $ 5 $ 12 $ 529 $ 4 $ 103 $ 9 $ -00 $ 46 $ 117 $ 3 Chile $ 817 $ 5 $ 11 $ 522 $ 4 $ 110 $ 9 $ -00 $ 54 $ 100 $ 3 Czech Republic $ 660 $ 4 $ 9 $ 457 $ 4 $ 59 $ 6 $ -00 $ 26 $ 91 $ 3 Viet Nam $ 592 $ 6 $ 15 $ 344 $ 3 $ 67 $ 15 $ -00 $ 33 $ 105 $ 3 Finland $ 555 $ 3 $ 8 $ 350 $ 3 $ 71 $ 6 $ -00 $ 31 $ 81 $ 2 Colombia $ 538 $ 3 $ 7 $ 370 $ 2 $ 48 $ 5 $ -00 $ 36 $ 66 $ 2 Portugal $ 505 $ 3 $ 8 $ 288 $ 2 $ 82 $ 7 $ -00 $ 26 $ 86 $ 2 Ireland $ 493 $ 3 $ 8 $ 296 $ 2 $ 70 $ 6 $ -00 $ 23 $ 82 $ 2 South Africa $ 487 $ 4 $ 9 $ 313 $ 3 $ 53 $ 6 $ -00 $ 18 $ 77 $ 3 Slovakia $ 477 $ 3 $ 7 $ 320 $ 2 $ 51 $ 5 $ -00 $ 26 $ 62 $ 2 Greece $ 471 $ 3 $ 7 $ 304 $ 2 $ 67 $ 5 $ -00 $ 20 $ 62 $ 2 Venezuela $ 464 $ 3 $ 7 $ 306 $ 2 $ 54 $ 5 $ -00 $ 25 $ 60 $ 2 Taipei, Chinese $ 448 $ 4 $ 8 $ 286 $ 2 $ 31 $ 5 $ -00 $ 34 $ 76 $ 2 Ukraine $ 435 $ 3 $ 7 $ 277 $ 2 $ 58 $ 4 $ -00 $ 16 $ 65 $ 2 Hungary $ 431 $ 3 $ 6 $ 289 $ 2 $ 44 $ 4 $ -00 $ 22 $ 61 $ 2 Malaysia $ 422 $ 4 $ 8 $ 288 $ 2 $ 26 $ 4 $ -00 $ 16 $ 71 $ 2 Peru $ 414 $ 3 $ 5 $ 283 $ 2 $ 49 $ 3 $ -00 $ 14 $ 54 $ 2 New Zealand $ 413 $ 3 $ 6 $ 273 $ 2 $ 46 $ 4 $ 17 $ 13 $ 48 $ 2 Thailand $ 413 $ 6 $ 8 $ 268 $ 2 $ 32 $ 4 $ -00 $ 19 $ 72 $ 2 Israel $ 361 $ 3 $ 6 $ 230 $ 2 $ 54 $ 5 $ -00 $ 14 $ 46 $ 2 Romania $ 353 $ 2 $ 6 $ 224 $ 2 $ 48 $ 4 $ -00 $ 12 $ 54 $ 2 Kazakhstan $ 288 $ 2 $ 5 $ 173 $ 2 $ 49 $ 4 $ -00 $ 11 $ 43 $ 2 Iraq $ 265 $ 2 $ 5 $ 159 $ 2 $ 47 $ 4 $ -00 $ 9 $ 36 $ 2 Algeria $ 234 $ 2 $ 4 $ 158 $ 2 $ 21 $ 2 $ -00 $ 8 $ 35 $ 2 N. America $ 140,107 $ 1,018 $ 1,821 $ 45,667 $ 4,183 $ 17,106 $ 1,158 $ 958 $ 16,933 $ 38,926 $ 12,337 Northern Europe $ 32,231 $ 188 $ 419 $ 19,884 $ 117 $ 3,888 $ 326 $ -00 $ 2,601 $ 4,626 $ 182 N Asia $ 18,968 $ 202 $ 322 $ 11,331 $ 64 $ 2,647 $ 272 $ -00 $ 1,176 $ 2,868 $ 86 Southern Europe $ 15,531 $ 101 $ 228 $ 9,058 $ 70 $ 2,471 $ 187 $ -00 $ 964 $ 2,366 $ 87 LATAM $ 10,414 $ 59 $ 137 $ 6,343 $ 39 $ 1,436 $ 100 $ -00 $ 693 $ 1,575 $ 31 SEA/PAC $ 9,633 $ 77 $ 157 $ 6,066 $ 50 $ 1,075 $ 110 $ 123 $ 475 $ 1,452 $ 48 Eastern Europe $ 8,330 $ 54 $ 125 $ 5,308 $ 44 $ 1,122 $ 87 $ -00 $ 301 $ 1,244 $ 45 ME/Africa $ 5,420 $ 57 $ 140 $ 3,097 $ 54 $ 824 $ 111 $ -00 $ 241 $ 838 $ 57 ROW $ 903 $ 4 $ 10 $ 431 $ 4 $ 215 $ 9 $ -00 $ 13 $ 214 $ 4 TOTAL WW $ 241,538 $ 1,761 $ 3,359 $ 107,185 $ 4,625 $ 30,784 $ 2,360 $ 1,080 $ 23,398 $ 54,109 $ 12,876 TOTAL WW % 100.0% 0.7% 1.4% 44.4% 1.9% 12.7% 1.0% 0.4% 9.7% 22.4% 5.3%
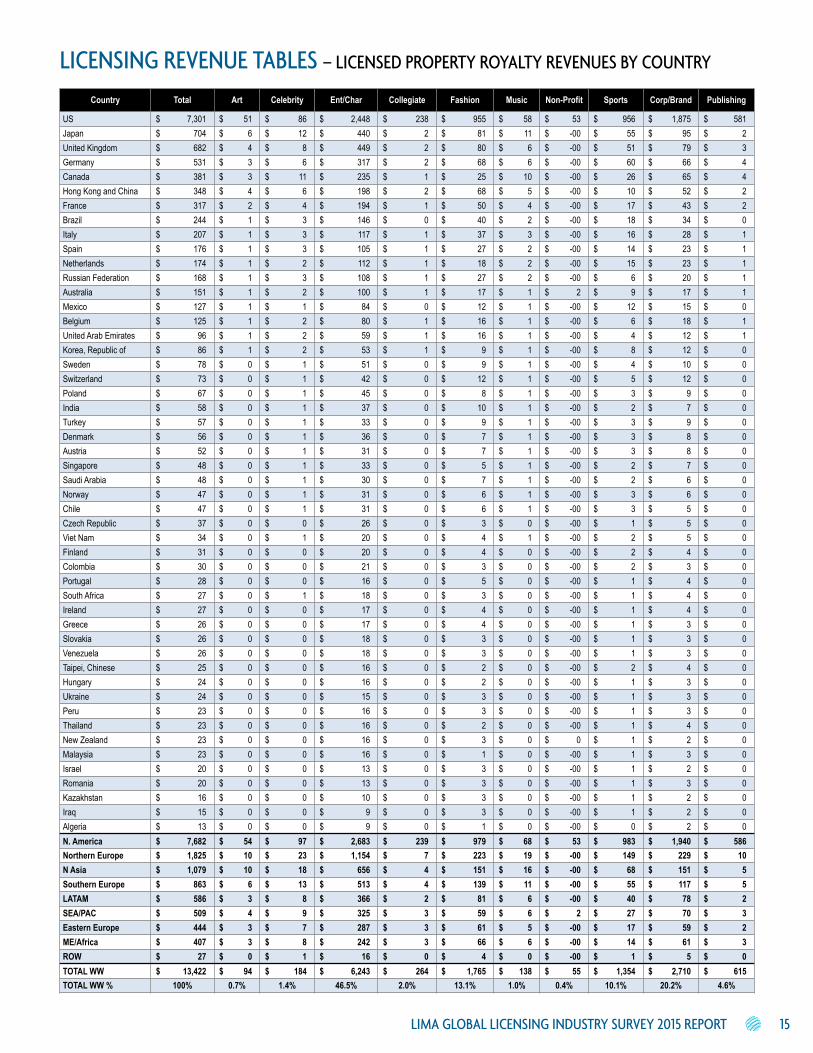
LIMa GLoBaL LICensInG InDUsTRY sURVeY 2015 RePoRT 15
LICensInG ReVenUe TaBLes – LICenseD PRoPeRTY RoYaLTY ReVenUes BY CoUnTRY
Country Total Art Celebrity Ent/Char Collegiate Fashion Music Non-Profit Sports Corp/Brand Publishing
US $ 7,301 $ 51 $ 86 $ 2,448 $ 238 $ 955 $ 58 $ 53 $ 956 $ 1,875 $ 581 Japan $ 704 $ 6 $ 12 $ 440 $ 2 $ 81 $ 11 $ -00 $ 55 $ 95 $ 2 United Kingdom $ 682 $ 4 $ 8 $ 449 $ 2 $ 80 $ 6 $ -00 $ 51 $ 79 $ 3 Germany $ 531 $ 3 $ 6 $ 317 $ 2 $ 68 $ 6 $ -00 $ 60 $ 66 $ 4 Canada $ 381 $ 3 $ 11 $ 235 $ 1 $ 25 $ 10 $ -00 $ 26 $ 65 $ 4 Hong Kong and China $ 348 $ 4 $ 6 $ 198 $ 2 $ 68 $ 5 $ -00 $ 10 $ 52 $ 2 France $ 317 $ 2 $ 4 $ 194 $ 1 $ 50 $ 4 $ -00 $ 17 $ 43 $ 2 Brazil $ 244 $ 1 $ 3 $ 146 $ 0 $ 40 $ 2 $ -00 $ 18 $ 34 $ 0 Italy $ 207 $ 1 $ 3 $ 117 $ 1 $ 37 $ 3 $ -00 $ 16 $ 28 $ 1 Spain $ 176 $ 1 $ 3 $ 105 $ 1 $ 27 $ 2 $ -00 $ 14 $ 23 $ 1 Netherlands $ 174 $ 1 $ 2 $ 112 $ 1 $ 18 $ 2 $ -00 $ 15 $ 23 $ 1 Russian Federation $ 168 $ 1 $ 3 $ 108 $ 1 $ 27 $ 2 $ -00 $ 6 $ 20 $ 1 Australia $ 151 $ 1 $ 2 $ 100 $ 1 $ 17 $ 1 $ 2 $ 9 $ 17 $ 1 Mexico $ 127 $ 1 $ 1 $ 84 $ 0 $ 12 $ 1 $ -00 $ 12 $ 15 $ 0 Belgium $ 125 $ 1 $ 2 $ 80 $ 1 $ 16 $ 1 $ -00 $ 6 $ 18 $ 1 United Arab Emirates $ 96 $ 1 $ 2 $ 59 $ 1 $ 16 $ 1 $ -00 $ 4 $ 12 $ 1 Korea, Republic of $ 86 $ 1 $ 2 $ 53 $ 1 $ 9 $ 1 $ -00 $ 8 $ 12 $ 0 Sweden $ 78 $ 0 $ 1 $ 51 $ 0 $ 9 $ 1 $ -00 $ 4 $ 10 $ 0 Switzerland $ 73 $ 0 $ 1 $ 42 $ 0 $ 12 $ 1 $ -00 $ 5 $ 12 $ 0 Poland $ 67 $ 0 $ 1 $ 45 $ 0 $ 8 $ 1 $ -00 $ 3 $ 9 $ 0 India $ 58 $ 0 $ 1 $ 37 $ 0 $ 10 $ 1 $ -00 $ 2 $ 7 $ 0 Turkey $ 57 $ 0 $ 1 $ 33 $ 0 $ 9 $ 1 $ -00 $ 3 $ 9 $ 0 Denmark $ 56 $ 0 $ 1 $ 36 $ 0 $ 7 $ 1 $ -00 $ 3 $ 8 $ 0 Austria $ 52 $ 0 $ 1 $ 31 $ 0 $ 7 $ 1 $ -00 $ 3 $ 8 $ 0 Singapore $ 48 $ 0 $ 1 $ 33 $ 0 $ 5 $ 1 $ -00 $ 2 $ 7 $ 0 Saudi Arabia $ 48 $ 0 $ 1 $ 30 $ 0 $ 7 $ 1 $ -00 $ 2 $ 6 $ 0 Norway $ 47 $ 0 $ 1 $ 31 $ 0 $ 6 $ 1 $ -00 $ 3 $ 6 $ 0 Chile $ 47 $ 0 $ 1 $ 31 $ 0 $ 6 $ 1 $ -00 $ 3 $ 5 $ 0 Czech Republic $ 37 $ 0 $ 0 $ 26 $ 0 $ 3 $ 0 $ -00 $ 1 $ 5 $ 0 Viet Nam $ 34 $ 0 $ 1 $ 20 $ 0 $ 4 $ 1 $ -00 $ 2 $ 5 $ 0 Finland $ 31 $ 0 $ 0 $ 20 $ 0 $ 4 $ 0 $ -00 $ 2 $ 4 $ 0 Colombia $ 30 $ 0 $ 0 $ 21 $ 0 $ 3 $ 0 $ -00 $ 2 $ 3 $ 0 Portugal $ 28 $ 0 $ 0 $ 16 $ 0 $ 5 $ 0 $ -00 $ 1 $ 4 $ 0 South Africa $ 27 $ 0 $ 1 $ 18 $ 0 $ 3 $ 0 $ -00 $ 1 $ 4 $ 0 Ireland $ 27 $ 0 $ 0 $ 17 $ 0 $ 4 $ 0 $ -00 $ 1 $ 4 $ 0 Greece $ 26 $ 0 $ 0 $ 17 $ 0 $ 4 $ 0 $ -00 $ 1 $ 3 $ 0 Slovakia $ 26 $ 0 $ 0 $ 18 $ 0 $ 3 $ 0 $ -00 $ 1 $ 3 $ 0 Venezuela $ 26 $ 0 $ 0 $ 18 $ 0 $ 3 $ 0 $ -00 $ 1 $ 3 $ 0 Taipei, Chinese $ 25 $ 0 $ 0 $ 16 $ 0 $ 2 $ 0 $ -00 $ 2 $ 4 $ 0 Hungary $ 24 $ 0 $ 0 $ 16 $ 0 $ 2 $ 0 $ -00 $ 1 $ 3 $ 0 Ukraine $ 24 $ 0 $ 0 $ 15 $ 0 $ 3 $ 0 $ -00 $ 1 $ 3 $ 0 Peru $ 23 $ 0 $ 0 $ 16 $ 0 $ 3 $ 0 $ -00 $ 1 $ 3 $ 0 Thailand $ 23 $ 0 $ 0 $ 16 $ 0 $ 2 $ 0 $ -00 $ 1 $ 4 $ 0 New Zealand $ 23 $ 0 $ 0 $ 16 $ 0 $ 3 $ 0 $ 0 $ 1 $ 2 $ 0 Malaysia $ 23 $ 0 $ 0 $ 16 $ 0 $ 1 $ 0 $ -00 $ 1 $ 3 $ 0 Israel $ 20 $ 0 $ 0 $ 13 $ 0 $ 3 $ 0 $ -00 $ 1 $ 2 $ 0 Romania $ 20 $ 0 $ 0 $ 13 $ 0 $ 3 $ 0 $ -00 $ 1 $ 3 $ 0 Kazakhstan $ 16 $ 0 $ 0 $ 10 $ 0 $ 3 $ 0 $ -00 $ 1 $ 2 $ 0 Iraq $ 15 $ 0 $ 0 $ 9 $ 0 $ 3 $ 0 $ -00 $ 1 $ 2 $ 0 Algeria $ 13 $ 0 $ 0 $ 9 $ 0 $ 1 $ 0 $ -00 $ 0 $ 2 $ 0 N. America $ 7,682 $ 54 $ 97 $ 2,683 $ 239 $ 979 $ 68 $ 53 $ 983 $ 1,940 $ 586 Northern Europe $ 1,825 $ 10 $ 23 $ 1,154 $ 7 $ 223 $ 19 $ -00 $ 149 $ 229 $ 10 N Asia $ 1,079 $ 10 $ 18 $ 656 $ 4 $ 151 $ 16 $ -00 $ 68 $ 151 $ 5 Southern Europe $ 863 $ 6 $ 13 $ 513 $ 4 $ 139 $ 11 $ -00 $ 55 $ 117 $ 5 LATAM $ 586 $ 3 $ 8 $ 366 $ 2 $ 81 $ 6 $ -00 $ 40 $ 78 $ 2 SEA/PAC $ 509 $ 4 $ 9 $ 325 $ 3 $ 59 $ 6 $ 2 $ 27 $ 70 $ 3 Eastern Europe $ 444 $ 3 $ 7 $ 287 $ 3 $ 61 $ 5 $ -00 $ 17 $ 59 $ 2 ME/Africa $ 407 $ 3 $ 8 $ 242 $ 3 $ 66 $ 6 $ -00 $ 14 $ 61 $ 3 ROW $ 27 $ 0 $ 1 $ 16 $ 0 $ 4 $ 0 $ -00 $ 1 $ 5 $ 0 TOTAL WW $ 13,422 $ 94 $ 184 $ 6,243 $ 264 $ 1,765 $ 138 $ 55 $ 1,354 $ 2,710 $ 615 TOTAL WW % 100% 0.7% 1.4% 46.5% 2.0% 13.1% 1.0% 0.4% 10.1% 20.2% 4.6%

LIMA GLOBAL LICENSING INDUSTRY SURVEY 2015 REPORT 16
LICENSING REVENUE TABLES – US AND CANADA LICENSING RETAIL & ROYALTY REVENUESPr
oper
tyTo
tal
Acce
ssor
ies-
Fash
ion
Appa
rel
CEFo
od an
d Be
vera
geFo
otwe
arHe
alth
and
Beau
tyHo
me
Déco
rHo
usew
ares
Infa
ntMu
sic/V
ideo
Softw
are/
Vide
o ga
mes
/apps
Pape
r Pr
oduc
tsPu
blish
ing
Spor
tsTo
ysGi
ftsPr
omot
ions
Othe
r
Art
$ 1,0
18
$ 83
$
72
$ 6
$ 25
$ 2
$ 3
$ 12
5
$
83
$
9
$
13
$
10
$
197
$ 70
$ 5
$
93
$ 20
9
$
1
$
14
Celeb
rity $
1,821
$
196
$
259
$ 24
$
194
$ 40
$
241
$
152
$ 18
8
$ 39
$
12
$
34
$
6
$ 15
5
$
46
$ 53
$
112
$ 9
$ 61
Enter
tain/C
hara
cters
$ 45
,667
$
3,724
$
5,149
$ 1,5
67
$
2,228
$ 1,0
19
$
1,382
$
1,500
$ 70
1
$ 1,1
99
$
2,541
$
4,175
$
2,074
$ 3,0
06
$ 1,0
93
$
11,10
1
$ 1,6
30
$
973
$
605
Colle
giate
$ 4,1
83
$ 67
7
$ 76
7
$
2
$
6
$ 15
0
$ 1
$ 22
8
$
602
$
1
$
2
$
378
$ 77
$ 1
$
527
$ 45
8
$
301
$ 0
$ 4
Fash
ion $
17,10
6
$ 5,5
66
$ 4,3
36
$
469
$
74
$
1,604
$ 2,2
45
$ 92
8
$
323
$
211
$
12
$
132
$ 24
9
$
270
$ 31
$
390
$ 15
7
$
43
$
65
Music
$ 1,1
58
$ 18
9
$ 64
6
$
13
$ 34
$ 5
$ 9
$ 11
$
14
$
4
$
15
$
21
$
14
$
92
$
10
$ 48
$
11
$ 3
$ 21
Non-
Pro
fit $
958
$
91
$ 16
7
$
27
$ 58
$ 18
$
22
$
30
$ 37
$ 6
$ 40
$ 47
$ 21
$ 23
$ 35
$
121
$ 60
$
56
$
98
Spor
ts $
16,93
3
$ 2,2
58
$ 4,7
45
$
235
$
158
$ 33
6
$ 40
$ 47
$
307
$
95
$ 15
9
$ 2,7
16
$ 80
6
$
126
$ 2,3
05
$
1,201
$ 1,0
04
$
106
$
288
Corp
orate
/Bra
nd $
38,92
6
$ 3,4
34
$ 4,9
95
$
4,698
$ 6,0
82
$
1,212
$ 1,7
76
$ 99
6
$
2,045
$
341
$
220
$
967
$ 63
3
$
547
$ 1,2
70
$
1,597
$ 1,3
87
$
559
$
6,169
Publi
shing
$ 12
,337
$
57
$ 10
1
$
8
$
22
$
44
$ 23
$ 10
,560
$
59
$
6
$
1
$
12
$
7
$ 7
$
25
$ 19
$
27
$ 4
$ 1,3
54
TOTA
L W
W $
140,1
07
$
16,27
3
$ 2
1,239
$
7,049
$ 8,8
81
$
4,430
$ 5,7
42
$ 14
,577
$
4,359
$
1,911
$ 3,0
15
$ 8,4
92
$ 4,0
84
$
4,299
$
5,346
$ 15
,083
$
4,896
$ 1,7
53
$ 8,6
79
Prop
erty
Tota
lAc
cess
ories
- Fa
shio
n Ap
pare
lCE
Food
and
Beve
rage
Foot
wear
Healt
h an
d Be
auty
Hom
e Dé
cor
Hous
ewar
esIn
fant
Music
/Vid
eoSo
ftwar
e/ Vi
deo
gam
es/ap
psPa
per
Prod
ucts
Publ
ishin
gSp
orts
Toys
Gifts
Prom
otio
nsOt
her
Art
$ 54
$ 5
$ 4
$
0
$
1
$ 0
$ 0
$ 5
$
4
$
0
$
1
$
1
$ 11
$ 4
$
0
$ 6
$
11
$ 0
$ 1
Celeb
rity $
97
$
12
$ 16
$
1
$
7
$ 2
$ 14
$ 7
$
10
$
2
$
1
$
2
$ 0
$
8
$ 2
$
3
$ 6
$
1
$
3
Enter
tain/C
hara
cters
$ 2,6
83
$ 23
1
$ 33
3
$
74
$ 85
$ 56
$
82
$
70
$ 37
$ 68
$
139
$
274
$ 12
0
$
164
$ 59
$
710
$ 90
$
57
$
35
Colle
giate
$ 23
9
$ 40
$
47
$ 0
$ 0
$
8
$
0
$
11
$ 31
$ 0
$ 0
$ 24
$ 4
$
0
$ 28
$
28
$ 16
$
0
$
0
Fash
ion $
979
$
327
$
266
$ 21
$
3
$ 86
$
128
$
43
$ 17
$ 12
$
1
$
9
$ 14
$ 14
$ 2
$
24
$ 9
$
2
$
4
Music
$ 68
$ 11
$
40
$ 1
$ 1
$
0
$
1
$
0
$ 1
$ 0
$ 1
$ 1
$
1
$ 5
$
1
$ 3
$
1
$ 0
$ 1
Non-
Pro
fit $
53
$
5
$
10
$ 1
$ 2
$
1
$
1
$
1
$ 2
$ 0
$ 2
$ 3
$
1
$ 1
$
2
$ 7
$
3
$ 3
$ 5
Spor
ts $
983
$
133
$
287
$ 11
$
6
$ 18
$
2
$
2
$ 16
$ 5
$ 8
$ 16
9
$
46
$
7
$ 12
4
$
74
$ 54
$
6
$
16
Corp
orate
/Bra
nd $
1,940
$
199
$
306
$ 20
6
$ 20
5
$
61
$ 10
1
$ 45
$
93
$
17
$ 11
$ 60
$ 36
$ 29
$ 68
$
96
$ 72
$
32
$
303
Publi
shing
$ 58
6
$ 3
$ 6
$
0
$
1
$ 2
$ 1
$ 48
9
$
3
$
0
$
0
$
1
$ 0
$
0
$ 1
$
1
$ 1
$
0
$
73
TOTA
L W
W $
7,682
$
966
$
1,315
$ 31
6
$ 31
1
$
235
$
330
$
674
$ 21
4
$ 10
6
$ 16
2
$ 54
4
$
234
$ 23
2
$
287
$ 95
2
$
263
$ 10
2
$ 44
1
US
and
Can
ada
Reta
il S
ales
of L
icen
sed
Mer
chan
dise
, By
Prop
erty
Typ
e an
d Pr
oduc
t Cat
egor
y, 20
14 (i
n m
illio
ns o
f US
$)
US
and
Can
ada
Roya
lties
from
Lic
ense
d M
erch
andi
se, B
y Pr
oper
ty T
ype
and
Prod
uct C
ateg
ory,
2014
(in
mill
ions
of U
S$)
For d
etai
led
tabl
es fo
r the
Top
10
coun
trie
s an
d al
l Wor
ld R
egio
ns p
leas
e re
fer t
o th
e ac
com
pany
ing
docu
men
t.

LIMa GLoBaL LICensInG InDUsTRY sURVeY 2015 RePoRT 17
aPPenDIXPRODUCT CATEGORY TRENDS: A BRANDAR ANALYSIS
As we formulated this Licensing market sizing Analysis, we examined trends occurring in the underlying Product Categories that brands/properties are licensing into. We gleaned this information from the various Industry reports we reviewed and wanted to share some of our learnings here as well as they may help with targeting future opportunities.
Accessories:
demand for the global Accessory manufacturing industry has resurged over the past five years, as global economic conditions have improved and consumers have resumed the spending they delayed during the recession. demand for higher priced luxury products increased in countries such as China, India and Brazil, while many europe-based companies are placing greater focus on the Asian market as incomes in the region rise.
As a result, industry revenue is anticipated to grow an annualized 2.2% over the five years preceding 2015 this is driven in large part by increasing wealth and consequentially spending on luxury items; especially by Chinese and Indian consumers who account for 36.4% of the world’s population.
Items produced in europe (Italy and France, in particular) are regarded as high-quality luxury Accessory products that command premium prices. however, companies that operate in developed economies are increasingly sourcing accessories and handbags from manufacturers in China, where production costs are lower. As wages in China rise though, production is shifting to other lower-cost producers in Asia, such as Vietnam. As a result of these trends, the size of the industry is expected to grow; however, the number of Accessory companies in europe and the United states will decline.
over the next five years, demand for handbags and accessories will grow as conditions in the global economy, especially in Western europe and north America, strengthen. manufacturers of less expensive Accessory products are mainly located in the emerging market regions of Asia and south America. In contrast, designers, large wholesalers and retailers are mostly located in europe, the United states and the developed Asian countries such as hong Kong and Japan. Companies that operate in developed economies like the United states and the United Kingdom have outsourced many of their accessory and handbag manufacturing activities to emerging economies to reduce costs. the continued existence of these luxury brands’ home base manufacturing operations is largely attributable to the prestige associated in this category with “made in Italy or France” products as opposed to “made in Asia” products. Products that are manufactured in europe are generally regarded as high-quality, luxury products that carry high prices.
overall, profit margins have grown from an estimated 6.2% of revenue in 2010 to 6.7% in 2015; although they still remain below their historical levels of 7.0% - 8.0%. With the advent of fast fashion, which brings designs from the runway to stores in a matter of weeks, individual manufacturers’ response times are quite crucial in this product segment. manufacturers that cannot quickly meet demand for new trends will be at a disadvantage. IBIsWorld forecasts that Accessory industry revenue will increase at an annualized rate of 4.5% over the five years leading to 2020.
Apparel:
rebounding global economies will bring good news to the global Apparel manufacturing industry over the next five years. rising per capita disposable incomes, coupled with the steady upward trend in the global population, will give way to greater demand for Apparel. demand is most heavily influenced by per capita disposable income though. It determines the quantity, quality and frequency of apparel purchases. demand for high-value luxury apparel is growing across the board. Chinese luxury consumers are expected to increasingly become a target market for many high-end apparel companies.
the United states is the industry’s largest market. the country generates an estimated 16.7% of industry revenue due to its large population, high standards of living and high consumption expenditures. Women’s and girls’ Apparel is expected to account for almost two-thirds of revenue generated by this industry worldwide, while men’s and boys’ Apparel is expected to account for 36.5% of revenue. Consumer preference for premium denim items has grown over the past five years; coinciding with the steady shift away from strict professional work attire to a more relaxed and casual dress code.
As China’s middle class continues to grow, industry operators are shifting their focus. For almost two to three decades, many producers off-shored production to China in order to take advantage of more affordable labor costs and less-stringent regula-tions and exported their apparel to developed countries where they could charge relatively higher prices. however, with growth in China’s middle-class, industry operators are expected to shift their focus to the growing Chinese consumer segment.
In addition, a relatively recent trend, reshoring is also gaining traction. As manufacturers shift their strategy from producing in China for the Western markets to now producing in China for their Asian and european markets more exclusively, many apparel

LIMa GLoBaL LICensInG InDUsTRY sURVeY 2015 RePoRT 18
manufacturers are looking to re-shore production back to western economies. this trend is being aided by rising labor costs in China and greater manufacturing competitiveness in the United states.
Consumers are influenced by advertising and brand image in the Apparel market and this creates great opportunity for licensed brands in the industry. the brand desirability of a product can lead to higher revenue. many Apparel manufacturers don’t want to spend to build a brand when they can license an already strong brand. Brand strength and consumer demand for branded Apparel products are key to ensuring revenue growth in this market. Large exporters in this industry are China, hK, India, Ger-many, turkey, and Bangladesh. the Us is the largest importer.
Consumer Electronics:
the level of economic activity and capital investment expenditure influences demand for Consumer electronics (Ce) and compo-nents. As incomes continue to rise in emerging and newly industrialized nations, such as BrIC nations (i.e. Brazil, russia, China, and India), these countries are increasing their demand for Consumer electronics. there has been strong economic growth and rising household wealth in emerging economies, including some countries in eastern europe. Combined with low penetration rates and falling prices, Ce sales have expanded significantly in many emerging economies. Increasing household wealth in many emerging markets will make electronic goods more affordable to a larger section of the population. As consumer sentiment and spending recover from worldwide recessions, an increase in demand for Ce products is expected as more people spend money on high value Ce and discretionary products such as tVs, cameras and stereos. economic slowdowns in China, Japan and the european Union may temper some consumer sentiment, despite increasing disposable income.
the number of broadband connections worldwide has given rise to on-line streaming services and had a major impact on the number of televisions sold. Combine this with the fact that many viewers in developed economies can now also access television shows through additional devices such as computers, tablets & smart phones. home networking technology is already enabling computer, audio and video devices to integrate.
An increase in technological change for the global entertainment sector will service to accelerate industry demand as consumer electronics manufacturers develop and sell a greater breadth of products. the shift from analog to digital technologies has led to price erosion, however.
All these factors, combined with falling product prices, mean that the volume of Ce sales will grow at a strong rate in many emerg-ing markets. Applications in home computing, the internet and Ce are coming together. A similar convergence is occurring in the automotive market, where electronic equipment is converging into integrated systems, and consumer electronics (such as portable digital audio and video players) can integrate with automotive audio and video equipment. Brand strength is an important basis of competition in the Industry, so brand licensing is also very prevalent here.
Food/Beverages:
the global Fruit and Vegetables Processing industry has grown steadily over the past five years, as expansion of the world popu-lation (particularly growth in the world’s urban population) and growth in global per capita income have spurred growth in global demand for food. In addition, the rising global health trend has increased consumer demand for higher-quality and more diverse fruit and vegetable products.
simultaneously, improvements in logistics and production processes have enabled the industry’s larger multinational companies to increase their production and more efficiently distribute their products over geographically disparate markets. IBIsWorld expects operators in europe and Asia to produce over 70.0% of global exports of processed fruit and vegetable in 2015. China is the world’s leading exporter of processed fruit and vegetables, with the United states and some european countries filling the next five positions. At the same time, industry production is still concentrated in north America and europe, where advanced fruit and vegetable processing has been expanding to meet its populations’ growing demand for industry products.
the global Food Processing industry has experienced consistent demand over the five years to 2015, as economies of every size continue to consume processed fruits and vegetable products and consumer spending increases as the world recovers from the global recession. demand has grown particularly fast in developing economies as industrial growth has translated into greater urbanization, higher per capita incomes and expansion in the size of the middle class. As the global middle class has grown, it has demanded larger quantities of higher quality and more-diverse food. Increased consumption of fruits and vegetables can be attributed to more households becoming health centered. While competition from fresh produce poses a threat, demand for industry staples such as juice and tomato-based products continues to grow across the global market and represent a nice licensing opportunity. Consequently, industry operators have increased their output to meet this growth in global demand.
As a result, IBIsWorld expects the global Food Processing industry to grow at an annualized rate of 1.3% over the five years leading into 2015. In 2015, industry revenue is forecast to grow 0.4%. By contrast, industry revenue is expected to expand at an annualized rate of 3.0% over the five years leading to 2020.

LIMa GLoBaL LICensInG InDUsTRY sURVeY 2015 RePoRT 19
In addition, while the bulk of fruit and vegetable processing is currently done in north America and europe, industry production is expected to steadily shift to other parts of the globe, particularly China. While China currently produces about half of the world’s vegetables and one-third of the world’s fruit (by tonnage), the majority of this output is unprocessed. As Chinese consumers increase their demand for industry products, Chinese fruit and vegetable processing is expected to expand and hence so will brand licensing opportunities in this market. this trend is expected to continue across other emerging economies.
despite facing a number of obstacles throughout mature markets, the global soft drink and Bottled Water manufacturing industry has achieved moderate growth in recent years. due to growing health concerns, consumers in north America and europe have curbed their intake of sugary beverages like carbonated soft drinks, fruit juices and traditional sports drinks. even bottled water consumption has wavered during this period, primarily due to concerns regarding the environmental footprint of plastic bottles.
While industry consolidation has strengthened the position of leading beverage manufacturers, their growth is primarily attributed to increasing demand for packaged beverages in emerging markets. the strengthening economy of the BrIC nations and coun-tries in Asia, Latin America and the middle east has supported the increased consumer adoption of beverages such as carbon-ated soft drinks, functional beverages and fruit juices. IBIsWorld expects industry revenue to increase at an annualized 1.0% over the five years that led to 2015, including projected growth of 0.4% in 2015.
Industry participants are anticipated to benefit from growing demand for premium beverages in mature markets in the next several years and this segment may be another attractive licensing opportunity. however, soda and bottled water manufacturers face a number of threats in the short term. At-home municipal tap filters and soda machines may further curb demand for bottled and canned soda in north America. Also, improving water sanitation systems in countries such as India may lower demand for bottled water, posing a significant threat to bottled water manufacturers. Also, while per capita consumption of soft drinks is exceptionally high in Latin and Central America, the growing obesity epidemic in this region is anticipated to curb the consumption of sugary beverages in the longer term. overall, industry revenue is forecast to increase at an average annual rate of 2.1% in the five years leading to 2020.
People aged 15 to 34 constitute the core consumer group for this industry’s products. As the number of people in this age group increases, demand for beverages such as soda and fruit drinks expands and lifts industry revenue. the global number of people aged 15 to 34 is anticipated to rise in 2015. Producers will likely focus on providing new flavors, container sizes and formats to renew consumer interest for their beverages. however, as disposable income levels inch up in the upcoming years, more con-sumers are expected to turn to premium beverages, including organic and all-natural varieties, helping to lift industry performance further and creating new attractive licensing opportunities in this segment.
rising per capita Alcoholic spirits consumption in emerging countries and increasing demand for premium brands have driven revenue growth for the global spirits manufacturing industry. Following the global recession, improving income levels and pent-up demand for spirits drove industry revenue to grow at a double-digit rate by 2011. In particular, the strengthening economies of the BrIC nations and an expanding middle class in these emerging markets have lifted demand for a variety of spirits. Growing demand in these countries encouraged the leading producers to expand their market share in these regions through acquisitions and by expanding their operations overseas. Consequently, IBIsWorld last year projected that industry revenue would grow an annualized rate of 5.8% in the five years that led to 2014, including an increase of 2.4% in 2014.
In addition to revenue growth, producers benefited from improving profit margins. despite growing input costs, several factors, such as industry consolidation and automation, lifted industry profitability. over the next five years, the industry is anticipated to grow as rising disposable income levels and expanding populations across the globe support new spirits consumption. overall, IBIsWorld projects industry revenue to grow at an average annual rate of 5.6% in the five years leading to 2019.
International distilleries, including diageo and Pernod ricard, have focused on acquiring and licensing premium brands and invested in marketing campaigns targeting the growing middle class in emerging economies to extract greater profit margins from less price-sensitive consumers. Consumers have been trading up their beverage choices for several years as well; also creating exciting licensing opportunities for premium brands. this trend is called premiumization and has facilitated expanding profit mar-gins for producers and stimulated industry revenue growth. this is especially important in regions where the spirits market has reached maturity and per capita consumption is stagnant or declining, such as Western europe. Increased interest in artisanal cocktails, savvy marketing and rising per capita incomes have facilitated premiumization.
rising social acceptance of alcohol consumption and the popularization of cocktails have led to more people choosing to con-sume spirits during social occasions. Consumers have used beverage choices to signal individuality or sophistication, leading to increased consumption of premium products and heightened brand loyalty. effective branding, licensing, advertising and market-ing have all fed into this trend.

LIMa GLoBaL LICensInG InDUsTRY sURVeY 2015 RePoRT 20
Footwear:
While the global economy was in a transition phase, pulling its way out of the financial crisis and the subsequent economic reces-sion, growth in the global footwear industry remained stunted. Additionally, the industry was affected by structural changes in the Chinese economy, as the cost of doing business in China rose rapidly towards the latter half of the five-year period that led into 2015. however, despite these challenges, demand remained strong, especially from emerging markets that compensated for a significant proportion of the slowdown in demand growth in developed economies.
As both europe and the United states slowly creep towards full-employment, revenue growth will also strengthen. GdP growth in BrIC nations is also climbing and signaling demand growth from other emerging markets as well. In fact, GdP growth in emerging countries has outpaced the performance of developed regions and will be a key driver of future Footwear growth. Additionally, profit will also expand as consumers increasingly seek out luxury Footwear, which carries a high price tag and more opportunities for brand licensing. the industry is also likely to be influenced by the proposed trans Pacific Agreement, which is a free trade agreement between north America, Australia and some countries in south America and east Asia. regular footwear is not a luxury item, but a rise in personal income can lead to increased demand for more expensive footwear and an increase in the average number of shoes purchased by a consumer.
Population growth is a key driver in this industry. A higher global population leads to greater demand for consumer products, particularly for basic necessities such as basic footwear. successful companies in this industry develop brand strength in tandem with consumer demand for branded footwear products making licensing a key success factor today and moving forward.
Health & Beauty Aids:
Although the global Cosmetics manufacturing industry is mature in most developed markets, it is also dynamic and characterized by a high degree of innovation within its luxury and prestige product lines. however, less-discretionary products (e.g. shampoo and dental floss) also make up a significant portion of total industry revenue, providing a stable basis for steady revenue growth. these two forces have shaped industry growth since its recessionary lows.
As global per capita income has risen, demand for pricey cosmetics and hair care products has grown accordingly, particularly in emerging markets. At the same time, stable demand for lower-priced everyday personal care products has provided the industry with steady underlying growth. Global industry revenue is expected to increase 0.7% in 2015. Industry average profit will likely also increase during the period to 11.3% in 2015.
operators have responded to changing consumer preferences by introducing and reformulating popular products to meet organic or all-natural standards. developing natural makeup products has been particularly technologically challenging; however, the industry’s robust investment in research and development has paid off as new technologies have emerged that eliminate some of these challenges. Products aimed at the male consumer, particularly skin-care lines, have also grown in popularity in recent years creating new exciting brand licensing opportunities.
Crude oil is a major component to many industry products, and its price will likely remain low in coming years further bolstering manufacturers’ profit margins. IBIsWorld expects industry revenue to grow 4.5% per year on average during the five years leading to 2020. Aspirational shoppers aged 15-34 in the developed countries (brand-conscious, younger consumers seeking high-end products at affordable prices) and more affluent shoppers in emerging markets (especially the BrIC countries) have particularly contributed to the growing demand for prestige product lines. As such, they choose designer cosmetics, which retail for far less than designer clothing. this trend has driven industry growth over the past five years and has encouraged the industry’s major players to license designer and celebrity brands into this space.
the BrIC countries have also supported industry growth in the same way. While these markets are not yet as powerful as those in north America and Western europe, luxury and aspirational shoppers have emerged strongly over the past five years on the emerging international level. L’oréal will generate more than 40.0% of its sales from markets outside of Western europe and north America in 2015. since both aspirational shoppers and consumers in emerging markets are particularly interested in pres-tige products, which generally carry higher margins, these trends have also contributed to industry profit growth during the past five years and consequently more licensing opportunities.
Housewares/Home Décor:
Per capita disposable income is expected to continue increasing amid declining unemployment and an improving worldwide economy. this will enable consumers to increase their spending on discretionary items, such as towels, linens and other home furnishings and engage in redecorating their homes. Because home furnishings are typically less expensive than remodeling projects, modest improvements in per capita disposable incomes have enabled consumers to release pent-up demand and per-form minor improvements on their homes. In the next five years, continued economic growth and an increase in consumer spend-ing is expected to drive the industry growth.

LIMa GLoBaL LICensInG InDUsTRY sURVeY 2015 RePoRT 21
Furthermore, as housing starts are expected to continue increasing, industry operators will benefit from new homeowners who have to furnish their homes for the first time. the home Furnishings industry is very sensitive to the level of homeownership. new home purchasers tend to purchase new items for decoration, home utility and cooking. over the five years that led to 2015, hous-ing starts in developed countries are expected to rise by a staggering average annual rate of 14.6%. the homeownership rate is expected to increase slowly over 2015. As the millennial generation approaches the age in which families typically purchase a home. many consumers within this age bracket have grown up learning how to navigate and communicate via the internet. As a result, these consumers are more likely to use the internet to purchase items to furnish their homes. Indeed, on-line sales already dominate this space. As the demographics shift and alter spending behavior among the industry’s core markets, on-line home furnishing sales are expected to increase even further.
the on-line home Furnishing sales industry has experienced astounding growth over the past decade, as consumers are increas-ingly choosing to shop on-line rather than through more traditional venues. on-line shopping has become more conventional for American, european and even Chinese consumers, primarily because of the convenience it offers and the potential savings consumers can capitalize on. In 2013 (latest data available), a reported 86.5% of all furniture and home furnishing sales in devel-oped economies were conducted through e-commerce. In other words, not only can consumers order from home or work at ease, comparing prices and finding the best deals for specific items has become a major advantage over traditional shopping at brick-and-mortar locations for this sector.
While many consumers typically wish to touch and interact with some of the products they want to purchase on-line, such as decorative accessories or kitchenware, many websites now provide informative descriptions of the products along with 3d views and generous return policies should the consumer wish to easily exchange or return an item. on-line home furnishing sales will continue to increase thanks to a continued pivot in consumer preferences over the next five-year period toward on-line shopping. rather than spending more on home furnishings in department stores or other retail outlets, consumers will increasingly turn to price-competitive options and the convenience offered on-line.
Products sold by this industry have become integrated into the lives of consumers in developed economies. As more consumers plan to furnish their homes or make modest changes to their already existing decor, industry operators have begun to design and package items efficiently in order to minimize delivery time, prevent damage and maximize the ease with which certain items can be assembled and some arrive already prebuilt. these innovations are also expected to contribute to industry growth over the next five years and also be a reason why on-line purchasing will continue to grow and be the dominant forum for home furnishing purchases.
Video Production:
the global Video Production industry suffered when disposable income dipped and stayed low due to the worldwide recession, especially in developed regions. north American audiences generate 39.0% of industry revenue, while another 23.5% of rev-enue comes from europe. however, the disposable income levels of consumers from developing, newly industrialized nations, such as the BrIC countries, are rising quickly and are expected to support industry revenue expansion. As a steadily increasing proportion of movie content is streamed through ad-supported websites, global advertising expenditure is becoming increas-ingly important for this industry. Challenges abound for this segment though as about 35.2% of on-line pirated items are movies. moreover, revenue from legal on-line purchases has not matched decreases in sales of physical video media. Advances in video equipment and storage have sped up the content creation process and are allowing for increasingly higher-resolution movies to be produced, even with a low budget. Additionally, digital file-sharing technology is cutting distribution time and costs while boosting profitability for content distributors and allowing for more timely movie releases. A string of box office hits have also led to higher revenue from downstream sales of associated merchandising via licensing and home media products, such as dVd and Blu-ray and pay-tV exhibition, especially in Western markets. In fact, Cable, satellite and pay-tV channels provide the bulk of revenue to the industry’s major players.
Music Production:
the digital revolution has created a seismic shift in the way the world consumes music, and this transition has been largely detri-mental to the global music Production and distribution industry. over the five years that led to 2015, industry revenue has fell at an annualized rate of 2.4% including a 3.6% drop during 2015. In general, many of the industry’s largest companies have been slow to leverage a crop of potential new revenue streams to properly compensate for the extreme drop in physical album sales over the past five years.
music buyers today have many avenues to consume new music content. Previously, the recording of physical albums or singles primarily shaped music production and distribution; buyers, in turn, purchased these products in brick and mortar retail outlets. In today’s environment, digital streaming service sites like spotify, soundCloud and Beatport, enable artists to record and post new music on their own and choose whether to charge listeners for it. this has enabled artists to circumvent traditional music distributors.

LIMa GLoBaL LICensInG InDUsTRY sURVeY 2015 RePoRT 22
however, increased exposure from these new music channels has benefited record labels’ music publishing divisions. In music publishing, the producers own the rights to the master recordings and collect royalties on the use of that owned music property in all media forums. music companies have been slow to come to the digital table, and their performance over the next five years hinges on their ability to embrace new technology.
the music market has changed significantly and the largest record labels must adapt to this new environment. the widespread availability of free music on the internet poses a threat to the industry. As many as 20 billion songs are shared on-line each year and have been for the past decade, but many are downloaded illegally. moreover, revenue from legal on-line purchases has not matched decreases in sales of physical media. As music retailing has moved on-line, the proportion of music purchasers that fall within the 15 to 34 age bracket increases. older generations are less inclined than younger generations to switch on-line for their music consumption.
on-line music sales now account for about 40.0% of industry revenue worldwide, a number that has been increasing as physical sales have drastically declined since the advent of the internet. nonetheless, while the Cd slowly becomes obsolete in developed nations, it is still universal in parts of the world that lack sufficient on-line infrastructure to support widespread e-commerce. the preeminence of major record labels is expected to continue weakening, as the ease of recording and distributing music enables small labels and independent artists to gain greater market share. Growing consumer demand for music will only enhance this trend. As artists continue to proliferate, so too will the chances of new brand licensing opportunities from an increasing pool of talent and music.
Publishing:
economic uncertainty over the past five years weighed down revenue growth in the global Book Publishing industry. over this period, a transition toward digital technology with e-books has created a fast growing segment. e-books, however, are difficult to price as they are inherently different from printed products. While more mature markets, like north America and europe, are undergoing some pains in their transition towards digital media, developing economies are more easily reorganizing their opera-tions to focus on digital because of the lack of a brick-and-mortar retail infrastructure.
the growth of industry revenue in these developing regions has helped offset declines suffered in north America and europe. As publishers develop efficient pricing and distribution models for these books, the industry is expected to benefit from lower production costs and higher sales volumes, as e-books are generally more affordable and more accessible for consumers. they also provide consumers with a wider selection of reading material. Another opportunity for the industry is arising from increasing disposable income and literacy rates in newly industrialized countries like Brazil, russia, India and China. disposable income and literacy growth during the next five years will support industry growth.
the increasing use of the internet will facilitate more book sales, and the convenience of e-books will also expand the overall book market and hence the number of licensing opportunities. newly industrialized countries, which tend to have relatively small book publishing industries, will post the fastest growth in e-book sales (albeit off a low base) as literacy rates, education and disposable income skyrocket. e-books are a small but rapidly growing part of the book publishing market. Content is King so licensing of established Celebrity, entertainment and music Properties into the Publishing space will feed that content pipeline and become more prevalent.
Sporting Goods:
over the past five years, the Athletic and sporting Goods manufacturing industry has experienced slow growth due to modest growth in the sports participation rate. over the past five years, the emergence of more health-conscious consumers has helped to prop up industry revenue in developed countries. As the sports participation rate rose at an estimated annualized rate of 0.4% over the five years that led to 2015, more individuals have required sporting goods. sporting goods manufacturers have been able to sell products directly to retailers, which has cut costs and preserved profit by cutting out wholesaler middlemen.
Activity abroad is increasingly becoming a factor in industry performance. many sporting goods manufacturers still rely on global producers for input commodities, such as steel and titanium metals, and industry imports are slowly comprising a larger share of domestic demand in the U.s.
to compete with global manufacturers, the industry is consolidating to lower operational costs and gain leverage to negotiate favorable supply-side contracts with retailers. many U.s. manufacturers are moving production overseas to remain competitive and take advantage of low labor cost countries. meanwhile, manufacturers that continue to produce sporting goods in the United states will need to differentiate themselves through innovation to compete with competitively priced imports.
Industry revenue is anticipated to grow at an annualized rate of 0.3% while profit is expected to grow 4.4% in 2015. As a result of more health-conscious individuals purchasing sporting goods, industry revenue is expected to increase at an annualized rate of 0.6% in the five years leading to 2020.

LIMa GLoBaL LICensInG InDUsTRY sURVeY 2015 RePoRT 23
In addition, high rates of obesity in some developed countries will likely translate to heightened healthcare expenditures. there-fore, the governments will likely invest in schools’ physical education programs to promote healthy lifestyle choices leading to more purchases of sporting goods. A good example of this is the michelle obama’s “Let’s move” and the nFL’s “Play 60” pro-grams in the Us.
Paper Products:
rebounding consumer spending and rising paper product prices have buoyed revenue for the global Paper Product manufac-turing industry over the five years to 2015. the consumption level of party novelties and decorations is mainly dependent on consumer income and population growth. Goods such as party supplies, greeting cards, posters, prints, paper doilies and place-ments are typically considered highly discretionary items. therefore, the quantity of purchased goods depends on households’ or individuals’ ability to afford the product and their willingness to spend.
the increase in low-cost imports has further reduced demand for domestically produced items. Paper wrapping products are also included in this segment. sales of wrapping paper for gifts declined over the five-year period as slow retail sales during the recession and the delayed recovery period abroad diminished segment demand. moreover, low-cost imports have increasingly targeted this product segment due to its relatively high returns. As a result, paper party supply and novelty sales declined during the recession and have been slow to recover.
materials purchases are the most significant industry cost, accounting for an estimated 47.2% of revenue as paper and paper-board are among the primary materials used in production. Yet, a trend toward using more expensive recycled materials continues to grow, leading to higher purchase expenses for operators. over the five years to 2020, industry revenue is forecast to decline at an annualized rate of 0.1% even though economic growth is expected to boost discretionary spending over the five-year period.
Consumer spending is expected to increase in 2015, representing an immediate potential opportunity for the industry as industry revenue is anticipated to rise 0.3% in 2015. But the industry will also be challenged by heightened environmental awareness which will decrease demand for disposable paper products. significant resources and energy consumption are required to produce paper products, and the quick disposal of these items has detrimental effects on the environment. Paper product manufacturers are expected to respond to these environmental concerns through technological advancements and the increased use of recycled material throughout the production process. Price-based competition, particularly from manufacturers in China, resulted in steady import growth over the five-year period, aided by the appreciation of the Us dollar. over the past decade, Us paper products, such as paper novelties, have become less competitive in the global market, with other countries opting to import from Asian competitors. the economic challenges of this product category could mitigate licensing opportunities in the immedi-ate future.
Video Games, Computer Games, Apps:
the broad Video Games industry has posted strong results following a strong return to spending on industry products over the latter half of the five-year period to 2015. While the emergence of low-cost games for mobile devices has slowed demand for other games and may continue to temper growth opportunities in the foreseeable future, industry revenue has picked up some amid stronger sales for next generation consoles and their corresponding products. As a result, 3.0% revenue growth is antici-pated in 2015.
Average annual growth of 2.4% is expected in the five-year period to 2020. Future growth expectations for the Video Games industry have been somewhat moderated, as the picture of the market for gaming on mobile platforms becomes clearer. since mobile games are sold at a much lower price points compared with traditional console and PC games, their rise may foretell a slowdown of the video game market in the United states as the consumer’s gaming time is fixed. While the recent launch of the next generation video game consoles is expected to rekindle interest in the more expensive console gaming market, the rise of the low-cost, low-margin mobile gaming market may weigh on the overall gaming market and pull revenue downward. this trend will likely cause consumers to pay, in aggregate, less per hour for their gaming entertainment.
Future growth is still expected worldwide due to an expanding population and an increased percentage that play video games. the real success in this market recently has been in used video-game sales. Gamestop is the United states’ largest used-games retailer. the age of consoles and the library of games that has been amassed over time have contributed to the popularity of used games. the business model here is selling used copies of recent games right next to new copies at a slight discount, while retail-ers capture all of the revenue of the used-copy sale. As a result, gross profit for used games is typically near 46.0%, well above the 20.0% of gross profit earned by new game sales. this poses a significant lost royalty opportunity for the licensing community. While movie retailers are prohibited from selling second-hand copies of films in the same retail space as new copies, no such protection exists within the gaming industry.

aBoUT LIMaLImA – the International Licensing Industry merchandisers’ Association – is the leading trade organization for the global licensing industry, celebrating its 30th anniversary this year. LImA’s mission is to foster the growth and expansion of licensing around the world, raise the level of professionalism for licensing practitioners, and create greater awareness of the benefits of licens-ing to the business community at large. the Association maintains offices in new York, London, munich, tokyo, hong Kong, mexico City and melbourne, with representatives in India, Italy, Korea, spain, turkey and the middle east. members in over 35 countries enjoy access to an array of benefits, including LImAnet – licensing’s interactive, global directory – extensive educational pro-gramming, worldwide networking events, and Inside Licensing, with the latest in news, deals and trends. LImA is the exclusive sponsor of Licensing expo, the industry’s largest trade event, in addi-tion to shows in London, hong Kong and shanghai. Visit www.licensing.org for more information and to utilize licensing’s definitive online resource.
LIMa offICes
HEAD OFFICECharles riotto, President
350 Fifth Avenue • suite 4019 • new York, nY 10118 • UsA tel: +1 212 244 1944 • Fax: +1 212 563 6552
LIMA AUSTRALIAtony Bugg, managing director
email: [email protected]
LIMA CHINAtani Wong, managing director
email: [email protected]
LIMA GERMANYheike Winner, managing director
email: [email protected]
LIMA JAPANKaori taniguchi, General manager
email: [email protected]
LIMA UKKelvyn Gardner, managing director
email: [email protected]

350 fifth avenue, suite 4019, new York, nY 10118Telephone: 212 244 1944 • fax: 212 563 6552 • email: [email protected] • www.licensing.org
new YoRK • LonDon • MUnICh • ToKYo • honG KonG • MeLBoURne • MeXICo CITY