Light Water Reactor Sustainability Program Framework for Structural Online Health Monitoring of

INL/EXT-14-33124 Revision 0
Light Water Reactor Sustainability Program
Diagnostic and Prognostic Models for Generator Step-Up Transformers
September 2014
U.S. Department of Energy
Office of Nuclear Energy

DISCLAIMER
This information was prepared as an account of work sponsored by an agency of the U.S. Government. Neither the U.S. Government nor any agency thereof, nor any of their employees, makes any warranty, expressed or implied, or assumes any legal liability or responsibility for the accuracy, completeness, or usefulness, of any information, apparatus, product, or process disclosed, or represents that its use would not infringe privately owned rights. References herein to any specific commercial product, process, or service by trade name, trade mark, manufacturer, or otherwise, does not necessarily constitute or imply its endorsement, recommendation, or favoring by the U.S. Government or any agency thereof. The views and opinions of authors expressed herein do not necessarily state or reflect those of the U.S. Government or any agency thereof.

INL/EXT-14-33124 Revision 0
Diagnostic and Prognostic Models for Generator Step-Up Transformers
Vivek Agarwal, Nancy J. Lybeck, and Binh T. Pham
September 2014
Idaho National Laboratory Idaho Falls, Idaho 83415
http://www.inl.gov
Prepared for the
U.S. Department of Energy Office of Nuclear Energy
Under DOE Idaho Operations Office Contract DE-AC07-05ID14517

(This page intentionally left blank)

v
ABSTRACT
The online monitoring of active components project, under the Advanced Instrumentation, Information, and Control Technologies Pathway of the Light Water Reactor Sustainability Program, researched diagnostic and prognostic models for generator step-up transformers (GSUs). Idaho National Laboratory (INL) worked with subject matter experts from the Electric Power Research Institute (EPRI) to augment and revise the GSU fault signatures previously implemented in the Asset Fault Signature Database of EPRI’s Fleet-Wide Prognostic and Health Management (FW-PHM) Suite software. The revised set of GSU fault signatures is presented in this report.
Two GSU prognostic models for the paper winding insulation, the Chendong and Institute of Electrical and Electronic Engineers (IEEE) thermal models were implemented in the Remaining Useful Life Database of the FW-PHM Suite. The Chendong model is based on the functional relationship between the degree of polymerization of the winding insulation and the 2-Furaldehyde concentration in the insulating oil. Degree of polymerization is one of the most commonly used metrics to assess the health of a transformer. The IEEE thermal model is based on thermal profiling of the transformer. By utilizing transformer load information and ambient temperature, established thermal models are used to estimate the hot spot temperature inside the transformer, which in turn is used to compute transformer winding insulation lifetime.
The estimation of remaining useful life of transformer winding insulation using both prognostic models was demonstrated at the 2014 Joint Summer Utility Working Group and EPRI Strategy Group on Productivity Meeting in Idaho Falls, Idaho.

vi
(This page intentionally left blank)

vii
SUMMARY As nuclear power plants (NPPs) continue to age and their components degrade, it is important to
understand their condition and be proactive in maintenance and replacement in order to improve plant reliability and productivity, and to reduce operational cost. The current maintenance practices at NPPs result in high maintenance costs and increased likelihood of human error. Additionally, the inability to identify developing faults can lead to either unexpected component failure and/or forced outage. Implementation of advanced predictive online monitoring (OLM) would minimize these concerns and enhance plant safety, reliability, and productivity by enabling plant maintenance engineers to diagnose incipient faults and estimate the remaining useful life (RUL) of assets.
The U.S. Department of Energy’s Office of Nuclear Energy funds the Light Water Reactor Sustainability (LWRS) Program to develop the scientific basis for extending the operation of commercial light water reactors beyond the current 60-year license period. The program is operated in collaboration with the Electric Power Research Institute’s (EPRI’s) research and development (R&D) efforts in the Long-Term Operations (LTO) Program. The LTO Program is managed as a separate technical program operating in the Plant Technology Department of the EPRI Nuclear Power Sector with the guidance of an industry advisory integration committee. Both the LWRS and LTO programs work closely with nuclear utilities to conduct R&D in technologies that can be used to ensure long-term reliability, productivity, safety, and security of aging light water reactors.
Under the Advanced Instrumentation, Information, and Control Technologies Pathway of the LWRS Program, the OLM of active components project at Idaho National Laboratory (INL) focuses on research, development, and implementation of diagnostic and prognostics models for generator step-up transformers (GSUs) and emergency diesel generators (only diagnostic models were developed in case of emergency diesel generators). EPRI is leading the effort to achieve the project objective in collaboration with INL, using EPRI’s Fleet-Wide Prognostic and Health Management (FW-PHM) Suite software (version 1.2.0) for predictive OLM of active assets in the nuclear industry. The FW-PHM Suite software is an integrated suite of web-based diagnostic and prognostic tools and databases that allows maintenance staff to perform diagnosis and prognosis at different hierarchical levels, from the component level to the plant level, across a fleet of power units.
In the fiscal year 2014, INL performed the following research activities:
• Development and implementation of additional GSU fault signatures (diagnostic models) in the FW-PHM Suite software
• Validation of implemented GSU fault signatures by subject matter experts from EPRI
• Identification of Type II prognostic models to estimate GSU winding insulation lifetime
• Implementation of two GSU prognostic models, i.e., RUL signatures, in the RUL Database of the FW-PHM Suite to allow estimation of GSU winding insulation lifetime by the RUL Advisor
• Demonstration of the prognostic capability of the FW-PHM Suite software at the Joint Summer Utility Working Group and EPRI Strategy Group on Productivity Meeting Idaho Falls, Idaho.
Aging of transformer winding insulation is an important concern in the asset management of transformers. The actual state of the insulation in the transformer can only be determined by a tear-down inspection. However, the state of the winding insulation can be inferred from knowledge of parameters or stressors that are correlated to the insulation degradation. Two GSU prognostic models, the Chendong and IEEE thermal models have been implemented in the RUL Database of the FW-PHM for insulation lifetime prediction. The Chendong model is based on the functional relationship between the degree of polymerization and 2-Furaldehyde (2FAL) concentration in the insulating oil. The IEEE thermal model is based on thermal profiling of the transformer. By utilizing transformer load information, established

viii
thermal models are used to estimate the hot spot temperature inside the transformer, which in turn is used to compute transformer winding insulation lifetime.
In fiscal year 2015, INL plans on the following research activities:
• Expand implementation of prognostic models for GSUs (or other relevant active components, such as electric motors) in collaboration with EPRI and partner utilities
• Research the development of meaningful uncertainty estimates for RUL models.

ix
ACKNOWLEDGMENTS
This report was made possible through funding by the U.S. Department of Energy (DOE) Light Water Reactor Sustainability (LWRS) Program. We are grateful to Richard Reister of the DOE and Bruce Hallbert, Kenneth Thomas, and Kathryn McCarthy of the Idaho National Laboratory (INL) for championing this effort. We thank Richard Rusaw (EPRI) for providing the FW-PHM Suite Software and recognize his efforts in leading this project. We acknowledge Jeff Greene (EPRI) for coordinating the fault validation efforts with subject matter experts at EPRI. We thank Bhavin Desai and Wayne Johnson (EPRI) for their time and efforts validating the generator step-up transformer fault signatures. We are grateful to Randy Bickford and Rahul Palnitkar (Expert Microsystem, Inc.) and Kirk Fitzgerald (INL) for providing technical support for the FW-PHM Suite. We also thank Heather Medema (INL) for her editing support.

x
(This page intentionally left blank)

xi
CONTENTS
ABSTRACT .................................................................................................................................................. v
SUMMARY ................................................................................................................................................ vii
ACKNOWLEDGMENTS ........................................................................................................................... ix
ACRONYMS ............................................................................................................................................. xiii
1. INTRODUCTION .............................................................................................................................. 1
2. FLEET-WIDE PROGNOSTIC AND HEALTH MANAGEMENT SUITE SOFTWARE .............. 3 2.1 Asset Fault Signature Database ................................................................................................ 3 2.2 Diagnostic Advisor .................................................................................................................. 3 2.3 Remaining Useful Life Database ............................................................................................. 4 2.4 Remaining Useful Life Advisor ............................................................................................... 4
3. FAULT SIGNATURE VALIDATION .............................................................................................. 5
4. PROGNOSTIC MODELS FOR AGING TRANSFORMER WINDING INSULATION ............... 6 4.1 Transformer Winding Insulation Degradation ......................................................................... 6 4.2 Chendong Model ...................................................................................................................... 7
4.2.1 Degree of Polymerization ........................................................................................... 8 4.2.2 Correlation between 2FAL and DP ........................................................................... 10 4.2.3 Remaining Useful Life .............................................................................................. 13
4.3 IEEE Thermal Life Consumption Model ............................................................................... 13 4.3.1 Hot Spot Temperature Calculation............................................................................ 13 4.3.2 Remaining Useful Life .............................................................................................. 18
5. IMPLEMENTATION IN FW-PHM ................................................................................................ 19 5.1 Implementation of the Chendong Model ............................................................................... 19 5.2 Implementation of the IEEE Thermal Life Consumption Model .......................................... 21
6. SUMMARY AND FUTURE PLANS .............................................................................................. 26
7. REFERENCES ................................................................................................................................. 28
APPENDIX A ............................................................................................................................................. 30
APPENDIX B ............................................................................................................................................. 31

xii
FIGURES Figure 1. Data flow in the EPRI FW-PHM Suite (EPRI 2011b). ................................................................. 3
Figure 2. FW-PHM Suite main page. ........................................................................................................... 4
Figure 3. Formation of furanic compounds in oil over a period of time under normal operating conditions (Emsley et al., 2000a). ................................................................................................ 8
Figure 4. Percentage change of 2FAL in oil at 100oC – 160oC in interval of 20oC. ..................................... 9
Figure 5. Concentration of 2FAL in non-inhibited oil with presence of oxygen and with absence of oxygen (Kachler and Hohlein, 2005). .................................................................................... 10
Figure 6. 2FAL formation at low oxygen and water in oil and at high oxygen and water in oil (Emsley et al., 2000b). ................................................................................................................ 10
Figure 7. A functional relationship between 2FAL concentration in oil and degree of polymerization over time. .......................................................................................................... 11
Figure 8. Example of actual and equivalent load cycle (IEEE 2012). ........................................................ 14
Figure 9. Model type definition for the Chendong Model. ......................................................................... 19
Figure 10. Tech exam definition for 2-Furaldehyde concentration. ........................................................... 20
Figure 11. RUL signature for the Chendong model. ................................................................................... 20
Figure 12. RUL estimate for the GSU transformer based on the Chendong model. .................................. 21
Figure 13. Model type definition for the IEEE life consumption model. ................................................... 21
Figure 14. Tech exam definition for current usage. .................................................................................... 22
Figure 15. Tech exam definition for transformer load. ............................................................................... 22
Figure 16. Tech exam definition for ambient temperature. ........................................................................ 23
Figure 17. RUL signature for IEEE life consumption model. .................................................................... 24
Figure 18. Load and ambient temperature profiles. .................................................................................... 25
Figure 19. RUL estimate for the GSU transformer based on the IEEE life consumption model. .............. 25
TABLES Table 1. GSU systems and associated fault signatures. ................................................................................ 5
Table 2. DP and 2FAL correlation (Abu-Siada, 2011). .............................................................................. 12
Table 3. Constants for viscosity calculation. .............................................................................................. 15
Table 4. GSU cooling modes. ..................................................................................................................... 16
Table 5. Exponents used in temperature determination equations. ............................................................. 17
Table 6. Example parameter values for hot spot temperature calculations for a 187 MVA transformer. ................................................................................................................................. 18
Table 7. Per unit life and aging acceleration factor at various winding hot spot temperatures. ................. 18
Table 8. Numeric parameter inputs to the IEEE thermal model as implemented in FW-PHM. ................. 24

xiii
ACRONYMS ACF Acetylfuran
AFS Asset Fault Signature
CO carbon monoxide
CO2 carbon dioxide
DP degree of polymerization
EPRI Electric Power Research Institute
FAL furaldehyde
FOL Furfurol
FW-PHM Fleet-Wide Prognostic and Health Management
FY fiscal year
GSU generator step-up transformer
HMF hydroxymethyl-2-furaldehyde
HTHC High-Temperature Hydrocarbons (mineral oil alternative)
IEC International Electrotechnical Commission
IEEE Institute of Electrical and Electronics Engineer
IFT interface tension
INL Idaho National Laboratory
LTO Long-Term Operations (Program)
LWRS Light Water Reactor Sustainability (Program)
MEF Methyl-2-Furaldehyde
MILS millimeters
MVA megavolt amperes
NPP nuclear power plant
ODAF oil directed and air forced
ODWF oil directed and water forced
OFAF oil forced and air forced
OLM online monitoring
ONAF oil natural and air forced
ONAN oil natural and air natural
PPM parts per million
R&D research and development
RUL remaining useful life
XML extensible markup language

xiv
(This page intentionally left blank)

1
1. INTRODUCTION More than two-thirds of the existing commercial nuclear power plants (NPPs) have received license
extensions to 60 years from the original 40-year license. As the fleet of NPPs in the United States continues to age, it is important to understand the condition of their aging components and be proactive in maintenance and replacement. The current practice of periodic and condition-based maintenance at NPPs could result in high repairs costs, primarily due to unexpected component failure and forced outage. Implementation of advanced predictive online monitoring (OLM) would enable plant maintenance engineers to diagnose incipient faults and estimate the remaining useful life (RUL) of their assets. Knowledge of asset health gained from predictive OLM would help in optimizing maintenance activities, ultimately leading to maintenance cost reduction.
The U.S. Department of Energy’s Office of Nuclear Energy funds the Light Water Reactor Sustainability (LWRS) Program to develop the scientific basis for extending the operation of commercial light water reactors beyond the current 60-year license period. The program is operated in collaboration with the Electric Power Research Institute’s (EPRI’s) research and development (R&D) efforts in the Long-Term Operations (LTO) Program. The LTO Program is a separate technical program in the Plant Technology Department of the EPRI Nuclear Power Sector, which is guided by an industry advisory integration committee. Both the LWRS and LTO programs work closely with nuclear utilities to conduct R&D in technologies that can be used to ensure long-term reliability, productivity, safety, and security of aging light water reactors.
Implementation of predictive OLM of essential assets in the existing fleet of NPPs is supportive of the long-term objective of both the LWRS and LTO programs. Predictive (also known as proactive) maintenance requires predicting the future operating state of an asset based on the current state and historic operating conditions. For example, the consequence of running a transformer for an extended period with a high oil temperature is an unacceptable loss of dielectric strength of the insulating oil. Accurate estimation of a transformer’s RUL accounting for high temperature operating conditions would help maintenance staff take appropriate actions to prevent costly unplanned outage. Taking the lead in predictive OLM research, EPRI has developed the Fleet-Wide Prognostic and Health Management (FW-PHM) Suite software (currently at version 1.2.0) for predictive OLM of assets in the power industry. The FW-PHM Suite software is an integrated suite of web-based diagnostic and prognostic tools and databases that enables maintenance staff to perform diagnosis and prognosis at different hierarchical levels, from the component level to the plant level, across a fleet of power units.
During fiscal year (FY) 2013, INL performed a content development exercise including implementation of technical examinations, fault features, and fault signatures in the FW-PHM Database for generator step-up transformers (GSUs) and emergency diesel generators. The fault signatures were created as a result of working closely with subject matter experts from industry, partner utilities, EPRI, and EPRI’s partners/subcontractors. The culmination of the work in FY 2013 was a live demonstration of the diagnostic capacity of the FW-PHM Suite for GSUs and EDGs (Agarwal et al., 2013). Along the way, extensive beta testing of the FW-PHM Suite software was completed.
In continuation of previous efforts, the focus in FY 2014 has been augmenting and validating GSU fault signatures, and researching prognostic models applicable to a GSU in order to demonstrate the prognostic capability of the FW-PHM Suite. Together, the diagnostic and prognostic capabilities of the FW-PHM Suite can be used to provide a complete assessment of the operating condition of the transformer. Knowledge of degradation mechanisms and their indicators is needed to create prognostic models that predict the RUL of the asset based on its operating history and projected operating conditions. Transformer paper winding insulation degradation is one of the most common limiting factors to transformer life expectancy. Temperature is one of the primary stressors that contribute to insulation aging. Paper insulation degradation produces chemical byproducts that can be detected in the oil and used to determine the health of the insulation.

2
Two prognostic models for transformer paper winding insulation degradation were researched and implemented in the FW-PHM Suite. The Chendong model estimates degree of polymerization of the transformer winding insulation based on the concentration level of 2-Furaldehyde (2FAL), measured by oil analysis. The IEEE thermal life consumption model estimates the hot spot temperature in the insulation at a given transformer load and ambient temperature. RUL is then calculated based on the degree of polymerization or hot spot temperature, respectively. The prognosis capability of the FW-PHM Suite software was demonstrated at the 2014 Summer Utility Working Group meeting, which was held in Idaho Falls, Idaho. In the demonstration, INL researchers along with EPRI showed the prognostic capability of the FW-PHM to predict the RUL of a GSU using both the Chendong and IEEE thermal life consumption models.
The project progress and status of research activities for FY 2014 are presented in this report. A brief introduction to the FW-PHM Suite is presented in Section 2. Section 3 briefly summarizes the fault signature validation efforts for the GSU transformer. The RUL models based on insulation degradation are described in Section 4. Implementation of the prognostic models in the FW-PHM Suite is presented in Section 5. The status of the pilot project and future research are provided in Section 6. For the purposes of this report, the term insulation refers to “transformer winding paper insulation” unless otherwise stated.

3
2. FLEET-WIDE PROGNOSTIC AND HEALTH MANAGEMENT SUITE SOFTWARE
The FW-PHM Suite software is an integrated suite of web-based diagnostic and prognostic tools and databases, developed for EPRI by Expert Microsystems, specifically designed for use in the commercial power industry (for both nuclear and fossil fuel generating plants). The FW-PHM Suite serves as an integrated health management framework, as shown in Figure 1, managing the functionality needed for a complete implementation of diagnostics and prognostics (Lybeck et al., 2011). The FW-PHM Suite consists of four main modules: the Diagnostic Advisor, the Asset Fault Signature (AFS) Database, the RUL Advisor, and the RUL Database. The FW-PHM Suite has the capability to perform diagnosis and prognosis at different hierarchical levels, from the component level to the plant level, across a fleet of power units.
Figure 1. Data flow in the EPRI FW-PHM Suite (EPRI 2011b).
2.1 Asset Fault Signature Database The AFS Database organizes fault signatures collected from the many EPRI member utilities. At the
most basic level, fault signatures are comprised of an asset type, a fault type, and a set of one or more fault features (symptoms) that are indicative of the specified fault. Each installation of the software has two separate database schemas: the master database maintained and distributed by EPRI, and a local database containing data developed at the plants or fleet monitoring center. Locally developed information can be exported and sent to EPRI for evaluation and possible inclusion in the master database that is shared amongst EPRI members. The AFS Database is populated via a content development exercise described in (Agarwal, 2013).
2.2 Diagnostic Advisor The Diagnostic Advisor identifies possible faults by comparing asset fault signatures with operating
data. The Diagnostic Advisor is expected to be used on a daily or other periodic basis by technicians who are monitoring the health of a specific asset in the plant. Using either online data sources or information entered manually, the Diagnostic Advisor presents the likely faults (if any), and, when appropriate, recommends additional tests that might be used to discriminate amongst possible faults. The Diagnostic Advisor is expected to streamline the diagnosis process by helping the technician focus efforts on the most likely faults and possible causes based on the operating behavior of the system.

4
2.3 Remaining Useful Life Database The RUL Database organizes asset RUL signatures (i.e., models) collected from across the industry.
At the most basic level, a RUL signature is comprised of an asset type, a model type, and model calibration parameters. The model type definition includes definition of the input variables needed to run the model. Subject matter experts from the power industry, EPRI, and EPRI’s partners/subcontractors will most likely develop RUL signatures. Figure 2 shows the modules available in the FW-PHM Suite software.
2.4 Remaining Useful Life Advisor The RUL Advisor calculates RUL for an asset based on the model type, model parameters, input
process parameters, and diagnostic information (from the Diagnostic Advisor). The engineering staff and plant management who plan long-term corrective or replacement actions would use the RUL Advisor.
Figure 2. FW-PHM Suite main page.
The FW-PHM Suite uses fault signatures as a structured representation of the information that an expert would use to first detect and then verify the occurrence of a specific type of fault (EPRI, 2012). A fault describes a particular mode of degradation that can be detected by analysis of plant information before the asset fails to meet a service requirement. Implied is an assumption that the fault is detectable by analysis of plant information and that the analysis can be performed in time to prevent or otherwise remedy the fault condition before it becomes a failure condition.
Diagnostic fault signatures are developed for application to a specific type of asset and are therefore organized with reference to that type of asset. However, it is desirable to specify fault signatures as broadly as possible to be used in the entire industry. Many of the fault signatures defined in this research can be applied to comparable assets used in similar service environments.

5
3. FAULT SIGNATURE VALIDATION EPRI has initiated a FW-PHM Suite Software User’s Group to develop content for the AFS Database
in the FW-PHM Suite. The goal of the User’s group is to develop fault signatures for several key active components in NPPs. INL is responsible for developing content for the GSU transformer. Content management for the asset fault signatures is provided by EPRI.
During FY13, seven fault signatures were implemented in the FW-PHM Suite for the GSU transformer based on a knowledge transfer exercise with Duke Energy and available literature (Agarwal et al., 2013). Fault signatures for a specified asset must include, at a minimum, a fault description and associated fault features. Fault features represent a unique state of one or more parameters indicating a faulty condition; these parameters come from technical examinations of the asset.
Based on input from EPRI, the fault signatures for GSUs were expanded to include the major diagnostics listed in Chapter 9 of EPRI’s copper book (EPRI, 2011). Table 1 lists 12 additional fault signatures implemented for GSU systems.
Table 1. GSU systems and associated fault signatures. GSU System Fault Signature Insulating Oil Pump Cavitation
Excessive leakage Improper rotation
Insulating Oil Pump Motor Loss of performance Load Changer Contact binding/Uneven wear
Contact overheating/Choking Radiator Blocked radiator Radiator Fan Structural degradation Radiator Fan Motor Fail to operate
Improper rotation Performance degradation
Tap Changer Drive Mechanism & Controls (not applicable to GSU but applicable to other transformer types)
Erratic operation
INL interacted several times with EPRI subject matter experts on transformers to vet the fault
signatures. Each signature was evaluated for its utility, and the effectiveness of each technical examination was reassessed. The final set of fault signatures delivered to EPRI and Expert Microsystems for evaluation before inclusion in the master database contained in APPENDIX B.

6
4. PROGNOSTIC MODELS FOR AGING TRANSFORMER WINDING INSULATION
Aging of transformer winding insulation is an important concern in the asset management of transformers. High-voltage power transformer conductor windings are insulated by a combination of cellulose paper and an insulating mineral oil, and are expected to operate reliably for up to 40 years. The composition of insulation grade paper is approximately 90% cellulose, 6-7% hemicellulose and 3-4% lignin. The natural humidity of paper is 4-5% by weight, and the insulation is dried after winding to less than 0.5%. The dried paper is impregnated with mineral oil, which increases its dielectric strength and also serves to cool the windings (Emsley, 1994). Cellulose is a natural polymer of glucose and degrades slowly as the polymer chains break down during service, releasing degradation products that dissolve in the insulating oil.
4.1 Transformer Winding Insulation Degradation There are several factors that contribute to transformer winding insulation aging. Among all factors,
temperature is generally the most important factor contributing to winding insulation aging; temperature influences not only the aging of the paper, but also aging of the oil. It is commonly accepted that mineral oil impregnated cellulose in insulation ages with time and the aging doubles for every 6-8ºC increase in temperature (Lundgaard, 2008). Electric load losses occur primarily in the transformer windings, causing thermal stress in multiple transformer components. This leads to aging and decomposition of paper insulation material and cellulose. As the paper insulation ages, it loses some of its mechanical strength, becoming more susceptible to tearing or bursting under stress caused by through-faults or vibrations of the operating transformer. Once mechanical damage of the insulation has occurred, movement of the conductors is likely, resulting in changing voltage stresses and electrical discharge. These eventually could lead to catastrophic failure in the transformer.
The three mechanisms that lead to transformer winding insulation degradation are oxidation, hydrolysis and thermolysis. Thermolysis is predominant at temperatures above 120°C, which are usually limited to local defects (e.g., winding hot spot). The degradation mechanisms are described as follows (IEEE 2012):
• Oxidative degradation – a reaction between cellulose molecules and oxygen that produces moisture and weakens the glycosidic bonds of cellulose molecule
• Hydrolytic degradation – a reaction between cellulose molecules and water that produces free glucose, carbon monoxide (CO), and carbon dioxide (CO2)
• Thermal degradation – a chemical reaction caused by heat breaking glycosidic bonds and opening glucose rings. This reaction also produces moisture, CO, and CO2.
The mechanisms described above break and weaken cellulose molecules in paper insulation, leading to reduction of its degree of polymerization (DP). Each split in the cellulose chain liberates a glucose monomer, which undergoes further chemical reaction and becomes one of several furanic compounds (Chiem et al., 2012). When moisture or oxygen are present in the insulation, the activation energy of the chemical reaction in hydrolysis is reduced (Hohlein and Kachler, 2005), causing degradation leading to accelerated insulation decomposition even at 70°C. Degradation also releases larger molecules such as 2FAL, which can be detected in the oil and could give a more specific indication of the condition of the paper. The formation of 2FAL content in the insulating oil lowers the average DP of the paper which in turn leads to loss of tensile strength of the paper, making transformer insulation more susceptible to physical damage.
The DP value of the insulating paper is considered to be the most reliable approach in determining the condition of transformer insulation. However, direct measurement of DP requires taking the transformer

7
out of service. Therefore, degradation of aged insulation is assessed by detection of oil-soluble decomposition products. These include CO, CO2, methanol, and furan.
Carbon monoxide and Carbon dioxide are mainly produced by the oxidation of paper under normal operation (CIGRE, 2009). The concentration of CO and CO2 in oil cannot be used to directly predict the paper’s RUL, but can be used as an indication of an overheating fault. According to the IEC Standard (1999), a ratio of CO2 to CO less than 3 indicates a sudden increase in CO production due to abnormal paper aging. The practical use of CO and CO2 could be argued in three aspects. First, CO and CO2 are not only produced by cellulose paper. Oil oxidation also produces significant amounts of CO and CO2, which makes them imperfect candidates as indicators of insulation condition (CIRGE, 2009). Second, the concentrations of CO and CO2 produced are unstable (De Pablo and Mollmann, 1996). Third, at elevated temperatures, the diffusion rate of CO from paper to oil is higher, which will result in a misleadingly high concentration of measured CO (Shahsiah et al., 2007). As a consequence, a false alarm could possibly be triggered leading to an inaccurate assessment of the cellulose paper’s condition.
Methanol is only produced by cellulose paper aging and is regarded as a possible candidate for assessment of insulation aging (Jalbert et al., 2012). The study of methanol as an aging indicator is in the beginning phases of R&D; there is not enough field experience to guide transformer operation and maintenance. Laboratory aging experiments show the kinetics governing the formation of methanol is similar to furan. At a higher DP range (between 1,200 and 700) the concentration of methanol has been found to be higher than furan, which makes methanol a good indicator to detect early aging (Schaut et al., 2011). However, methanol in field transformer oil is also subject to migration between paper and oil, similar to furan, which complicates its application as percentage of migration for different temperature ranges has not been established (Schaut et al., 2011).
Furans are one of the most important age-related by-products of cellulose paper aging. The study of furan formation dates back to 1980 (Burton et al., 1988). It has been shown by aging experiments that no furan is produced in a blank oil sample (i.e., oil with no paper insulation). When a cellulose chain breaks down during paper aging, the chain liberates a glucose monomer, which undergoes a further chemical reaction to form furanic compounds (Cheim et al., 2012). Therefore, furan concentration is directly related to insulation paper degradation.
Furans are rapidly produced during paper pyrolysis at very high temperatures. At typical transformer operating temperatures, the primary mechanism of furan formation is paper hydrolysis (Hohlein and Kachler, 2005). Five main furanic compounds have been identified in transformer insulating oil, namely 2-Furaldehyde (2FAL), 2-Acetylfuran (2ACF), 5-Methyl-2-Furaldehyde (5MEF), 2-Furfurol (2FOL), and 5-hydroxymethyl-2-furaldehyde (5HMF).
The actual state of the insulation in the transformer can only be determined by a tear-down inspection. However, the state of the insulation can be inferred from knowledge of parameters or stressors correlated with insulation degradation. Two prognostic models are presented in detail here for insulation life prediction. The Chendong model exploits the release of furanic compounds, estimating DP based on 2FAL, and then predicting remaining useful life. The IEEE thermal model estimates hot spot temperatures based on transformer loading and ambient temperatures, and uses the hot spot temperature to estimate life consumption. Both the Chendong and thermal models are considered life consumption models.
4.2 Chendong Model The thermal loads occurring during operation principally determine the operational life span of a
transformer, and insulation paper degradation is critical in determining the ultimate life of the insulation system. No satisfactory life prediction methodology for paper insulation in transformer windings is available to date, as disagreement on what constitutes an end-of-life criterion exists. Among different life prediction methodologies, measuring the DP value of the insulating paper is considered to be the most

8
reliable approach in determining transformer insulation life. In addition, it is agreed a 50% loss of mechanical strength is often quoted as the limiting condition (Emsley and Stevens, 1994).
4.2.1 Concentration of Furanic Compounds in Aging Insulation Oil Among all oil-soluble decomposition products, 2FAL is the main derivative of the furanic
compounds. In (Emsley et al., 2000a), an aging experiment in a sealed tube has shown that concentration of 2FAL is highest among the five furanic compounds identified above. Figure 3 clearly shows that the concentration of 2FAL is significantly higher than the concentrations of 2FOL, 2ACF, and 5MEF produced by Kraft paper at 140ºC. The concentration of 5HMF is not shown here because it was extremely unstable and was only present during an early stage of aging. Similar results have been obtained during aging experiments on a transformer prototype for over 1,000 hours under a defined load pattern, in which the concentration of 2FAL at the end of the experiments has reached the magnitude of almost 8×10⁴ ppb (parts-per-billion, 109), whereas the concentrations of other four members are lower than 5,000 ppb (Pradhan, 2006).
Looking at the stability of the furanic compounds within the temperature range of 100 to 160ºC, the concentrations of 2FAL, 2ACF, 5MEF, and 5HMF are stable up to 120ºC and will decrease slowly at higher temperatures due to evaporation. 2FOL is an exception that degrades rapidly with time (Emsley et al., 2000a). Further investigation has confirmed the evaporation of furans occurs significantly at temperatures higher than 160ºC (except for 2FOL which evaporates at much lower temperatures). The degradation of furans can be further catalyzed by the presence of metal ions in oil. In (Cheim et al., 2012) it is summarized that furans are ranked according to stability as 2ACF ≈ 5MEF > 2FAL > 5HMF > 2FOL.
Due to the highest concentration among all family members and its relatively high stability, 2FAL has been widely chosen for use as a cellulose paper-aging indicator.
Figure 3. Formation of furanic compounds in oil over a period of time under normal operating conditions (Emsley et al., 2000a).
As 2FAL is a byproduct of cellulose paper aging, its formation is dependent on several factors. Emsley et al., (2000a, 200b) and Heywood et al., (2000) have pointed out the factors that have major impact on 2FAL formation are temperature, oxygen, and water.

9
Temperature is the most obvious factor in the formation of 2FAL as seen in Figure 4. The formation of 2FAL has been studied in numerous aging experiments at temperatures from 70ºC to 180ºC. It is noticed 2FAL will evaporate at 160ºC and above (Emsley et al., 2000a, Soares et al., 2001).
Oxygen has a strong triggering effect on 2FAL formation (De Pablo and Mollmann, 1996, Emsley et al., 2000a, De Pablo and Pahlavanpour, 1997). An aging experiment performed at 120ºC reveals the presence of oxygen accelerates 2FAL formation by a factor of four (De Pablo and Pahlavanpour, 1997). Also, even at a lower temperature of 85ºC, if oxidation dominates the paper-aging process over other mechanisms, accelerated formation of 2FAL is observable. Figure 5 shows the concentration of 2FAL reaches 3.5ppm (parts-per-million, 106) after 5 months with the presence of air in non-inhibited oil, which is significantly higher than the 2FAL concentration level in the absence of air in non-inhibited oil, i.e., 0.5ppm.
The formation of 2FAL is significant when the paper has high water content. In the aging experiment under 120oC, paper containing 8% water would produce 2FAL with a concentration level three times higher than the paper containing 0.2% water (De Pablo and Pahlavanpour, 1997).
In free-breathing transformers with oil conservators, both oxygen and water could accumulate within the oil-paper insulation system. Under this circumstance the concentration of 2FAL in oil is expected to be high, i.e., approximately eight times more than the transformer with low oxygen and water accumulation in the oil-paper insulation system (De Pablo and Pahlavanpour, 1997). The effect of oxygen and water on 2FAL formation is shown in Figure 6.
Figure 4. Percentage change of 2FAL in oil at 100oC – 160oC in interval of 20oC.

10
Figure 5. Concentration of 2FAL in non-inhibited oil with presence of oxygen and with absence of oxygen (Kachler and Hohlein, 2005).
Figure 6. 2FAL formation at low oxygen and water in oil and at high oxygen and water in oil in parts per billion (ppb) (Emsley et al., 2000b).
4.2.2 Aging Based on Correlation between 2FAL and Degree of Polymerization Degree of polymerization has traditionally been used as the primary indicator of the condition of
insulation paper in transformers. The paper insulation deteriorates with age, leaving the insulation vulnerable to stresses generated by thermal, mechanical, and electrical transients, as discussed previously. A lowering of the DP corresponds to scission of cellulose chains (a chemical breakdown reaction), thereby reducing mechanical strength of the paper. When the DP falls below ~250, the paper is weak and

11
brittle (fresh paper has a DP of 1100-1200). Many studies have attempted to relate paper strength to its DP and to define an acceptable limit in that manner. Examples of paper insulation with DP value as low as 150 have been found in operating transformers (Emsley and Stevens, 1994; CIGRE, 2009). Experimental studies suggest that the DP value varies along the length of the transformer winding. Therefore, it is important to consider an average DP value over the length of the transformer winding (Emsley and Stevens, 1994).
Use of DP for life prediction has limited accuracy as rate of degradation depends on type of paper, temperature (the rate of degradation increases with temperature), and moisture. In addition, a nonlinear functional relationship exists between tensile strength and DP value. Despite these limiting factors, DP is still commonly used to estimate insulation age when the effects of actual material property and operating condition are accounted for properly in the model calibration effort. DP of transformer insulation can be inferred by non-intrusively measuring the concentration of dissolved byproducts in the insulating oil. The functional relationship between the DP value and the 2FAL concentration level is shown in Figure 7.
Several mathematical models have been developed based on the observed relationship between DP value and the 2FAL concentration. One of the most widely used models is the Chendong model (Chendong, 1991). The model in Equation (1) is based on a series of data collected from transformers with normal Kraft insulation paper and a free-breathing conservator. In order to explain the relationship between 2FAL content and DP, Chendong performed a regression analysis on collected data to obtain the following expression
log(2𝐹𝐴𝐿) = 1.51 − 0.0035𝐷𝑃 (1)
The calculation shows a linear dependence relation between the DP value and the logarithm of 2FAL concentration level is satisfied. The DP of insulating paper directly reflects the transformer insulation age, as given in Table 2. Although the measurement of 2FAL concentration level from an oil sample is relatively simple, the interpolation is complex because more than one aging mechanism effects the formation of 2FAL compounds in the oil. Nevertheless, Equation (1) can be applied to approximate the average DP of insulating paper and estimate the aging level for the transformer insulation winding.
Figure 7. A functional relationship between 2FAL concentration in oil and degree of polymerization over time.

12
Table 2. DP and 2FAL correlation (Abu-Siada, 2011). 2FAL (ppm) DP Value Significance
0 – 0.1 1200 – 700 Healthy insulation 0.1 – 1.0 700 – 450 Moderate deterioration
1 – 10 450 – 250 Extensive deterioration >10 <250 End-of-life criteria
The Chendong model could empirically reflect if a transformer is subjected to normal, abnormal or
slow aging. Normal aging is a kind of aging that occurs during a long period of operation under normal conditions, i.e., at rated load and temperature. In addition, relatively even degradation throughout the transformer insulation implies normal aging. Abnormal aging might result from fast aging of overall insulation due to high operating temperature, heavy load, etc., or from the partial overheating due to unreasonable design and manufacture.
A functional relationship between operating time and 2FAL concentration was established based on varying operating conditions of 77 step-up generator transformers (Chendong, 1991), along with confidence bounds. The confidence intervals are a function of operating time (𝑇) and are expressed as:
log(2𝐹𝐴𝐿1) = −1.29 + 0.058𝑇 (2)
log(2𝐹𝐴𝐿2) = −2.37 + 0.058𝑇 (3)

13
The 2FAL contents (mg/l) in the insulating oil measured from the step-up transformers should be within the regions defined by Equations (4), (5), and (6), corresponding to normal, abnormal, and slow aging zones, respectively. Details on the derivation are given in (Chendong, 1991).
[exp (−5.45 + 0.13T), exp (−2.98 + 0.13T)] (4)
[exp(−2.98 + 0.13T)] , +∞) (5)
[0, exp (−5.45 + 0.13T)] (6)
Many modifications to the Chendong model are proposed in the literature. The discussion on these models is beyond the scope of this report, however they are summarized in APPENDIX A. One of the major limiting factors of the Chendong model and its variations is they are independent of spatial temperature variation, so they cannot take into account local effects such as hot spots where degradation is accelerated. As mentioned, temperature is one of the major factors affecting the formation of 2FAL content in the insulating oil.
4.2.3 Remaining Useful Life The empirical formulation in Equation (7) is used to compute the elapsed insulation life of a
transformer given the DP estimate obtained from Equation (1)
Elapsed life (in years) = 20.5 ∙ 𝐷𝑃𝑡𝐷𝑃0
(7)
where DP0 is the degree of polymerization of a new (un-aged) transformer and DP𝑡 is the degree of polymerization of transformer at time t. In Equation (7), the value 20.5 is the minimum normal insulation life expectancy of 180,000 hours is required (~20.55 years) as per IEEE Std. C57.12.00-2010.
4.3 IEEE Thermal Life Consumption Model The IEEE thermal life consumption model presented here has been developed for
mineral-oil-immersed transformers and step-voltage regulators with insulation systems rated for a 65°C average winding temperature rise at rated load. A transformer’s life span is determined mainly by the solid insulation system’s mechanical resistance to withstand a short circuit. As a result, the transformer life is usually defined as the total time between the initial state with new insulation and the final state for which dielectric stress, short circuit stress, or mechanical movement could cause an electrical failure (likely a short circuit) for a given temperature of the transformer insulation. A power transformer is expected to operate up to 40 years. Per 5.11.3 of IEEE Std. C57.12.00-2010, a minimum normal insulation life expectancy of 180,000 hours is required (~20.55 years).
The IEEE thermal life consumption model estimates the hot spot temperature in the insulation at given transformer load and ambient temperature, which in turn is used to estimate the life spent (or equivalent RUL) of transformer insulation.
4.3.1 Hot Spot Temperature Calculation IEEE standard C57.91-2011 presents two different models for calculation of hot spot temperatures.
The model presented here is a simplified model that calculates oil and winding temperatures for changes in load. The alternate method is more exact, but requires an iterative solution of equations. If load, ambient temperature, and tap position can be determined accurately, the alternate method should provide accurate results. Details can be found in (IEEE, 2012).
Transformer Load The majority of loading mineral-oil-immersed transformers and step-voltage regulators are designed
to be able to carry the nameplate rated load with insulation systems rated for a 65°C (or 55°C) average winding temperature rise. A transformer supplying a fluctuating load generates a fluctuating loss (Figure

14
8) which incurs approximately the same damage as an intermediate constant load over the same period of time. This is due to the heat storage characteristics of materials in the transformer. A constant load that generates the same total losses as a fluctuating load is deemed an equivalent load from a temperature standpoint. The equivalent load for any part of a daily load cycle can be expressed by
𝐿𝑒𝑞 = �∑ 𝐿𝑖2𝑡𝑖𝑁
𝑖=1∑ 𝑡𝑖𝑁𝑖=1
(8)
where each step load 𝐿𝑖 is held constant for duration 𝑡𝑖. The transformer’s load ratio (𝐾) is the ratio of the actual load (𝐿) to the rated load (𝐿𝑅)
𝐾 = 𝐿𝐿𝑅
(9)
Figure 8. Example of actual and equivalent load cycle (IEEE 2012).
Applications of loads in excess of the nameplate rating involve some degree of risk because of the increase in average winding temperature including the hot spot. Operation at high temperature will cause reduced mechanical strength of both conductor and structural insulation, and subsequently accelerate the insulation degradation rate. These effects are of major concern during periods of transient overcurrent (through-fault), when mechanical forces reach their highest levels.
Heat Generation: As transformers operate, heat is generated in both the core and the windings. This heat represents the transformer losses, which increase exponentially as the load through the transformer increases. There are two types of transformer losses: no-load losses, which occur simply because the transformer is energized; and load losses, which vary with the transformer’s loading. The no-load losses include dielectric loss, conductor loss in the winding due to exiting current, conductor loss due to circulating current in parallel winding, and core loss, which is the power dissipated in a magnetic core subjected to a time-varying magnetizing force (hysteresis and eddy current losses of the core). The load losses, which vary with the square of load, include stray loss and I2R loss in the winding due to load and eddy currents. All losses in a transformer vary with temperature, and are therefore specified at a reference load and winding temperature.
0 4 8 12 16 20 240
50
100
150
Time (hours)
Load
Rat
io (%
)
Actual load
60% initial load
110% peak load
1 hour
Time (hours)
Load
Rat
io (%
)

15
The total power losses are the sum of the no-load losses and the load losses. At rated load, the total power loss is given by the sum
𝑃𝑇 = 𝑃𝑊 + 𝑃𝐸 + 𝑃𝑆 + 𝑃𝐶 (10)
where 𝑃𝑊 is the winding 𝐼2𝑅 loss at rated load, 𝑃𝐸 is the eddy loss of windings at rated load, 𝑃𝑆 is the stray loss at rated load, and 𝑃𝐶 is the core (no-load) loss (all values are in watts).
Heat removal: It is critical for safe operation of a transformer that the generated heat be removed, especially at higher load conditions. If generated heat is not removed, premature aging of the transformer will occur due to degradation of the paper insulation inside the transformer, ultimately causing transformer failure. The performance of the transformer cooling system depends on material properties impacting heat transfer such as specific heat or heat capacity, relative density, thermal conductivity, and fluid viscosity. These properties determine how well the fluid will move to the hot spot, absorb the excess heat, transport the heat to the shell of the transformer, and dissipate the heat to the atmosphere. These material properties vary with temperature.
Fluid viscosity (𝜇) is highly temperature dependent. The fluid viscosity at any temperature (𝑇) is given by an equation of the form:
𝜇 = 𝐷𝑒𝐺/(𝑇+273) (11)
where the constants 𝐷 and 𝐺 are tabulated in Table 3. Temperature for calculating viscosity can be estimated for winding oil as 𝑇 = (𝑇𝑊 + 𝑇𝐷𝐴𝑂)/2 or for hot spot oil as 𝑇 = (𝑇𝐻 + 𝑇𝑊𝑂)/2.
Table 3. Constants for viscosity calculation. Material 𝑫 𝑮 Oil 0.0013573 2797.3 Silicone 0.12127 1782.3 HTHC (High-Temperature Hydrocarbons is a mineral oil alternative) 0.00007343 4434.7
In order to increase the load that can be carried on existing self-cooled transformers, auxiliary cooling
equipment is usually added (e.g., fans, external forced-oil coolers such as pumps, or water spray equipment). Table 4 presents typical transformer cooling modes. These cooling modes determine removal rate of the heat generated from the transformer losses and are the primary factors for temperature calculation.

16
Table 4. GSU cooling modes. Cooling modes Description ONAN –oil natural and air natural
Natural convection flow of oil through windings and radiators. Natural convection flow of air over tank and radiators.
ONAF –oil natural and air forced
Natural convection flow of oil through windings and radiators. Forced convection flow of air over radiators by fans.
ODAF –oil directed and air forced
Forced oil flow through windings and radiators or heat exchanger by pumps. The oil is directed from the radiators or heat exchangers into the windings. The air is forced over the radiators or heat exchanger by fans.
OFAF–oil forced and air forced
Forced oil flow through the radiators by one or more pumps. The oil is forced to flow into the tank by the pumps; however the main forced oil flow in the tank bypasses the windings. The air is forced over the radiators or heat exchangers by fans.
OFWF – oil forced and water forced
Forced oil flow through the radiators by one or more pumps. The oil is forced to flow into the tank by the pumps; however the main forced oil flow in the tank bypasses the windings. The water is forced over the radiators or heat exchangers by pumps.
Ambient temperature The ambient air temperature seen by a transformer is the temperature of the air in contact with its
radiators or heat exchangers. Ambient temperature is an important factor in determining the load capability of a transformer since the temperature rises for any load must be added to the ambient to determine operating temperatures. The reference value of the ambient temperature is 30°C. Whenever the actual ambient can be measured throughout the loading period, ambient temperature equals the time averaged ambient temperature for normal loading conditions, and maximum ambient temperature for overload conditions. In either case, adding 5°C will yield a more conservative aging result.
Temperature calculation The transformer loading equations use the top-oil temperature rises over ambient to determine the
winding hot spot temperature during an overload. Note this model can be best used for the steady-state loading conditions (e.g., a two-step overload cycle with a constant equivalent prior load and ultimate load as shown in Figure 8). For transient conditions, the oil temperature adjacent to the hot spot location is higher than the top oil temperature in the tank. For the ONAN and ONAF cooling modes, these phenomena will lead to winding hot spot temperatures greater than predicted by this model.
The hot spot temperature (𝑇𝐻) is given by:
𝑇𝐻 = 𝑇𝐴 + ∆𝑇𝑇𝑂 + ∆𝑇𝐻/𝑇𝑂 (12)
where 𝑇𝐴 is the ambient temperature, ∆𝑇𝑇𝑂 is the top oil temperature rise over ambient, and ∆𝑇𝐻/𝑇𝑂 is the hot spot temperature rise over top oil. Given the ambient temperature, the two remaining terms of the hot spot temperature are calculated below.
1. top-oil temperature rise
The top-oil temperature rise (∆TTO) over ambient for time duration 𝑡 following a step load change from
𝐾𝑖 to 𝐾𝑢 is given by the following exponential expression
∆𝑇𝑇𝑂 = �∆𝑇𝑇𝑂.𝑈 − ∆𝑇𝑇𝑂,𝑖� �1 − 𝑒− 𝑡𝜏𝑇𝑂� + ∆𝑇𝑇𝑂,𝑖 (13)

17
where ∆𝑇𝑇𝑂,𝑖 is the initial and ∆𝑇𝑇𝑂.𝑈 is the ultimate top-oil temperature rise over ambient, and 𝜏𝑇𝑂 is the top-oil thermal time constant, which represents the temperature transient time from ∆𝑇𝑇𝑂,𝑖 to ∆𝑇𝑇𝑂.𝑈.
The initial and ultimate top-oil temperature rise over ambient are given by:
∆𝑇𝑇𝑂,𝑖 = ∆𝑇𝑇𝑂,𝑅 �(𝐾𝑖
2𝑅+1)(𝑅+1)
�𝑛
and ∆𝑇𝑇𝑂,𝑈 = ∆𝑇𝑇𝑂,𝑅 �(𝐾𝑈
2𝑅+1)(𝑅+1)
�𝑛
(14)
where 𝑅 is the ratio of load loss at rated load to no-load loss on the tap position to be studied (either provided or calculated from given load losses) and 𝑛 is an empirically derived exponent used to account for the effects of changes in resistance with each change in load. Values of the exponent 𝑛 are listed in Table 5 for different cooling modes.
The top-oil thermal time constant 𝜏𝑇𝑂 is given by
𝜏𝑇𝑂 = 𝜏𝑇𝑂,𝑅�∆𝑇𝑇𝑂.𝑈∆𝑇𝑇𝑂.𝑅
�−�∆𝑇𝑇𝑂.𝑖∆𝑇𝑇𝑂.𝑅
�
�∆𝑇𝑇𝑂.𝑈∆𝑇𝑇𝑂.𝑅
�1𝑛−�
∆𝑇𝑇𝑂.𝑖∆𝑇𝑇𝑂.𝑅
�1𝑛 (15)
where 𝜏𝑇𝑂,𝑅 is the top-oil thermal time constant at rated load, which is given by
𝜏𝑇𝑂,𝑅 = 𝐶∆𝑇𝑇𝑂,𝑅𝑃𝑇,𝑅
(16)
where 𝑃𝑇,𝑅 is the transformer total loss in (W) and C is transformer thermal heat capacity in (W-h/°C). The top-oil time constant at rated load might be given for particular transformer.
Table 5. Exponents used in temperature determination equations. Type of cooling 𝑚 𝑛 ONAN 0.8 0.8 ONAF 0.8 0.9 Non-directed OFAF or OFWF 0.8 0.9 Directed ODAF or OFWF 1.0 1.0
2. Hot spot temperature rise
The transient winding hot spot temperature rise over top-oil temperature (∆𝑇𝐻/𝑇𝑂) is given by
∆𝑇𝐻/𝑇𝑂 = �∆𝑇𝐻,𝑈 − ∆𝑇𝐻,𝑖� �1 − 𝑒−𝑡𝜏𝑊� + ∆𝑇𝐻,𝑖 (17)
The initial (∆𝑇𝐻,𝑖) and ultimate (∆𝑇𝐻,𝑈) hot spot rise over top oil is given by
∆𝑇𝐻,𝑖 = ∆𝑇𝐻,𝑅𝐾𝑖2𝑚 and ∆𝑇𝐻,𝑢 = ∆𝑇𝐻,𝑅𝐾𝑢2𝑚 (18)
For moderate overloads it is conservative to neglect the winding time constant τW = 0 (usually 3-7 minutes) and the transient winding hot spot temperature rise over top-oil temperature can be expressed as:
∆𝑇𝐻/𝑇𝑂 = ∆𝑇𝐻,𝑈 (19)
The exponent m is used to account for changes in load loss caused by changes in temperature. Values for the exponents used in these equations are shown in Table 5 (IEEE, 2012). Exact values of the exponents for specific transformers may be determined by overload test procedures in IEEE Std. C57.119.
Table 6 shows an example of the parameters needed for hot spot temperature calculations for a 187 MVA transformer with directed oil and forced air/water cooling mode (IEEE, 2012).

18
Table 6. Example parameter values for hot spot temperature calculations for a 187 MVA transformer. Parameter Symbol Value Top-oil rise over ambient at rated load ΔTTO,R 36.0 °C Winding hot spot rise over top-oil temperature at rated load ΔTHS,R 28.6 °C Winding hot spot rise over ambient at rated load ΔTH/A,R 80 °C Ratio of load loss at rated load to no-load loss R 4.87 Oil thermal time constant for rated load τTO,R 3.5 h Oil flow design (directed or non-directed) ODAF or OFWF Exponent of loss function vs. top-oil rise n 1.0 Exponent of load squared vs. winding gradient m 1.0
4.3.2 Remaining Useful Life As stated in the Section 4.2.1, there is a known correlation between insulation DP level and tensile
strength. A reduction of the tensile strength to 50% of its original value corresponds to a 75% reduction of the DP value, indicating a full loss of mechanical strength. Temperature is the most important contributor to the reduction rate of insulation paper DP, especially at the defective location with the hot temperature. Therefore, the insulation deterioration for a GSU can be expressed as function of the hot spot temperature following an adaptation of the Arrhenius reaction rate equation as follows:
Per Unit Life = A𝑒�𝐵
𝑇𝐻+273� (20)
where the constants A = 9.8 × 10⁻¹⁸ and 𝐵 = 15,000 for 65°C average winding temperature rise insulation systems at rated load, and 𝑇𝐻 is the hot spot temperature.
Aging acceleration factor: For a given hot spot temperature, the rate at which transformer insulation aging is accelerated compared with the aging rate at a reference hot spot temperature (e.g., factor > 1 when TH> 110°C and vice versa). The per unit transformer insulation life function can be used as a basis for calculating an aging acceleration factor (F𝐴𝐴) for a given load and temperature, or for a varying load and temperature profile. The reference value of TH is 110°C for 65°C winding rise. Subsequently, for 65°C winding rise GSU the aging accelerator is given by
F𝐴𝐴 = 𝑒�15000383 − 15000𝑇𝐻+273
� (21) Table 7 displays the Per Unit Life and Aging Acceleration Factor values for different hot spot
temperatures. It shows that these values are very sensitive to hot spot temperature. It also indicates the degree to which the rate of aging is accelerated beyond normal for temperature above a reference temperature of 110°C and is reduced below normal for temperature below 110°C.
Table 7. Per unit life and aging acceleration factor at various winding hot spot temperatures. Winding hot spot temperature (TH) Per Unit Life Aging Acceleration factor
100 2.859 0.350 105 1.679 0.596 110 1.000 1.000 115 0.604 1.656 120 0.369 2.709
Equivalent aging at the reference hot spot temperature in a given time period is the time-averaged
aging factor:

19
𝐹𝐸𝑄𝐴 = ∑ 𝐹𝐴𝐴,𝑛∆𝑡𝑛𝑁𝑛=1∑ ∆𝑡𝑛𝑁𝑛=1
(22)
The percent loss of life is calculated from the equivalent aging in hours at the reference hot spot temperature over a time period t (usually 24 hours) as
% 𝑙𝑜𝑠𝑠 𝑜𝑓 𝑙𝑖𝑓𝑒 = 𝐹𝐸𝑄𝐴×𝑡×100𝑁𝑜𝑟𝑚𝑎𝑙 𝑖𝑛𝑠𝑢𝑙𝑎𝑡𝑖𝑜𝑛 𝑙𝑖𝑓𝑒
(23)
This percent loss of life represents the equivalent life (at rated load for the specified time period) that the transformer lost when it operated at the actual load profile. Assuming normal insulation life is 180,000 hours, and the percent loss of life for operation at a rated hot spot temperature of 110°C for 24 h is 0.0133%.
Alternatively, the transformer insulation RUL can be calculated as
𝑅𝑈𝐿 = 𝑁𝑜𝑟𝑚𝑎𝑙 𝑖𝑛𝑠𝑢𝑙𝑎𝑡𝑖𝑜𝑛 𝑙𝑖𝑓𝑒 − 𝐹𝐸𝑄𝐴 × 𝑡 (24)
RUL can be expressed as function of the hot spot temperature by substituting Equation (22) for the aging acceleration factor using the calculated hot spot temperature.
5. IMPLEMENTATION IN FW-PHM The procedure for implementing new prognostic models in FW-PHM is detailed in Expert
Microsystems(2012). Expert Microsystems provided INL with a Microsoft Visual Studio C# project used to implement a linear prognostic model. The project was pre-configured to create the web service required to implement a model in the FW-PHM software. The project was adapted to be able to calculate RUL using the non-linear Chendong and IEEE models. The implementation of each model in FW-PHM includes the following steps: programming the model and publishing it as a service; adding the model type to FW-PHM; defining the technical examinations required as model inputs; and creating a RUL signature for the asset in question, including parameter values. The RUL Advisor can then be used to estimate RUL. Implementation of the Chendong and IEEE models is detailed in the sections below.
5.1 Implementation of the Chendong Model The Chendong model was implemented at a component level for the main transformer primary
winding insulation. The model uses two calibration parameters, one for the minimum life of transformer winding insulation (in years) and the second for the degree of polymerization when the transformer was placed in service. The single input to the model is the measured 2FAL concentration in ppm.
The RUL model type was implemented in FW-PHM at service reference http://127.0.0.1:9896/Chendong/Chendong.svc. A screen shot from the model type definition is seen in Figure 9.
Figure 9. Model type definition for the Chendong Model.
All input variables for RUL models must correspond with an extensible markup language (XML) based Technical Exam. A technical exam was created for the 2FAL concentration as seen in Figure 10.

20
Figure 10. Tech exam definition for 2-Furaldehyde concentration.
The RUL Signature is defined, as seen in Figure 11. The RUL estimation units are restricted to the technical exam units, and thus are listed in PPM. The actual RUL estimation units for this example are years. There was no effort made to reconcile this inconsistency.
Figure 11. RUL signature for the Chendong model.

21
A test scenario was run to ensure the model implementation was accurate. Assuming 2FAL concentration is 0.6 ppm, DP is estimated to be 494.8. This leads to a usage of 17.3 years, and RUL of 3.2 years. Results from FW-PHM, seen in Figure 12, show a Mean RUL of 3.2 years. The upper and lower bounds on RUL were calculated simply as 1.05 and 0.95 times the average RUL, respectively. Ideally, a more meaningful system would be used to calculate the upper and lower bands.
Figure 12. RUL estimate for the GSU transformer based on the Chendong model.
5.2 Implementation of the IEEE Thermal Life Consumption Model The IEEE Life Consumption model is also implemented at a component level for the main
transformer primary winding insulation. The model uses nine calibration parameters, one single input value, and two time-series input values for load and ambient temperature.
The RUL model type was implemented in FW-PHM at service reference http://127.0.0.1:9896/IEEE/IEEE.svc. A screen shot from the model type definition is shown in Figure 13.
Figure 13. Model type definition for the IEEE life consumption model.
XML based technical exams were defined for each of the three inputs. The technical exam for current usage (Figure 14), an estimate of elapsed life prior to the current data set, has a numeric value result type. The technical exams for load and ambient temperature profiles (Figure 15, Figure 16) are defined to have a numeric series result type. By defining these exams with the numeric series result type, the user will be prompted to input values from a comma separated value file. All three technical exams were defined at the equipment level for a voltage transformer.

22
Figure 14. Tech exam definition for current usage.
Figure 15. Tech exam definition for transformer load.

23
Figure 16. Tech exam definition for ambient temperature.
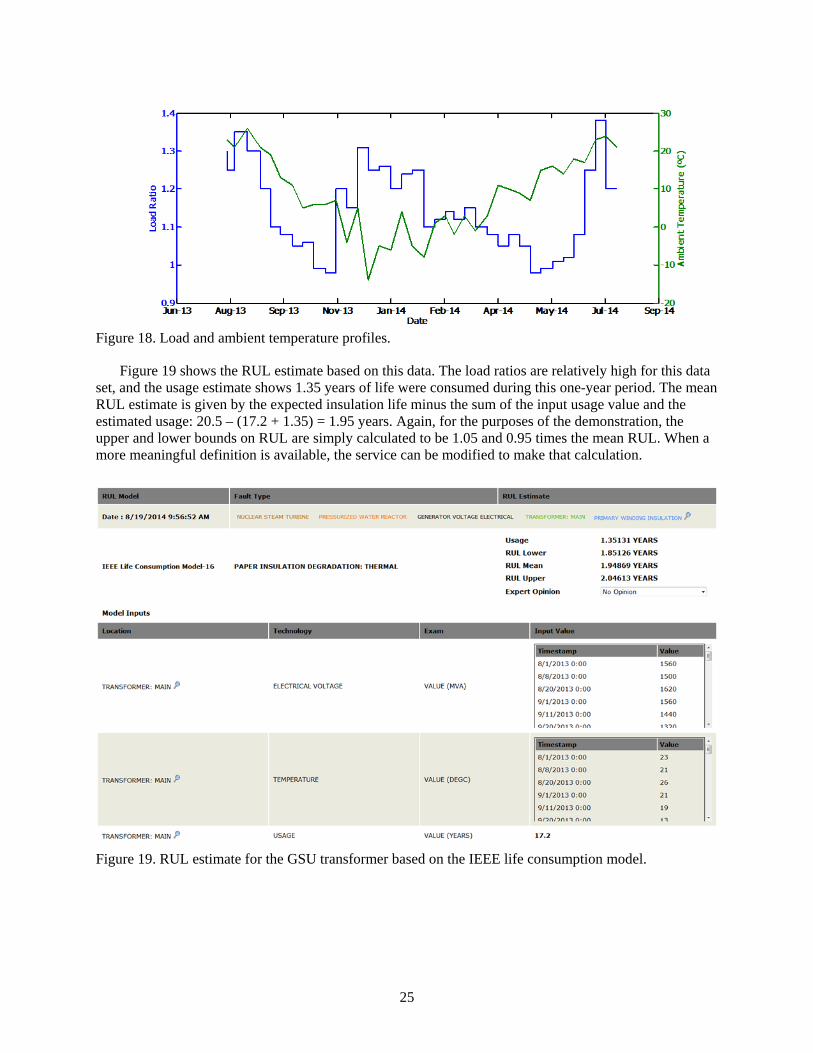
The RUL signature definition used for the demonstration is seen in Figure 17. The parameters selected for the signature were taken from examples in the (IEEE 2012). In order to demonstrate the model, a data set was fabricated using average ambient temperatures from Idaho Falls, Idaho between June 1, 2013 and August 1, 2014. The load and temperature profiles are seen in Figure 18. The left (blue) axis is the load ratio (i.e., the ratio of the actual load to the rated load), and the right (green) axis is ambient temperature. The model calibration parameters are described in Table 8.

24
Figure 17. RUL signature for IEEE life consumption model.
Table 8. Numeric parameter inputs to the IEEE thermal model as implemented in FW-PHM. Parameter Name Description Symbol R Ratio of load loss at rated load to no-load loss R dT_TOR Top oil temperature rise over ambient at rated load (ºC) ΔTTO,R dT_HSTOR Winding hot spot temperature rise over top oil temperature at rated
load (ºC) ΔTHS,R
dT_HSAR Winding hot spot rise over ambient at rated load (ºC) ΔTH/A,R T_TOR Oil thermal time constant for rated load (hours) 𝜏𝑇𝑂 T_W Winding time constant for moderate overload (hours) τW Rated_Load Rated load of the transformer 𝐿𝑅 Life_Expectancy Expected life of the transformer (years) –
25
Figure 18. Load and ambient temperature profiles.
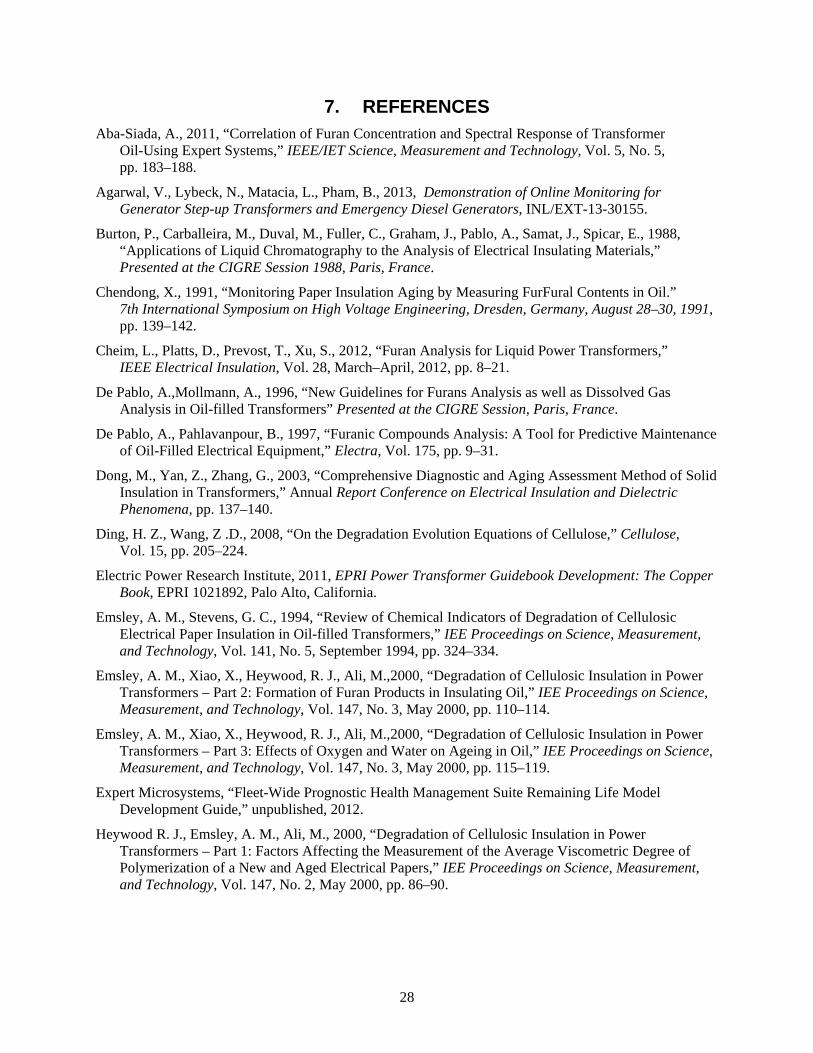
Figure 19 shows the RUL estimate based on this data. The load ratios are relatively high for this data set, and the usage estimate shows 1.35 years of life were consumed during this one-year period. The mean RUL estimate is given by the expected insulation life minus the sum of the input usage value and the estimated usage: 20.5 – (17.2 + 1.35) = 1.95 years. Again, for the purposes of the demonstration, the upper and lower bounds on RUL are simply calculated to be 1.05 and 0.95 times the mean RUL. When a more meaningful definition is available, the service can be modified to make that calculation.
Figure 19. RUL estimate for the GSU transformer based on the IEEE life consumption model.

26
6. SUMMARY AND FUTURE PLANS This report presents the FY 2014 research activities associated with the OLM for active components,
including:
• Development and implementation of additional GSU fault signatures (diagnostic models) in the FW-PHM Suite software
• Validation of implemented GSU fault signatures by subject matter experts from EPRI
• Identification of Type II prognostic models to estimate GSU elapsed insulation lifetime
• Implementation of two GSU prognostic models, i.e., remaining useful lifetime (RUL) signatures, in the FW-PHM RUL Database of the FW-PHM to allow estimation of GSU insulation lifetime by the RUL Advisor
• Demonstration of the prognostic capability of the FW-PHM Suite software at the Joint Summer Utility Working Group and 2014 EPRI Strategy Group on Productivity Meeting Idaho Falls, Idaho.
A total of 20 fault signatures have been implemented for GSUs in the AFS Database of the FW-PHM Suite software. Two prognostic models have been implemented for GSUs in the RUL Database. The Chendong model is based on the functional relationship between the degree of polymerization and 2-Furaldehyde concentration in the insulating oil. Degree of polymerization is one of the most commonly used metrics to assess the health of a transformer. The IEEE thermal model is based on thermal profiling of the transformer. By utilizing transformer load information, established thermal models are used to estimate hot spot temperatures inside the transformer, which in turn is used to compute insulation lifetime. The prognostic capability of the FW-PHM Suite software was used to demonstrate the estimation of remaining useful life for GSU transformers at the Joint Summer Utility Working Group and EPRI Strategy Group on Productivity Meeting Idaho Falls, Idaho.
There are several prognostic model types available in the base version of the FW-PHM Suite. These include linear, general path, and Weibull models. Application of the models to components in NPPs will require appropriate knowledge to select the correct model, as well as determine input parameters. It is likely the most useful results will come from application-specific models.
There are many potential directions for future research, including implementation of more sophisticated prognostic models for winding insulation degradation in GSUs. Ding and Wing (2008) presented a new degradation evolution equation for cellulose by defining a differential equation governing the time dependence of the accumulated DP degradation of cellulose. The associated reaction rate is temperature-dependent, allowing the insulation life of a transformer winding to be determined more accurately.
Another failure mechanism applicable to GSUs is oil degradation. Oil degradation is a complex process due to aging, high temperatures and chemical reactions such as oxidation. Mineral oil, when subjected to thermal and electrical stresses in an oxidizing atmosphere, gradually loses stability, decomposes and oxidizes, increasing acidity and eventually producing mud. Most oxidation by-products will have a negative effect on the electrical properties of the oil. The carboxylic acids produced will either dissolve in the oil or volatilize into the headspace. Dissolved acids may cause damage to the paper and copper windings, while volatile acids corrode the top of the unit. As a result, the aging process creates conditions harmful to the transformer. Meshkatoddini (2008) uses an Arrhenius equation to predict the RUL of transformer oil from the oil temperature history, which can be estimated as described in Section 4.3.1 for a given load Equation (24).
Assessment of transformer aging condition based on the combined test results from multiple health condition tests is expected to improve the accuracy of RUL prediction. There are many ways to combine results, including principal component or factor analysis. One approach is to select the parameters most

27
closely related to insulation aging, then ranking them. Li et al., introduced the concept of Aging Index, which represents a practical tool to combine the results of routine inspections, site and laboratory testing to estimate the aging condition of transformer.
Additionally, implementation of prognostic models for other active components of interest in NPPs, such as pumps or electric motors, would be of interest.
28
7. REFERENCES Aba-Siada, A., 2011, “Correlation of Furan Concentration and Spectral Response of Transformer
Oil-Using Expert Systems,” IEEE/IET Science, Measurement and Technology, Vol. 5, No. 5, pp. 183–188.
Agarwal, V., Lybeck, N., Matacia, L., Pham, B., 2013, Demonstration of Online Monitoring for Generator Step-up Transformers and Emergency Diesel Generators, INL/EXT-13-30155.
Burton, P., Carballeira, M., Duval, M., Fuller, C., Graham, J., Pablo, A., Samat, J., Spicar, E., 1988, “Applications of Liquid Chromatography to the Analysis of Electrical Insulating Materials,” Presented at the CIGRE Session 1988, Paris, France.
Chendong, X., 1991, “Monitoring Paper Insulation Aging by Measuring FurFural Contents in Oil.” 7th International Symposium on High Voltage Engineering, Dresden, Germany, August 28–30, 1991, pp. 139–142.
Cheim, L., Platts, D., Prevost, T., Xu, S., 2012, “Furan Analysis for Liquid Power Transformers,” IEEE Electrical Insulation, Vol. 28, March–April, 2012, pp. 8–21.
De Pablo, A.,Mollmann, A., 1996, “New Guidelines for Furans Analysis as well as Dissolved Gas Analysis in Oil-filled Transformers” Presented at the CIGRE Session, Paris, France.
De Pablo, A., Pahlavanpour, B., 1997, “Furanic Compounds Analysis: A Tool for Predictive Maintenance of Oil-Filled Electrical Equipment,” Electra, Vol. 175, pp. 9–31.
Dong, M., Yan, Z., Zhang, G., 2003, “Comprehensive Diagnostic and Aging Assessment Method of Solid Insulation in Transformers,” Annual Report Conference on Electrical Insulation and Dielectric Phenomena, pp. 137–140.
Ding, H. Z., Wang, Z .D., 2008, “On the Degradation Evolution Equations of Cellulose,” Cellulose, Vol. 15, pp. 205–224.
Electric Power Research Institute, 2011, EPRI Power Transformer Guidebook Development: The Copper Book, EPRI 1021892, Palo Alto, California.
Emsley, A. M., Stevens, G. C., 1994, “Review of Chemical Indicators of Degradation of Cellulosic Electrical Paper Insulation in Oil-filled Transformers,” IEE Proceedings on Science, Measurement, and Technology, Vol. 141, No. 5, September 1994, pp. 324–334.
Emsley, A. M., Xiao, X., Heywood, R. J., Ali, M.,2000, “Degradation of Cellulosic Insulation in Power Transformers – Part 2: Formation of Furan Products in Insulating Oil,” IEE Proceedings on Science, Measurement, and Technology, Vol. 147, No. 3, May 2000, pp. 110–114.
Emsley, A. M., Xiao, X., Heywood, R. J., Ali, M.,2000, “Degradation of Cellulosic Insulation in Power Transformers – Part 3: Effects of Oxygen and Water on Ageing in Oil,” IEE Proceedings on Science, Measurement, and Technology, Vol. 147, No. 3, May 2000, pp. 115–119.
Expert Microsystems, “Fleet-Wide Prognostic Health Management Suite Remaining Life Model Development Guide,” unpublished, 2012.
Heywood R. J., Emsley, A. M., Ali, M., 2000, “Degradation of Cellulosic Insulation in Power Transformers – Part 1: Factors Affecting the Measurement of the Average Viscometric Degree of Polymerization of a New and Aged Electrical Papers,” IEE Proceedings on Science, Measurement, and Technology, Vol. 147, No. 2, May 2000, pp. 86–90.

29
Hohlein, I., Kachler, A., 2005, “Aging of Cellulose at Transformer Service Temperatures – Part 2. Influence of Moisture and Temperature on Degree of Polymerization and Formation of Furanic Compounds in Free-breathing Systems,” IEEE Electrical Insulation Magazine, Vol. 21, No. 5, September–October 2005, pp. 20–24.
IEC, 1999, Mineral Oil-impregnated “Electrical Equipment In-service: Guide to the Interpretation of Dissolved and Free Gases Analysis,” IEC Standard 60599, 1999.
IEEE, 2012, “IEEE Guide for Loading Mineral-Oil-Immersed Transformers and Step-Voltage Regulators,” IEEE Std C57.91-2011, New York, March 2012.
Jalbert, J., Gilbert, R., Denos, Y., Gervais, P. (2012). Methanol: A Novel Approach to Power Transformer Asset Management,” IEEE Transactions on Power Delivery, vol. 27, pp. 514–520.
Kachler, A .J., Hohlein, I., 2005, “Aging of Cellulose at Transformer Service Temperatures. Part 1: Influence of Type of Oil and Air on the Degree of Polymerization of Pressboard, Dissolved Gases, and Furanic Compounds in Oil,” IEEE Electrical Insulation Magazine, Vol. 21, No. 2, March-April 2005, pp. 15–21.
Li, Y. et al., 2013, “Aging Assessment of Power Transformer Using Multi-parameters,” International Journal on Electrical Engineering and Informatics, Vol 5, No. 1, March 2013.
Lundgaard, L. E., Hansen W., Ingebrigtsen, S., 2008, “Ageing of Mineral Oil impregnated Cellulose by Acid Catalysis,” Vol. 15, No. 2, April 2008, pp. 540-546.
Lybeck, N.J., Coble, J., Tawfik, M., and Bond, L.J. (2011). An Assessment of Integrated Health Management (IHM) Frameworks. 3rd International Conference on NPP Life Management (PLiM) for Long Term Operations (LTO), IAEA-CN-194-031.
Meshkatoddini, M. R., 2008, “Aging Study and Lifetime Estimation of Transformer Mineral Oil,” American Journal of Engineering and Applied Sciences, Vol 1, No. 4, January 2008, pp. 384-388.
Pahlavanpour, B., Martins, M., De Pablo, A.,2002, “Experimental Investigation into the Thermal-Aging of Kraft Paper and Mineral Insulating Oil,” IEEE International Symposium on Electrical Insulation, April 2002, pp. 341–345.
Pradhan, M.,2006, “Assessment of the status of insulation during thermal stress accelerated experiments on transformer prototypes,” IEEE Transactions on Dielectrics and Electrical Insulation, Vol. 13, No. 1, Februrary 2006, pp. 227–237.
Soares, S., Ricardo, N., Heatley, F., Rodrigues, E., 2001, “Low Temperature Thermal Degradation of Cellulosic Insulating Paper in Air and Transformer Oil,” Polymer International, Vol. 50, No. 3, March 2001, pp. 303–308.
Shahsiah, A., Degeneff, R., Nelson, J. K., 2007, “A study of the temperature-based dynamic nature of characteristic gases in oil-cellulose insulation systems,” IEEE Transactions on Dielectrics and Electrical Insulation, Vol. 14, April 2007, pp. 471–479.
Schaut, A., Autru, S., Eeckhoudt, S., 2011, “Applicability of Methanol as New Marker for Paper Degradation in Power Transformers,” IEEE Transactions on Dielectrics and Electrical Insulation, Vol. 18, No. 2, April 2011, pp. 533–540.
CIGRE, 2009, Thermal Performance of Transformers, CIGRE Technical Brochure No. 393, Working Group A2, 24, 2009.

30
APPENDIX A Table A. Correlation Models between 2FAL and DP. Model Derived 2FAL-DP Correlation Chendong (Chendong, 1991) log(2𝐹𝐴𝐿) = 1.51 − 0.0035𝐷𝑃 De Pablo et al. (De Pablo and Pahlavanpour, 1997) log(2𝐹𝐴𝐿) = 3.41 − 0.00264𝐷𝑃 Kachler et al. (Kachler and Hohlein, 2005)* ln(2𝐹𝐴𝐿) = 7.09 − 0.001𝐷𝑃 Kachler et al. (Hohlein and Kachler, 2005)* ln(2𝐹𝐴𝐿) = 6.49 − 0.001𝐷𝑃 Pahlavanpour et al. (Pahlavanpour et al., 2002) log(2𝐹𝐴𝐿) = 1.4394 − 0.0046𝐷𝑃 Dong et al. (Dong et al., 2003) log(2𝐹𝐴𝐿) = 1.82 − 0.0025𝐷𝑃 Vuarchex (Cheim et al., 2012) log(2𝐹𝐴𝐿) = 2.6 − 0.0049𝐷𝑃
* Derived for non-inhibited and inhibited oils respectively.

31
APPENDIX B Fault Signatures for Generator Step-Up Transformers implemented in
FW-PHM Fault Signature Database of the FW-PHM Suite Component: Bushing
Fault Signature(s)
Fault Features Exam Location Technical Exam Exam Vale Effectiveness
Low dielectric strength
Bushing Dielectric strength Tap capacitance (C2)
Unacceptable High
Bushing Dielectric strength Power factor test Abnormal High Bushing Dielectric strength Tan delta/
dissipation factor
Abnormal High
Bushing Inspection Oil level Abnormal Medium Component: Core
Fault Signature(s)
Fault Features Exam Location Technical Exam Exam Vale Effectiveness
Displaced winding core
Core Frequency response analysis measurements
Frequency response: Sweep frequency test
Abnormal High
Core Frequency response analysis measurements
Frequency response: Impulse test
Abnormal High
Heating in core Insulating oil
Dissolved gas Methane/ Ethane/ Ethylene
Abnormal Medium
Winding Turn-to-turn test Turn ratio Abnormal (out-of-tolerance)
High
Component: Insulating oil pump
Fault Signature(s) Fault Features
Exam Location Technical Exam Exam Vale Effectiveness
Cavitation Insulating oil pump Inspection Audible noise
Abnormal High
Leakage Insulating oil pump Inspection Leakage Abnormal Very High Improper rotation Insulating oil pump Inspection Audible
noise Abnormal Medium
Insulating oil pump Inspection Flow gauge oscillation
Fluctuating High

32
Component: Insulating oil pump motor
Fault Signature(s) Fault Features
Exam Location Technical Exam Exam Vale Effectiveness
Motor degradation Insulating oil pump motor
Insulation resistance
Megger test
Abnormal High
Component: Insulating oil
Fault Signature(s) Fault Features Exam Location
Technical Exam Exam Vale Effectiveness
Contamination Insulating oil Insulating oil analysis
Interfacial tension
Abnormal High
Insulating oil Insulating oil analysis
Color variation Change High
Insulating oil Insulating oil analysis
Oxygen concentration level
Abnormal High
Insulating oil Insulating oil analysis
Sulfur content Abnormal Medium
Insulating oil Dielectric frequency response
Dissipation factor
Marginal High
Acidity Insulating oil Insulating oil analysis
Acid number Abnormal Very high
Low dielectric strength
Insulating oil Insulating oil analysis
Dielectric breakdown voltage
Abnormal Very high
Insulating oil Insulating oil analysis
Water content Abnormal High
Insulating oil Insulating oil analysis
Interfacial tension
Abnormal Medium
Insulating oil Insulating oil analysis
Methane/ Ethane/ Ethylene
Marginal Medium
Insulating oil Dielectric strength
Power factor test
Abnormal Very high
Thermal degradation
Insulating oil Dissolved gas CO2/CO ratio Marginal High Insulating oil Dissolved gas CO level Marginal High Insulating oil Dissolved gas Methane/
Ethane/ Ethylene
Marginal High

33
Component: Radiator
Fault Signature(s) Fault Features Exam Location
Technical Exam Exam Vale Effectiveness
Blocked radiator Insulating oil Time in excess temperature
Value Abnormal Medium
Insulating oil Oil flow Value Marginal Medium Radiator Temperature
differential Value Marginal Very high
Radiator Visual inspection
Observation Abnormal High
Component: De-energized tap changer
Fault Signature(s) Fault Features
Exam Location Technical Exam Exam Vale Effectiveness
Contact binding De-energized tap changer
Insulating oil analysis
Particle count Abnormal High
Linkage Manual operation
Outcome Abnormal High
Component: Primary winding insulation
Fault Signature(s)
Fault Features
Exam Location Technical Exam Exam Vale Effectiveness
Paper insulation degradation: Thermal
Insulating oil Dissolved gas CO2/CO ratio Marginal High Insulating oil Dissolved gas CO level Marginal Medium Insulating oil Dissolved gas Roger ratio –
thermal Marginal High
Insulating oil Insulating oil analysis
2FAL level Marginal High
Primary winding Inspection Degree of polymerization
Marginal Very High
Primary winding Time in excess temperature
Value Abnormal High
Paper insulation degradation: Electrical
Insulating oil Insulating oil analysis
Acid number Abnormal Medium
Insulating oil Dissolved gas Roger ratio – electrical
Marginal High
Insulating oil Dissolved gas C2H2 level Marginal Very high Insulating oil Dissolved gas H2 level Marginal Very high Insulating oil Dissolved gas H2 and C2H2
levels Marginal High

34
Component: Radiation fan motor
Fault Signature(s) Fault Features Exam Location
Technical Exam Exam Vale Effectiveness
Fail to operate Radiator fan motor
Power supply Value Interruption High
Insulating oil Time in excess temperature
Value Abnormal Medium
Improper rotation Radiator fan motor
Inspection Rotation Change Very high
Insulating oil Time in excess temperature
Value Abnormal Low
Performance degradation
Radiator fan motor
Vibration Magnitude value
Marginal Very high
Insulating oil Time in excess temperature
Value Abnormal Medium
Component: Tap changer drive mechanism and control (Not applicable in case of GSUs) Fault Signature(s) Fault Features
Exam Location Technical Exam Exam Vale Effectiveness
Erratic operation Tap changer drive mechanism and control
Motor power Value Marginal High