Lifecourse Approach to Women’s Reproductive Health: Focus on Psychosocial Stress Janet...
74
Lifecourse Approach to Women’s Reproductive Health: Focus on Psychosocial Stress Janet Rich-Edwards, ScD Assistant Professor Connors Center for Women’s Health and Gender Biology Brigham and Women’s Hospital
-
date post
21-Dec-2015 -
Category
Documents
-
view
217 -
download
2
Transcript of Lifecourse Approach to Women’s Reproductive Health: Focus on Psychosocial Stress Janet...
Lifecourse Approach to Women’s Reproductive Health:
Focus on Psychosocial Stress
Janet Rich-Edwards, ScD
Assistant Professor
Connors Center for Women’s Health and Gender Biology
Brigham and Women’s Hospital

“With the exception of the stomach, there is no organ that holds such numerous ramifications of sympathy with other organs as the womb.”
J.M. Good, The Study of Medicine, 1826
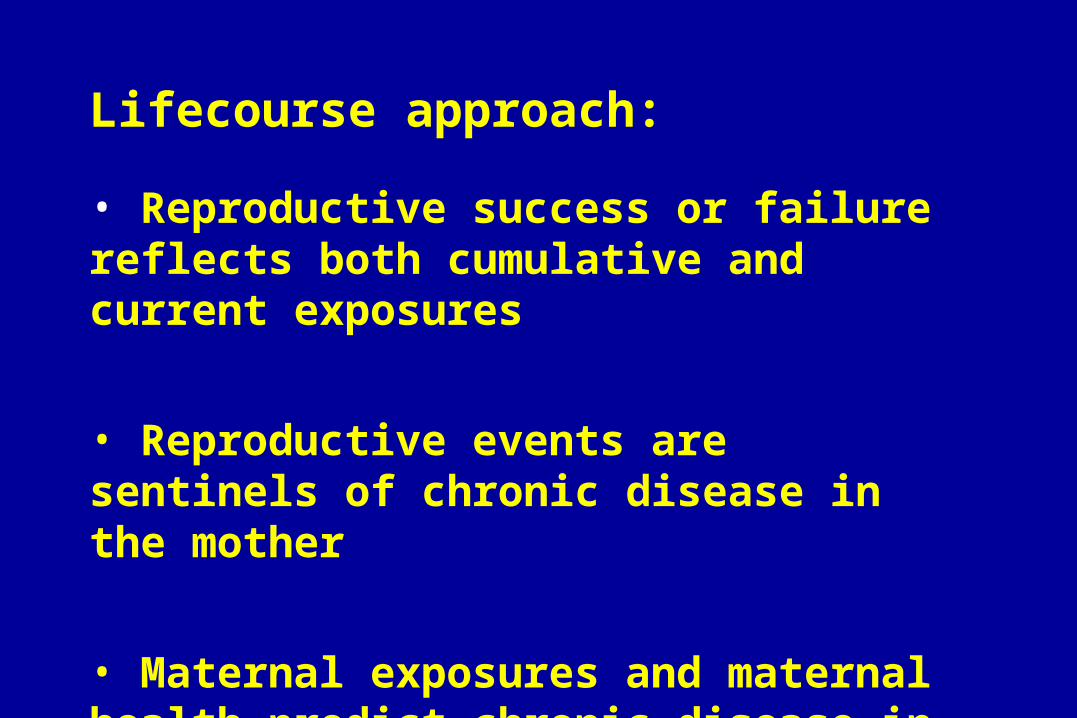
Lifecourse approach:
• Reproductive success or failure reflects both cumulative and current exposures
• Reproductive events are sentinels of chronic disease in the mother
• Maternal exposures and maternal health predict chronic disease in the child

PastBirthweight
Growth
Social position

Past Present Birthweight
Growth
Social position
Previous pregnancy outcomes
Social position
Pregnancy complications
Stress

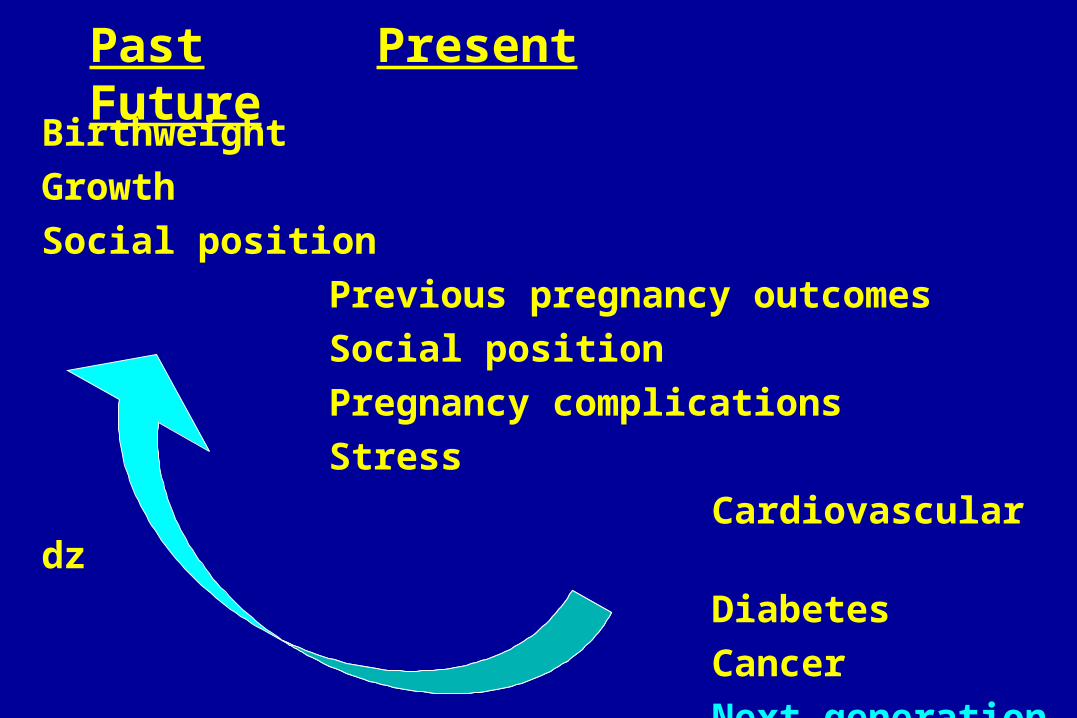
Past Present Future Birthweight
Growth
Social position
Previous pregnancy outcomes
Social position
Pregnancy complications
Stress
Cardiovascular dz
Diabetes
Cancer
Past Present Future Birthweight
Growth
Social position
Previous pregnancy outcomes
Social position
Pregnancy complications
Stress
Cardiovascular dz
Diabetes
Cancer
Next generation
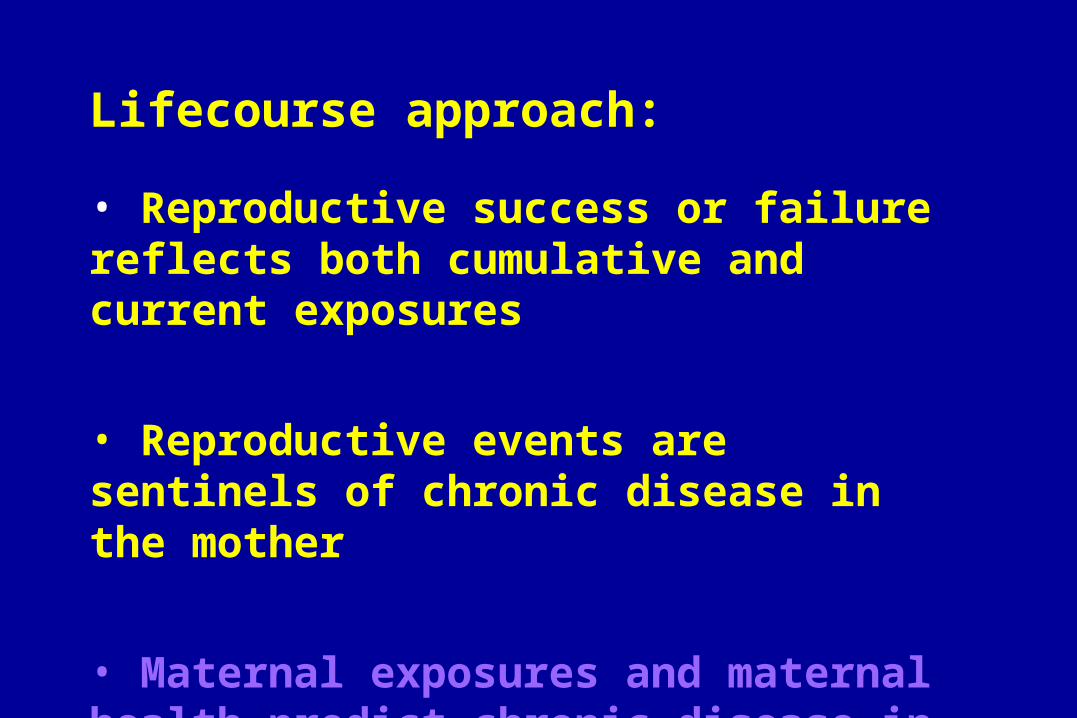
Lifecourse approach:
• Reproductive success or failure reflects both cumulative and current exposures
• Reproductive events are sentinels of chronic disease in the mother
• Maternal exposures and maternal health predict chronic disease in the child
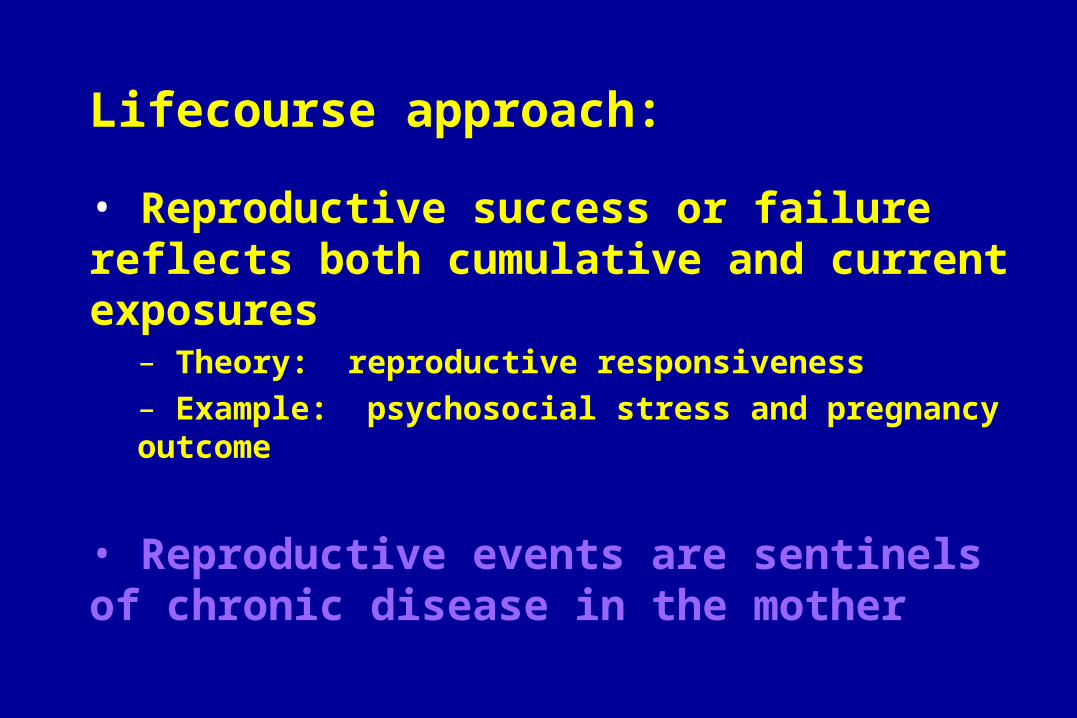
Lifecourse approach:
• Reproductive success or failure reflects both cumulative and current exposures
– Theory: reproductive responsiveness– Example: psychosocial stress and pregnancy outcome
• Reproductive events are sentinels of chronic disease in the mother

Reproduction is expensive:
Lactation
Labor and delivery
Fetal growth
Pregnancy maintenance
Placentation
Conception
Fully competent cycles
Ovulatory failure
Amenorrhea
Physiologic cost
to mother
Adapted from Ellison, 1993
+
-

Reproduction
Survival
Adversity Advantage
Environment
The optimal reproductive system:
• Adapts with agility while expending minimal resources
• Can shut down quickly in response to immediate threat

Childhood Setpoint
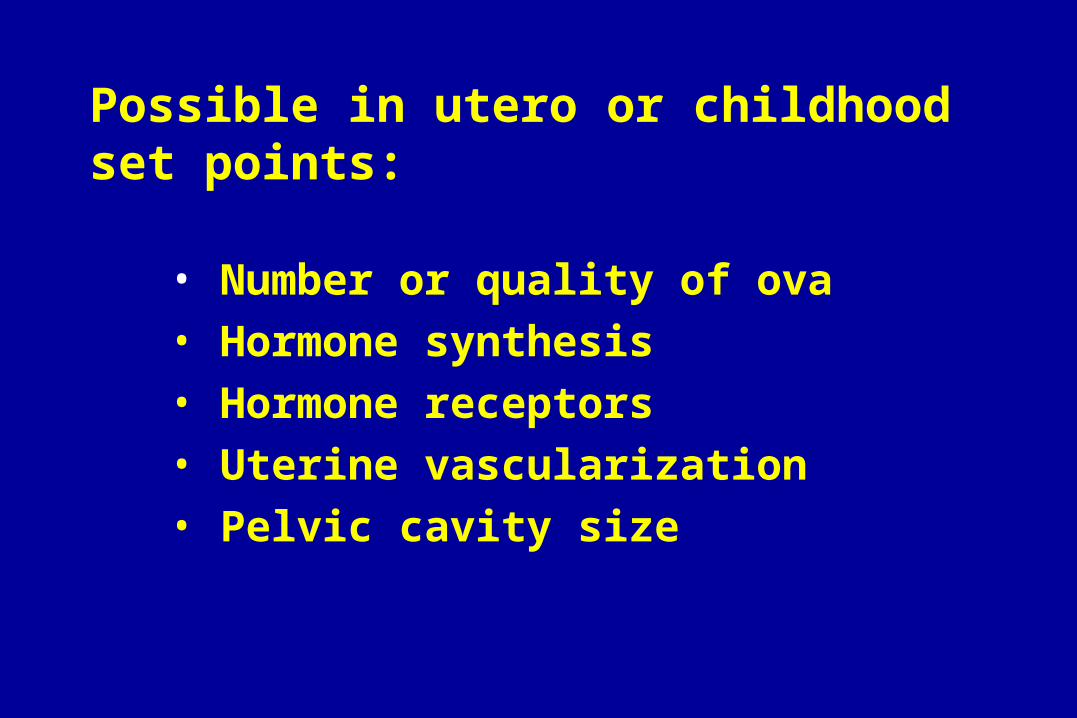
Possible in utero or childhood set points:
• Number or quality of ova
• Hormone synthesis
• Hormone receptors
• Uterine vascularization
• Pelvic cavity size
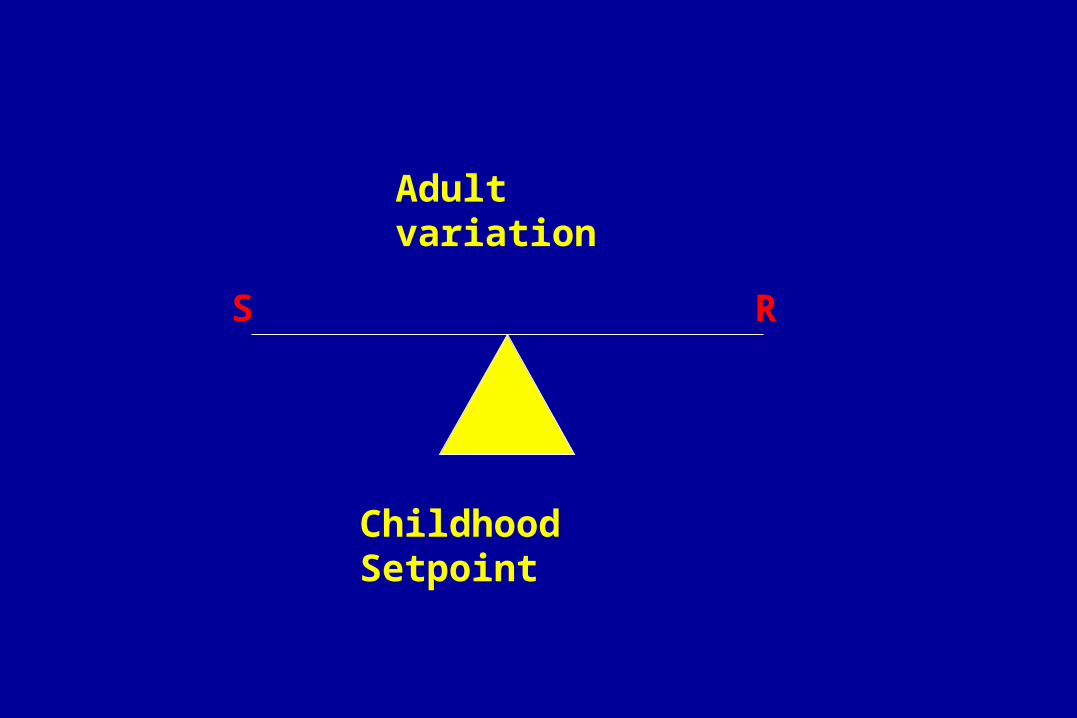
S R
Adult variation
Childhood Setpoint

S
R
Advantageous Adult Environment

S
R
Adverse Adult Environment
The optimal reproductive system:
• Adapts with agility while expending minimal resources
• Can shut down quickly in response to immediate threat
• Customized to early environment
• Retains some plasticity in response to enduring environment
ExamplePregnancy outcome:
preterm birth and low birthweight
9.8 10.010.210.210.610.610.810.711.011.011.011.011.411.611.811.611.912.112.312.512.7
7.6
0
2
4
6
8
10
12
14
1985 1987 1989 1991 1993 1995 1997 1999 2001 2003 2005
Preterm Very Preterm
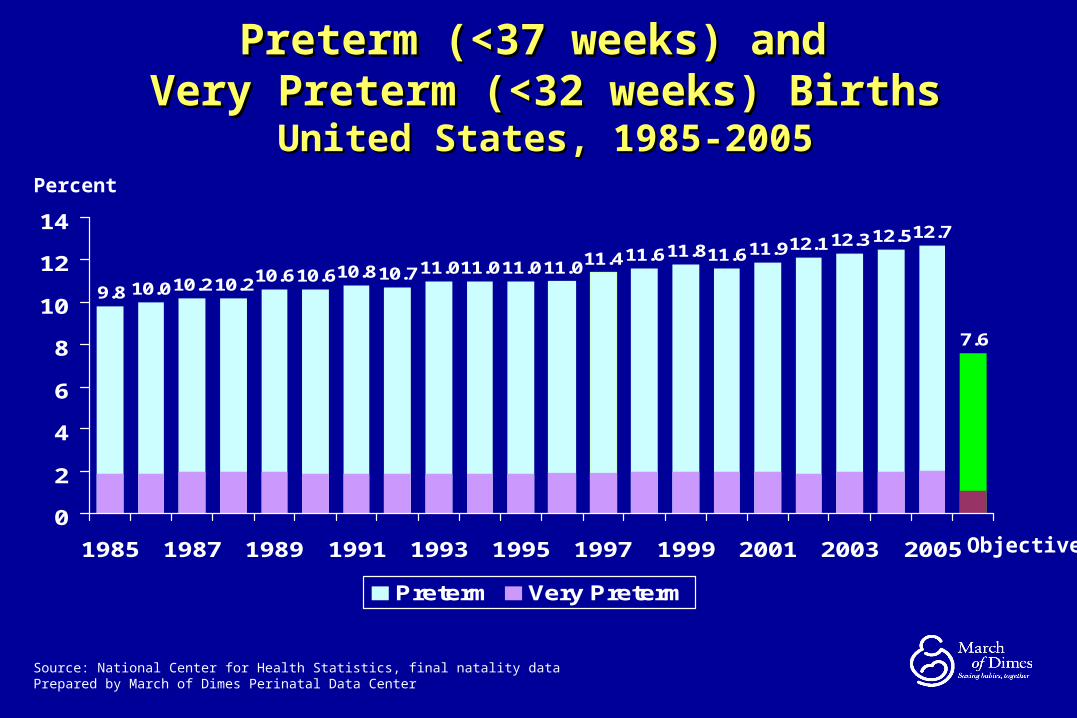
Preterm (<37 weeks) and Preterm (<37 weeks) and Very Preterm (<32 weeks) BirthsVery Preterm (<32 weeks) Births
United States, 1985-2005United States, 1985-2005
Source: National Center for Health Statistics, final natality dataPrepared by March of Dimes Perinatal Data Center
Percent
Objective

Preliminary preterm birth rates, 2005:
• 11.7% non-Hispanic whites
• 12.4% Hispanics
• 18.4% non-Hispanic Blacks
www.cdc.gov/nchs
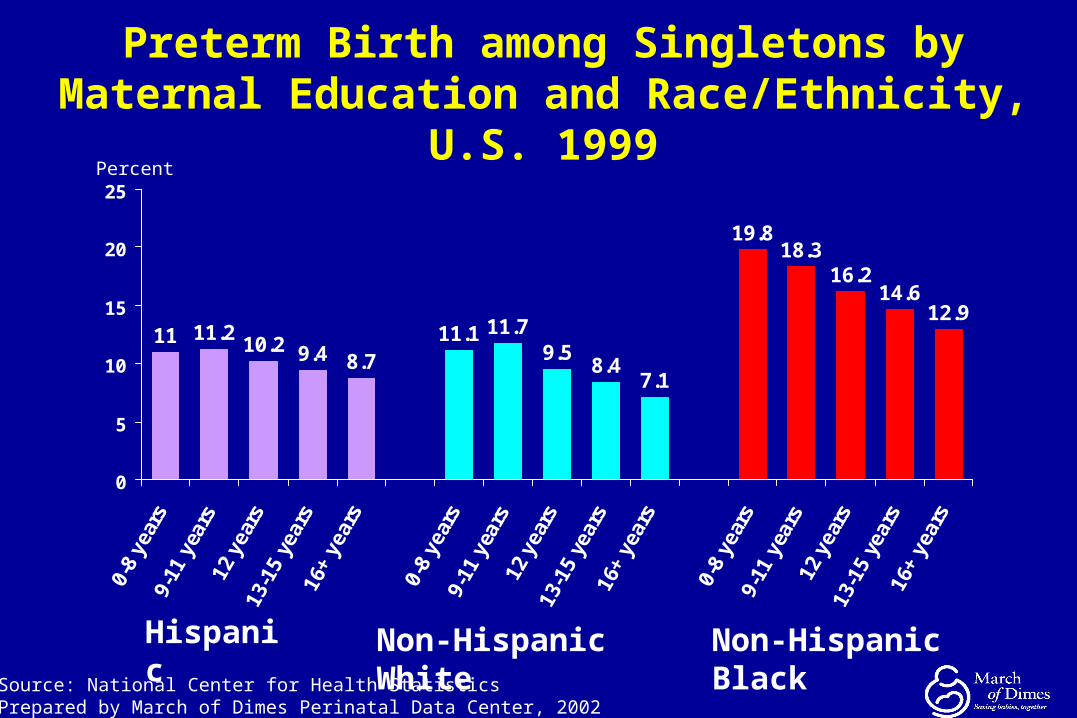
Preterm Birth among Singletons by Maternal Education and Race/Ethnicity, U.S. 1999
11 11.210.2 9.4 8.7
11.1 11.79.5
8.47.1
19.818.3
16.214.6
12.9
0
5
10
15
20
25
0-8
year
s9-
11 y
ears
12 y
ears
13-1
5 ye
ars
16+
year
s
0-8
year
s9-
11 y
ears
12 y
ears
13-1
5 ye
ars
16+
year
s
0-8
year
s9-
11 y
ears
12 y
ears
13-1
5 ye
ars
16+
year
s
Percent
Hispanic Non-Hispanic White Non-Hispanic BlackSource: National Center for Health StatisticsPrepared by March of Dimes Perinatal Data Center, 2002

Maternal age
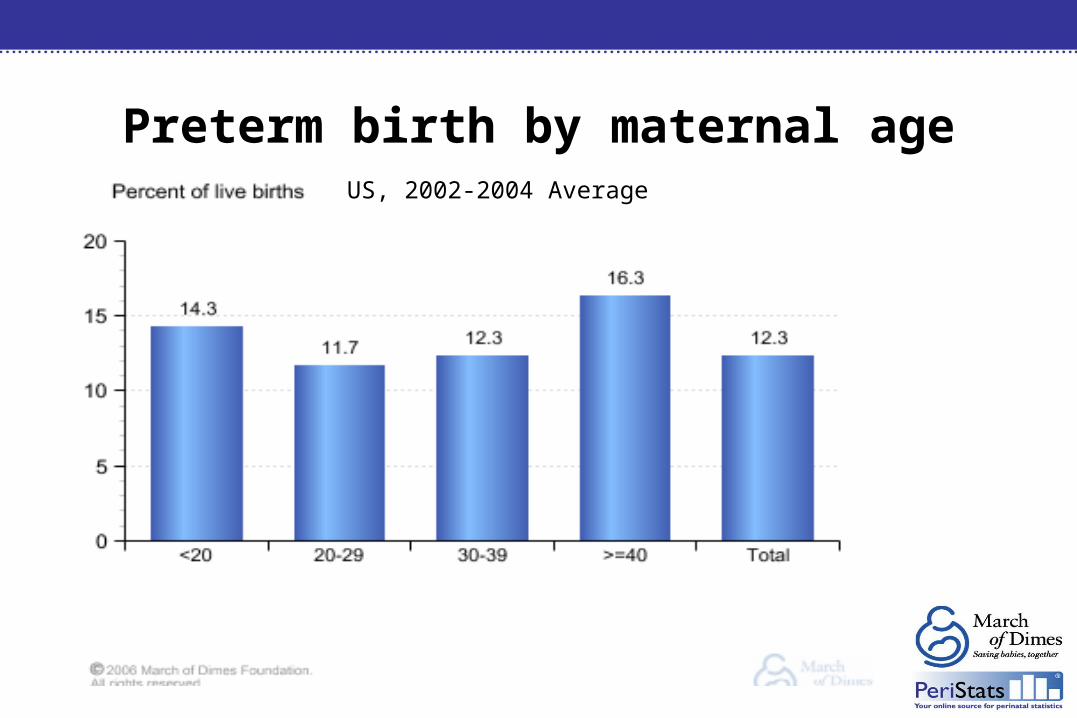
Preterm birth by maternal ageUS, 2002-2004 Average
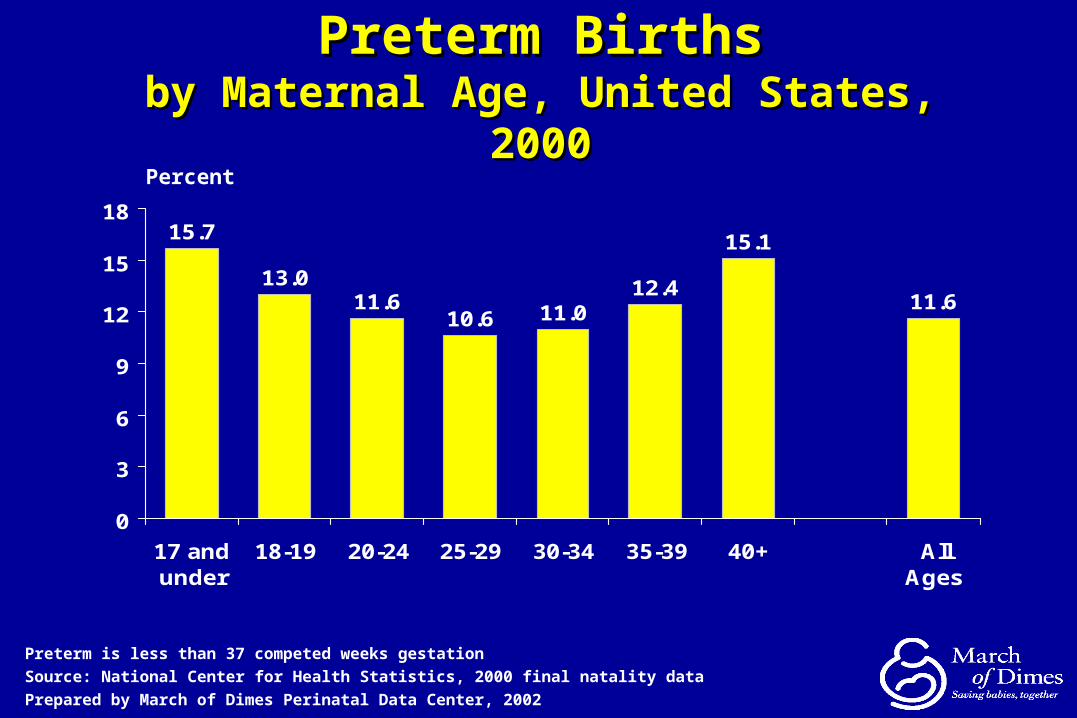
15.7
13.011.6
10.6 11.012.4
15.1
11.6
0
3
6
9
12
15
18
17 andunder
18-19 20-24 25-29 30-34 35-39 40+ AllAges
Percent
Preterm is less than 37 competed weeks gestation
Source: National Center for Health Statistics, 2000 final natality data
Prepared by March of Dimes Perinatal Data Center, 2002
Preterm BirthsPreterm Birthsby Maternal Age, United States, 2000by Maternal Age, United States, 2000

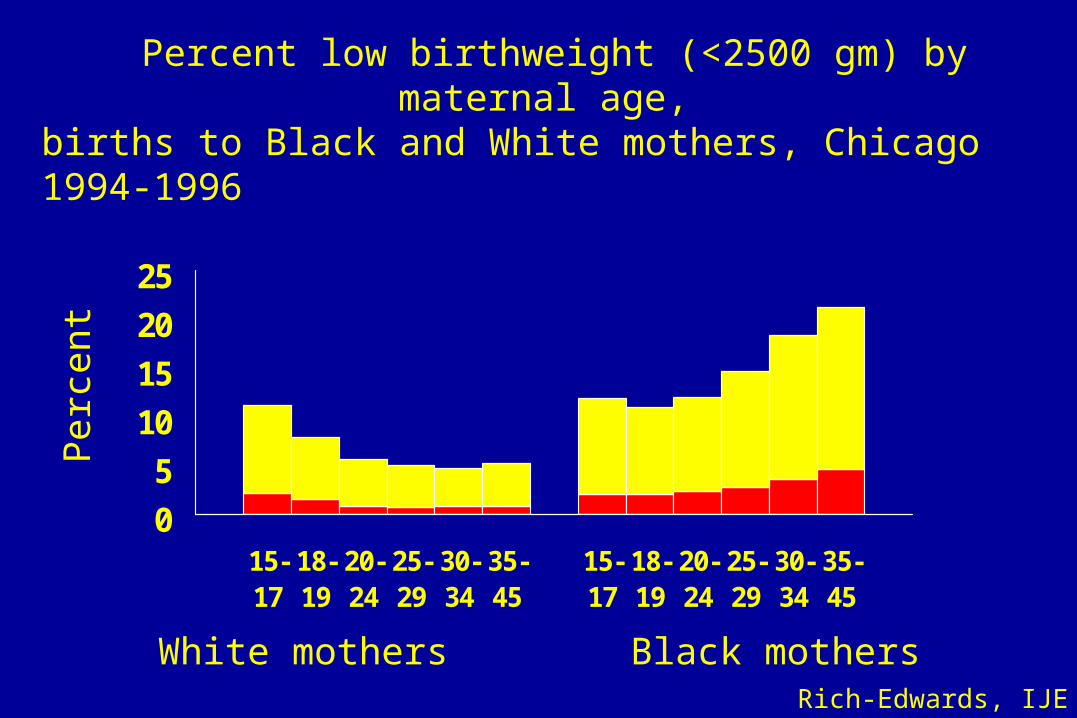
• Absolute black:white differences in risk of poor pregnancy outcomes at any age
• Different slopes for blacks and whites
with age
The next slides show associations of maternal age with poor pregnancy outcomes, stratified by maternal race/ethnicity. Pay attention to:
0
5
10
15
20
25
15-17
18-19
20-24
25-29
30-34
35-45
15-17
18-19
20-24
25-29
30-34
35-45
Percent low birthweight (<2500 gm) by maternal age, births to Black and White mothers, Chicago 1994-1996
White mothers Black mothers
Per
cent
Rich-Edwards, IJE
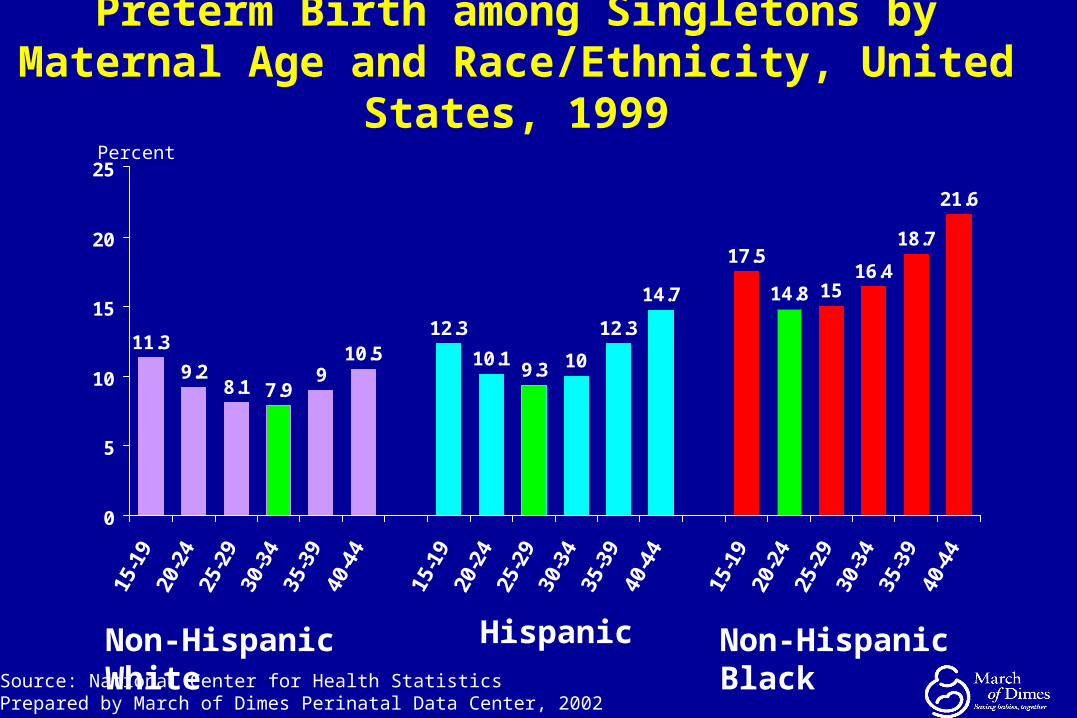
Preterm Birth among Singletons by Maternal Age and Race/Ethnicity, United States, 1999
11.3
9.28.1 7.9
910.5
12.3
10.19.3 10
12.3
14.7
17.5
14.8 1516.4
18.7
21.6
0
5
10
15
20
25
15-1
920
-24
25-2
930
-34
35-3
940
-44
15-1
920
-24
25-2
930
-34
35-3
940
-44
15-1
920
-24
25-2
930
-34
35-3
940
-44
Percent
Non-Hispanic White Hispanic Non-Hispanic BlackSource: National Center for Health StatisticsPrepared by March of Dimes Perinatal Data Center, 2002

• Absolute black:white differences in risk of poor pregnancy outcomes at any age
– effect of factors before reproductive maturity– genes?
– early environment of girls: birthweight, nutrition, stress, etc.
• Different slopes for blacks and whites with age
– exposures more prevalent with age– cumulative exposures
Weathering Hypothesis, Geronimus 1992
Health of African Americans “may begin to deteriorate in early adulthood as a physical consequence of cumulative socioeconomic disadvantage”

• Financial stress
• Chronic strain
• Family function
• Neighborhood function
• Violence
• Racism
Measurable elements of weathering
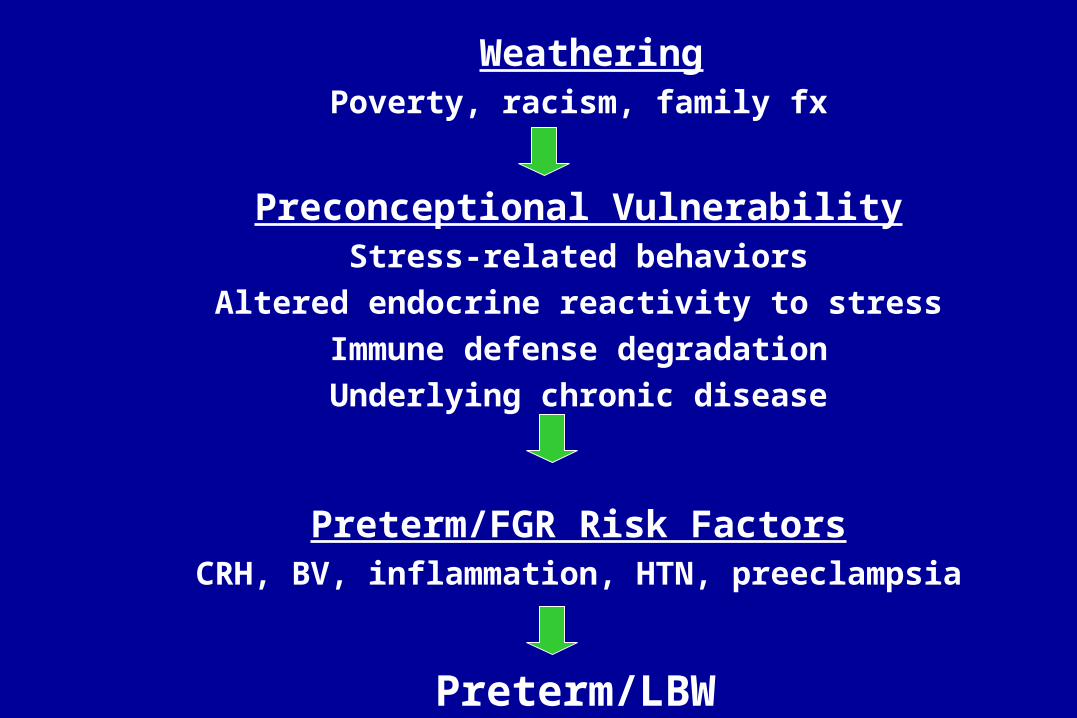
Weathering
Poverty, racism, family fx
Preconceptional VulnerabilityStress-related behaviors
Altered endocrine reactivity to stress
Immune defense degradation
Underlying chronic disease
Preterm/FGR Risk FactorsCRH, BV, inflammation, HTN, preeclampsia
Preterm/LBW
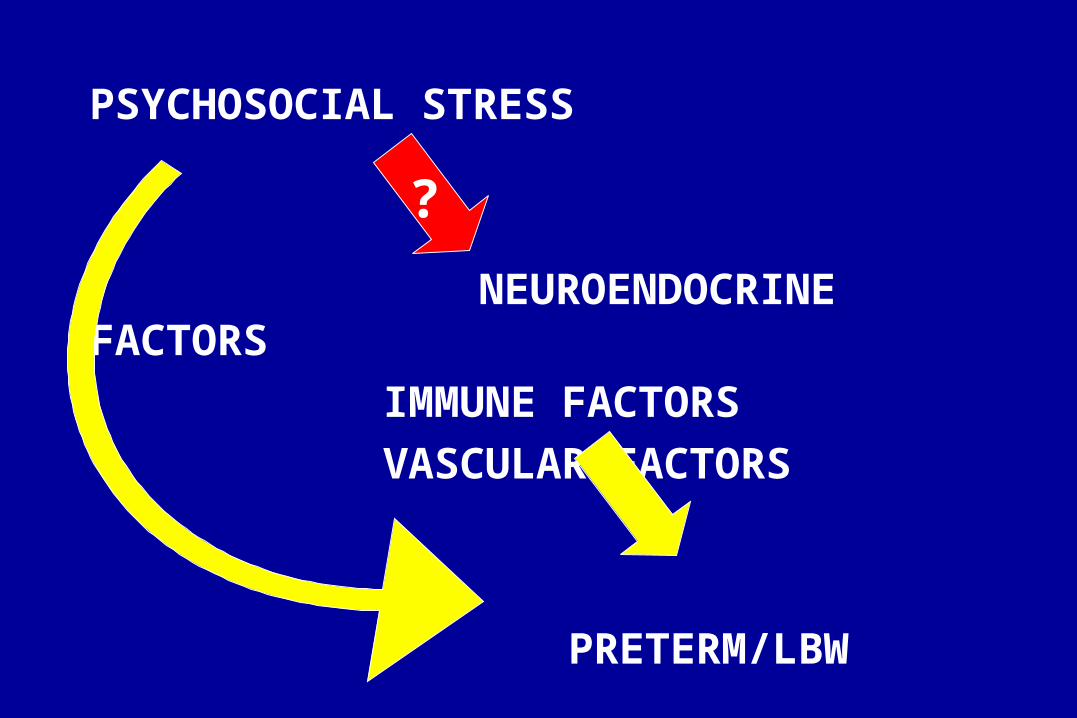
PSYCHOSOCIAL STRESS
NEUROENDOCRINE FACTORS
IMMUNE FACTORS
VASCULAR FACTORS
PRETERM/LBW
?
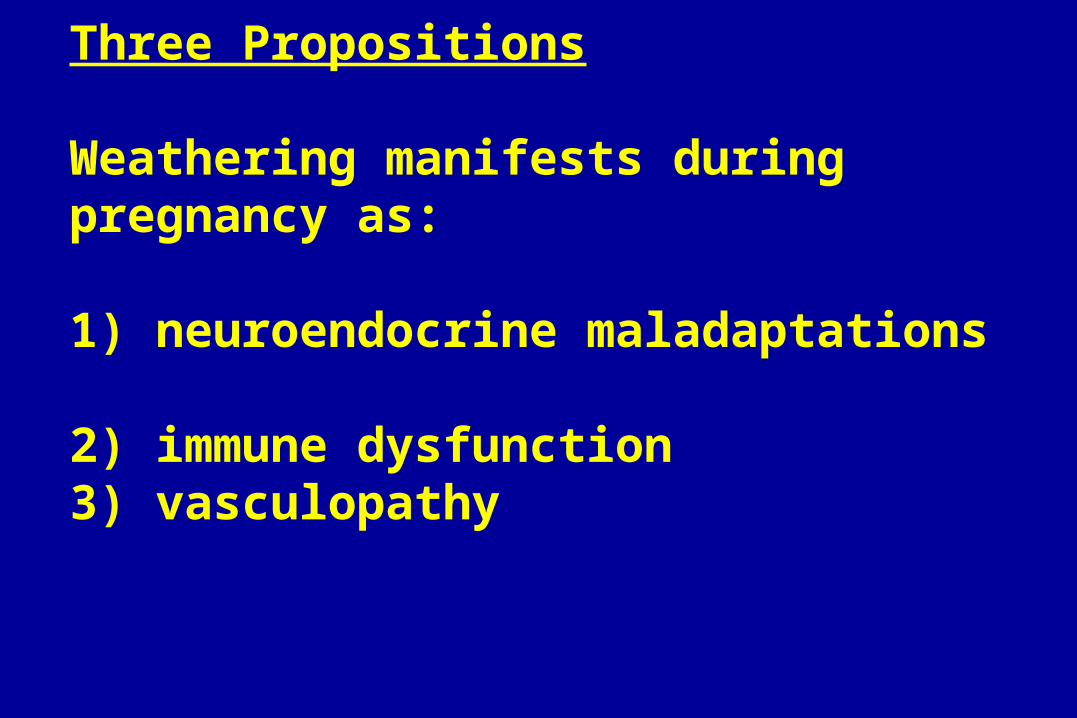
Three Propositions
Weathering manifests during pregnancy as:
1) neuroendocrine maladaptations 2) immune dysfunction3) vasculopathy

Proposition 1:Weathering manifests as
neuroendocrine maladaptations in pregnancy

MOTHER
CRH
ACTH
CORTISOL
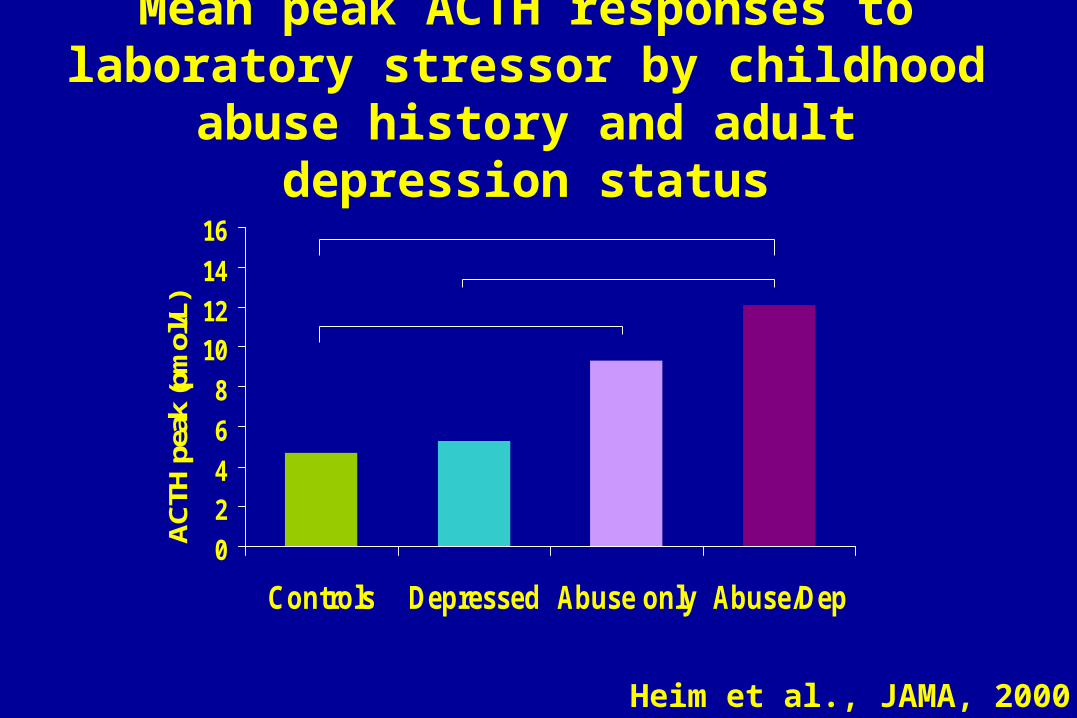
Mean peak ACTH responses to laboratory stressor by childhood abuse history and
adult depression status
0
24
6
8
1012
14
16
Controls Depressed Abuse only Abuse/Dep
AC
TH p
eak
(pm
ol/L
)
Heim et al., JAMA, 2000
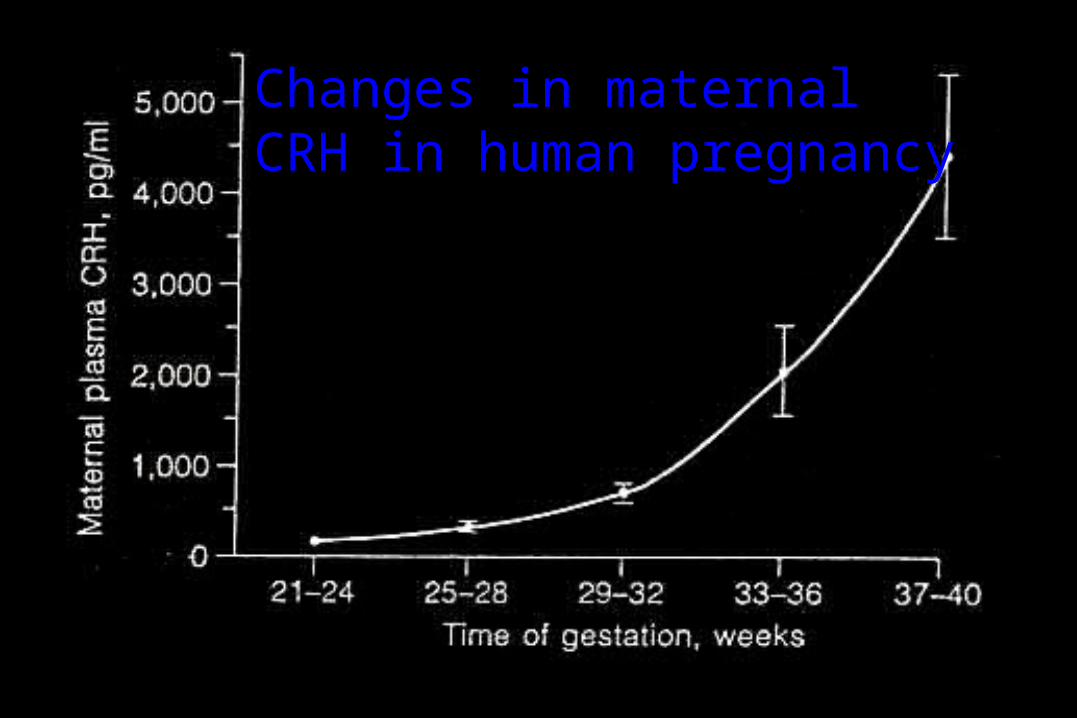
Changes in maternal CRH in human pregnancy
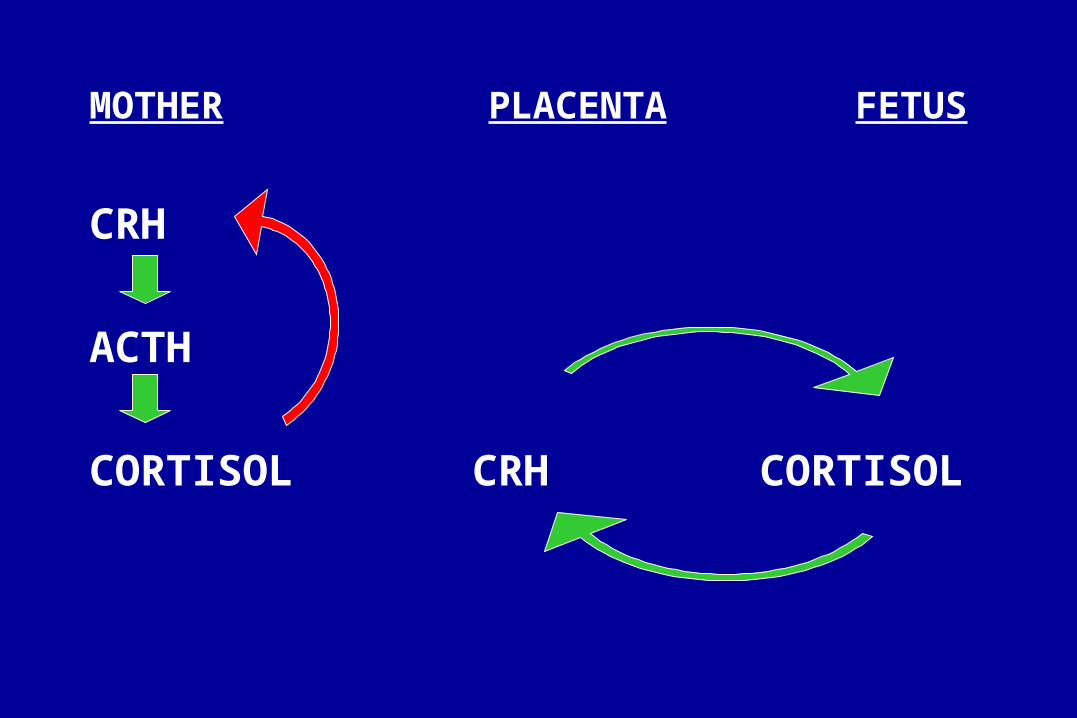
MOTHER PLACENTA FETUS
CRH
ACTH
CORTISOL CRH CORTISOL
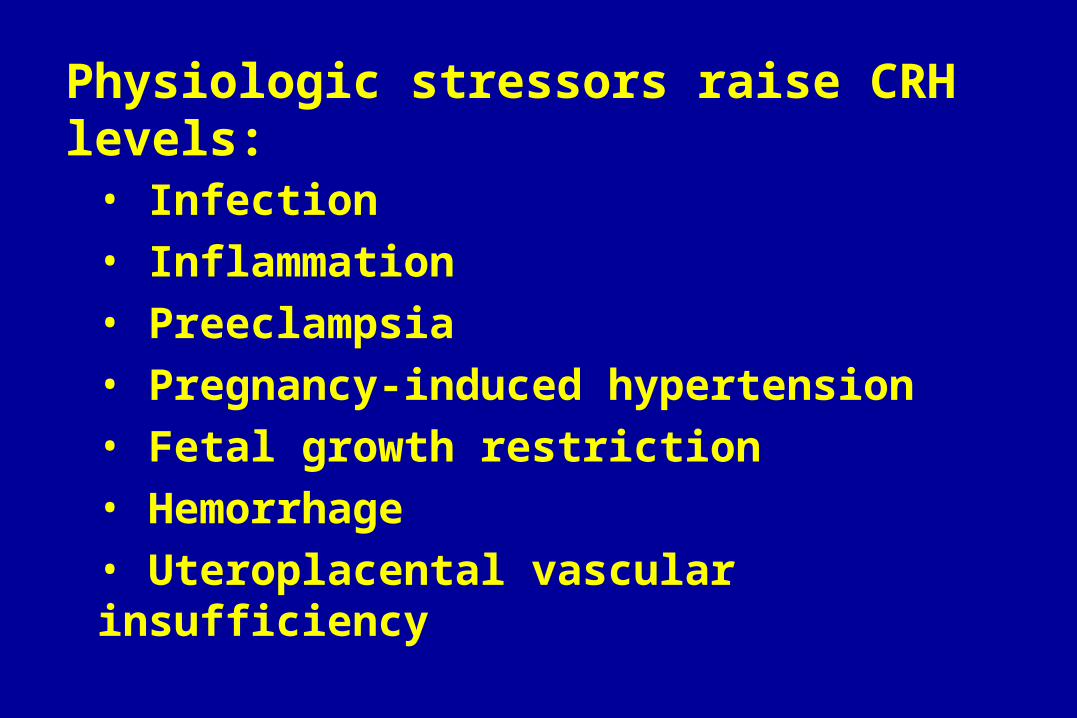
Physiologic stressors raise CRH levels:
• Infection
• Inflammation
• Preeclampsia
• Pregnancy-induced hypertension
• Fetal growth restriction
• Hemorrhage
• Uteroplacental vascular insufficiency
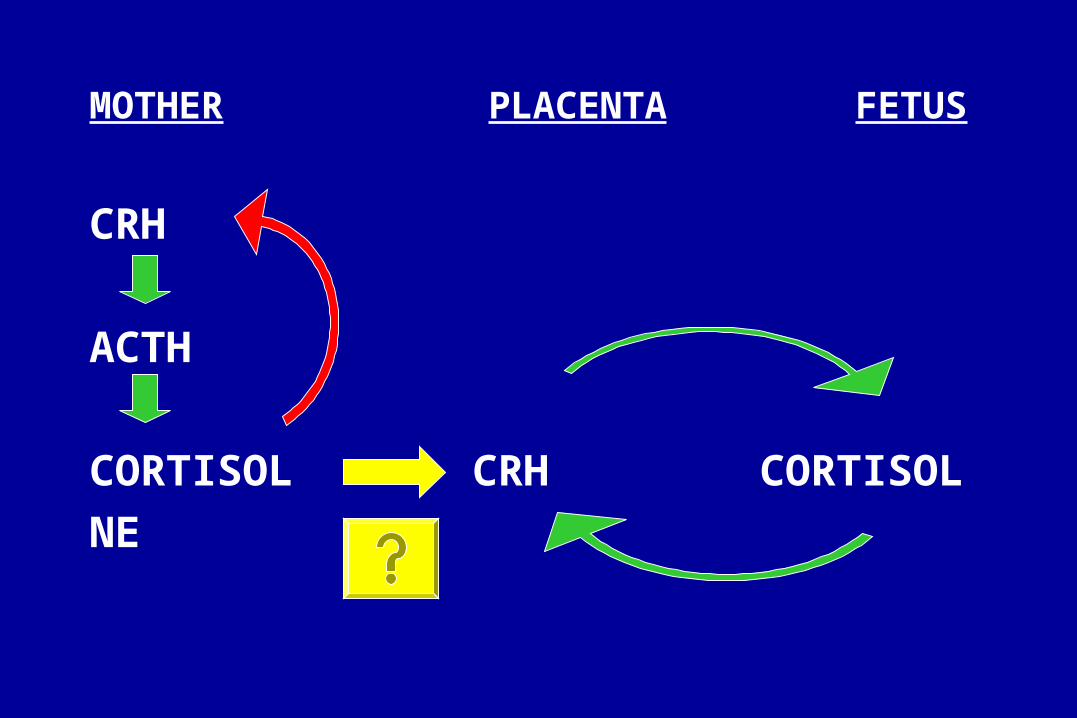
MOTHER PLACENTA FETUS
CRH
ACTH
CORTISOL CRH CORTISOL
NE

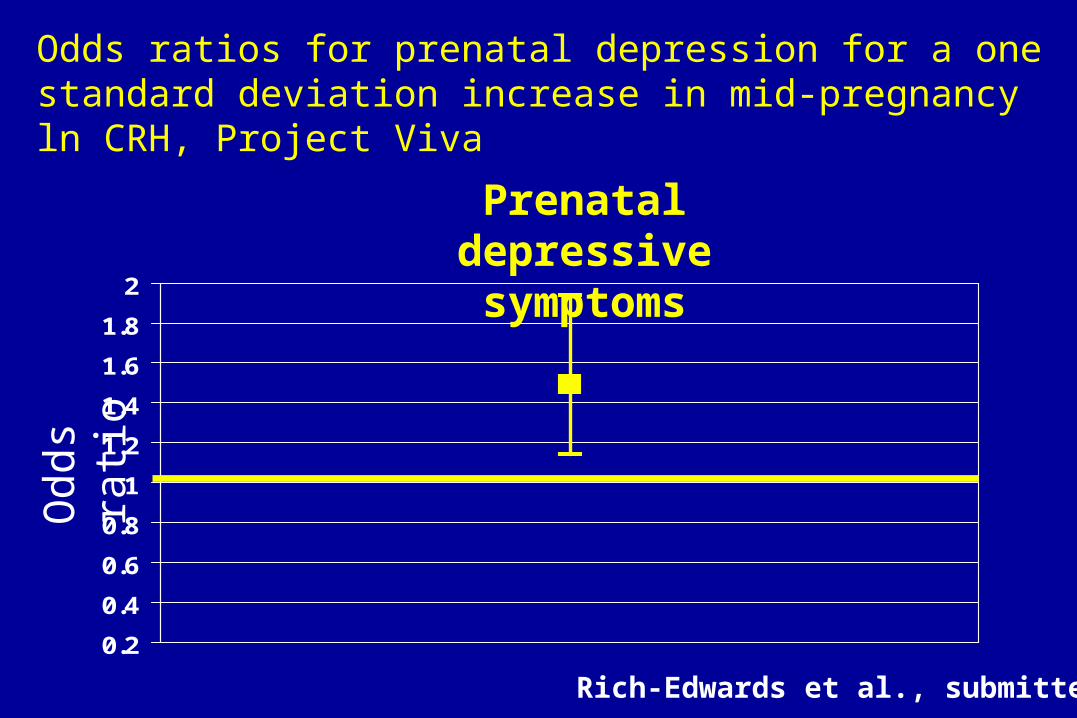
Does psychologic stress raise CRH?
• 2 out of 3 studies report ‘yes’(Hobel 1999, Hermann 2001, Petraglia 2001)
• 1 study: higher CRH with lower income(Hermann 2001)
0.2
0.4
0.6
0.8
1
1.2
1.4
1.6
1.8
2
Prenatal depressive symptoms
Odd
s r a
t io
Odds ratios for prenatal depression for a one standard deviation increase in mid-pregnancy ln CRH, Project Viva
Rich-Edwards et al., submitted
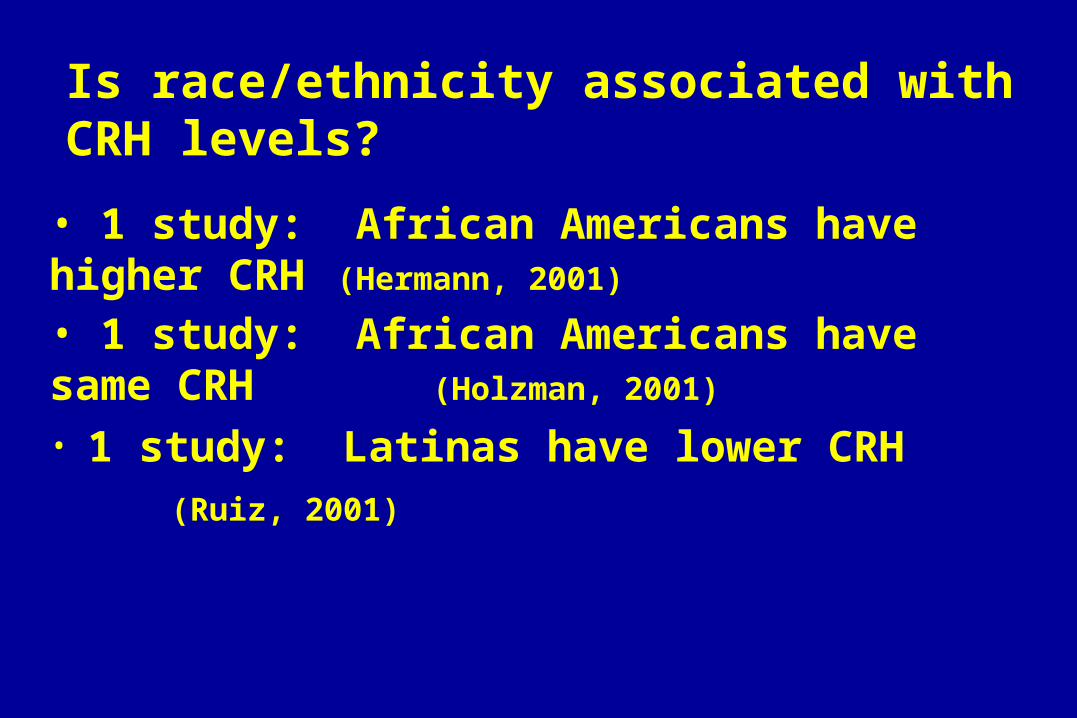
Is race/ethnicity associated with CRH levels?
• 1 study: African Americans have higher CRH (Hermann, 2001)
• 1 study: African Americans have same CRH (Holzman, 2001)
• 1 study: Latinas have lower CRH (Ruiz, 2001)
Proposition 2:Weathering manifests as
immune dysfunction in pregnancy
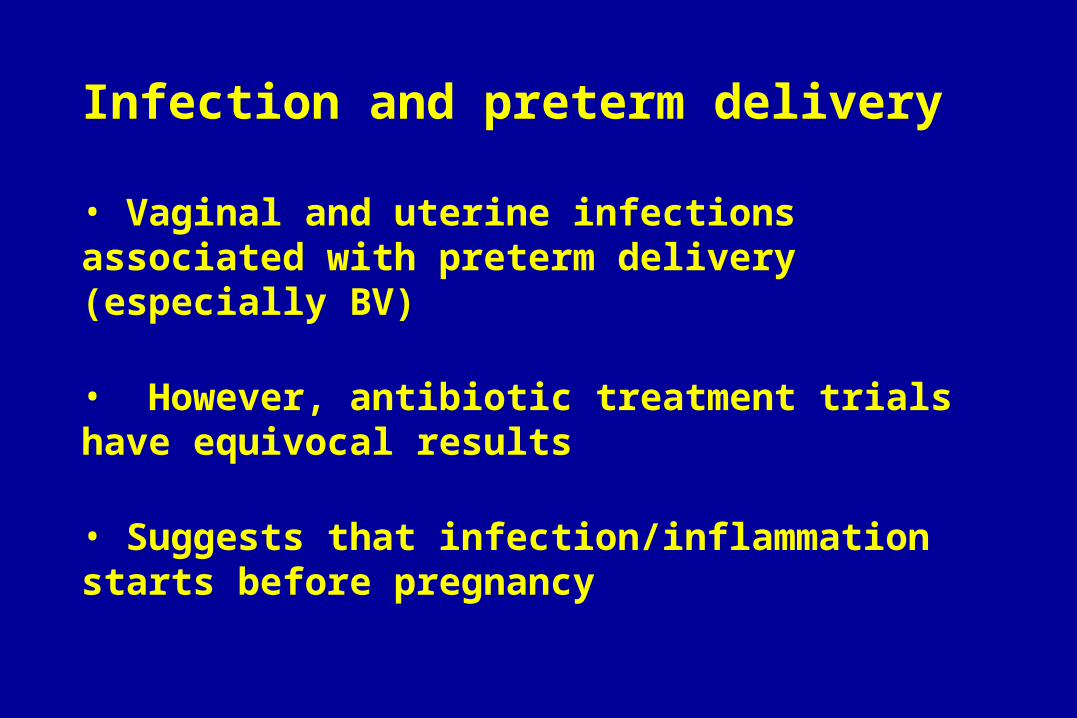
• Vaginal and uterine infections associated with preterm delivery (especially BV)
• However, antibiotic treatment trials have equivocal results
• Suggests that infection/inflammation starts before pregnancy
Infection and preterm delivery

• Non-pregnant state: psychosocial stress raises risk of viral illness, slows healing time (Kiecolt-Glaser, Cohen)
• High stress and low social support associated with depressed lymphocyte activity in pregnancy (Herrera 1998)
• High chronic stress associated with bacterial vaginosis during pregnancy (Culhane 2001)
Stress and Infection

Maternal stress and bacterial vaginosis status Maternal stress and bacterial vaginosis status
21
22
23
24
25
BV- Intermediate BV+
Mean
Ch
ron
ic S
tress S
co
re
Culhane, MCH Journal 2001
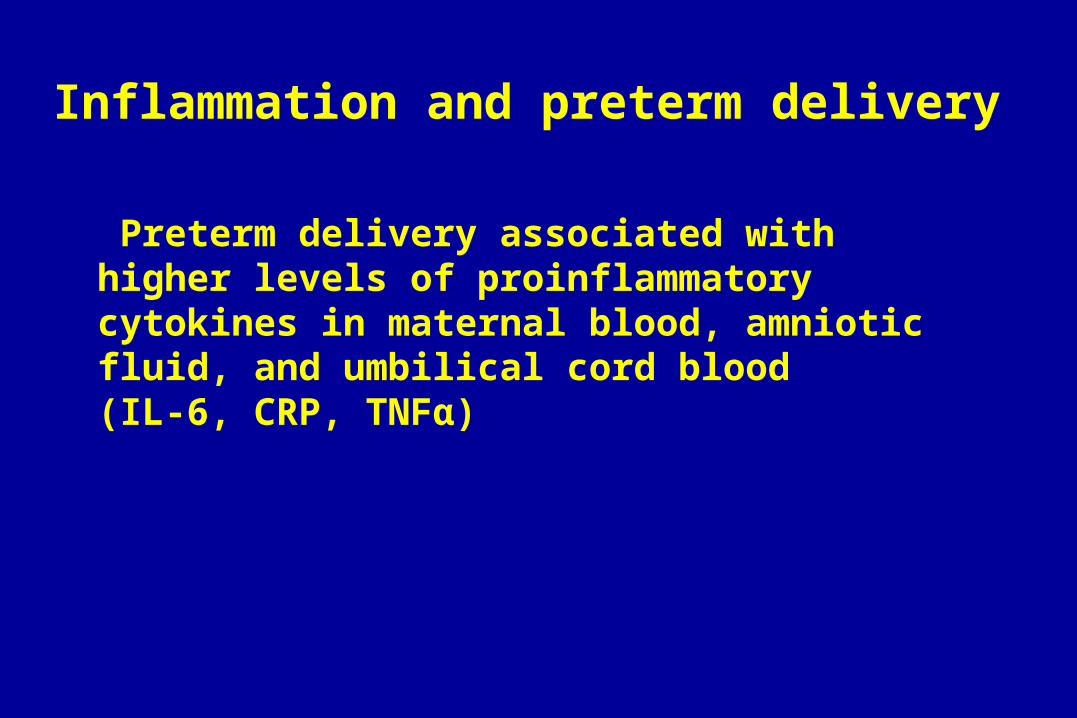
Preterm delivery associated with higher levels of proinflammatory cytokines in maternal blood, amniotic fluid, and umbilical cord blood(IL-6, CRP, TNFα)
Inflammation and preterm delivery
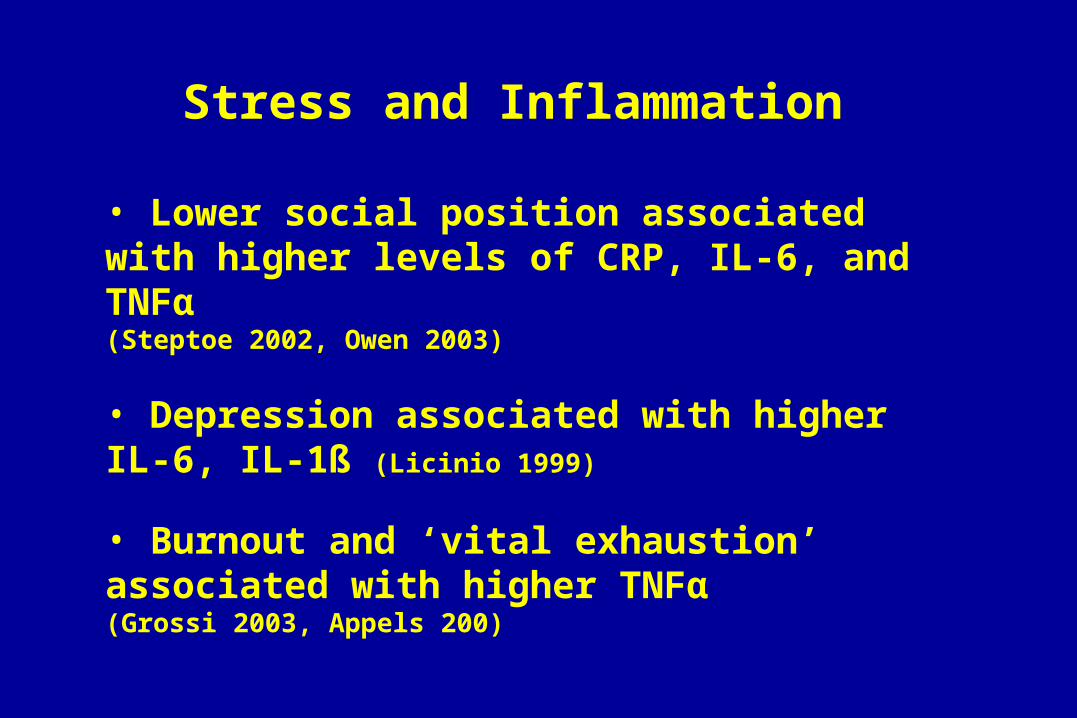
• Lower social position associated with higher levels of CRP, IL-6, and TNFα(Steptoe 2002, Owen 2003)
• Depression associated with higher IL-6, IL-1ß (Licinio 1999)
• Burnout and ‘vital exhaustion’ associated with higher TNFα(Grossi 2003, Appels 200)
Stress and Inflammation

• Inflammatory cytokines higher among women with hx of preterm delivery (Amory 2001)
• Periodontitis associated with preterm delivery and higher CRP levels (Pitiphat)
• Genes associated with high inflammatory response are associated with preterm PROM among African Americans (but not whites)(Roberts 1999; Dizon-Townson 1997)
Inflammation predates pregnancy?

Is proinflammatory state an:• Appropriate response to infection? • Ineffective downregulation? • Chronic inflammation?
Inflammation and preterm delivery

Proposition:Weathering manifests as
vasculopathy in pregnancy

0
0.1
0.2
0.3
0.4
0.5
0.6
0.7
0.8
0.9
1
0 15 25 35 45
Es
tim
ate
d O
dd
s
Black White
Estimated odds of hypertension among US women by age and race
Geronimus, 1992

• Uterine artery blood flow is lower in anxious women (Teixeria1999)
• Anxious mothers have blood flow patterns indicative of fetal hypoxia (Sjostrom1997)
Psychosocial stress and vasculopathy during pregnancy

Prenatal blood pressure response to laboratory stressor
Correlation with
DBP response
(mm Hg) p-value
Birthweight (gm) - 0.44 < 0.01
Gestational age (weeks) - 0.39 < 0.05
Fetal growth (gm/wk) - 0.36 < 0.05
McCubbin, AJOG 1996

Diastolic blood pressure reactivity to two types Diastolic blood pressure reactivity to two types of stressor, according to history of racial of stressor, according to history of racial discrimination, African American women discrimination, African American women
02
46
810
1214
Mirror Task Speech Task
DB
P r
eact
ivit
y (m
m H
g)
No discriminationDiscrimination
Guyll, Health Psychol, 2001
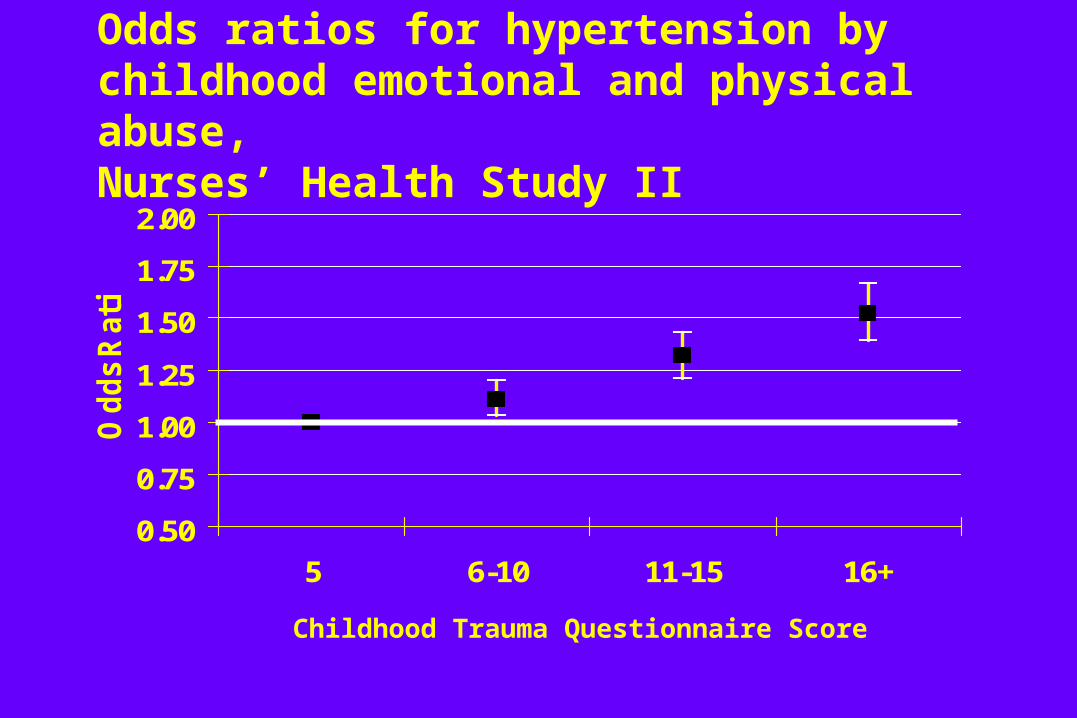
0.50
0.75
1.00
1.25
1.50
1.75
2.00
5 6-10 11-15 16+
Od
ds
Ra
tio
Odds ratios for hypertension by childhood emotional and physical abuse, Nurses’ Health Study II
Childhood Trauma Questionnaire Score

PSYCHOSOCIAL STRESS
NEUROENDOCRINE FACTORS
IMMUNE FACTORS
VASCULAR FACTORS
PRETERM/LBW
?
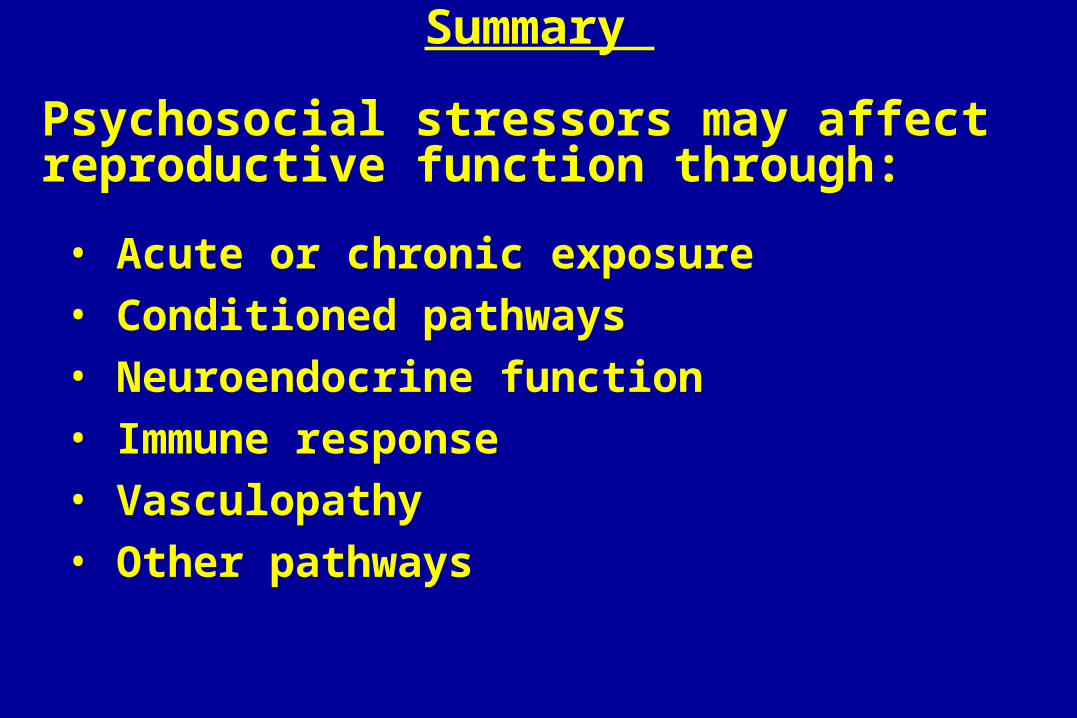
Summary
Psychosocial stressors may affect reproductive function through:
• Acute or chronic exposure
• Conditioned pathways
• Neuroendocrine function
• Immune response
• Vasculopathy
• Other pathways

In other words:
• Reproductive success or failure reflects both cumulative (weathering) and current exposures
• Reproductive events are sentinels of chronic disease in the mother
• Maternal exposures and maternal health predict chronic disease in the child

Lifecourse approach:
• Reproductive success or failure reflects both cumulative and current exposures
• Reproductive events are sentinels of chronic disease in the mother
• Maternal exposures and maternal health predict chronic disease in the child
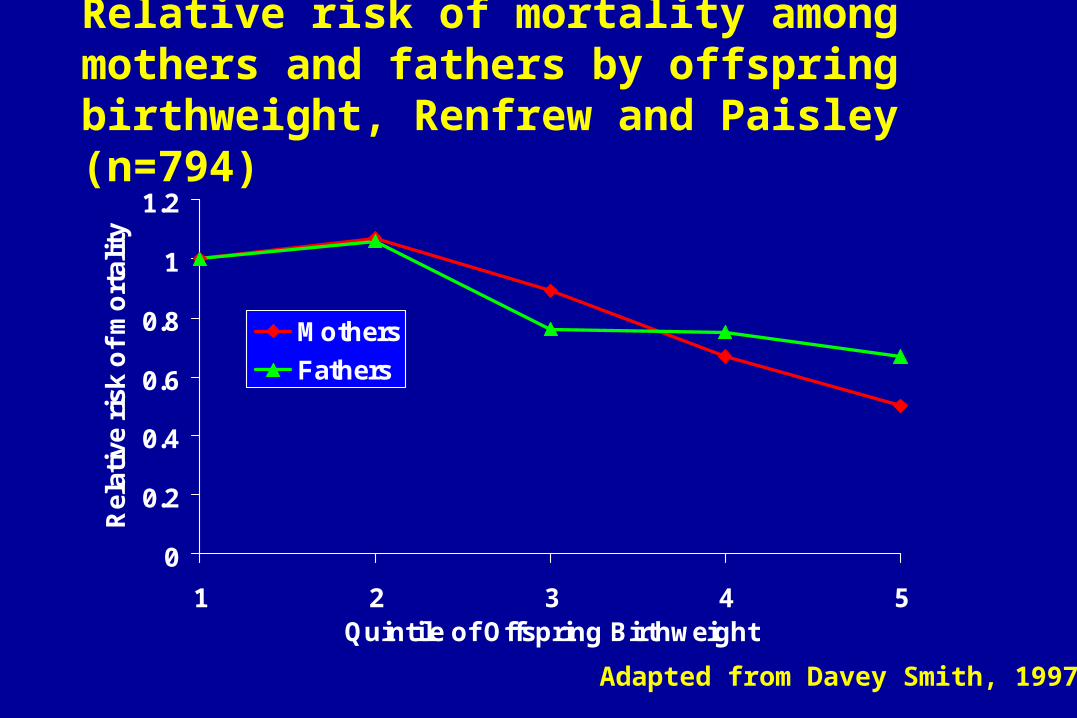
Relative risk of mortality among mothers and fathers by offspring birthweight, Renfrew and Paisley (n=794)
0
0.2
0.4
0.6
0.8
1
1.2
1 2 3 4 5Quintile of Offspring Birthweight
Rel
ativ
e ri
sk o
f m
ort
alit
y
Mothers
Fathers
Adapted from Davey Smith, 1997

Relation between infants’ birthweight and mothers’ mortality, England and Wales, 1976-1997, n~45,000
Relative risk mothers’ death
Birthweight # births All cause Cardiovascular
<2500g 3,891 3.1 (2.2-4.4) 7.1 (2.6-18.8)
2500-3499 27,360 1.8 (1.0-1.7) 2.0 (0.8-4.8)
>3500 13,562 1.0 (referent) 1.0 (referent)
Per 1000g 1.6 (1.4-1.9) 2.3 (1.5-3.4)
Davey Smith, BMJ, 2000

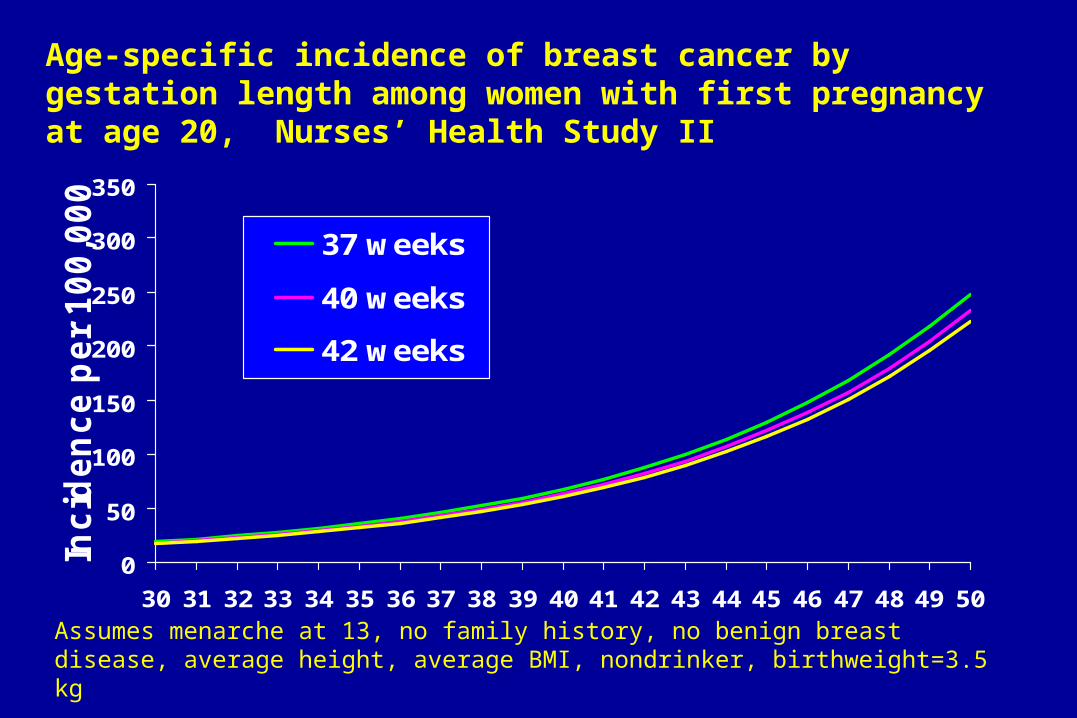
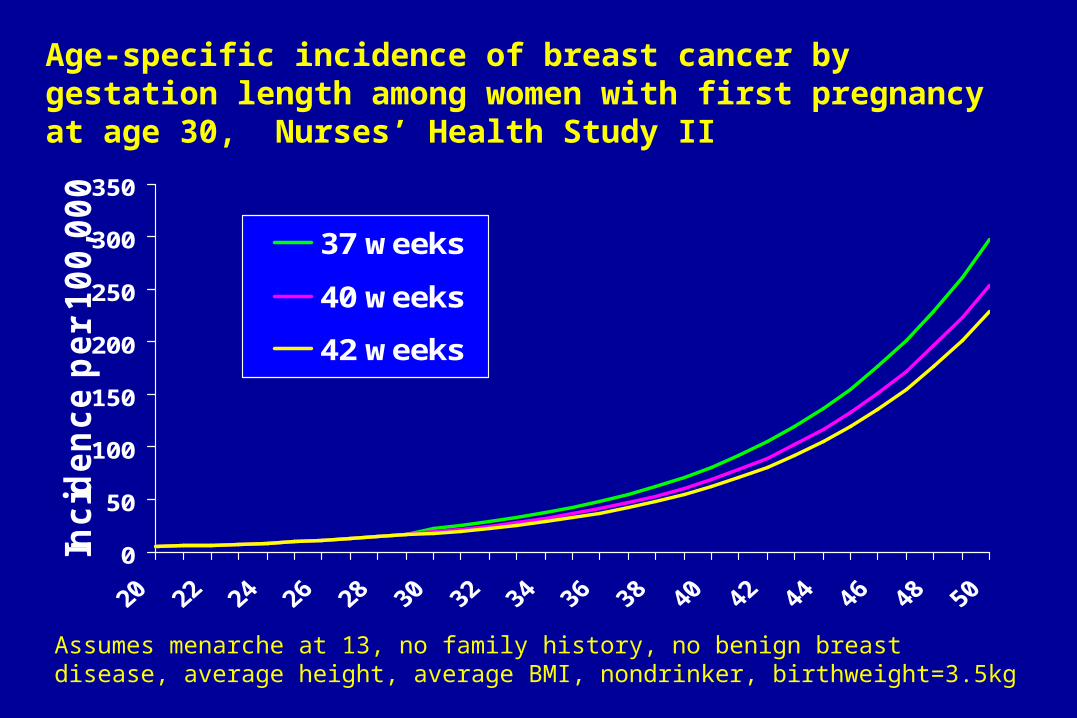
Relative risks for premenopausal breast cancer by characteristics of first pregnancy, Nurses’ Health Study II
Relative Risk (95%CI)
1st pregnancy at 20 1st pregnancy at 30
Birthweight (gm), p-trend=0.005
2500 0.90 (0.89-0.96) 0.77 (0.64-0.93)
3500 1.00 1.00
4500 1.11 (1.03-1.20) 1.29 (1.08-1.55)
Gestation length (weeks), p-trend=0.02
37 (preterm) 1.07 (1.01-1.13) 1.17 (1.03-1.33)
40 (term) 1.00 1.00
42 (post-term) 0.96 (0.92-0.99) 0.90 (0.83-0.98)
0
50
100
150
200
250
300
350
30 31 32 33 34 35 36 37 38 39 40 41 42 43 44 45 46 47 48 49 50
Inc
ide
nc
e p
er
10
0,0
00
py
37 weeks
40 weeks
42 weeks
Assumes menarche at 13, no family history, no benign breast disease, average height, average BMI, nondrinker, birthweight=3.5 kg
Age-specific incidence of breast cancer by gestation length among women with first pregnancy at age 20, Nurses’ Health Study II
0
50
100
150
200
250
300
350
Inc
ide
nc
e p
er
10
0,0
00
py
37 weeks
40 weeks
42 weeks
Assumes menarche at 13, no family history, no benign breast disease, average height, average BMI, nondrinker, birthweight=3.5kg
Age-specific incidence of breast cancer by gestation length among women with first pregnancy at age 30, Nurses’ Health Study II

0
50
100
150
200
250
300
350
30 31 32 33 34 35 36 37 38 39 40 41 42 43 44 45 46 47 48 49 50
Inc
ide
nc
e p
er
10
0,0
00
py
2.5 kg
3.5 kg
4.5 kg
Assumes menarche at 13, no family history, no benign breast disease, average height, average BMI, nondrinker, gestation length=40 weeks
Age-specific incidence of breast cancer by first offspring birthweight among women with first pregnancy at age 20, Nurses’ Health Study II

0
50
100
150
200
250
300
350
30 31 32 33 34 35 36 37 38 39 40 41 42 43 44 45 46 47 48 49 50
Inc
ide
nc
e p
er
10
0,0
00
py
2.5 kg
3.5 kg
4.5 kg
Age-specific incidence of breast cancer by offspring birthweight among women with first pregnancy at age 30, Nurses’ Health Study II
Assumes menarche at 13, no family history, no benign breast disease, average height, average BMI, nondrinker, gestation length=40 weeks

0.5
0.75
1
1.25
1.5
1.75
<5.5 5.5-<7 7-<8.5 8.5-<10 >=10Birthweight, lbs
Haz
ard
Rat
io
Own Offspring
Adjusted hazard ratios for breast cancer by own birthweight and offspring birthweight

Broad strokes:
• Reproductive status reflects childhood and adult exposures
• Reproductive health may be an early warning of chronic disease processes
• Safeguarding the health of girls may yield future benefits in the health of women and future generations