Life Insurance AssetManagement Telecom IT-ITeS ... Meet/100303_20100507.pdfCombined Assets under...
39
Aditya Birla Nuvo Limited Aditya Birla Nuvo Limited Investor Presentation : Annual Performance Review FY2009 Investor Presentation : Annual Performance Review FY2009-10 10 Mumbai, Mumbai, 7 th th May 2010 May 2010 strong strong foundation foundation energised energised growth growth Stock Code – BSE : 500303 NSE : ABIRLANUVO Reuters : ABRL.BO / ABRL.NS / IRYN.LU Bloomberg : ABNL IN / NABNL IN / IRIG LX Life Insurance AssetManagement Telecom IT-ITeS Branded Apparels Carbon Black Fertilisers Insulators Viscose FilamentYarn Textiles
Transcript of Life Insurance AssetManagement Telecom IT-ITeS ... Meet/100303_20100507.pdfCombined Assets under...
Aditya Birla Nuvo LimitedAditya Birla Nuvo Limited
Investor Presentation : Annual Performance Review FY2009Investor Presentation : Annual Performance Review FY2009--1010
Mumbai,Mumbai, 77thth May 2010May 2010
strongstrong foundationfoundation energisedenergised growthgrowth
Stock Code – BSE : 500303 NSE : ABIRLANUVO Reuters : ABRL.BO / ABRL.NS / IRYN.LU Bloomberg : ABNL IN / NABNL IN / IRIG LXStock Code – BSE : 500303 NSE : ABIRLANUVO Reuters : ABRL.BO / ABRL.NS / IRYN.LU Bloomberg : ABNL IN / NABNL IN / IRIG LX
Life Insurance Asset Management Telecom IT-ITeS Branded Apparels
Carbon Black Fertilisers Insulators Viscose Filament Yarn Textiles
2
Key Highlights 3 – 12
Financial Performance 13 – 17
Annexure – Balance Sheet & Business-wise financials 18 – 39
Contents

3
India Inc. : Momentum continues with a positive outlook …
India’s real GDP is expected to grow by 7.2% in FY’09-10 (Adv ance estimate; Source : Ministry of Statistics and Programme Implementation)
GDP growth for FY’10-11 projected at 8% (Source : RBI)
Key economic indicators signaling positive outlook:
The Index of Industrial Production (IIP) grew by 10.1%* during Apr’09-Feb’10 compared to 2.7% during
last year (*Quickestimate; Source : Ministry of Statisticsand Programme Implementation)
FII net inflows in FY’09-10 aggregated ~USD 30 billion (Source : SEBI)
Private consumption and investment demand to be the major growth drivers ahead
To fuel its growth, India Inc. raised ~USD 9 bn through QIPs & ~USD 5 bn through IPOs in FY’09-10
Inflation, rise in interest rates & global economic cues will be key factors to watch going forward
0
4
8
12
FY08 FY09 Apr-Feb'10
IIP Growth (%)
0
4
8
12
FY08 FY09 FY10E FY11E
GDP Growth (%)

4
Aditya Birla Financial Services : Be a leader & role model with a broad based & integrated business
Combined revenues1 grew by 23% to ~ Rs. 5,850 Cr. (~USD 1.25 billion2)
Combined Assets under Management rose by 42% to Rs. 82,140 Cr. (~USD 18 billion)
Maiden Aditya Birla Private Equity Fund closed at a size of Rs. 881 Cr.
Telecom: Building sustainable competitiveness while maintaining growth momentum
Revenue market share3 grew from 11.4% to 12.7% during calendar year 2009 amidst hyper competition
Became Pan India player & added 1/3 of its subscribers base in FY10 itself to reach 63.82 million subscribers
IT-ITeS: Augmenting capabilities and building strong order book with a focus on bottom-line
Acquired UK based ‘Compass BPO Ltd.’ to strengthen F&A capabilities
Posted EBITDA at Rs. 104.7 Cr., an improvement of Rs. 100 Cr. over last year
Garments: Capitalising on expanded retail space to achieve profitable growth
Improvement of over Rs. 150 Cr. in EBITDA led by 15% sales growth in retail channel & cost rationalisation
Manufacturing businesses: Capturing sector growth and realising full potential
Combined together, posted highest ever EBITDA at Rs. 748 Cr. achieving 29% y-o-y growth
Carbon Black capacity expansion by 85K MT is targeted to commence production by the end of May’10
Aditya Birla Nuvo : Continuous pursuit of objectives ...
3incl.Spicebased on gross revenues for UAS & Mobile license only, as released byTRAI2Note : 1 USD = Rs. 45; 1 billion=100 Cr.1Excl. Income / (Loss) on Policyholders’ Funds
5
Q1FY10 Q2FY10 Q3FY10 Q4FY10
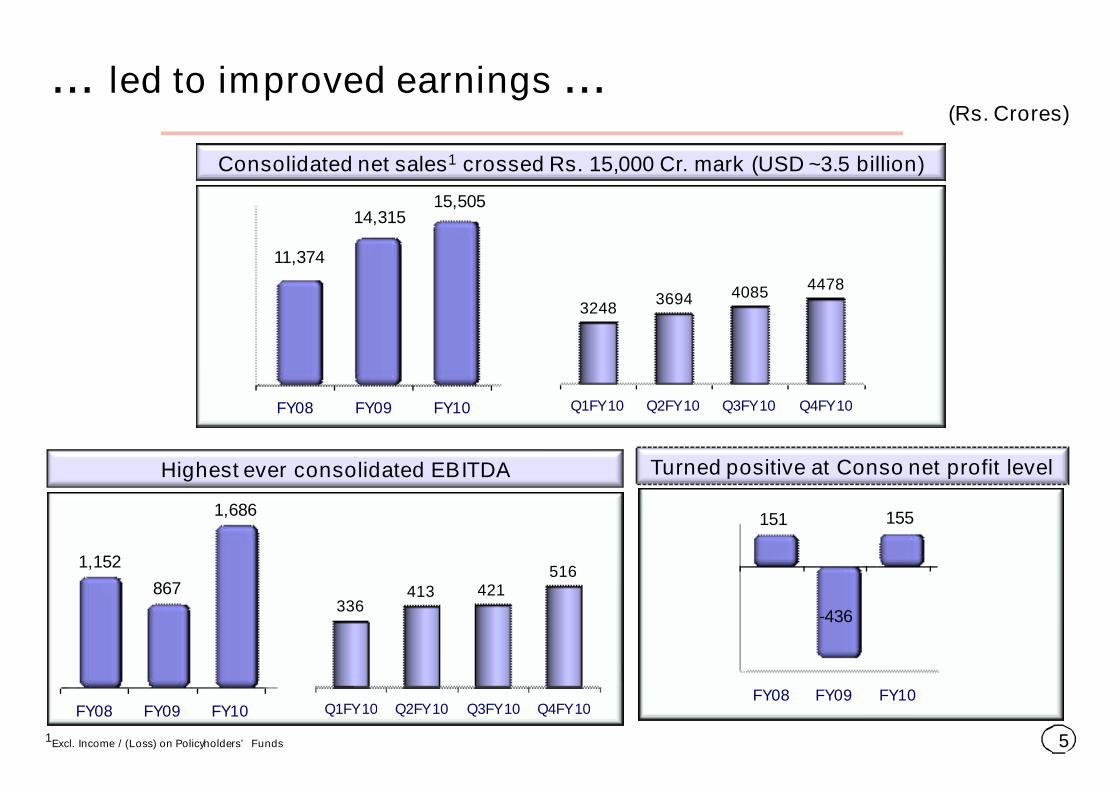
336413 421
516
... led to improved earnings ...
Consolidated net sales1 crossed Rs. 15,000 Cr. mark (USD ~3.5 billion)
Q1FY10 Q2FY10 Q3FY10 Q4FY10
32483694 4085 4478
FY08 FY09 FY10
11,374
14,31515,505
Highest ever consolidated EBITDA
FY08 FY09 FY10
1,152
867
1,686
FY08 FY09 FY10
151
-436
155
1Excl. Income / (Loss) on Policyholders’ Funds
Turned positive at Conso net profit level
(Rs. Crores)
6
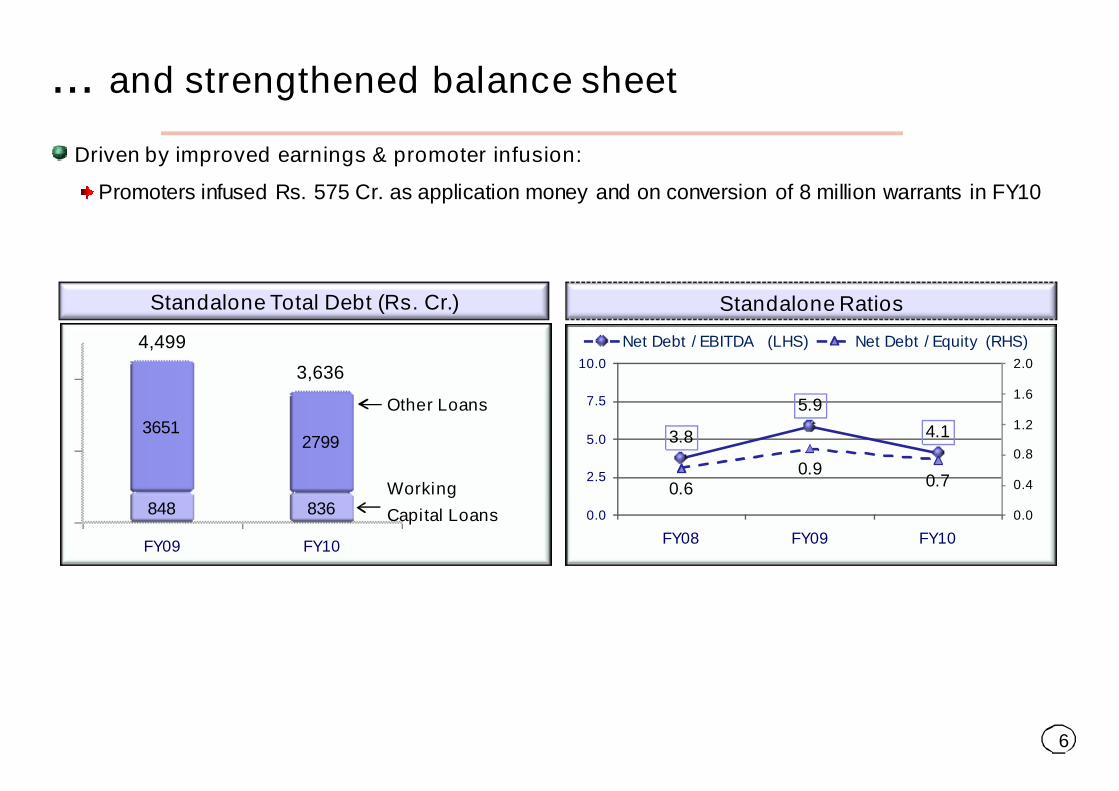
Driven by improved earnings & promoter infusion:
Promoters infused Rs. 575 Cr. as application money and on conversion of 8 million warrants in FY10
... and strengthened balance sheet
Standalone Total Debt (Rs. Cr.)
3.8
5.9
4.1
0.60.9
0.7
0.0
0.4
0.8
1.2
1.6
2.0
0.0
2.5
5.0
7.5
10.0
FY08 FY09 FY10
Net Debt / EBITDA (LHS) Net Debt / Equity (RHS)
FY09 FY10
848 836
36512799
Other Loans
Working
Capital Loans
4,499
3,636
Standalone Ratios
7
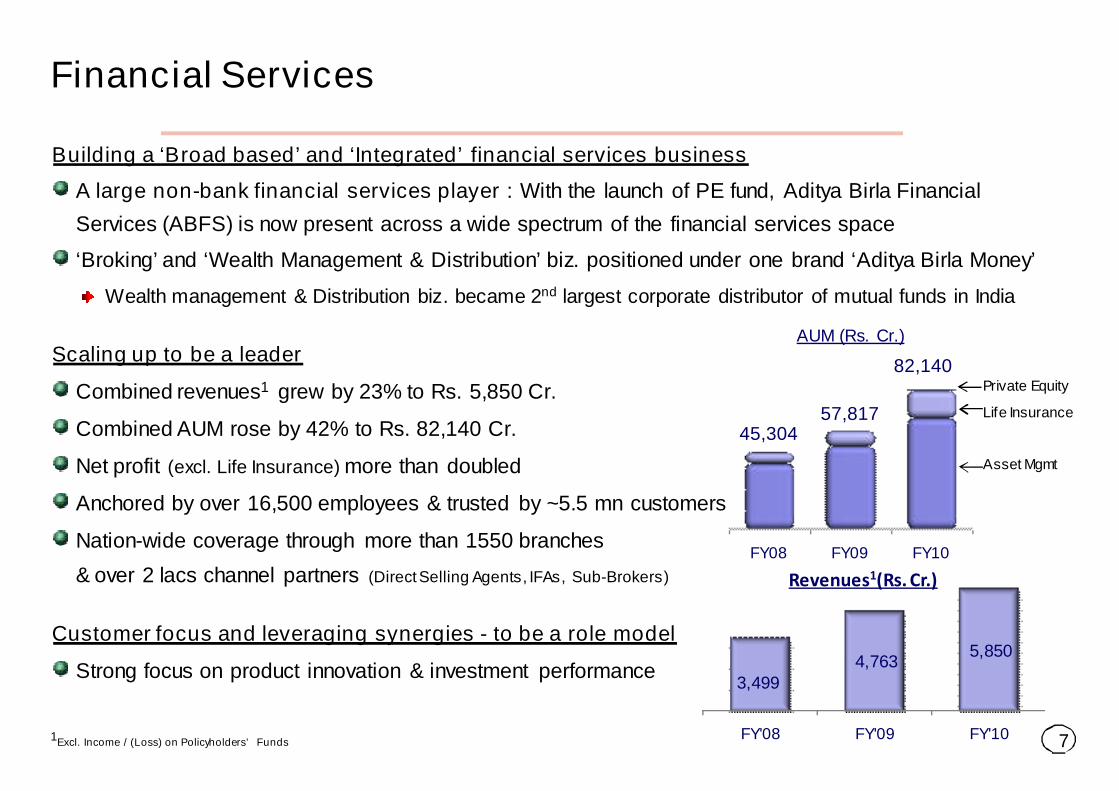
Building a ‘Broad based’ and ‘Integrated’ financial services business
A large non-bank financial services player : With the launch of PE fund, Aditya Birla Financial
Services (ABFS) is now present across a wide spectrum of the financial services space
‘Broking’ and ‘Wealth Management & Distribution’ biz. positioned under one brand ‘Aditya Birla Money’
Wealth management & Distribution biz. became 2nd largest corporate distributor of mutual funds in India
Scaling up to be a leader
Combined revenues1 grew by 23% to Rs. 5,850 Cr.
Combined AUM rose by 42% to Rs. 82,140 Cr.
Net profit (excl. Life Insurance) more than doubled
Anchored by over 16,500 employees & trusted by ~5.5 mn customers
Nation-wide coverage through more than 1550 branches
& over 2 lacs channel partners (DirectSelling Agents, IFAs, Sub-Brokers)
Customer focus and leveraging synergies - to be a role model
Strong focus on product innovation & investment performance3,499
4,7635,850
FY'08 FY'09 FY'10
Revenues1(Rs. Cr.)
Life Insurance
Asset Mgmt
Private Equity
FY08 FY09 FY10
AUM (Rs. Cr.)
45,304
82,140
57,817
Financial Services
1Excl. Income / (Loss) on Policyholders’ Funds
8
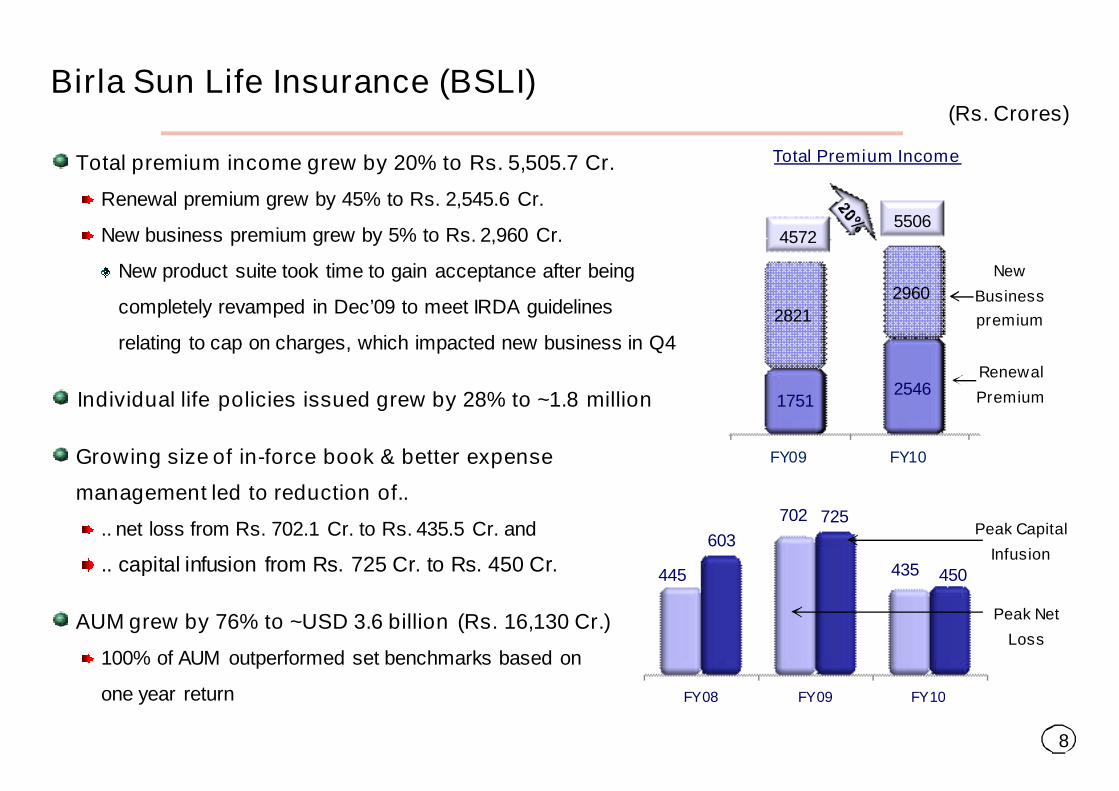
Total premium income grew by 20% to Rs. 5,505.7 Cr.
Renewal premium grew by 45% to Rs. 2,545.6 Cr.
New business premium grew by 5% to Rs. 2,960 Cr.
New product suite took time to gain acceptance after being
completely revamped in Dec’09 to meet IRDA guidelines
relating to cap on charges, which impacted new business in Q4
Individual life policies issued grew by 28% to ~1.8 million
Growing size of in-force book & better expense
management led to reduction of..
.. net loss from Rs. 702.1 Cr. to Rs. 435.5 Cr. and
.. capital infusion from Rs. 725 Cr. to Rs. 450 Cr.
AUM grew by 76% to ~USD 3.6 billion (Rs. 16,130 Cr.)
100% of AUM outperformed set benchmarks based on
one year return
Birla Sun Life Insurance (BSLI)
New
Business
premium
FY09 FY10
17512546
2821
2960
Total Premium Income
45725506
Renewal
Premium
FY08 FY09 FY10
445
702
435
603
725
450
Peak Net
Loss
Peak Capital
Infusion
(Rs. Crores)

9
Mar'08 Mar'09 Mar'10
38,411
48,649
65,130
Completed 15 years’ journey of wealth creation
Total avg. AUM at ~ USD 14.5 billion (Rs. 65,130 Cr.) registered
34% y-o-y growth
Equity avg. AUM (Incl. offshore) more than doubled from
Rs. 5,872 Cr. to Rs. 13,470 Cr.
Ranked amongst top 3 equity mobilisers in FY10, garnering domestic
equity net sales of Rs. 2,041 Cr. compared to industry’s Rs. 1,456 Cr.
Achieved highest growth rate in domestic avg. equity AUM amongst
top 5 players, led by higher net sales and strong fund performance
Launched Capital Protection fund mobilising over Rs. 640 Cr.
Recorded highest no. of funds in 4 & 5 star categories across
the industry throughout the year reflecting strong investment performance
Revenues at Rs. 292.7 Cr., earnings before tax at Rs. 72.6 Cr. and
net profit at Rs. 48.4 Cr.
Birla Sun Life Asset Management (BSAMC)
Total Avg. AUM (Incl. PMS & Offshore)
(Rs. Crores)
Rising Share in industry’s
avg. equity AUM
3.9%4.1%
5.2%
Mar-08 Mar-09 Mar-10

10
Now a Pan India player, Idea Cellular ranks 3rd in terms of wireless revenues share
Ranks 2nd with ~ 20.8%1 revenues market share in 9 service areas where it holds 900MHz spectrum
Industry derives ~48% of its gross revenues from these 9 out of total 22 service areas
Growth momentum continued: Achieved its highest ever yearly net adds to reach 63.82 million subscribers
VAS (as % of revenues) grew y-o-y from 9.5% to ~12.4%, in Q4
Cash profit grew y-o-y by 31% to Rs. 3,063.6 Cr.
Net profit grew from Rs. 881.6 Cr. to Rs. 953.9 Cr. even after
absorbing competitive pressure on realised rate per minute and
launch of remaining seven service areas during the year
Strong balance sheet & cash profits to support future funding requirements
Net Debt to Equity stands at 0.6 and Net Debt to EBITDA stands at 1.8
Spice merged with Idea w.e.f. 1st March 2010 : Post merger ABNL’s stake in Idea reduced from 27.02% to
25.38% (Aditya Birla Group’s stake in Idea reduced from 49.13% to 46.08%)
6,72010,131
12,398
FY'08 FY'09 FY'10
Revenues (Rs Cr)
Telecom
Note : Wireless revenue share includes Spice & is based on gross revenues for UAS & Mobile license only, as released by TRAI1For Dec’09 quarter
11
IT-ITeS
Aditya Birla Minacs acquired Compass in Mar’10 to strengthen its capabilities in the fast growing F&A space
Having 10 years domain expertise, Compass has ranked among top 15 upcoming F&A players (Source : Gartner)
Top-line remained constrained in FY10 due to lower business from few existing clients suffering slowdown
Sales pipeline of ~USD 1 billion (TCV) will benefit going forward
Leveraging Aditya Birla Group (ABG) Eco-system
Scaled up capacities by adding ~2K seats & over 3K employees to reach ~10K seats & ~14.7K employees
Cost rationalisation yielding results : EBIT turned around at Rs. 42.4 Cr. vis-à-vis loss of Rs. 63.6 Cr.
Garments
Madura Garments turned EBITDA positive (before store closure costs) on a full year basis
Revenues grew by 12%. This was supported by 15% growth in sales from retail channel
Like to like growth in retail stores sales and rational retail expansion contributed
Revenues of contract exports biz. contracted due to weak order flow coupled with focus on profitable orders
Achieved improvement of more than Rs. 150 Cr. in EBITDA and savings of about Rs. 75 Cr. in working capital
requirements driven by cost optimisation and rightsizing measures

12
Manufacturing businesses
Collectively, posted highest ever EBITDA at Rs. 748 Cr. – Achieving 29% growth over last year
Consistently delivering strong operating margins and return on average capital employed
23.4%20.1%
27.1%
18.7%14.9%
20.1%
FY08 FY09 FY10
ROACE (%) OPM (%)
584 578
748
FY08 FY09 FY10
EBIDTA (Rs. Cr.)
Carbon black : Bottom-line improved supported by 13% y-o-y volume growth and higher energy sales
Greenfield expansion by 85K MT at Patalganga targeted by May’10. Total capacity will reach to 315K MTPA
Further planning to add capacity by 85K MTPA each at Patalganga in 2nd phase as well as in Southern India
Fertilisers : Attained higher per day productivity y-o-y. Profitability lower to the extent of higher subsidy arrears
and IPP gain booked last year.
Rayon : Achieved 26% growth in EBITDA driven by higher VFY realisation and lower input costs
Insulators : Expansion led volume growth partly set off pressure on realisation caused by increased competition
Textiles : Posted 28% growth in EBITDA led by robust demand for linen yarn and lower flax fibre (input) prices
13
Financial Performance

14
14315
1040
439
247
135
155 21
15505
FY08-09 FinancialServices
Telecom IT-ITeS Garments Mfg. Biz. Elim. FY09-10
Consolidated Net Sales1 Walk
Financial Services led the revenues walk followed by Telecom and Garments
1Excl. Income / (Loss) on Policyholders’ Funds
15
FinancialServices
37%
Telecom21%
IT-ITeS10%
Garments8%
Mfg.businesses
24%
(Life Insurance 34%)
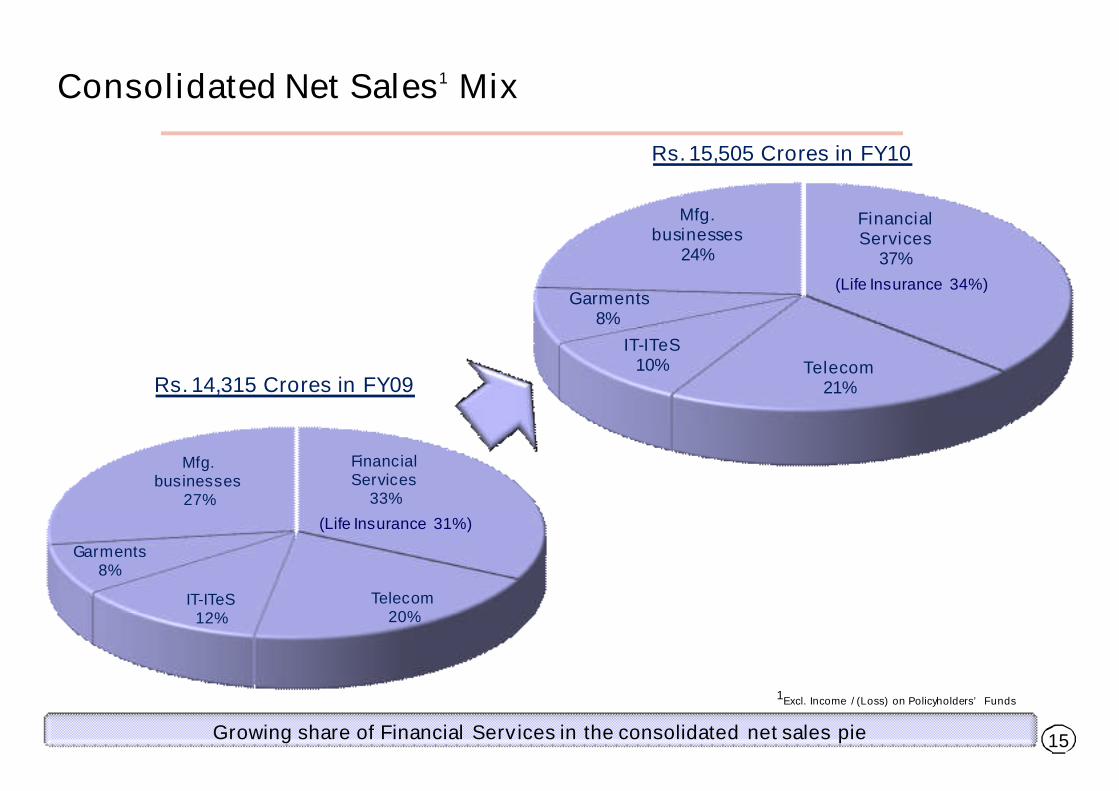
Consolidated Net Sales1 Mix
Rs. 15,505 Crores in FY10
FinancialServices
33%
Telecom20%
IT-ITeS12%
Garments8%
Mfg.businesses
27%
(Life Insurance 31%)
Rs. 14,315 Crores in FY09
Growing share of Financial Services in the consolidated net sales pie
1Excl. Income / (Loss) on Policyholders’ Funds

16
Consolidated Segmental EBIT Walk
Financial Services led the profit walk followed by Manufacturing biz., Garments and IT-ITeS
9
302
44
106
147
163 684
FY08-09 FinancialServices
Telecom IT-ITeS Garments Mfg. Biz. FY09-10

17
-436
81959
171 3384
155
FY08-09 EBITDA InterestExpenses
Depreciation Tax MinorityInterest
FY09-10
0
Consolidated Net Profit Walk
Improved earnings across the businesses led the turnaround at bottom-line

18
Annexure IFinancials
19
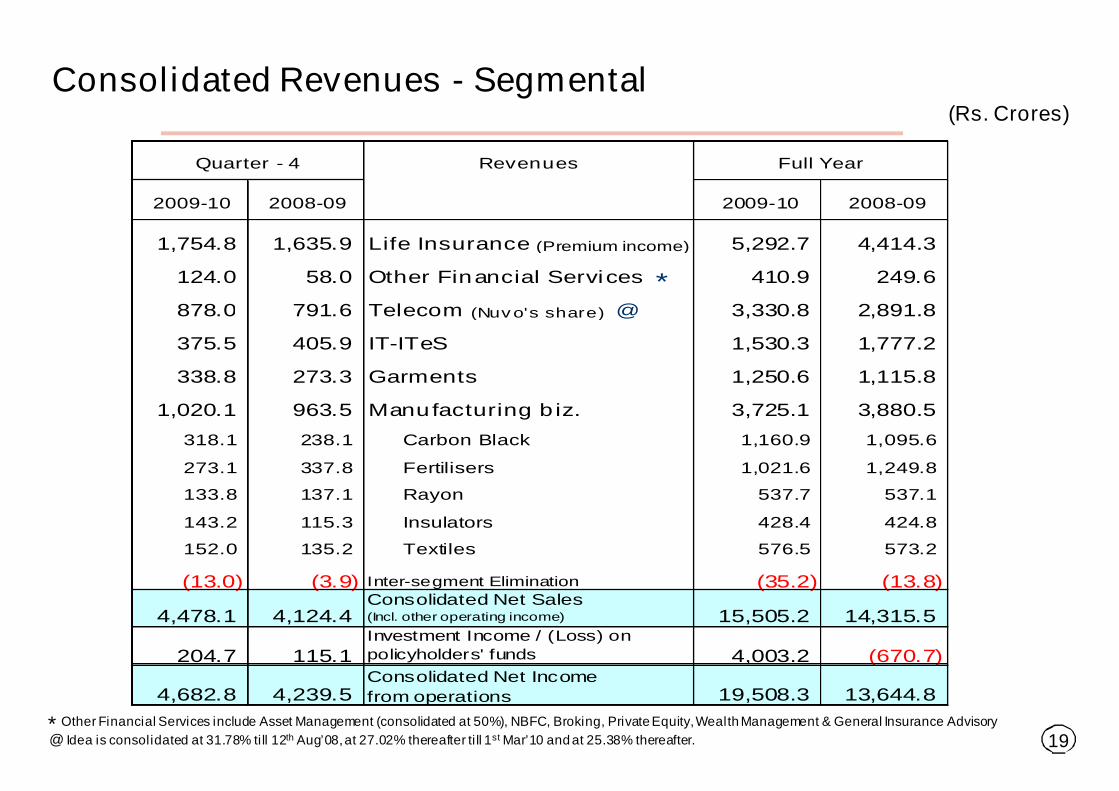
Consolidated Revenues - Segmental
@ Idea is consolidated at 31.78% till 12th Aug’08,at 27.02% thereafter ti ll 1st Mar’10 and at 25.38% thereafter.* Other Financial Services include Asset Management (consolidated at 50%), NBFC, Broking, Private Equity,Wealth Management & General Insurance Advisory
(Rs. Crores)
Revenues
2009-10 2008-09 2009-10 2008-09
1,754.8 1,635.9 Life Insurance (Premium income) 5,292.7 4,414.3
124.0 58.0 Other Financial Services * 410.9 249.6
878.0 791.6 Telecom (Nuvo's share) @ 3,330.8 2,891.8
375.5 405.9 IT-ITeS 1,530.3 1,777.2
338.8 273.3 Garments 1,250.6 1,115.8
1,020.1 963.5 Manufacturing biz. 3,725.1 3,880.5
318.1 238.1 Carbon Black 1,160.9 1,095.6
273.1 337.8 Fertilisers 1,021.6 1,249.8
133.8 137.1 Rayon 537.7 537.1
143.2 115.3 Insulators 428.4 424.8
152.0 135.2 Textiles 576.5 573.2
(13.0) (3.9) Inter-segment Elimination (35.2) (13.8)
4,478.1 4,124.4Consolidated Net Sales(Incl. other operating income) 15,505.2 14,315.5
204.7 115.1Investment Income / (Loss) on
policyholders' funds 4,003.2 (670.7)
4,682.8 4,239.5Consolidated Net Income
from operations 19,508.3 13,644.8
Full YearQuarter - 4
20
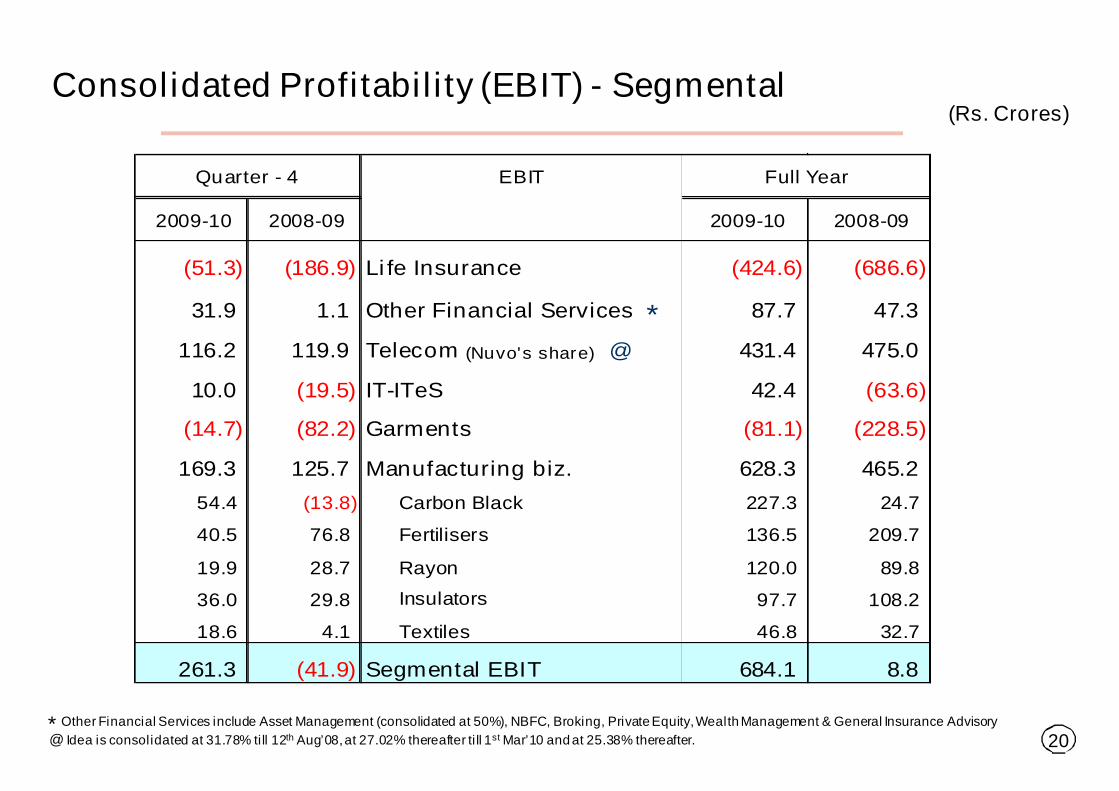
Consolidated Profitability (EBIT) - Segmental(Rs. Crores)
@ Idea is consolidated at 31.78% till 12th Aug’08,at 27.02% thereafter ti ll 1st Mar’10 and at 25.38% thereafter.* Other Financial Services include Asset Management (consolidated at 50%), NBFC, Broking, Private Equity,Wealth Management & General Insurance Advisory
EBIT
2009-10 2008-09 2009-10 2008-09
(51.3) (186.9) Life Insurance (424.6) (686.6)
31.9 1.1 Other Financial Services * 87.7 47.3
116.2 119.9 Telecom (Nuvo's share) @ 431.4 475.0
10.0 (19.5) IT-ITeS 42.4 (63.6)
(14.7) (82.2) Garments (81.1) (228.5)
169.3 125.7 Manufacturing biz. 628.3 465.2
54.4 (13.8) Carbon Black 227.3 24.7
40.5 76.8 Fertilisers 136.5 209.7
19.9 28.7 Rayon 120.0 89.8
36.0 29.8 Insulators 97.7 108.2
18.6 4.1 Textiles 46.8 32.7
261.3 (41.9) Segmental EBIT 684.1 8.8
Quarter - 4 Full Year

21
Consolidated Financials(Rs. Crores)
Particulars
2009-10 2008-09 2009-10 2008-09
4,478.1 4,124.4 Net Sales (Incl. Other operating income) 15,505.2 14,315.5
204.7 115.1 Investment income / (loss) on policyholders' funds 4,003.2 (670.7)
4,682.8 4,239.5 Net income from operations 19,508.3 13,644.8
516.4 200.9 EBITDA 1,686.2 867.4
150.6 198.5 Interest Expenses 662.1 721.0
365.8 2.4 EBDT 1,024.1 146.4
230.8 197.7 Depreciation 866.5 695.6
135.0 (195.3) Earnings before Tax 157.6 (549.3)
(31.4) 4.4 Provision for Taxation (Net) 114.0 81.1
(13.8) (53.4) Minority Interest (111.0) (194.6)
180.2 (146.4) Net Profit after minority interest 154.6 (435.7)
Quarter - 4 Full Year

22
Consolidated Profit and Loss and Balance Sheet Snapshot
Note : Equity Share Capital increased from Rs. 95 Cr. to Rs. 103 Cr. in Oct’09 on conv ersion of 8 million warrants
(Rs. Crores)
Particulars
2009-10 2008-09 2009-10 2008-09
Net Sales 4,478.1 4,124.4 15,505.2 14,315.5
Net income from operations 4,682.8 4,239.5 19,508.3 13,644.8
EBITDA 516.4 200.9 1,686.2 867.4
EBITDA Margin (%) 11.0 4.7 8.6 6.4
Interest 150.6 198.5 662.1 721.0
EBDT 365.8 2.4 1,024.1 146.4
Net Profit(after Minority Interest) 180.2 (146.4) 154.6 (435.7)
Annualised EPS (Rs.) 68.96 (62.60) 15.4 (46.3)
Quarter - 4 Full YearParticulars
Net Worth 5,474.8 5,742.3
Minority Interest 185.8 179.2
Total Debts 6,706.6 8,109.1
Deferred Tax Liabilities (Net) 240.6 219.8
Capital Employed 12,607.8 14,250.3
Policyholders' funds(Incl. funds for future appropriation) 15,651.9 8,725.8
Total Liabilities 28,259.6 22,976.2
Net Block (Incl. Goodwill) 9,880.7 10,094.6
Net Working Capital 568.2 227.4
Long Term Investments 218.9 218.9
Life Insurance Investments 16,129.9 9,168.4
Cash & Cash Equivalents 1,462.0 3,267.0
Book Value (Rs.) 531.5 604.3
Net Debt / EBITDA (x) 3.1 5.6
Net Debt / Equity (x) 1:1 0.8:1
March-10 March 2009
23
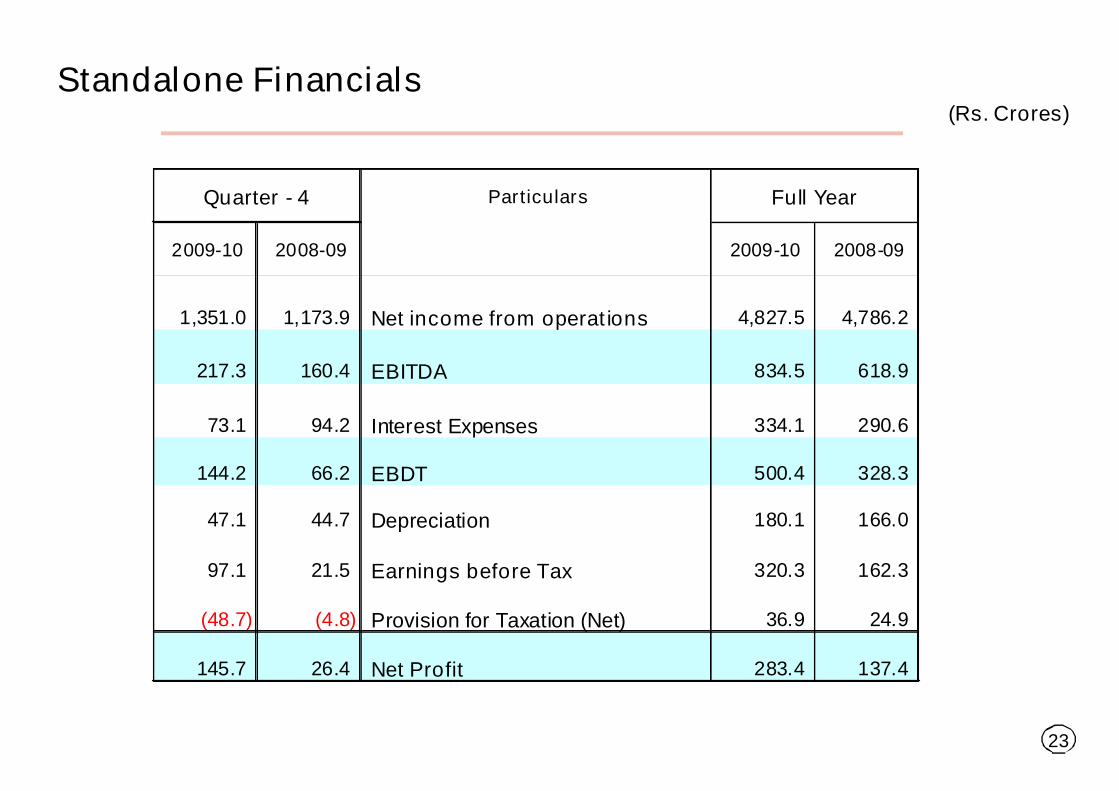
Standalone Financials(Rs. Crores)
Particulars
2009-10 2008-09 2009-10 2008-09
1,351.0 1,173.9 Net income from operations 4,827.5 4,786.2
217.3 160.4 EBITDA 834.5 618.9
73.1 94.2 Interest Expenses 334.1 290.6
144.2 66.2 EBDT 500.4 328.3
47.1 44.7 Depreciation 180.1 166.0
97.1 21.5 Earnings before Tax 320.3 162.3
(48.7) (4.8) Provision for Taxation (Net) 36.9 24.9
145.7 26.4 Net Profit 283.4 137.4
Full YearQuarter - 4

24
Standalone Profit and Loss and Balance Sheet Snapshot
Note 1 : Equity Share Capital increased from Rs. 95 Cr. to Rs. 103 Cr. in Oct’09 on conv ersion of 8 million warrants
(Rs. Crores)
Particulars
2009-10 2008-09 2009-10 2008-09
Net income from operations 1,351.0 1,173.9 4,827.5 4,786.2
EBITDA 217.3 160.4 834.5 618.9
EBITDA Margin (%) 16.1 13.7 17.3 12.9
Interest 73.1 94.2 334.1 290.6
EBDT 144.2 66.2 500.4 328.3
Net Profit 145.7 26.4 283.4 137.4
Annualised Basic EPS (Rs.) 56.6 11.1 28.8 14.5
Quarter - 4 Full Year
Note 2 : Capex plan for FY2010-11 is Rs. 300 Cr. including Rs. 150 Cr. towards maintenance capexNote 3 : Life Insurance biz. will require funding of Rs. 200 Crores from Nuv o in FY’10-11 to fund its growth plans.
March March
2010 2009
Net Worth 4,661.5 4,121.7
Total Debts 3,635.6 4,499.2
Deferred Tax Liabilities 178.5 180.2
Capital Employed 8,475.6 8,801.1
Net Block 1,815.3 1,605.0
Net Working Capital 1,044.8 1,356.5
Long Term Investments 5,435.9 4,982.4
Cash & Cash Equivalents 179.7 857.3
Book Value (Rs.) 452.1 433.8
Net Debt / EBITDA (x) 4.1 5.9
Net Debt / Equity (x) 0.7:1 0.9:1
Market Capitalisation - NSE 9,336 4,227
Particulars

25
Annexure IIBusiness-wise Financials
26
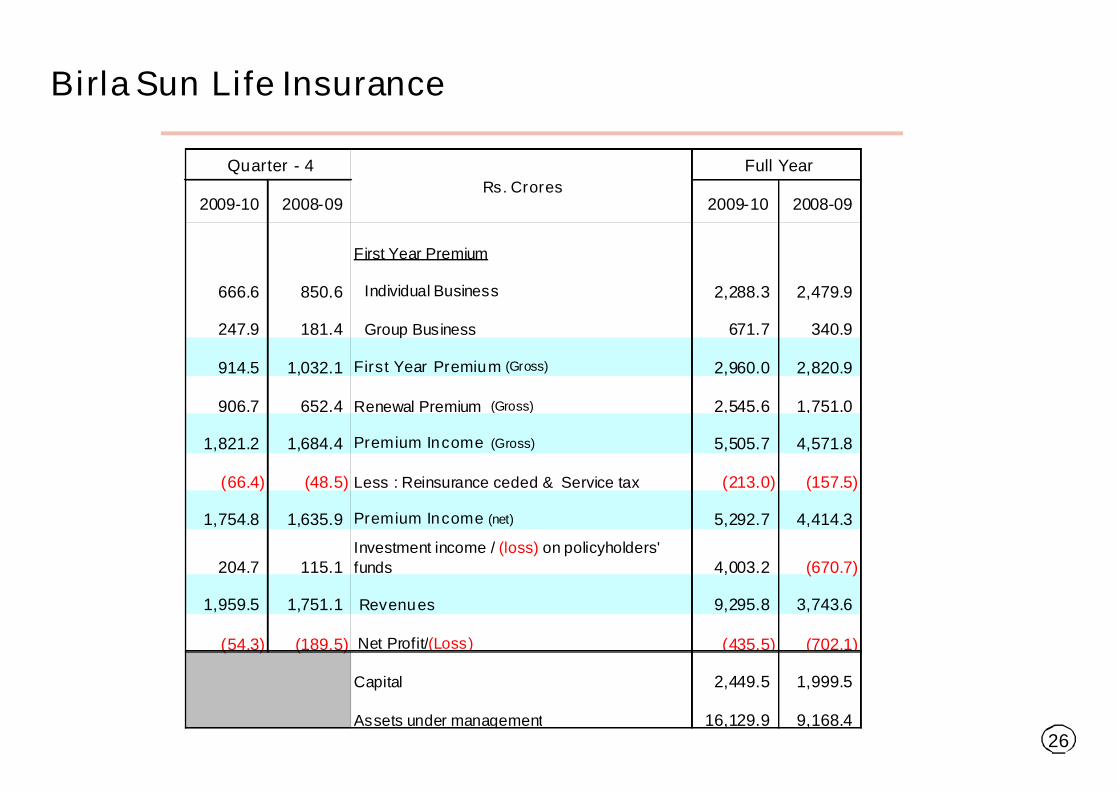
Birla Sun Life Insurance
2009-10 2008-09 2009-10 2008-09
First Year Premium
666.6 850.6 Individual Business 2,288.3 2,479.9
247.9 181.4 Group Business 671.7 340.9
914.5 1,032.1 First Year Premium (Gross) 2,960.0 2,820.9
906.7 652.4 Renewal Premium (Gross) 2,545.6 1,751.0
1,821.2 1,684.4 Premium Income (Gross) 5,505.7 4,571.8
(66.4) (48.5) Less : Reinsurance ceded & Service tax (213.0) (157.5)
1,754.8 1,635.9 Premium Income (net) 5,292.7 4,414.3
204.7 115.1Investment income / (loss) on policyholders'
funds 4,003.2 (670.7)
1,959.5 1,751.1 Revenues 9,295.8 3,743.6
(54.3) (189.5) Net Profit/(Loss) (435.5) (702.1)
Capital 2,449.5 1,999.5
Assets under management 16,129.9 9,168.4
Full Year
Rs. Crores
Quarter - 4
27
Birla Sun Life Asset Management
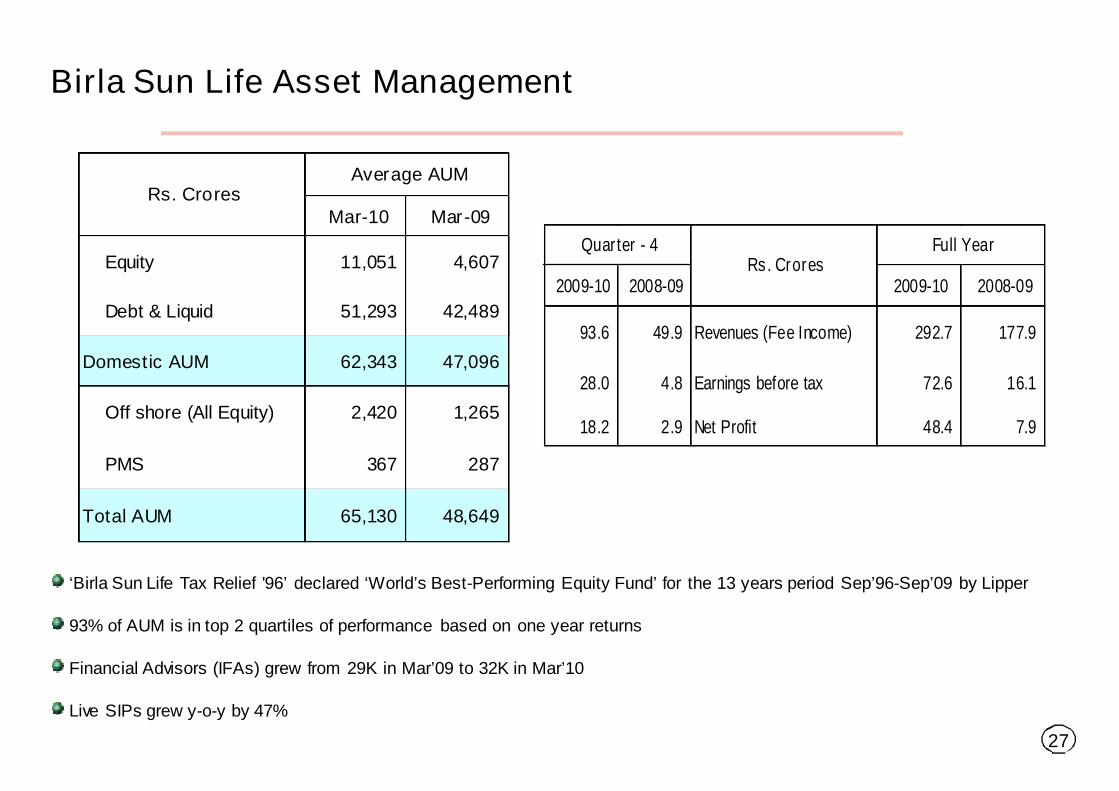
‘Birla Sun Life Tax Relief '96’ declared ‘World’s Best-Performing Equity Fund’ for the 13 years period Sep’96-Sep’09 by Lipper
93% of AUM is in top 2 quartiles of performance based on one year returns
Financial Advisors (IFAs) grew from 29K in Mar’09 to 32K in Mar’10
Live SIPs grew y-o-y by 47%
2009-10 2008-09 2009-10 2008-09
93.6 49.9 Revenues (Fee Income) 292.7 177.9
28.0 4.8 Earnings before tax 72.6 16.1
18.2 2.9 Net Profit 48.4 7.9
Quarter - 4Rs. Crores
Full Year
Mar-10 Mar-09
Equity 11,051 4,607
Debt & Liquid 51,293 42,489
Domestic AUM 62,343 47,096
Off shore (All Equity) 2,420 1,265
PMS 367 287
Total AUM 65,130 48,649
Average AUMRs. Crores

28
Aditya Birla Finance (NBFC)
In Q4, net profit doubled y-o-y : Loan against Securities portfolio doubled y-o-y
Portfolio is being scaled up after cautious reduction in exposure in later half of previous year to manage market downturn.
IPO financing grew significantly to ~ Rs. 1500 Cr. in FY10
Extended offerings to LC discounting, ESOP funding, retail LAS and margin funding biz.
Other Financial Services
2009-10 2008-09 2009-10 2008-09
19.4 20.3 Revenues 72.8 120.3
13.5 4.7 Earnings before tax 45.7 43.7
8.9 4.3 Net Profit 30.0 29.6
5.5 3.3 Revenues 20.6 16.5
1.2 (0.1) Earnings before tax 5.3 6.6
1.0 0.2 Net Profit 3.7 4.8
Aditya Birla Finance Ltd.
Birla Insurance Advisory & Broking Services Ltd.
Full YearRs. Crores
Quarter - 4
29
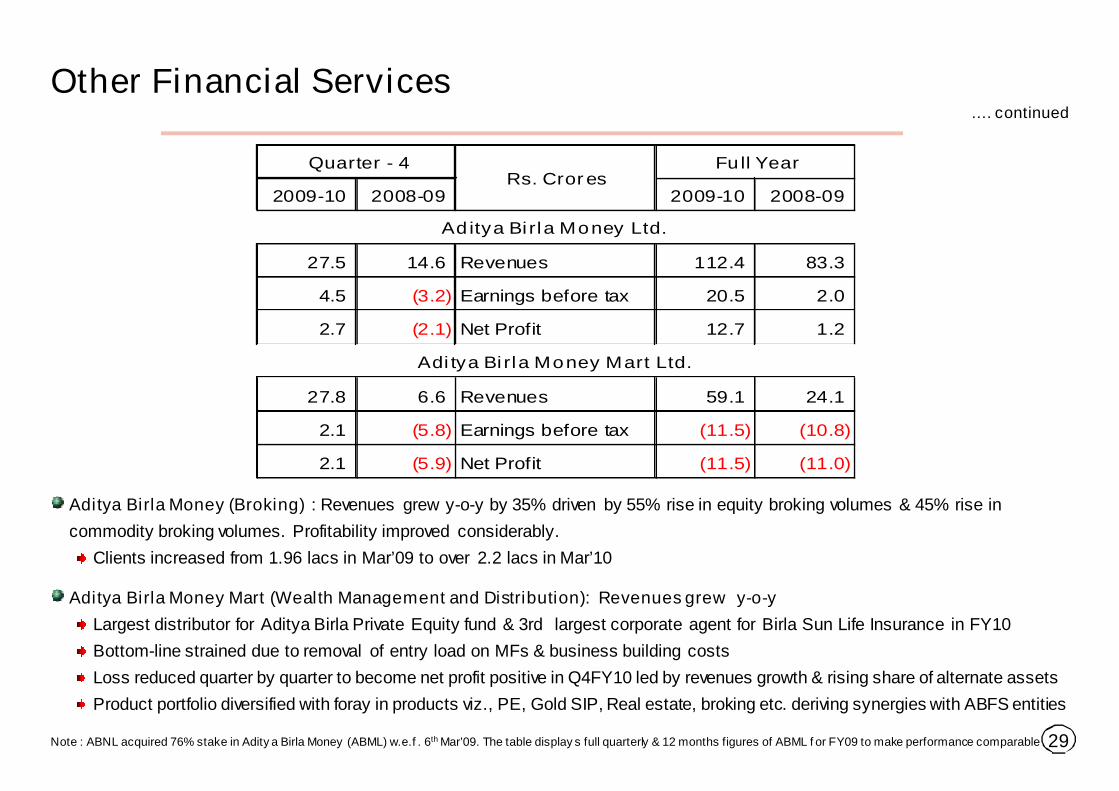
Aditya Birla Money (Broking) : Revenues grew y-o-y by 35% driven by 55% rise in equity broking volumes & 45% rise in
commodity broking volumes. Profitability improved considerably.
Clients increased from 1.96 lacs in Mar’09 to over 2.2 lacs in Mar’10
Aditya Birla Money Mart (Wealth Management and Distribution): Revenuesgrew y-o-y
Largest distributor for Aditya Birla Private Equity fund & 3rd largest corporate agent for Birla Sun Life Insurance in FY10
Bottom-line strained due to removal of entry load on MFs & business building costs
Loss reduced quarter by quarter to become net profit positive in Q4FY10 led by revenues growth & rising share of alternate assets
Product portfolio diversified with foray in products viz., PE, Gold SIP, Real estate, broking etc. deriving synergies with ABFS entities
Other Financial Services
Note : ABNL acquired 76% stake in Adity a Birla Money (ABML) w.e.f . 6th Mar’09. The table display s full quarterly & 12 months figures of ABML f or FY09 to make performance comparable
2009-10 2008-09 2009-10 2008-09
27.5 14.6 Revenues 112.4 83.3
4.5 (3.2) Earnings before tax 20.5 2.0
2.7 (2.1) Net Profit 12.7 1.2
27.8 6.6 Revenues 59.1 24.1
2.1 (5.8) Earnings before tax (11.5) (10.8)
2.1 (5.9) Net Profit (11.5) (11.0)
Quarter - 4Rs. Crores
Full Year
Aditya Birla Money Ltd.
Aditya Birla Money Mart Ltd.
…. continued

30
2009-10 2008-09 2009-10 2008-09
Subscribers (Nos. in Million) 63.82 43.02
3,319.0 2,930.1 Revenues 12,397.9 10,131.3
1,005.8 874.9 EBITDA 3,621.0 3,050.5
439.1 443.9 EBIT 1,606.0 1,647.7
266.6 255.0 Net Profit 953.9 881.6
Net Worth (A) 11,372.4 13,265.3
Total Debt (B) 7,859.3 8,912.2
Capital Employed (A + B) 19,231.7 22,177.5
8.7 7.6 ROACE (Annualised) (%) 7.8 10.2
Full YearQuarter - 4Rs. Crores
Idea Cellular
* Spice resultsconsolidated at 41.09% asJV since 16th Oct’08 and as100% subsidiary since 1st Mar’10. Indusconsolidated at 16% asJV
31
Aditya Birla Minacs
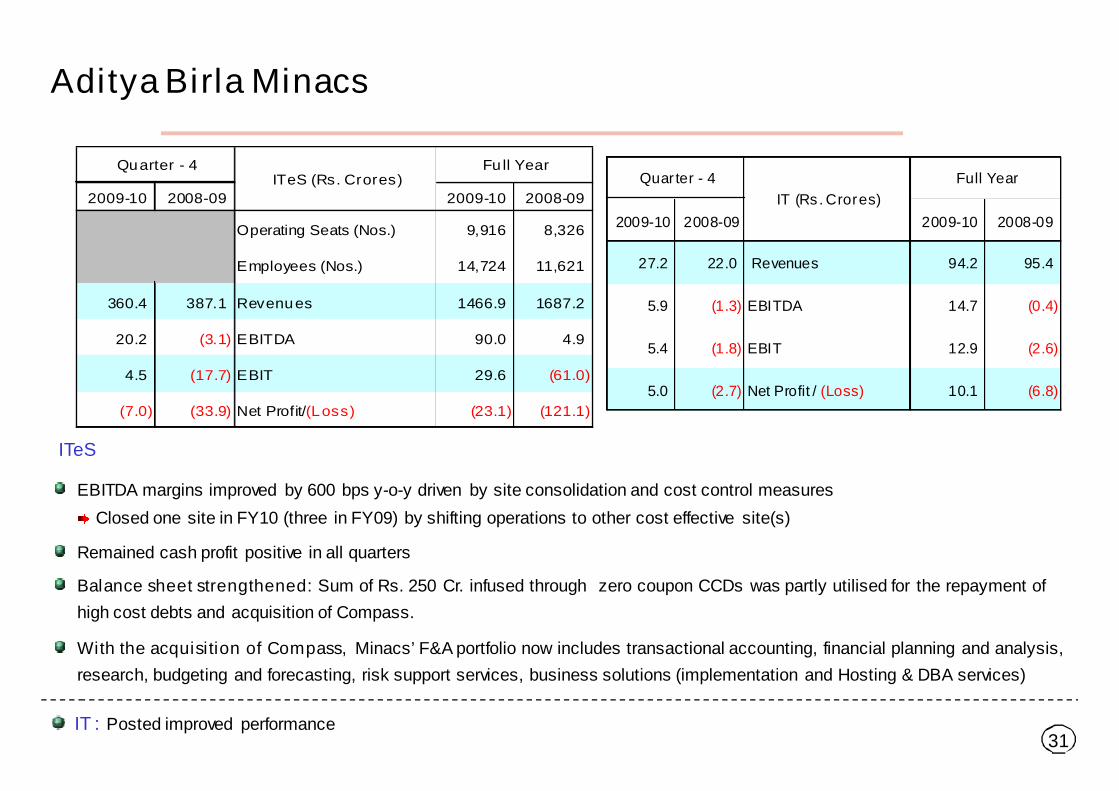
EBITDA margins improved by 600 bps y-o-y driven by site consolidation and cost control measures
Closed one site in FY10 (three in FY09) by shifting operations to other cost effective site(s)
Remained cash profit positive in all quarters
Balance sheet strengthened: Sum of Rs. 250 Cr. infused through zero coupon CCDs was partly utilised for the repayment of
high cost debts and acquisition of Compass.
With the acquisition of Compass, Minacs’ F&A portfolio now includes transactional accounting, financial planning and analysis,
research, budgeting and forecasting, risk support services, business solutions (implementation and Hosting & DBA services)
IT : Posted improved performance
ITeS
2009-10 2008-09 2009-10 2008-09
Operating Seats (Nos.) 9,916 8,326
Employees (Nos.) 14,724 11,621
360.4 387.1 Revenues 1466.9 1687.2
20.2 (3.1) EBITDA 90.0 4.9
4.5 (17.7) EBIT 29.6 (61.0)
(7.0) (33.9) Net Profit/(Loss) (23.1) (121.1)
Full YearITeS (Rs. Crores)
Quarter - 4
2009-10 2008-09 2009-10 2008-09
27.2 22.0 Revenues 94.2 95.4
5.9 (1.3) EBITDA 14.7 (0.4)
5.4 (1.8) EBIT 12.9 (2.6)
5.0 (2.7) Net Profit / (Loss) 10.1 (6.8)
IT (Rs. Crores)
Full YearQuarter - 4

32
Madura Garments
* Before store closure costs of Rs. 10.9 Cr. in FY10 (Rs. 4.3 Cr. in FY09) and Rs. 3.6 Cr. in Q4FY10 (Rs. 4.3 Cr. in Q4FY09)
2009-10 2008-09 2009-10 2008-09
338.8 273.3 Revenues 1,250.6 1,115.8
6.6 (54.7) EBITDA* 7.1 (154.1)
(14.7) (82.2) EBIT (81.1) (228.5)
549.3 678.8 Capital Employed 549.3 678.8
Quarter - 4Rs. Crores
Full Year
33
Hi-Tech Carbon
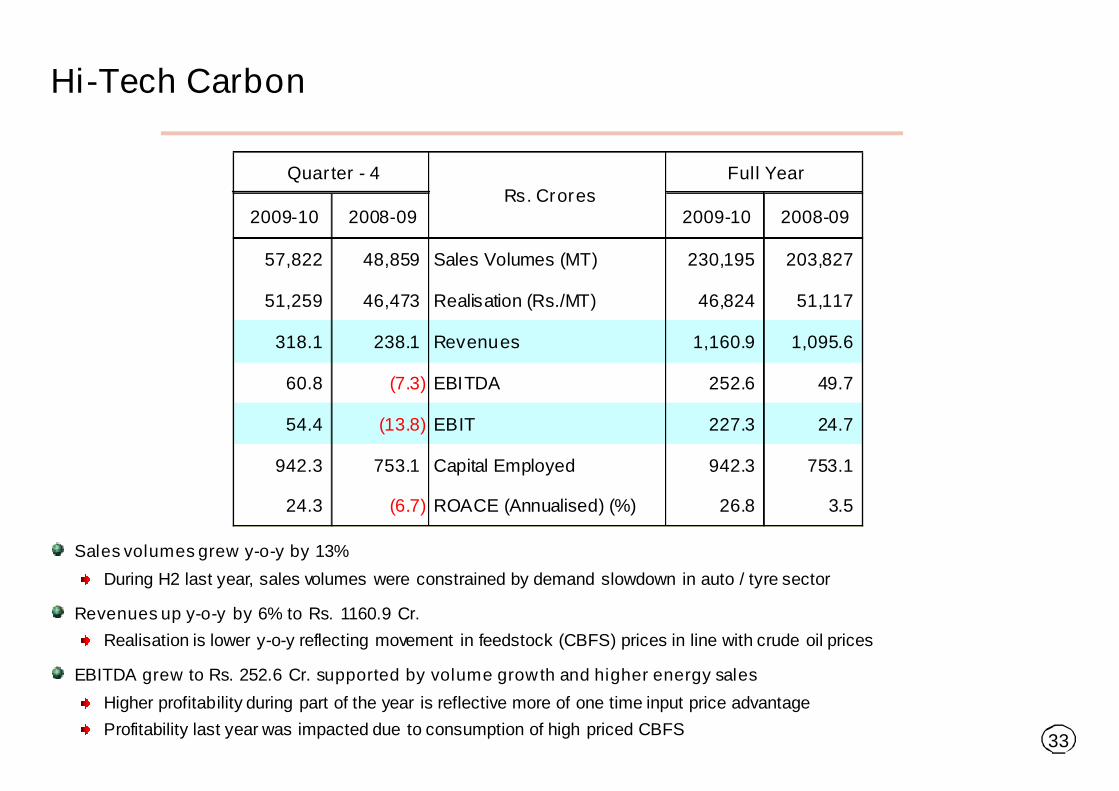
Salesvolumesgrew y-o-y by 13%
During H2 last year, sales volumes were constrained by demand slowdown in auto / tyre sector
Revenuesup y-o-y by 6% to Rs. 1160.9 Cr.
Realisation is lower y-o-y reflecting movement in feedstock (CBFS) prices in line with crude oil prices
EBITDA grew to Rs. 252.6 Cr. supported by volume growth and higher energy sales
Higher profitability during part of the year is reflective more of one time input price advantage
Profitability last year was impacted due to consumption of high priced CBFS
2009-10 2008-09 2009-10 2008-09
57,822 48,859 Sales Volumes (MT) 230,195 203,827
51,259 46,473 Realisation (Rs./MT) 46,824 51,117
318.1 238.1 Revenues 1,160.9 1,095.6
60.8 (7.3) EBITDA 252.6 49.7
54.4 (13.8) EBIT 227.3 24.7
942.3 753.1 Capital Employed 942.3 753.1
24.3 (6.7) ROACE (Annualised) (%) 26.8 3.5
Quarter - 4Rs. Crores
Full Year
34
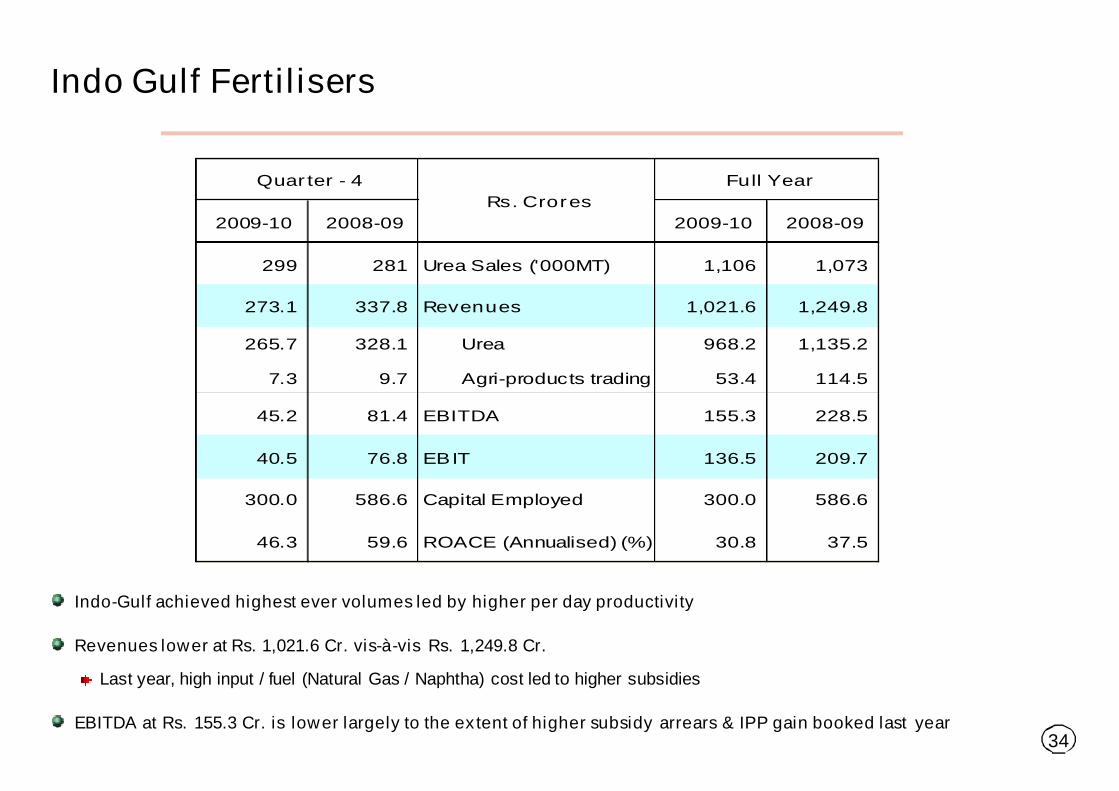
Indo-Gulf achieved highest ever volumes led by higher per day productivity
Revenues lower at Rs. 1,021.6 Cr. vis-à-vis Rs. 1,249.8 Cr.
Last year, high input / fuel (Natural Gas / Naphtha) cost led to higher subsidies
EBITDA at Rs. 155.3 Cr. is lower largely to the extent of higher subsidy arrears & IPP gain booked last year
Indo Gulf Fertilisers
2009-10 2008-09 2009-10 2008-09
299 281 Urea Sales ('000MT) 1,106 1,073
273.1 337.8 Revenues 1,021.6 1,249.8
265.7 328.1 Urea 968.2 1,135.2
7.3 9.7 Agri-products trading 53.4 114.5
45.2 81.4 EBITDA 155.3 228.5
40.5 76.8 EBIT 136.5 209.7
300.0 586.6 Capital Employed 300.0 586.6
46.3 59.6 ROACE (Annualised) (%) 30.8 37.5
Full Year
Rs. Crores
Quarter - 4
35
Indian Rayon
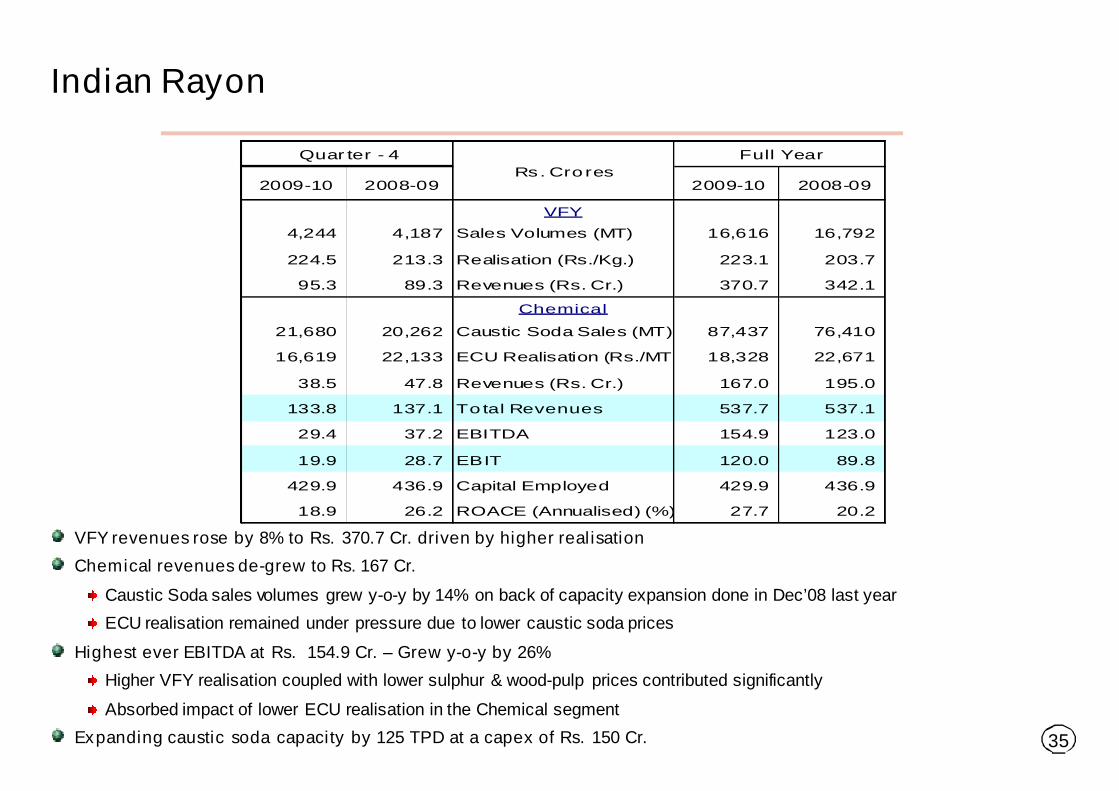
VFY revenuesrose by 8% to Rs. 370.7 Cr. driven by higher realisation
Chemical revenuesde-grew to Rs. 167 Cr.
Caustic Soda sales volumes grew y-o-y by 14% on back of capacity expansion done in Dec’08 last year
ECU realisation remained under pressure due to lower caustic soda prices
Highest ever EBITDA at Rs. 154.9 Cr. – Grew y-o-y by 26%
Higher VFY realisation coupled with lower sulphur & wood-pulp prices contributed significantly
Absorbed impact of lower ECU realisation in the Chemical segment
Expanding caustic soda capacity by 125 TPD at a capex of Rs. 150 Cr.
2009-10 2008-09 2009-10 2008-09
VFY
4,244 4,187 Sales Volumes (MT) 16,616 16,792
224.5 213.3 Realisation (Rs./Kg.) 223.1 203.7
95.3 89.3 Revenues (Rs. Cr.) 370.7 342.1
Chemical
21,680 20,262 Caustic Soda Sales (MT) 87,437 76,410
16,619 22,133 ECU Realisation (Rs./MT.) 18,328 22,671
38.5 47.8 Revenues (Rs. Cr.) 167.0 195.0
133.8 137.1 Total Revenues 537.7 537.1
29.4 37.2 EBITDA 154.9 123.0
19.9 28.7 EBIT 120.0 89.8
429.9 436.9 Capital Employed 429.9 436.9
18.9 26.2 ROACE (Annualised) (%) 27.7 20.2
Full Year
Rs. Crores
Quarter - 4
36
Aditya Birla Insulators
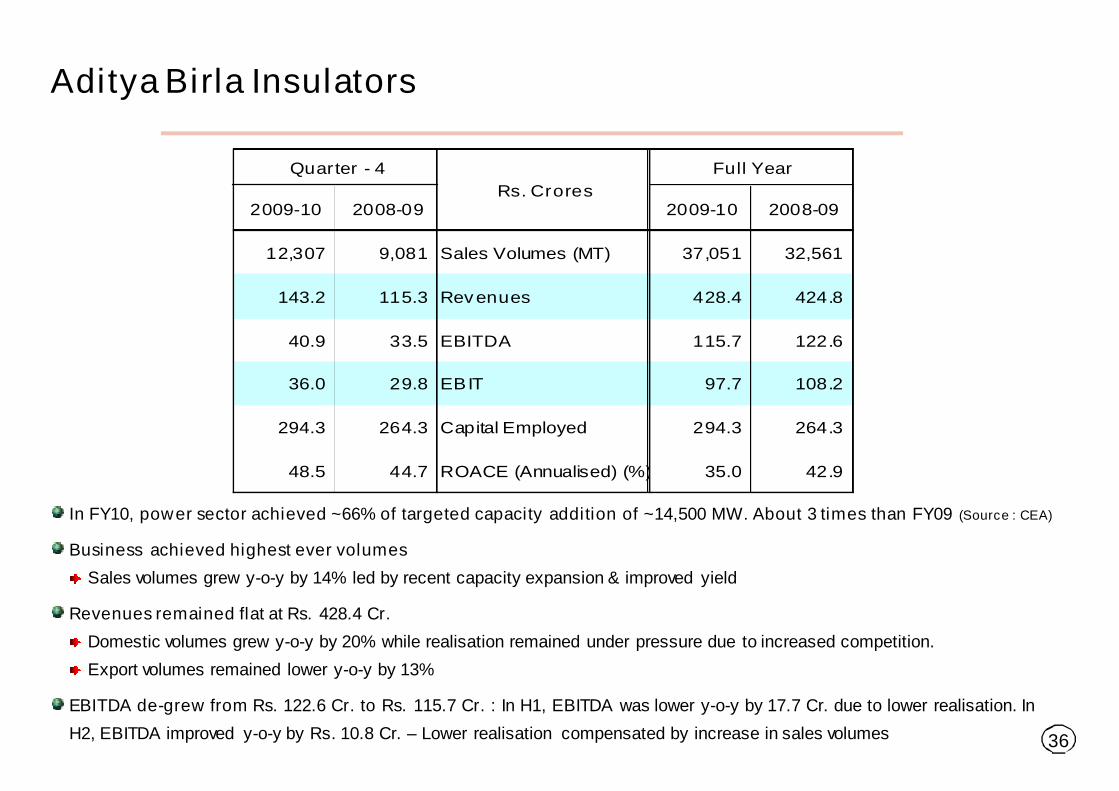
In FY10, power sector achieved ~66% of targeted capacity addition of ~14,500 MW. About 3 times than FY09 (Source : CEA)
Business achieved highest ever volumes
Sales volumes grew y-o-y by 14% led by recent capacity expansion & improved yield
Revenuesremained flat at Rs. 428.4 Cr.
Domestic volumes grew y-o-y by 20% while realisation remained under pressure due to increased competition.
Export volumes remained lower y-o-y by 13%
EBITDA de-grew from Rs. 122.6 Cr. to Rs. 115.7 Cr. : In H1, EBITDA was lower y-o-y by 17.7 Cr. due to lower realisation. In
H2, EBITDA improved y-o-y by Rs. 10.8 Cr. – Lower realisation compensated by increase in sales volumes
2009-10 2008-09 2009-10 2008-09
12,307 9,081 Sales Volumes (MT) 37,051 32,561
143.2 115.3 Revenues 428.4 424.8
40.9 33.5 EBITDA 115.7 122.6
36.0 29.8 EBIT 97.7 108.2
294.3 264.3 Capital Employed 294.3 264.3
48.5 44.7 ROACE (Annualised) (%) 35.0 42.9
Quarter - 4 Full Year
Rs. Crores
37
Jaya Shree Textiles
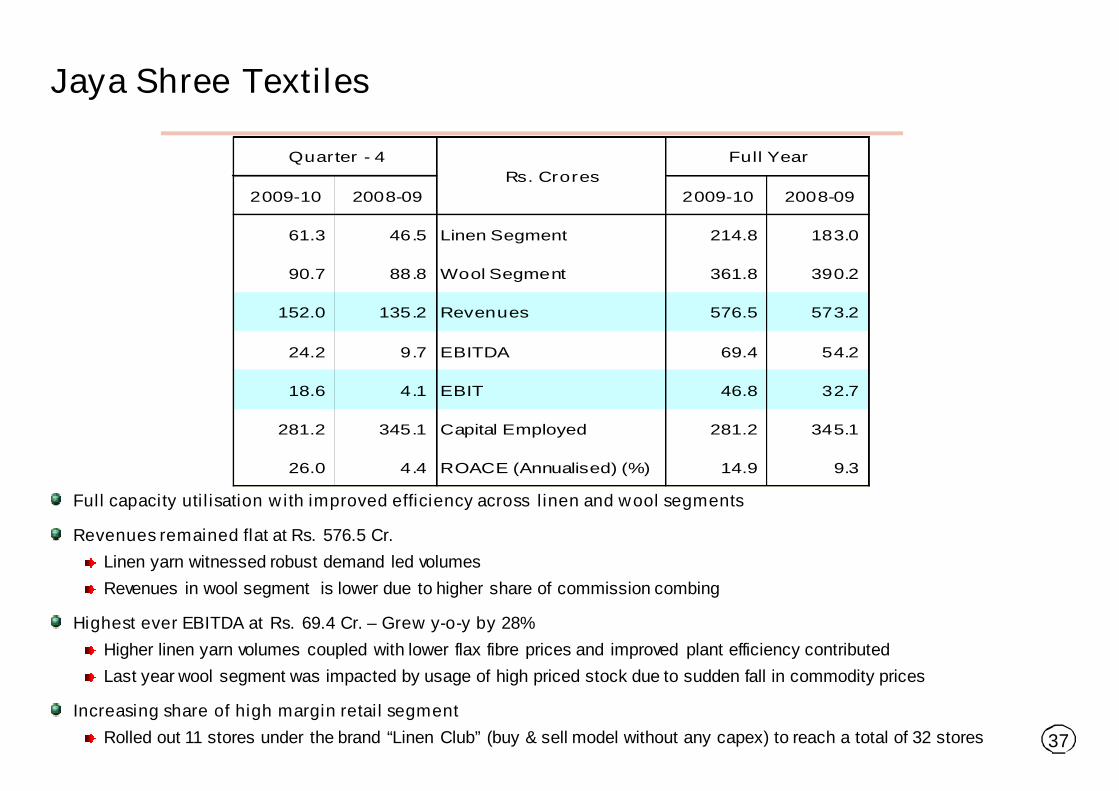
Full capacity utilisation with improved efficiency across linen and wool segments
Revenuesremained flat at Rs. 576.5 Cr.
Linen yarn witnessed robust demand led volumes
Revenues in wool segment is lower due to higher share of commission combing
Highest ever EBITDA at Rs. 69.4 Cr. – Grew y-o-y by 28%
Higher linen yarn volumes coupled with lower flax fibre prices and improved plant efficiency contributed
Last year wool segment was impacted by usage of high priced stock due to sudden fall in commodity prices
Increasing share of high margin retail segment
Rolled out 11 stores under the brand “Linen Club” (buy & sell model without any capex) to reach a total of 32 stores
2009-10 2008-09 2009-10 2008-09
61.3 46.5 Linen Segment 214.8 183.0
90.7 88.8 Wool Segment 361.8 390.2
152.0 135.2 Revenues 576.5 573.2
24.2 9.7 EBITDA 69.4 54.2
18.6 4.1 EBIT 46.8 32.7
281.2 345.1 Capital Employed 281.2 345.1
26.0 4.4 ROACE (Annualised) (%) 14.9 9.3
Rs. Crores
Full YearQuarter - 4

38
StandaloneSubsidiaries & Joint Ventures
Textiles1Carbon
Black1Rayon1Fertilisers1
IT-ITeS2Telecom3#(25.38%)
Asset Management3
(50%) *
Life Insurance3
(74%)*
NBFC2
Broking2
Wealth management2
Private Equity2
General Insurance Advisory2
Represent JointVentures
RepresentSubsidiaries
Insulators1
Aditya Birla Nuvo : Reporting Structure
*JV with Sun Life Financial,Canada
Note : Percentage figuresindicated above represent
ABNL’s shareholding in itssubsidiaries/JV’s
RepresentDivisions
#Aditya Birla Group holds 46.08%
1
2
3
Garments1
Consolidated
FinancialServices

39
Disclaimer
Certain statements made in this presentation may not be based on historical information or facts and may be “forward looking statements”
including, but not limited to, those relating to general business plans & strategy of Aditya Birla Nuvo Limited ("ABNL"), its future outlook &
growth prospects, future developments in its businesses, its competitive & regulatory environment and management's current views &
assumptions which may not remain constant due to risks and uncertainties. Actual results may differ materially from these forward-looking
statements due to a number of factors, including future changes or developments in ABNL's business, its competitive environment, its ability
to implement its strategies and initiatives and respond to technological changes and political, economic, regulatory and social conditions in the
countries in which ABNL conducts business.
This presentation does not constitute a prospectus, offering circular or offering memorandum or an offer to acquire any shares and should not
be considered as a recommendation that any investor should subscribe for or purchase any of ABNL's shares. Neither this presentation nor
any other documentation or information (or any part thereof) delivered or supplied under or in relation to the shares shall be deemed to
constitute an offer of or an invitation by or on behalf of ABNL.
ABNL, as such, makes no representation or warranty, express or implied, as to, and does not accept any responsibility or liability with respect
to, the fairness, accuracy, completeness or correctness of any information or opinions contained herein. The information contained in this
presentation, unless otherwise specified is only current as of the date of this presentation. ABNL assumes no responsibility to publicly amend,
modify or revise any forward looking statements on the basis of any subsequent developments, information or events or otherwise. Unless
otherwise stated in this document, the information contained herein is based on management information and estimates. The information
contained herein is subject to change without notice and past performance is not indicative of future results. ABNL may alter, modify or
otherwise change in any manner the content of this presentation, without obligation to notify any person of such revision or changes. This
presentation maynotbe copied and disseminated in anymanner.
INFORMATION PRESENTED HERE IS NOT AN OFFER FOR SALE OF ANY EQUITY SHARES OR ANY OTHER SECURITY OF ABNL
This presentation is not for publication or distribution, directly or indirectly, in or into the United States, Canada or Japan. These
materials are not an offer of securities for sale in or into the United States,Canada or Japan.
Aditya Birla Nuvo Limited
Regd. Office: Indian Rayon Compound, Veraval – 362 266 (Gujarat)
Corporate Office: 4th Floor ‘A’ Wing, Aditya Birla Center, S.K. Ahire Marg, Worli, Mumbai – 400 030
Website: www.adityabirlanuvo.com or www.adityabirla.com or Email: [email protected]