Life Cycle Assessment of the Orca System Model - Pro...
21
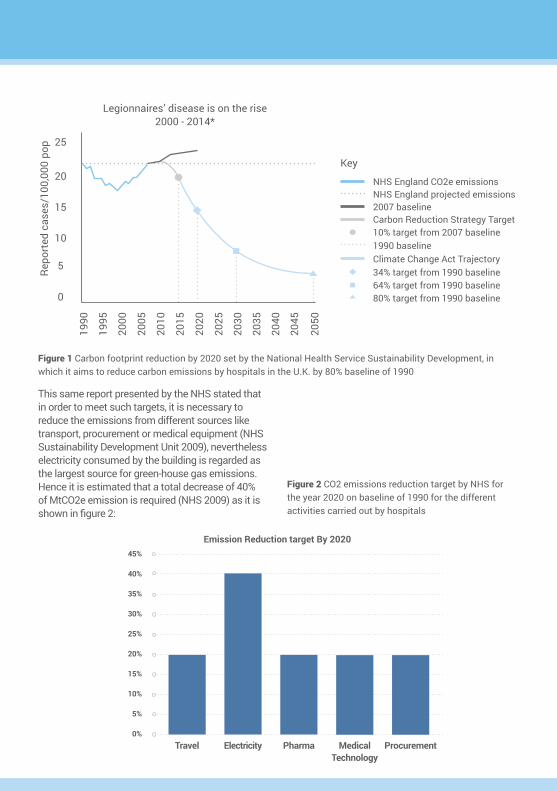
Life Cycle Assessment of the Orca System Model ProEconomy is a company that focuses on Legionella control and which has been particularly successful for over twenty years. ProEconomy was established in 1993, its huge contribution in water treatment projects promoted the rapid development of the company to gain a good reputation with the National Health Service UK (NHS) as well as other relevant health sectors in Europe. The Orca water treatment system is one of the most significant achievements of ProEconomy because of its high efficiency in controlling Legionella. It consists on releasing copper and silver ions into the water system that will attack the harmful pathogen removing it from the circuit. It has been successfully installed within a number of water systems across the UK for the removal of Legionella. In 2001, the Orca system was installed in the HSBC headquarters in London (ProEconomy, 2016). This project was very successful and eventually led to the opportunity for ProEconomy to secure the European Space Agency (ESA) in 2002. Following this, ProEconomy has witnessed a significant increase in number of clients. Currently, the Orca system is used in over 200 sites throughout Europe. 1. Introduction It is well understood that the spread of the bacteria responsible for Legionella disease (L pneumophilia) is a deep problem in sanitary facilities. The pathogen thrives at temperatures ranging between 20 and 43 oC thus systems providing warm water to users are a perfect scenario for them to grow and spread. In clinical environments, where individuals have weak immune systems, and are exposed to different microbiological risks, this can be a serious health issue. Infected patients can suffer from respiratory problems, pneumonia, fever and in the most severe cases, death. In consequence, hospitals need to be prepared to apply disinfection protocols in their water systems to eliminate the threat. These range from superheat flush, which consists on raising temperatures over 65 oC to kill the legionella population (Chen et al. 2005; Stout et al. 2016; E. Y. Lin et al. 1998; Sue Miuetzner et al., 1997) to the method applied by ProEconomy Ltd in their Orca system, which consists on the introduction of Copper and Silver Ions (CSI) into the water system. Such species are supposed to disrupt the cell’s DNA killing it completely and stopping its reproduction (ProEconomy 2016). The use of chemicals like chlorine and ozone, or ultra violet light to inactivate the microbes is also common practice when dealing with Legionella. All these different processes have different grade of success but the ionisation system in particular is increasingly viewed as the most effective (Walraven & Chapman 2016). ProEconomy, in collaboration with the University College of London, is studying different aspects of the ionisation method, aiming to expand the knowledge of its long term effect in order to improve the system and correct some of its current problems. One of those consists on analysing the environmental benefits in terms of energy and carbon that the ORCA system can bring to hospitals. 1.1. Goals All of these is important since the National Health Service (NHS) conducted a survey from which it concluded that the sanitary service is the activity with the highest carbon footprint of the public sector, accounting for 25% of the total emissions in 2004 (NHS, 2009). For this reason, the U.K. government has set a target for Green House Gases emission reduction by 80% on the baseline of 1990 (NHS Sustainability Development Unit 2009) which is translated on less than 15 Mega tonnes of CO2e per year (Figure 1).
Transcript of Life Cycle Assessment of the Orca System Model - Pro...

Life Cycle Assessment of the Orca System ModelProEconomy is a company that focuses on Legionella control and which has been particularly successful for over twenty years.ProEconomy was established in 1993, its huge contribution in water treatment projects promoted the rapid development of the company to gain a good reputation with the National Health Service UK (NHS) as well as other relevant health sectors in Europe. The Orca water treatment system is one of the most significant achievements of ProEconomy because of its high efficiency in controlling Legionella. It consists on releasing copper and silver ions into the water system that will attack the harmful pathogen removing it from the circuit. It has been successfully installed within a number of water systems across the UK for the removal of Legionella. In 2001, the Orca system was installed in the HSBC headquarters in London (ProEconomy, 2016). This project was very successful and eventually led to the opportunity for ProEconomy to secure the European Space Agency (ESA) in 2002. Following this, ProEconomy has witnessed a significant increase in number of clients. Currently, the Orca system is used in over 200 sites throughout Europe.
1. Introduction
It is well understood that the spread of the bacteria responsible for Legionella disease (L pneumophilia) is a deep problem in sanitary facilities. The pathogen thrives at temperatures ranging between 20 and 43 oC thus systems providing warm water to users are a perfect scenario for them to grow and spread. In clinical environments, where individuals have weak immune systems, and are exposed to different microbiological risks, this can be a serious health issue. Infected patients can suffer from respiratory problems, pneumonia, fever and in the most severe cases, death. In consequence, hospitals need to be prepared to apply disinfection protocols in
their water systems to eliminate the threat. These range from superheat flush, which consists on raising temperatures over 65 oC to kill the legionella population (Chen et al. 2005; Stout et al. 2016; E. Y. Lin et al. 1998; Sue Miuetzner et al., 1997) to the method applied by ProEconomy Ltd in their Orca system, which consists on the introduction of Copper and Silver Ions (CSI) into the water system. Such species are supposed to disrupt the cell’s DNA killing it completely and stopping its reproduction (ProEconomy 2016). The use of chemicals like chlorine and ozone, or ultra violet light to inactivate the microbes is also common practice when dealing with Legionella. All these different processes have different grade of success but the ionisation system in particular is increasingly viewed as the most effective (Walraven & Chapman 2016). ProEconomy, in collaboration with the University College of London, is studying different aspects of the ionisation method, aiming to expand the knowledge of its long term effect in order to improve the system and correct some of its current problems. One of those consists on analysing the environmental benefits in terms of energy and carbon that the ORCA system can bring to hospitals.
1.1. GoalsAll of these is important since the National Health Service (NHS) conducted a survey from which it concluded that the sanitary service is the activity with the highest carbon footprint of the public sector, accounting for 25% of the total emissions in 2004 (NHS, 2009). For this reason, the U.K. government has set a target for Green House Gases emission reduction by 80% on the baseline of 1990 (NHS Sustainability Development Unit 2009) which is translated on less than 15 Mega tonnes of CO2e per year (Figure 1).
2050
1990
25
20
15
10
5
0
Repo
rted
cas
es/1
00,0
00 p
op
Legionnaires’ disease is on the rise2000 - 2014*
1995
2000
2005
2010
2015
2020
2025
2030
2035
2040
2045
Key
NHS England CO2e emissionsNHS England projected emissions2007 baselineCarbon Reduction Strategy Target10% target from 2007 baseline1990 baselineClimate Change Act Trajectory34% target from 1990 baseline64% target from 1990 baseline80% target from 1990 baseline
Figure 1 Carbon footprint reduction by 2020 set by the National Health Service Sustainability Development, in which it aims to reduce carbon emissions by hospitals in the U.K. by 80% baseline of 1990
This same report presented by the NHS stated that in order to meet such targets, it is necessary to reduce the emissions from different sources like transport, procurement or medical equipment (NHS Sustainability Development Unit 2009), nevertheless electricity consumed by the building is regarded as the largest source for green-house gas emissions. Hence it is estimated that a total decrease of 40% of MtCO2e emission is required (NHS 2009) as it is shown in figure 2:
Travel
45%
40%
35%
30%
25%
20%
15%
10%
5%
0%Electricity Pharma Medical
TechnologyProcurement
Emission Reduction target By 2020
Figure 2 CO2 emissions reduction target by NHS for the year 2020 on baseline of 1990 for the different activities carried out by hospitals
Reducing hot water temperatures at buildings will play a crucial role in the path towards 2020 objectives.
The aim of this report is to present a Life Cycle Assessment (LCA) of the Orca product to give a holistic perspective on the environmental benefits and impacts of the system, and compare them to the ones of thermal treatment. In this way, each hospital can take informed decisions on how to treat their water in the most environmentally friendly way, working to meet the targets set by 2020.
2. Scope
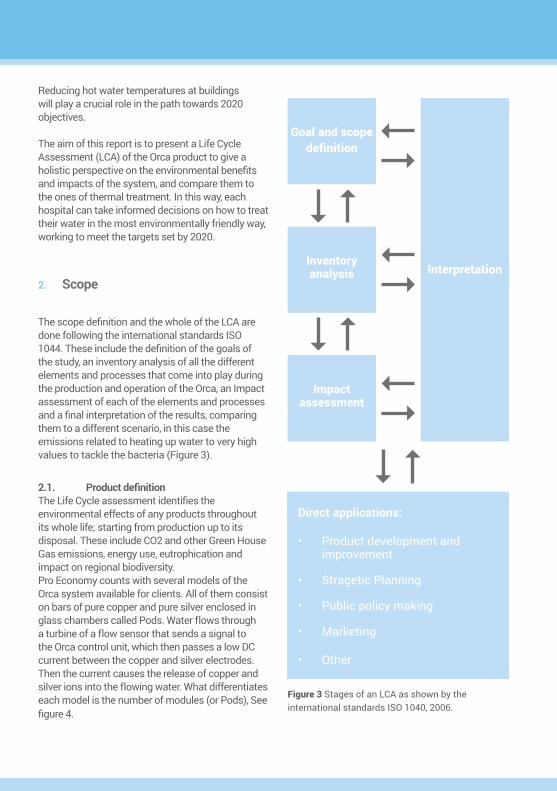
The scope definition and the whole of the LCA are done following the international standards ISO 1044. These include the definition of the goals of the study, an inventory analysis of all the different elements and processes that come into play during the production and operation of the Orca, an Impact assessment of each of the elements and processes and a final interpretation of the results, comparing them to a different scenario, in this case the emissions related to heating up water to very high values to tackle the bacteria (Figure 3).
2.1. ProductdefinitionThe Life Cycle assessment identifies the environmental effects of any products throughout its whole life; starting from production up to its disposal. These include CO2 and other Green House Gas emissions, energy use, eutrophication and impact on regional biodiversity. Pro Economy counts with several models of the Orca system available for clients. All of them consist on bars of pure copper and pure silver enclosed in glass chambers called Pods. Water flows through a turbine of a flow sensor that sends a signal to the Orca control unit, which then passes a low DC current between the copper and silver electrodes. Then the current causes the release of copper and silver ions into the flowing water. What differentiates each model is the number of modules (or Pods), See figure 4.
Goal and scope definition
Inventory analysis
Impact assessment
Interpretation
Direct applications:
• Product development and improvement
• Stragetic Planning
• Public policy making
• Marketing
• Other
Figure 3 Stages of an LCA as shown by the international standards ISO 1040, 2006.
| OFF
| ON
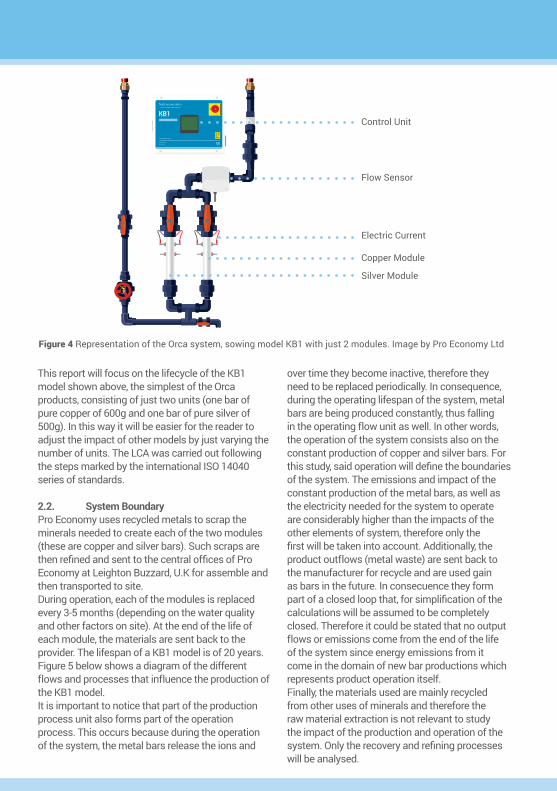
Control Unit
Flow Sensor
Electric Current
Copper Module
Silver Module
Figure 4 Representation of the Orca system, sowing model KB1 with just 2 modules. Image by Pro Economy Ltd
This report will focus on the lifecycle of the KB1 model shown above, the simplest of the Orca products, consisting of just two units (one bar of pure copper of 600g and one bar of pure silver of 500g). In this way it will be easier for the reader to adjust the impact of other models by just varying the number of units. The LCA was carried out following the steps marked by the international ISO 14040 series of standards.
2.2. System BoundaryPro Economy uses recycled metals to scrap the minerals needed to create each of the two modules (these are copper and silver bars). Such scraps are then refined and sent to the central offices of Pro Economy at Leighton Buzzard, U.K for assemble and then transported to site. During operation, each of the modules is replaced every 3-5 months (depending on the water quality and other factors on site). At the end of the life of each module, the materials are sent back to the provider. The lifespan of a KB1 model is of 20 years. Figure 5 below shows a diagram of the different flows and processes that influence the production of the KB1 model. It is important to notice that part of the production process unit also forms part of the operation process. This occurs because during the operation of the system, the metal bars release the ions and
over time they become inactive, therefore they need to be replaced periodically. In consequence, during the operating lifespan of the system, metal bars are being produced constantly, thus falling in the operating flow unit as well. In other words, the operation of the system consists also on the constant production of copper and silver bars. For this study, said operation will define the boundaries of the system. The emissions and impact of the constant production of the metal bars, as well as the electricity needed for the system to operate are considerably higher than the impacts of the other elements of system, therefore only the first will be taken into account. Additionally, the product outflows (metal waste) are sent back to the manufacturer for recycle and are used gain as bars in the future. In consecuence they form part of a closed loop that, for simplification of the calculations will be assumed to be completely closed. Therefore it could be stated that no output flows or emissions come from the end of the life of the system since energy emissions from it come in the domain of new bar productions which represents product operation itself. Finally, the materials used are mainly recycled from other uses of minerals and therefore the raw material extraction is not relevant to study the impact of the production and operation of the system. Only the recovery and refining processes will be analysed.

Raw Material Extraction
Primary use of the metal
Silver RecoveryCopper
RecoveryCase
Production
Silver Refining Copper Refining Circuit
Production
Assembly
Operation
Metal Recycle and Reuse
Electricity Use
Production
Operation
Disposal
Figure 5 System flow units and processes. System boundary is drawn in yellow
Flows analysed will be:
• Silver Recovery from scrap metal.• Silver Refining.• Transport of Silver bar from provider to
assembly point.• Copper Recovery from scrap metal.• Copper Refining.• Transport of Copper bar from provider to
assembly point.• Energy supply for system operation.
Since the product is installed at various sites around d the U.K. it will be inaccurate to assess the
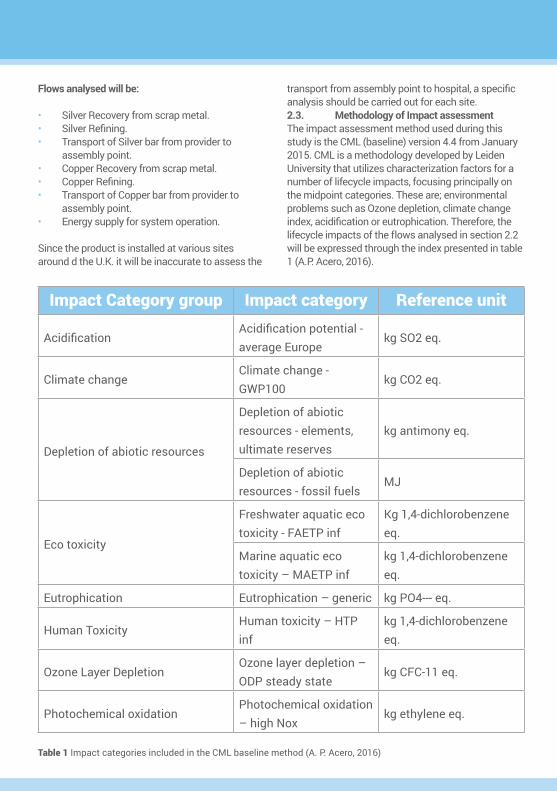
Impact Category group Impact category Reference unit
AcidificationAcidification potential - average Europe
kg SO2 eq.
Climate changeClimate change - GWP100
kg CO2 eq.
Depletion of abiotic resources
Depletion of abiotic resources - elements, ultimate reserves
kg antimony eq.
Depletion of abiotic resources - fossil fuels
MJ
Eco toxicity
Freshwater aquatic eco toxicity - FAETP inf
Kg 1,4-dichlorobenzene eq.
Marine aquatic eco toxicity – MAETP inf
kg 1,4-dichlorobenzene eq.
Eutrophication Eutrophication – generic kg PO4--- eq.
Human ToxicityHuman toxicity – HTP inf
kg 1,4-dichlorobenzene eq.
Ozone Layer DepletionOzone layer depletion – ODP steady state
kg CFC-11 eq.
Photochemical oxidationPhotochemical oxidation – high Nox
kg ethylene eq.
Table 1 Impact categories included in the CML baseline method (A. P. Acero, 2016)
transport from assembly point to hospital, a specific analysis should be carried out for each site.2.3. Methodology of Impact assessmentThe impact assessment method used during this study is the CML (baseline) version 4.4 from January 2015. CML is a methodology developed by Leiden University that utilizes characterization factors for a number of lifecycle impacts, focusing principally on the midpoint categories. These are; environmental problems such as Ozone depletion, climate change index, acidification or eutrophication. Therefore, the lifecycle impacts of the flows analysed in section 2.2 will be expressed through the index presented in table 1 (A.P. Acero, 2016).

The principal scope of the project, as stated in section 1.1 is to give good information to Health State managers to make their decisions based on the 2020 emission targets. For this reason CML baseline was selected, since through the entire index it provides a good picture of the emissions related to the product as well as the energy used from fossil fuels.
2.4. Lifecycle Impact calculationsIn order to carry out the LCA impact analysis, the open source software OpenLCA (Version 1.6.3) was used. The program allows to compile data from various data sets and to carry out the calculation for the indices shown in table 1.
2.5. Data QualityPart of the data for this study was obtained from European reference Life Cycle Database of the Joint Research Centre dataset (ELCD). It comprises Life Cycle Inventory data from EU-level business associations and other sources for key materials, energy carriers, transport, and waste management. This was mainly used for silver and copper recovery as well as copper refinery. Additionally, it was used to derive emissions related to electricity use and transport materials.
Specific data regarding the mass of copper and silver produced, as well as the distance travelled from provider to assembly point is obtained from Pro Economy.
Data on energy use of operation and silver refinery was obtained through the silver provider and Pro economy.
2.6. Inventory analysisIn order to have a detailed understanding of the flows inside the system, an inventory analysis of the different processes occurring during production and operation is carried out. This involves data collection and calculations. For each flow, internal flows were created that describes processes in more detail.
In each of the flows (Silver Recovery from scrap metal, Silver Refining, Transport of Silver bar from provider to assembly point, Copper Recovery from scrap metal, Copper Refining, Transport of Copper
Internal Flow
Energy Imput Produced Waste
Figure 6 Internal flows of each of the process units inside the boundary system
bar from provider to assembly point and Energy supply for system operation) the energy imputed will be inventoried as the main input flow while the waste produced in form of emissions will be characterized as the principal outflow. Although there are more elements of both input and output, these are not of the interest of the study which focuses principally on carbon emissions and climate change effect.
2.7. Assumptions and LimitationsA number of assumptions had to be made in order to create the model of the production and operation of the KB1 model. Due to lack of available data and some time restrictions, the system boundaries had to be reduced with respect to the original intention. It was initially intended to include raw material extraction and primary use of metal inside the analysis, however data was not considered to be robust enough and thus it was decided to be kept outside boundaries. Moreover, for silver and copper refinement process, energy input had to be assumed based on academic papers and online data of metallurgic companies. Similarly, energy consumption during product operation was derived from power output of one test system at University College London.
The study, as mentioned identifies the Lifecycle Impact of just the model KB1, therefore it is not entirely representative of all the Orca system models that Pro Economy offers. Nevertheless, it can provide some guidelines for any other product since the study is principally based on the LCAI of the two metallic bars and electricity consumption during operation.
Energy Input Unit
Biomass (MJ/kg) 14,7
Brown Coal (MJ/kg) 11,9
Crude Oil (MJ/kg) 42,3
Natural gas (MJ/kg) 44,1
Wood (MJ/kg) 14,7
Total 127,7
3. Inventory analysis
This section will present in detail the production and operation process of the KB1 Orca model together with the steps of data gathering, processing and calculations.
3.1. Silver RecoveryBaird & Co, located in Hatton Garden are the suppliers of silver bars for Pro Economy. Impure metals are brought from different sites, which were not possible to identify for this study, and then melted in complex induction furnaces to ensure a homogeneous consistency before sampling and assaying. Individual customer melts consist of a kilo or two (Baird, 2015). This means that for one bar of Silver of 500g, 1.5kg of metal is introduced in the smelting process. Data of elementary flows for melting of ferro metals is available at ELCD dataset. All elements available in the model as
input parameters are specified for the incineration. The data set includes the emissions and resource consumption for the thermal treatment of the material. The behaviour of bottom ash and air pollution control residues on a landfill is considered. All credits for the electricity and steam export as well as recovered metals are included. It should be noted that this data set is an approximation to reality. The used model of an average European metal furnace and the average composition of metals do not exist in reality and efficiencies, emission values, transfer coefficients and elementary composition will differ if a specific plant is used. Additionally, no pre-treatment method or transport to plant was taken into account.
The principal input value for this study, as stated is energy, which is modelled from several different sources and shown in table 2 below:
Output Amount
CO2 (kg/MJ) 0.627
Acetaldehyde (kg/MJ) 7.09E-8
Argon-41 (kBq/MJ) 0.008
Methane (kg/MJ) 0.06909
Particulates <10um (kg/MJ) 0.0001
Total 127,7
Table 2 Energy input and output values for the silver recovering process through metal melting (ECLD dataset).
Therefore, if 1.5kg are melted to generate each bar, a total of 190.5 MJ are imputed into the system for silver recovery what produces an output of 118.11kg of CO2. Other input values include air, water and other minerals, but are outside the scope of the study.
Main output flows of the system are shown in table 2. It is important to note that these are the most interesting values for this particular study, since CO2 emissions are the principal point of reference, but there are many other input and output items involved
in the process and compiled under ECLD dataset.
They can be consulted at:http://eplca.jrc.ec.europa.eu/ELCD3/datasetdetail/process.xhtml?uuid=89863fc7-3306-11dd-bd11-0800200c9a66&version=03.00.000&stock=default

3.2. SilverRefiningSilver refining is carried out through electrolysis. In this process an impure silver thick catode is connected to a pure thin silver anode by an electrolytic medium of silver nitrate (AgNO3). The electric current removes two electrons from the impure catode which are gained by the pure bar anode. In this way, the positively charged silver ions from the impure catode dissolve in the electrolytic medium and are then attracted to the pure silver bar which had become negatively charged trough receiving the electrons. Over time the size of the pure bar increases its volume while the impure catode is reduced.
Input flows correspond to the electricity required to carry out the electrolysis and the use of pure and impure silver bars. Catode is obtained through the recovery process described above, while the pure bar is the result of a surplus of pure silver obtained from a previous electrolysis refining. Although the system is not ideal and in a real case scenario there are some material loses, for simplification purposes it was assumed that the loop is completely closed (Figure 7).
Impure recovered
Electricity
Electrolytic
Pure Metal
Pure Refined Metal
Transport Assembly
Closed System
Figure 7 Flow processes involved in the refining through electrolysis of silver bars.
Therefore the only two inputs to the system would be the impure bar, which was analysed in previous section and the electricity required to carry out the process.For this study it was not possible to obtain robust data of the electricity use at Baird & Co, therefore, it was necessary to make some assumptions to model this flow.
For each ion of silver released into the electrolytic medium from the impure bar, two electrons were
lost. Given the atomic mass of silver (108g/mol) and that the mass of the silver bar required for the Orca is 500g, 4.63 mol of Ag need to be released to the electrolytic medium. Given the ratio between electrons and silver, this means that 6.18 mol of electrons were used in the reaction. The total electric charge of such value can be obtained applying equation (1):
Q=Na x mol of electrons x 1.6 x 10^(-19) (1)

Where Q is the total charge (in coulombs), 1.6 x 10⁻¹⁹ is the electric charge of one electron and Na Avogadro’s number. Given the values presented above, the total charge required to purify 500g of silver is 1.2 x 10⁶ C. From data obtained from the metallurgic and processing engineers association, a representative example of the electrolysis of silver would be a current of 1.5A at 15V. This means that the power necessary to carry out the silver refining can be obtained through equation (2) (A. David, 2017).
P=I x V (2)
Where P is the electric power in watts, I the electric current in amperes and V the voltage of the battery. Finally, given the intensity of the current, and the total charge required, it is possible to derive the time required to carry out the refining process. This is done through equation (3).
t=Q/I (3)
Being I=1.5A and Q=1.2 x 10⁶, the total amount of time invested in refining would be 200h. Therefore, the energy from electricity required to refine one silver bar can be obtained through (4).
E=P x t (4)
For which E=18 MJ/silver bar. Output products from such electricity consumption (assuming it is taken from the grid), can be obtained at the ELCD database. These are presented in table 3.It should be noticed that the electricity estimation for electrolysis does not include efficiency factors or any other particular parameters specific of Baird & Co. Nevertheless, due to the lack of data on this part, the process had to be characterised for a general plant working at standard values of voltage.
Output Amount
CO2 (kg/MJ) 0.622
Acetaldehyde (kg/MJ)
5.13E-8
Argon-41 (kBq/MJ) 0.017
Methane (kg/MJ) 0.0014
Particulates <10um (kg/MJ)
7.8E-6
Total 127,7
Table 4 Output flows for copper recovery (ELCD)
3.4. CopperrefiningCopper refining follows the same process as silver. The only input values to the unit flow that need to be analysed would be electricity use by the grid, which could be estimated using the same method as the one presented in section 3.2. By applying equations (1) to (4), it was obtained that the energy from electricity required to refine 600g of Copper would be E=16.2 MJ. Output flows for electricity use are the same as the ones presented in table 2.
3.5. TransportThe transport of both bars is carried out by road from the suppliers’ zone, to the central offices of Pro Economy at Leighton Buzzard. The travelled distance for one bar of silver from Baird & Co is of 74km, while the distance travelled by the copper bar is only of 2km. It was assumed that th2e vehicle used for said transport was a Lorry transport, Euro 0, 1, 2, 3, 4 mix, 22 t total weight, 17,3t max payload. Input to the flow system are refined metal bars and energy required to carry out the transport. This last one is expressed as a function of the distance travelled and the weight of material transported, tonnes x km (Figure 8).

Refined Material
Weight of Material
Emissions
Input Energy
Lorry Transport Assembly
Travelled Distance
Figure 8 Flow process involved in the transport of metal bars from refinery to Pro Economy central offices.
Energy input from transport and output data can be found at ELCD database. Data sources for the transport system are sufficiently consistent, emission factors are based on average European conditions (key emissions are based on measured operating data). LCI modelling is fully consistent. Output values are represented at table 5. The complete list of output flows from the lorry transport can be found at:
http://eplca.jrc.ec.europa.eu/ELCD3/datasetdetail/process.xhtml?uuid=b444f4d2-3393-11dd-bd11-0800200c9a66&version=03.00.000&stock=default
Output Amount
CO2 (kg/t*km) 0.0639
Acetaldehyde (kg/t*km)
1.556-9
Argon-41 (kBq/t*km) 2.173E-5
Methane (kg/t*km) 6.24E-5
Particulates <10um (kg/t*km)
3.618E-7
Table 5 Output flows for lorry transport in Europe (ELCD).

3.6. Electricity ConsumptionOnce copper and silver bars have been assembled and the KB1 model has been sent to site for commissioning, the only flow input would derive from the electricity consumed by the system due to its daily operation. From the model installed at University College London, which was a KB1 it was possible to obtain the following data:
• Operation Voltage V=12V• Current through copper bar Ic=5.82A• Current through silver bar Is=0.62A
Given this information, the total current intensity utilized by the system is I=6.44A. Applying the equation of electric power (2), it is easily estimated that model KB1 operates at 77.28 W. In order to model for a worst case scenario, it will be assumed that the system would be operating continuously for 3 months (which is the lifespan of one silver bar). During that period, the KB1 model would have consumed 600.9 MJ (E = P x 3 months x 10-6). Output flows for said energy use can be obtained from table 3, since the electricity will be derived from the grid.
These estimations are assuming a constant use of the system, something that could not be the case, depending on the site and the dose of ions the water
system needs. Additionally, voltage use and current intensity can also vary from site to site given the electric installation of the building. Nevertheless, due to the lack of data, the model installed at University College London should work as reference for operation consumption.
3.7. End of lifeThe final output of the system would be the two metal bars. As already mentioned, these are sent back to the provider which would reuse them and re utilize them for manufacturing new bars. For that reason there is not waste for the product. This is however, an idealistic model of the real case scenario, given that no system could be completely closed; nevertheless, it was impossible to access the providers’ data in order to assess the percentage of material that would be loss in the process. For that reason for this study waste from the metal bars will be assumed to be 0.
3.8. General ViewTable 6 shows the energy input values for the in-boundary system process together with the primary carbon dioxide emissions associated with each of the processes. Although this is a good picture of the process, further section will carry out an impact assessment of this data.
Process QuantityEnergy Input(/
metal bar) CO2 Emissions (kg/metal bar)
Silver Recovery 1.5 kg 190.5 MJ/bar 119.44
Silver refining 0.5kg 18 MJ/bar 11.196
Copper Recovery 1.8kg 229.86 MJ/bar 182.05
Coper Refining 0.6kg 16 MJ/bar 9.952
Silver Transport 74km 5E-4 x 74 t kg/bar 0.00003195
Copper Transport 2km 6E-4 x 2 t kg/bar 0.00001278
Operation 77.8W 600.9 MJ/3 months 373.76
End of life N/A N/A N/A
Table 6 Energy input and CO2 emission output of all the different flows allocated in the study of the KB1 model.

It should be taken into account that data presented refers to the lifespan of one bar of copper and one bar of silver together, which are assumed to last over three months. The total lifespan of a KB1 system is of 20 years, therefore for impact calculation, data presented was amplified by a factor of 80 (there are 80 periods of 3 months over 20 years).
4. Life Cycle Impact Assessment (LCIA)
KB1 model has been assessed for their potential environmental impact for the following impact categories, based on the CML baseline method:
• Acidification potential (AP) for emissions to air is calculated with the adapted RAINS 10 models, describing the fate and deposition of acidifying substances. AP is expressed as kg SO2 equivalents/ kg emission. Substances filtering to air, soil and water surfaces considered in the index include: Nitric Acid, Sulphuric acid, Sulphur trioxide, Hydrogen chloride, Hydrogen fluoride, Phosphoric acid and Hydrogen sulphide (SimaPro, 2015). These gases react with the water vapour in the atmosphere, changing the pH and generating acid rain, which consequences go to vegetation disruption to equipment deteroration.
• Climate Change index GWP100 for emissions to air, it represents the emissions of greenhouse gases to the atmosphere. These are one of the principal agents of climate change, which is already causing the disruption of thousands of lives. It is measured in CO2 kg equivalents. The characterization model as developed by the Intergovernmental Panel on Climate Change (IPCC) is selected for development of characterization factors. Factors are expressed as Global Warming Potential for time horizon 100 years (GWP100) (SimaPro, 2015).
• Depletion of abiotic resources indicates the protection of human welfare, human health and ecosystem health. It is related to extraction of minerals and fossil fuels due to inputs in the system. The Abiotic Depletion Factor (ADF) is determined for each extraction of minerals and fossil fuels (kg antimony equivalents/kg extraction) based on concentration reserves and rate of de-accumulation. (SimaPro, 2015).
• Eutrophication represents the impact of
excess amount of heavy nutrients such as Nitrogen or Phosphorus in the environment due to emissions by human activities. These can lead to disproportionate growth of certain species, deeply disrupting the ecosystem and biodiversity of impacted region. It is expressed as PO4 kg equivalent. For this study, exposed region is not included. Eutrophication potential (NP) is based on the stoichiometric procedure of Heijungs (1992).
• Freshwater aquatic ecotoxicity represents the impact of the process on fresh water bodies due to the emission of substances to water, air and soil. Ecotoxicity Potential (FAETP) are calculated with USES-LCA, describing fate, exposure and effects of toxic substances. The time horizon is infinite Characterization factors are expressed as 1,4-dichlorobenzene equivalents/kg emission (SimaPro, 2015).
• Human toxicity represents the impact of toxic substances released to the environment on the human health. Human Toxicity Potentials (HTP) is calculated with USES-LCA. For each toxic substance HTP’s are expressed as 1,4-dichlorobenzene equivalents/ kg emission (SimaPro 2015).
• Marine aquatic toxicity represents the impact on marine life of toxic substances released to the ocean by air, water or soil. For each toxic substance toxicity potentials are expressed as 1,4-dichlorobenzene equivalents/ kg emission (SimaPro 2015).
• Ozone layer depletion represents the impact on the stratospheric ozone layers of the emissions to air by the substances released during the production and operation of the KB1. The reduction of this layer causes an increase of UV light from the sun reaching earth surfaces, which has deep negative effects on both human and natural life (BRE, 2005). This category is output-related and at global scale. The characterization model is developed by the World 5 Meteorological Organization (WMO) and defines ozone depletion potential of different gasses (kg CFC-11 equivalent/ kg emission) (SimaPro, 2015).
• Photochemical Oxidation represents the capacity of the emitted substances to react with light generating oxidized components that can cause damage to the environment. For example, relatively high quantities of oxidised ozone at the lower atmosphere can alter the pH

of water bodies and affect human health and vegetation. Photochemical Ozone Creation Potential (POCP) for emission of substances to air is calculated with the UNECE Trajectory model (including fate), and expressed in kg ethylene equivalents/kg emission. The time span is 5 days and the geographical scale varies between local and continental scale (SimaPro, 2015).
• Terrestrial ecotoxicity his category refers to impacts of toxic substances on terrestrial ecosystems. Ecotoxicity Potential (TETP) is calculated with USES-LCA, describing fate, exposure and effects of toxic substances. The time horizon is infinite Characterization factors are expressed as 1,4-dichlorobenzene equivalents/kg emission (SimaPro, 2015).
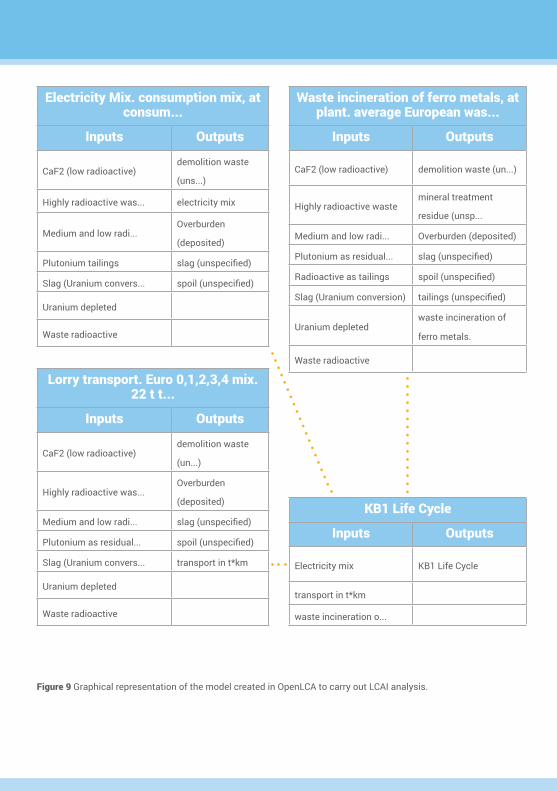
Using the CLM baseline method and the data gathered during the inventory analysis in section 3 an analysis of the environmental impact of the product is carried out using OpenLCA software. Results are presented below.
4.1 OpenLCA ModelThe calculation of the LCIA indices was carried out through a model built in OpenLCA software. A process was created in which the input flows were derived from inventory analysis. These are three which contain the information of all flow processes. The first one is Ferro metal incinerator, containing data from ELCD dataset on input, output and elementary flows for emission and LCIA indices. The flow is expressed in kg of metal recovered, and it is expressed through equation (5)
Melted metal=Nx(1.8+1.5) (5)
Parameter N represents the number of metal bars utilized by the system over a lifespan. If these are changed every 3 months N=80. 1.8 and 1.5 represent the mass of copper and silver recovered for each bar respectively.
The second flow represents the electricity used from the grid for three different processes; refining of silver and coper, and the electricity used by the system during operation. It is expressed in MJ and modelled through equation (6)
Electricity Use=(18+16+600.9) x N (6)
Values 18, 16 and 600.9 represent the electricity
used (in MJ) used for copper, silver and operation respectively. The electricity use flow utilizes ELCD dataset to obtain input, output and elementary flows for emission and LCIA indices.
The last flow used to model the process of producing and operating the KB1 model is the transport by road flow. It utilizes ELCD dataset to obtain input, output and elementary flows for emission and LCIA indices and it is measured in kg of transported material x km travelled. It was modelled through equation (7).
Transport=(Sm x 74+Cm x 2) x N (7)
Sm represents the mass of silver transported (in kg) and Cm the mass of copper.
A Graphic representation of the model can be seen in figure 9.
Electricity Mix. consumption mix, at consum...
Inputs Outputs
CaF2 (low radioactive)demolition waste
(uns...)
Highly radioactive was... electricity mix
Medium and low radi...Overburden
(deposited)
Plutonium tailings slag (unspecified)
Slag (Uranium convers... spoil (unspecified)
Uranium depleted
Waste radioactive
Lorry transport. Euro 0,1,2,3,4 mix. 22 t t...
Inputs Outputs
CaF2 (low radioactive)demolition waste
(un...)
Highly radioactive was...Overburden
(deposited)
Medium and low radi... slag (unspecified)
Plutonium as residual... spoil (unspecified)
Slag (Uranium convers... transport in t*km
Uranium depleted
Waste radioactive
KB1 Life Cycle
Inputs Outputs
Electricity mix KB1 Life Cycle
transport in t*km
waste incineration o...
Waste incineration of ferro metals, at plant. average European was...
Inputs Outputs
CaF2 (low radioactive) demolition waste (un...)
Highly radioactive wastemineral treatment
residue (unsp...
Medium and low radi... Overburden (deposited)
Plutonium as residual... slag (unspecified)
Radioactive as tailings spoil (unspecified)
Slag (Uranium conversion) tailings (unspecified)
Uranium depletedwaste incineration of
ferro metals. Waste radioactive
Figure 9 Graphical representation of the model created in OpenLCA to carry out LCAI analysis.
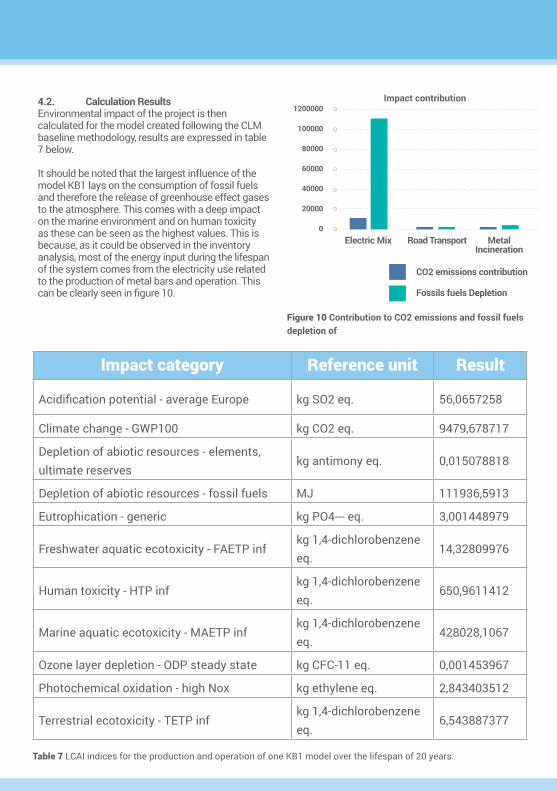
4.2. Calculation ResultsEnvironmental impact of the project is then calculated for the model created following the CLM baseline methodology, results are expressed in table 7 below.
It should be noted that the largest influence of the model KB1 lays on the consumption of fossil fuels and therefore the release of greenhouse effect gases to the atmosphere. This comes with a deep impact on the marine environment and on human toxicity as these can be seen as the highest values. This is because, as it could be observed in the inventory analysis, most of the energy input during the lifespan of the system comes from the electricity use related to the production of metal bars and operation. This can be clearly seen in figure 10.
Impact category Reference unit Result
Acidification potential - average Europe kg SO2 eq. 56,0657258
Climate change - GWP100 kg CO2 eq. 9479,678717
Depletion of abiotic resources - elements, ultimate reserves
kg antimony eq. 0,015078818
Depletion of abiotic resources - fossil fuels MJ 111936,5913
Eutrophication - generic kg PO4--- eq. 3,001448979
Freshwater aquatic ecotoxicity - FAETP infkg 1,4-dichlorobenzene eq.
14,32809976
Human toxicity - HTP infkg 1,4-dichlorobenzene eq.
650,9611412
Marine aquatic ecotoxicity - MAETP infkg 1,4-dichlorobenzene eq.
428028,1067
Ozone layer depletion - ODP steady state kg CFC-11 eq. 0,001453967
Photochemical oxidation - high Nox kg ethylene eq. 2,843403512
Terrestrial ecotoxicity - TETP infkg 1,4-dichlorobenzene eq.
6,543887377
Table 7 LCAI indices for the production and operation of one KB1 model over the lifespan of 20 years.
Electric Mix
1200000
100000
80000
60000
40000
20000
0Road Transport Metal
Incineration
Impact contribution
CO2 emissions contribution
Fossils fuels Depletion
Figure 10 Contribution to CO2 emissions and fossil fuels depletion of
As stated in the goals section, the objective of this study is to observe the environmental impact that the Orca system has with respect to other water disinfection methods. Recently, a study carried out by University College London examined the carbon footprint related to water heating in healthcare facilities for the killing of legionella. This study aimed to analyse the potential savings in both energy and carbon emissions related to reducing water temperatures in hospitals. An individual study was done at Great Ormond Street Hospital in London (GOSH), where the implementation of the Orca system allowed them to store hot water at 45 oC instead of 65 oC.
5.1. Carbon Emissions for water heating studyKeeping hot water temperatures at 65 oC requires large amounts of energy, considering water is usually heated from 20 degrees or lower coming from the main water supplier. Equation (8) shown below, allows approximating the power needed to reach said temperatures:
dT/dt=Q/(ρVC_P)(8)
Where T is water temperature, t is time; Q corresponds to the heat power implanted to the water, ρ is the density of water, V the volume of the fluid and C_P water heat capacity (4812 J/K kg).This equation is used by the Process Heating Services calculator (Process Heating Services Ltd. 2016), and makes it possible to obtain an estimate of the energy needed to raise water temperatures at the values needed.
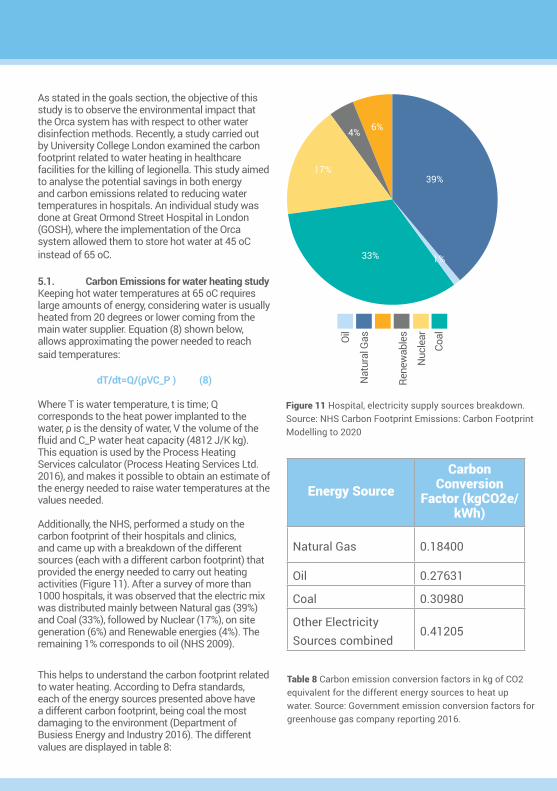
Additionally, the NHS, performed a study on the carbon footprint of their hospitals and clinics, and came up with a breakdown of the different sources (each with a different carbon footprint) that provided the energy needed to carry out heating activities (Figure 11). After a survey of more than 1000 hospitals, it was observed that the electric mix was distributed mainly between Natural gas (39%) and Coal (33%), followed by Nuclear (17%), on site generation (6%) and Renewable energies (4%). The remaining 1% corresponds to oil (NHS 2009).
This helps to understand the carbon footprint related to water heating. According to Defra standards, each of the energy sources presented above have a different carbon footprint, being coal the most damaging to the environment (Department of Busiess Energy and Industry 2016). The different values are displayed in table 8:
39%
33%
17%
1%
4% 6%
Nat
ural
Gas
Rene
wab
les
Nuc
lear
CoalOi
l
Figure 11 Hospital, electricity supply sources breakdown. Source: NHS Carbon Footprint Emissions: Carbon Footprint Modelling to 2020
Energy SourceCarbon
Conversion Factor (kgCO2e/
kWh)
Natural Gas 0.18400
Oil 0.27631
Coal 0.30980
Other Electricity Sources combined
0.41205
Table 8 Carbon emission conversion factors in kg of CO2 equivalent for the different energy sources to heat up water. Source: Government emission conversion factors for greenhouse gas company reporting 2016.

GOSH counted with three hot water tanks, of a total of 9000L capacity at temperatures of 45 oC. Applying the methodology explained above, as well as the DEFRA coefficients for energy use in hospitals, results were as follow:
Water temperature reduction No Water temperature reduction
Annual Energy use (kWh)
160,543.47 238,005.09
Total Carbon Footprint kg of CO2e
46,238.22 68,547.99
Money Spent £17,659.78 £26,180.56
Hospital's energy share 2,54% 3,76%
Table 9: Carbon emission and energy use of the different scenarios presented for water heating conditions.
As it can be seen, the study estimated that, by reducing water temperatures in the facility, carbon emissions would decrease from 68.55 TCO2 annually to 46.24 TCO2 (D. Jimenez et. al, 2017).
5.2. Data comparison.From the study on water heating reduction, it was estimated that 22.3 tonnes of CO2 equivalent will be saved per annum if water heating is reduced. On the other hand, the Carbon impact of kg of CO2 equivalent by a KB1 model would be of 9.48 tonnes of CO2 over its entire lifespan of 20 years, which is translated into 0.5 tonnes of CO2 equivalent per annum. This is just a 2.2% of the total reductions.It is safe to assume, then that the use of a KB1 system is extremely beneficial for any healthcare facility since, although it has an impact of 0.5 tCO2 equivalent every 12 months, it can help reduce emissions by reducing water temperature up to 21.8 tCO2e every year, which over its lifespan is a total of 436 tCO2e.

Bibliography
Association of Plumbing and Heating, 2013. UNDERSTANDING HOT WATER SYSTEMS IN THE HOME, consumer advice guide.
A. P. Acero, C. Rodriguez, A. Ciroth, 2016. LCIA methods Impact assessment methods in Life Cycle Assessment and their impact categories. Green data. Version 1.5.5.
Bairid & Co, 2015. Refining & Recovery. Last access 27/07/2017 Available at: http://www.goldline.co.uk/about.page
Blanc, D.S. et al., 2005. Water disinfection with ozone, copper and silver ions, and temperature increase to control Legionella: seven years of experience in a university teaching hospital. The Journal of hospital infection, 60(1), pp.69–72. Available at: http://www.ncbi.nlm.nih.gov/pubmed/15823660.
BRE, 2006. Green Guide to Specification. BRE Materials Industry Briefing Note 3a: Characterisation.
Chen, Y.S. et al., 2005. Abbreviated duration of superheat-and-flush and disinfection of taps for Legionella disinfection: Lessons learned from failure. American Journal of Infection Control, 33(10), pp.606–610.
David. M, 2017. Electrolytic Refining: Silver – Gold – Copper. 911 Metallurgist. Last access 27/07/2017.https://www.911metallurgist.com/electrolytic-refining/
Department of Busiess Energy and Industry, 2016. Government emission conversion factors for greenhouse gas company reporting. Energy and climate change: evidence and analysis and Greenhouse gas emissions. Available at: https://www.gov.uk/government/collections/government-conversion-factors-for-company-reporting [Accessed November 10, 2016].
Department of Health UK, 2016. Health Technical Memorandum 04-01: Safe water in healthcare premises. Part A: Design, installation and commissioning.
ELCD, 2007. Process Data set: Lorry transport; Euro 0, 1, 2, 3, 4 mix; 22 t total weight, 17,3 t max payload. European reference Life Cycle Database. Last access 27/07/2017.http://eplca.jrc.ec.europa.eu/ELCD3/index.xhtml?stock=default
ELCD, 2007. Process Data set: Waste incineration of ferro metals; average European waste-to-energy plant, without collection, transport and pre-treatment; at plant. European reference Life Cycle Database. Last access 27/07/2017.http://eplca.jrc.ec.europa.eu/ELCD3/datasetdetail/process.xhtml?uuid=89863fc7-3306-11dd-bd11-0800200c9a66&version=03.00.000&stock=default
Great Ormond Street Hospital, 2014. Sustainable Health , Low Carbon SUSTAINABLE DEVELOPMENT.
Griffiths-Sattenspiel, B. & Wilson, W., 2009. The Carbon Footprint of Water. , p.54. Available at: www.rivernetwork.org.
Healthy Built Environment, 2015. What is Copper Silver Ionisation and how does it work? Legionella Control. Available at: http://hberm.com/copper-silver-ionisation-support/ [Accessed December 1, 2016].
Hogben, M.G., 2009. Independent Review of evidence regarding selection of techniques for the suppression of Legionella in water supplies of hospitals and other healthcare premises. , (March), pp.1–26.
ISO 1040, 2006. Environmental Management-Lifecycle assessment Principles and Framework. ISO 2006 eddition.
Lin, E.Y. et al., 1998. Disinfection of water distribution systems for Legionella. Seminars in Respiratory Infections, 13(2), pp.147–159.
Lin, Y. et al., 1998. Legionella in water distribution systems. Journal of the American Water Works Association, 90(9), pp.112–121. Available at: https://doc-04-7c-apps-viewer.googleusercontent.com/viewer/secure/pdf/ec348f84mp2b39hfclhpl6b697v3gd2k/dm4k84l7746e4gv5dqa24s467iofu1r5/1480507575000/lantern/01245224685702467756/ACFrOgBH3CcmdoYYflcRkCOT_hk1NjSHE6DhsA83BAjFCKNw_iGkXqR_JeLy3GtkZZ9OTLXbj3sI.
Marchesi, I. et al., 2011. Effectiveness of different methods to control legionella in the water supply: Ten-year experience in an Italian university hospital. Journal of Hospital Infection, 77(1), pp.47–51. Available at: http://dx.doi.org/10.1016/j.jhin.2010.09.012.
Mudd, G.M. et al., 2012. Future Greenhouse Gas Emissions from Copper Mining : Assessing Clean Energy Scenarios Prepared
Muraca, P., Stout, J.E. & Yu, V.L., 1987. Comparative assessment of chlorine, heat, ozone, and UV light for killing Legionella pneumophila within a model plumbing system. Applied and Environmental Microbiology, 53(2), pp.447–453.
NHS, 2009. NHS England Carbon Emissions : Carbon Footprint modelling to. , (January).
NHS Sustainability Development Unit, 2009. NHS carbon reduction strategy | NHS Requirements. Available at: http://www.sduhealth.org.uk/policy-strategy/engagement-

resources/nhs-carbon-reduction-strategy-2009.aspx.
Norgate, T. & Haque, N., 2010. Energy and greenhouse gas impacts of mining and mineral processing operations. Journal of Cleaner Production, 18(3), pp.266–274. Available at: http://dx.doi.org/10.1016/j.jclepro.2009.09.020.
Nuss, P. & Eckelman, M.J., 2014. Life cycle assessment of metals: A scientific synthesis. PLoS ONE, 9(7), pp.1–12.
Plumbley, R., 2015. How efficiently is Great Ormond Street Hospital Building being used ? HM Government, p.2015.
Prado, R.T.A. & Gonçalves, M., 1998. Water heating through electric shower and energy demand. Energy and buildings, 29, pp.77–82.
Process Heating Services Ltd., 2016. WATER HEATING TIME CALCULATOR. Available at: http://processheatingservices.com/water-heating-time-calculator/ [Accessed November 29, 2016].
ProEconomy, 2016. How the ORCA system works. Available at: http://www.proeconomy.com/index.php/the-orca/ [Accessed November 30, 2016].
Rohr, U. et al., 1999. Four years of experience with silver-copper ionization for control of legionella in a german university hospital hot water plumbing system. Clinical infectious diseases : an official publication of the Infectious Diseases Society of America, 29(6), pp.1507–11. Available at: http://www.ncbi.nlm.nih.gov/pubmed/10585804.
Sabria, M. & Yu, V.L., 2002. Hospitals and legionellosis Hospital-acquired legionellosis : solutions for a. , 2(June), pp.368–373.
Sima Pro, 2016. Database Manual Methods Library. Report Version 2.9
Stout, J.E. et al., 2016. Controlling Legionella in Hospital Water Systems : Experience with the Superheat-and- Flush Method and Copper-Silver Ionization Published by : Cambridge University Press on behalf of The Society for Healthcare Epidemiology of America Stable URL : http://w. , 19(12), pp.911–914.
Sue Miuetzner, Rober C. Schwille, Adrianne Farley, Ellen R. wald, John H. Ge, Stanley J. States, Theresa Libert, R.M.W., 1997. Efficacy of thermal treatment and copper-silver ionization for controlling Legionella pneumophilia in high-volume hot water pumping systems in hospitals. Association of Professionals in Infection Control and Epidemology.
USGS, 2009. Minerals Yearbook: Volume I.-- Metals and Minerals. Available at: http://minerals.usgs.gov/minerals/pubs/commodity/myb/ [Accessed November 20, 2016].
Walraven, N. & Chapman, C., 2016. The efficacy of various disinfection methods against Legionella pneumophila in water systems. Holland Water, pp.1–42.
Walraven, N., Pool, W. & Chapman, C., 2015. The dosing accuracy of copper and silver ionisation systems: Separate high purity copper and silver electrodes versus copper/silver alloys. Journal of Water Process Engineering, 8, pp.119–125. Available at: http://dx.doi.org/10.1016/j.jwpe.2015.09.008.
Zhang, Z. et al., 2009. Legionella control by chlorine dioxide in hospital water systems. Journal / American Water Works Association, 101(5), pp.117–127.