Life Cycle Assessment of Photovoltaics: Update of...
22
1 Copyright © 2008 ESU-services Ltd. Download: www.esu-services.ch Working Paper Life Cycle Assessment of Photovoltaics: Update of ecoinvent data v2.0 Niels Jungbluth 1* , Matthias Tuchschmid 1 , Mariska de Wild-Scholten 2 1 ESU-services Ltd., Kanzleistrasse 4, CH-8610 Uster, Tel. +41 44 9406132, Fax. +41 44 9406194, www.esu-services.ch 2 Energy research Centre of the Netherlands, Unit Solar Energy, P.O. Box 1, 1755 ZG Petten, the Netherlands, Tel. +31 224 56 4736, Fax. +31 224 56 8214 * Corresponding author ([email protected] )
Transcript of Life Cycle Assessment of Photovoltaics: Update of...
1
Copyright © 2008 ESU-services Ltd.
Download: www.esu-services.ch
Working Paper
Life Cycle Assessment of Photovoltaics: Update of ecoinvent data
v2.0
Niels Jungbluth1*, Matthias Tuchschmid1, Mariska de Wild-Scholten2 1 ESU-services Ltd., Kanzleistrasse 4, CH-8610 Uster, Tel. +41 44 9406132, Fax. +41 44 9406194, www.esu-services.ch 2 Energy research Centre of the Netherlands, Unit Solar Energy, P.O. Box 1, 1755 ZG Petten, the Netherlands, Tel. +31 224 56 4736, Fax. +31 224 56 8214
* Corresponding author ([email protected])

2
Abstract This paper describes the update and extension of the life cycle assessment (LCA) of photovoltaic (PV) power plants in the ecoinvent database v2.0. Sixteen different, grid-connected photovoltaic systems were studied for the situation in Switzerland in the year 2005. They are manufactured as panels or laminates, from silicon or thin-films, installed on façades, slanted or flat roofs, and have 3kWp capacity. Furthermore average photovoltaic production mix data have been investigated for more than 20 countries. The process data include the full process chain for panel and laminate production, mounting structure, 30 years operation and dismantling. The ecoinvent data v1.0 have been updated with information from new research projects and manufacturer data. The LCI for photovoltaic electricity shows that each production stage is important for certain elementary flows. A comparison of the cumulative energy demand with older Swiss studies highlights the developments for crystalline photovoltaics in the last 15 years. An evaluation of region specific energy pay-back times as well as mitigation potentials for nuclear waste and CO2 highlights the region specific differences for an assessment. The presented life cycle inventories for photovoltaic power plants are representative for newly constructed plants in Switzerland in the year 2005. The very detailed ecoinvent data v2.0 forms a good basis for assessments of the use of photovoltaics in this reference year.
Keywords: ecoinvent; electricity mixes; life cycle assessment; LCA; photovoltaic; Switzerland; thin-film; regional results.

3
1 Introduction Life cycle assessment (LCA) aims at comparing and analysing the environmental impacts of products and services. The International Organization for Standardization (ISO) has standardized the basic principles [1]. An LCA consists of four steps. The goal and scope definition describes the underlying questions, the system boundaries and the definition of a functional unit for the comparison of different alternatives. The flows of pollutants, materials and resources are investigated and recorded in the inventory analysis. The elementary flows (emissions and resource consumption) are described, characterized and aggregated for different environmental problems during the impact assessment. Final conclusions are drawn during the interpretation. Normally LCA aims to analyse and compare different products, processes or services that fulfil the same utility (e.g. photovoltaics against nuclear power). It is used for hot spot analysis, product or process improvement, marketing and environmental policy.
LCA studies for photovoltaic power plants have a long tradition of more than 15 years (e.g. [2-17]. The production technology for photovoltaic power plants has constantly been improved over the last decades, e.g. for the efficiency of cells, the amount and production processes for the silicon required, and the actual capacity of production processes. There is consensus between LCA researchers in the field of photovoltaics that life cycle inventory data have to be up-to-date in order to derive accurate conclusions. Critical issues during modelling of a life cycle inventory (LCI) for photovoltaics are: modelling of silicon inputs, power mixes assumed for the production processes, process specific emissions and assumptions for the performance during operation.
The Swiss life cycle inventories for photovoltaics [12, 18], which formed the basis for many studies in this research area, has been updated recently for the fourth time. This article presents the latest results from this research work. The terms of use of this database do not allow a full publication of the inventory data in such an article nor would this be possible due to the extend of necessary information, but all assumptions are documented in detail in the ecoinvent reports, which have now also been translated to English [19, 20].
In the past years the PV sector developed rapidly. The data for photovoltaics in the ecoinvent database have been updated on behalf of the European Photovoltaics Industry Association and the Swiss Federal Authority for Energy. Ongoing projects such as CrystalClear1 have investigated the up-to-date life cycle inventory data of the multi- and singlecrystalline technologies [21].
The PV data in the ecoinvent database v2.0 are mainly investigated for Swiss and Western European conditions and are documented according to the ecoinvent requirements [19]. The LCA database ecoinvent contains more than 4’000 datasets of goods and services from the energy, transport, building materials, electronics, chemicals, pulp and paper, waste treatment and agricultural sector [20]. Several new materials and services have been investigated as compared to the 2003 version.
2 Goal, Scope and Background The following unit process raw data have been investigated and updated:
• multicrystalline SoG-silicon, Siemens process (new solar-grade process)
• multicrystalline-Si wafer (mc-Si or multi-Si)
• singlecrystalline-Si wafer (sc-Si or single-Si)
• silica carbide (SiC)
• recycling of sawing slurry and provision of SiC and glycol
1 See www.ipcrystalclear.info for detailed information.

4
• ribbon Si wafer (so far not covered by ecoinvent data v1.3)
• ribbon-, multi- or single-Si solar cell (156 mm x156 mm)
• front metallization paste and back side metallization paste of solar cells
• crystalline silicon modules (60 cells per module), (ribbon-Si new) and other module types
• inverter including electronic components
• mounting and cabling
• PV-electricity mix Switzerland and in other countries
New thin-film cells technologies like CIS or CdTe are entering the market. For the first time also thin-film photovoltaics (CIS, CdTe and amorphous silicon) are investigated for the ecoinvent data based on literature information.
The electricity yield per kWp is one important factor for the comparison of PV with other types of electricity production. For ecoinvent data v1.3 only the situation in Switzerland had been investigated [18]. For the ecoinvent data v2.0 we investigated the PV technology mixes for several European countries using the specific electricity yields in each country based on published irradiation levels [22]. Also yields in selected non-European countries (e.g. in Asia, Australia and North-America) were considered for a rough extrapolation of the European PV model to PV installations in those countries. However, different electricity/energy mixes for the manufacturing upstream chains have not been modelled for different country-specific cases but only the average European chain was investigated in detail.
Sixteen different, grid-connected photovoltaic systems were studied. These are different small-scale plants of 3 kWp capacity and operational in the year 2005 in Switzerland (see Tab. 1).
The plants differ according to the cell type (single- and multicrystalline silicon, ribbon-silicon, thin-film cells with a-Si, CdTe and CIS), and the place of installation (slanted roof, flat roof and façade). Slanted roof and façade systems are further distinguished according to the kind of installation (building integrated using frameless laminate, or mounted using framed panel).
Tab. 1: Overview of the types of photovoltaic 3 kWp systems investigated for an installation in Switzerland and share of installations for electricity mixes in Switzerland and in other countries
Installation Cell type Panel type 1) Share in Swiss PV mix
Share in other PV mixes
Slanted roof sc-Si Panel 26.9% 25.0%
mc-Si Panel 36.6% 34.0%
a-Si Panel 4.4% 4.5%
ribbon-Si Panel 2.7% 2.8%
CdTe Panel 1.4% 1.4%
CIS Panel 0.2% 0.2%
sc-Si Laminate 1.9% 1.0%
mc-Si Laminate 2.6% 1.3%
a-Si Laminate 0.3% 0.2%
ribbon-Si Laminate 0.2% 0.1%
Flat roof sc-Si Panel 5.8% 7.7%
mc-Si Panel 7.9% 10.5%
Façade sc-Si Panel 1.9% 3.8%
mc-Si Panel 2.6% 5.2%
sc-Si Laminate 1.9% 1.0%
mc-Si Laminate 2.6% 1.3%
1) The panels have a frame and it is assumed that they are mounted on the roof; For the (unframed) laminates it is assumed that they are integrated in the roof construction, sc-Si = singlecrystalline silicon, mc-Si = multicrystalline silicon.

5
3 Life cycle inventory analysis All subsystems shown in Fig. 1 are included as individual datasets within the system boundaries for silicon based PV power plants. The process data include quartz reduction, silicon purification, wafer, panel and laminate production, manufacturing of inverter, mounting, cabling, infrastructure, assuming 30 years operational lifetime for the plant. The basic assumptions for each of these unit processes are described in the report [19]. We considered the following items for each production stages as far as data were available:
• energy consumption,
• air- and waterborne process-specific pollutants at all production stages,
• materials, auxiliary chemicals, etc.
• transport of materials, of energy carriers, of semi-finished products and of the complete power plant,
• waste treatment processes for production wastes,
• dismantling of all components,
• infrastructure for all production facilities with its land use.
silica sand�
EG-silicon� off-grade silicon�SiCl4� SoG-silicon�
CZ-sc-silicon �crystallisation�
MG-silicon purification�
MG-silicon�
wafer sawing�
cell production�
operation�
installation 3kWp plants�
mounting systems�electric components� panel- or laminate production�
mc-Si crystallisation�
electricity�
silicon mix for photovoltaics�
silicon ribbons�
Silane�
Amorphous silicon �deposition (a-Si)�
Fig. 1: Different sub systems investigated for the production chain of silicon cells based photovoltaic power plants installed in Switzerland. MG-silicon: metallurgical grade silicon, EG-silicon: electronic grade silicon, SoG-silicon: solar-grade silicon, a-Si: amorphous silicon
All subsystems shown in Fig. 2 are included within the system boundaries for thin-film PV power plants. All inputs (semiconductor metals, panel materials and auxiliary materials) for the production of thin-film cells, laminates and panels are investigated in other reports of the ecoinvent project [23]. Thus, in the specific report for PV we only described the process stages starting from the laminate and panel production.

6
semiconductor metals:�cadmium�tellurium�indium�
etc.�
operation�
installation 3kWp plants�
mounting �systems�
electric �components�
panel- and laminate production�
electricity�
panel materials:�glass�
aluminium�EVA film�
etc.�
auxillary materials:�gases�acids�etc.�
Fig. 2: Different sub systems investigated for thin-film (CIS and CdTe) photovoltaic power plants installed in Switzerland
Tab. 4 at the end of this chapter shows the most important parameters for the inventory
analysis.
3.1 Silicon based photovoltaics Data for all process stages have been updated as far as possible with industry data from a European research project [24]. The LCI data were investigated based on questionnaires sent to 11 European and US photovoltaic companies for the reference year 2005. Only major changes compared to the previous version of the life cycle inventory data [16] are described here.
3.1.1 Silicon purification To fill the shortage in production capacity for “solar grade silicon” that has occurred since 2004, a number of EG-silicon producers have started to produce silicon for the solar industry, employing a slightly modified version of the (trichloro)silane/Siemens route. The most important difference from our perspective is that the energy consumption of the modified Siemens is somewhat lower than in the standard Siemens process, because of the relaxed purity requirements.
Between 12650 and 14400 tonnes of SoG-silicon have been produced in 2005 [25, 26]. About 80% of the silicon for photovoltaic applications is presently produced with a modified version of this process (“modified Siemens” process). The inventory for this process is based on confidential data from one producer that uses a modified Siemens process [24]. A silicon mix has been established in the life cycle inventory that accounts for the share of different types of silicon purification processes.
3.1.2 Wafer, cells, laminates and panels All life cycle inventory data for wafer sawing, cell production, laminates and panels are now documented per m2 surface. This facilitates the use and adaptation of the data by database users. Further chemicals and materials are included in the life cycle inventories, e.g. metallization pastes, polyvinylfluoride foils or special chemicals [27, 28].

7
3.1.3 Ribbon silicon As a third type of wafers, ribbon silicon has been included for the first time in ecoinvent data based on literature information [24]. These wafers are also made of multicrystalline silicon. The silicon wafers are not sawn from blocks, but they are directly pulled or casted from liquid silicon. Thus a much higher material efficiency can be achieved because sawing losses are avoided.
3.2 Thin-film cells and panels 3.2.1 Cadmium telluride photovoltaic panels (CdTe) We investigate CdTe technology with the available data for laminates from the United States (US) and panels from Germany (DE). From this a mix has been calculated assuming that 90% of panels installed in Switzerland have been produced in Germany. This represents the production figures of 2005. It has to be noted that the US production has been increased considerable since this while the status of the German production is not clear. Data for the necessary coating materials are investigated in a separate ecoinvent report [23]. The life cycle inventory data of this technology are based on the following publications:
• Detailed and most recent investigation by Fthenakis and colleagues for the production process at First Solar, US [29, 30]. The authors of these articles provided further detailed information, which is the main basis for this life cycle inventory. Technical data for single modules were available on the homepage (www.firstsolar.de). Some earlier data for the Cd emissions and wastes by this producer are provided by Bohland & Smigielski [31].
• Some data are published for the production process of Antec Solar, DE [32, 33]. Further information for single modules including a calculation for an energy analysis was available on the company’s homepage (www.antec-solar.de).
• Some early data for possible production processes were available from Steinberger [34].
3.2.2 Copper indium selenide photovoltaic panels (CIS) The following information and publications have been used to elaborate the life cycle inventory analysis of thin-film copper-indium-diselenide (CIS) PV modules:
• Data are mainly available for the production process of Würth Solar in Germany. The company provided key figures on energy and material inputs as well as wastes for the production in 2007 in a personal communication. Some data are shown for the production process at Würth Solar directly on the company’s homepage (www.wuerth-solar.de).
• Older data have been published in an article by Raugei et. al. [33] based on a former work [32]. However, that work investigated the production of very specific designer modules and is thus not representative for the production of average modules today.
• An earlier work investigated data for the producer Siemens (now Avancis) [35]. These data have also been evaluated.
3.2.3 Amorphous silicon (a-Si) Amorphous silicon (a-Si) alloy thin-film technology offers an interesting opportunity to reduce materials cost of the solar cells. An important target is to increase the efficiencies. By utilizing a flexible, stainless steel substrate and polymer-based encapsulates, PV products utilizing this technology can be lightweight, flexible and durable.
Most of the data including data for transports are directly taken from a recent publication [36]. The amount of aluminium and steel necessary for the production of panels has been roughly estimated by [36] with an older less detailed publication [37]. It has to be noted that the a-Si technology based on steel substrates is not quite representative of the majority of a-Si panels produced today worldwide. These use more often a glass and Tedlar encapsulation.
8
3.3 Mounting systems In our calculations, panels (laminates with frame) are mounted on top of houses and laminates are integrated into slanted roofs and façades. Flat roof systems are mounted on the roof. Process data for different systems include construction materials (e.g. aluminium, plastics, steel, etc.) and process energy. Transports of the photovoltaic system from the manufacturing site to the place of operation include personnel transports for mounting. The life cycle inventory considers up-to-date documentation for the weight and materials of such systems [38].
3.4 Inverter Process data of the inverter consider now also several electronic components for its manufacturing based on new inventories for electronics and the material composition [24, 39].
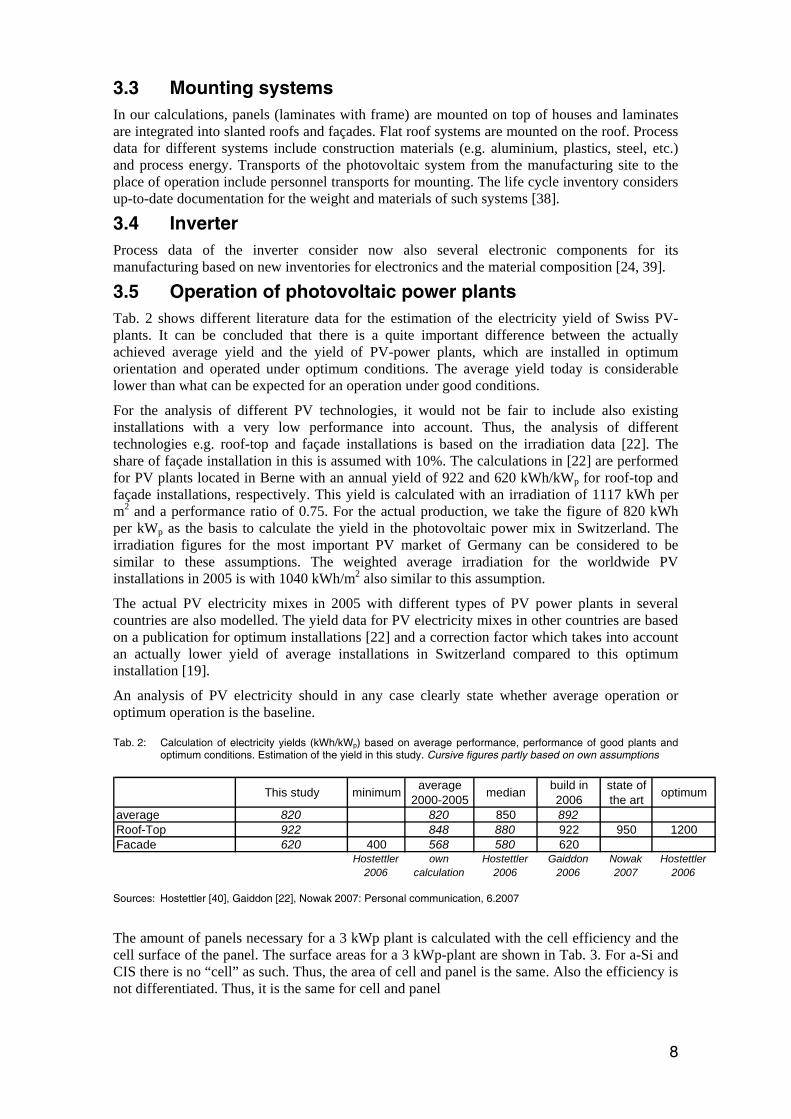
3.5 Operation of photovoltaic power plants Tab. 2 shows different literature data for the estimation of the electricity yield of Swiss PV-plants. It can be concluded that there is a quite important difference between the actually achieved average yield and the yield of PV-power plants, which are installed in optimum orientation and operated under optimum conditions. The average yield today is considerable lower than what can be expected for an operation under good conditions.
For the analysis of different PV technologies, it would not be fair to include also existing installations with a very low performance into account. Thus, the analysis of different technologies e.g. roof-top and façade installations is based on the irradiation data [22]. The share of façade installation in this is assumed with 10%. The calculations in [22] are performed for PV plants located in Berne with an annual yield of 922 and 620 kWh/kWp for roof-top and façade installations, respectively. This yield is calculated with an irradiation of 1117 kWh per m2 and a performance ratio of 0.75. For the actual production, we take the figure of 820 kWh per kWp as the basis to calculate the yield in the photovoltaic power mix in Switzerland. The irradiation figures for the most important PV market of Germany can be considered to be similar to these assumptions. The weighted average irradiation for the worldwide PV installations in 2005 is with 1040 kWh/m2 also similar to this assumption.
The actual PV electricity mixes in 2005 with different types of PV power plants in several countries are also modelled. The yield data for PV electricity mixes in other countries are based on a publication for optimum installations [22] and a correction factor which takes into account an actually lower yield of average installations in Switzerland compared to this optimum installation [19].
An analysis of PV electricity should in any case clearly state whether average operation or optimum operation is the baseline.
Tab. 2: Calculation of electricity yields (kWh/kWp) based on average performance, performance of good plants and optimum conditions. Estimation of the yield in this study. Cursive figures partly based on own assumptions
This study minimum average 2000-2005 median build in
2006state of the art optimum
average 820 820 850 892Roof-Top 922 848 880 922 950 1200Facade 620 400 568 580 620
Hostettler 2006
own calculation
Hostettler 2006
Gaiddon 2006
Nowak 2007
Hostettler 2006
Sources: Hostettler [40], Gaiddon [22], Nowak 2007: Personal communication, 6.2007
The amount of panels necessary for a 3 kWp plant is calculated with the cell efficiency and the cell surface of the panel. The surface areas for a 3 kWp-plant are shown in Tab. 3. For a-Si and CIS there is no “cell” as such. Thus, the area of cell and panel is the same. Also the efficiency is not differentiated. Thus, it is the same for cell and panel
9
Tab. 3 Active panel area of 3 kWp-PV plants with different types of solar cells, cell efficiencies and calculated panel capacity, amount of panels per 3kWp plant
cell typecell
efficiencypanel
efficiencycell area
cellsamount of panels
per 3 kWpactive
surfacepanel
capacity rate% % cm2 unit/m2 m2 m2 Wp/m2
sc-Si 15.3% 14.0% 243 37.6 21.4 19.6 140mc-Si 14.4% 13.2% 243 37.6 22.8 20.8 132ribbon-Si 13.1% 12.0% 243 37.6 25.0 22.9 120a-Si 6.5% 6.5% 10000 1 46.5 46.5 65CIS 10.7% 10.7% 10000 1 28.1 28.1 107CdTe 7.6% 7.1% 9306 1 42.2 39.2 71
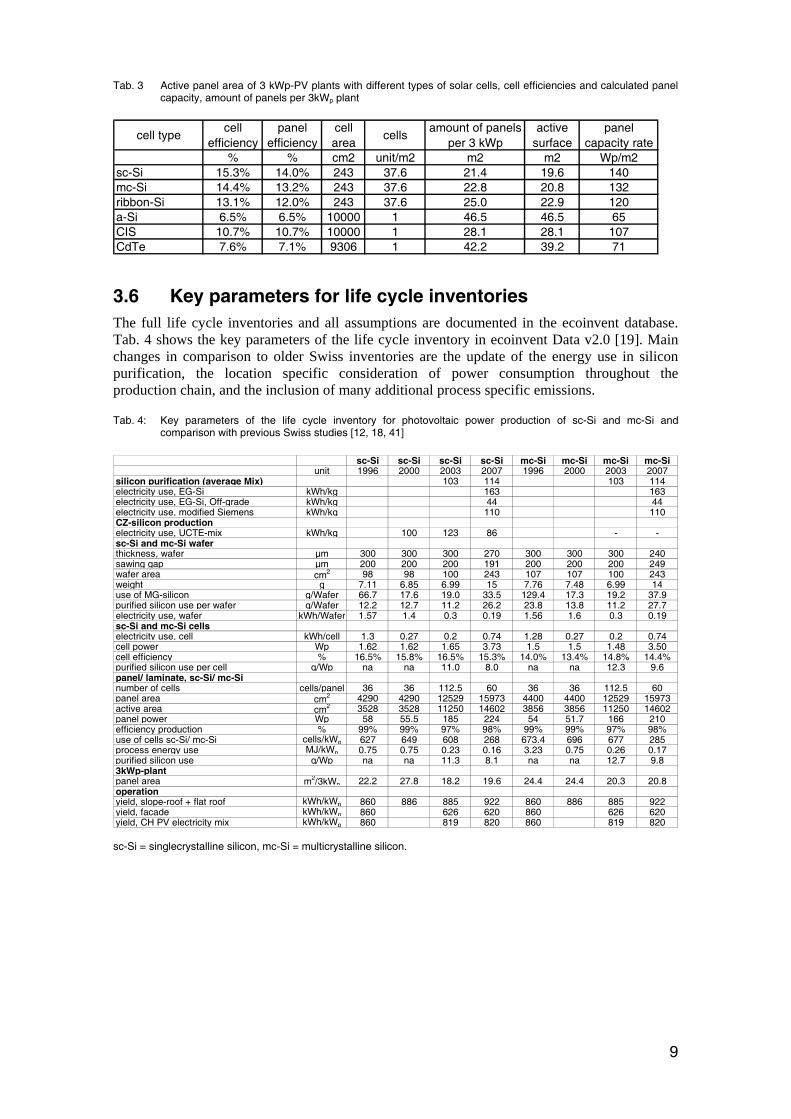
3.6 Key parameters for life cycle inventories The full life cycle inventories and all assumptions are documented in the ecoinvent database. Tab. 4 shows the key parameters of the life cycle inventory in ecoinvent Data v2.0 [19]. Main changes in comparison to older Swiss inventories are the update of the energy use in silicon purification, the location specific consideration of power consumption throughout the production chain, and the inclusion of many additional process specific emissions.
Tab. 4: Key parameters of the life cycle inventory for photovoltaic power production of sc-Si and mc-Si and comparison with previous Swiss studies [12, 18, 41]
sc-Si sc-Si sc-Si sc-Si mc-Si mc-Si mc-Si mc-Siunit 1996 2000 2003 2007 1996 2000 2003 2007
silicon purification (average Mix) 103 114 103 114electricity use, EG-Si kWh/kg 163 163electricity use, EG-Si, Off-grade kWh/kg 44 44electricity use, modified Siemens kWh/kg 110 110CZ-silicon productionelectricity use, UCTE-mix kWh/kg 100 123 86 - -sc-Si and mc-Si waferthickness, wafer µm 300 300 300 270 300 300 300 240sawing gap µm 200 200 200 191 200 200 200 249wafer area cm2 98 98 100 243 107 107 100 243weight g 7.11 6.85 6.99 15 7.76 7.48 6.99 14use of MG-silicon g/Wafer 66.7 17.6 19.0 33.5 129.4 17.3 19.2 37.9purified silicon use per wafer g/Wafer 12.2 12.7 11.2 26.2 23.8 13.8 11.2 27.7electricity use, wafer kWh/Wafer 1.57 1.4 0.3 0.19 1.56 1.6 0.3 0.19sc-Si and mc-Si cellselectricity use, cell kWh/cell 1.3 0.27 0.2 0.74 1.28 0.27 0.2 0.74cell power Wp 1.62 1.62 1.65 3.73 1.5 1.5 1.48 3.50cell efficiency % 16.5% 15.8% 16.5% 15.3% 14.0% 13.4% 14.8% 14.4%purified silicon use per cell g/Wp na na 11.0 8.0 na na 12.3 9.6panel/ laminate, sc-Si/ mc-Sinumber of cells cells/panel 36 36 112.5 60 36 36 112.5 60panel area cm2 4290 4290 12529 15973 4400 4400 12529 15973active area cm2 3528 3528 11250 14602 3856 3856 11250 14602panel power Wp 58 55.5 185 224 54 51.7 166 210efficiency production % 99% 99% 97% 98% 99% 99% 97% 98%use of cells sc-Si/ mc-Si cells/kWp 627 649 608 268 673.4 696 677 285process energy use MJ/kWp 0.75 0.75 0.23 0.16 3.23 0.75 0.26 0.17purified silicon use g/Wp na na 11.3 8.1 na na 12.7 9.83kWp-plantpanel area m2/3kWp 22.2 27.8 18.2 19.6 24.4 24.4 20.3 20.8operationyield, slope-roof + flat roof kWh/kWp 860 886 885 922 860 886 885 922yield, facade kWh/kWp 860 626 620 860 626 620yield, CH PV electricity mix kWh/kWp 860 819 820 860 819 820
sc-Si = singlecrystalline silicon, mc-Si = multicrystalline silicon.

10
4 Results and Discussion 4.1 Selected results for process stages Here we make an evaluation of elementary flows over the life cycle.2 Therefore emissions and resource uses are added up for all stages in the life cycle. Results are presented for one kWh of electricity. Fig. 3 shows the shares of different production stages for some selected elementary flows of a slanted-roof installation with a multicrystalline silicon panel. As an example BOD (Biological Oxygen Demand) is caused in high share due to the finishing of wafer surfaces. The analysis shows that each production stage might be important for certain elementary flows.
Compared to earlier investigations of PV, now the inverter and mounting systems get more importance. For most indicators these so called balance of system (BOS) elements have a share of 30% to 50%. This is due to the improvements, which could be observed for the production chain until the photovoltaic cell and the more detailed investigation of these additional elements, which for example includes now also electronic components of the inverter.
Fig. 3: Share of process stages for a Swiss grid-connected, 3kWp slanted-roof installation with a multicrystalline silicon panel for selected elementary flows of the inventory. CED = Cumulative Energy Demand, see 4.4. for explanation
4.2 Life Cycle Impact Assessment The next step in the LCA is a life cycle impact assessment (LCIA). The elementary flows (emissions and resource consumption) can be described, characterized and aggregated with different methodologies.
4.3 Comparison of different photovoltaic plants The environmental impacts for different systems are analysed and compared in Fig. 4 based on a valuation with the Eco-indicator 99 (H,A) [42]. The highest contribution of environmental impacts in the life cycle is due to the use of fossil energy resources and respiratory effects caused by air emissions of particulates and nitrogen oxides.
2 Elementary flows describe the input of resources (e.g. crude oil) and emissions to nature (e.g.
carbon dioxide). About 1000 different elementary flows are recorded in the ecoinvent data v2.0.

11
Plants using single-crystalline cells have slightly higher impact figures than these with multicrystalline cells. The lowest environmental impacts are investigated for CIS-thin-film cells. The highest impacts are due to CdTe panels, which use relatively higher amounts of copper (including metal compounds for coating and contacts). An interesting aspect is the trade offs between the impacts for the cell manufacturing and the mounting systems. Thin film systems tend to have lower impacts per kWp of cells, but due to lower efficiencies, they have a larger surface area and thus need more materials for the mounting systems. All types of technologies are under further development. Especially for the newer technologies, data are only rarely available and thus the differences are not very relevant compared to the uncertainty of data.
Fig. 4: Comparison of Eco-indicator 99 (H,A) scores for different 3 kWp PV power plants
Fig. 5 shows an evaluation of the cumulative energy demand for different types of
plants. The panel production makes up in most cases more than 50% of the energy use.
But, the less efficient the panels are the more mounting structures are needed. This
outweighs partly the better performance of thin-film panels if the installations are
investigated including balance of system elements.

12
17.714.5 13.9 14.6
18.6 20.017.8
24.6
11.3
11.89.1
11.6
8.67.6
8.0
7.3
-
5
10
15
20
25
30
35
a-Si CdTepanel, DE
CdTelaminate,
US
CdTepanel mix
CIS multi-Si ribbon-Si single-Si
non-
rene
wab
le C
ED G
J-eq
per
kW
p sl
ante
d ro
of w
ith p
anel
s
RestPanel
Fig. 5: Non-renewable cumulative energy demand per kWp of different types of PV power plants on slanted-roofs
4.4 Development of CED results Fig. 6 shows the development of results for the cumulative energy demand (CED) of photovoltaic electricity in this study compared to previous Swiss studies. The CED includes the use of fossil, nuclear and hydro energy resources in the life cycle of the power plant [43]. The figure shows also the increase in installed capacity in Switzerland. This evaluation shows that the cumulative energy demand has been decreased by a factor of 3 or more since the first studies on PV systems made in the early nineties.
Fig. 6: Cumulative energy demand (non-renewable and hydro) of the life cycle inventory for photovoltaic power production in this study (2005) and comparison with previous Swiss studies. Data for 2010 are forecasted in 2003 [12, 18, 19, 41, 44]

13
4.5 Energy pay-back time 4.5.1 Type of PV installations An important yardstick for the assessment of renewable energy systems is the estimation of the energy and/or environmental pay back time. The outcome of such a comparison is influenced by the choice of the reference system on the one hand and the indicator on the other. Here we consider the UCTE electricity mix in year 2004 [45] as the reference system. Fig. 7 shows the energy pay-back-time for the non-renewable cumulative energy demand for PV power plants operated in Switzerland. This time is between 2.5 and 4.9 years for the different types of PV plants. Thus, it is 5 to 10 times shorter than the expected lifetime of the photovoltaic power plants. Different characteristics like type of installation, type of cells, type of panel (mounted) or laminates (integrated) are the key factors for determining the relative differences in results illustrated in this figure.
Fig. 7: Energy pay back timeelectricity mix, red for
of 3 kWp photovoltaic power plants operated in Switzerland in relation to the UCTE slanted roof, yellow for façade, blue for flat roof
4.5.2 Region of operation The energy pay back time is quite dependent on the irradiation at the area were the PV plant is operated. Here we calculate an example of energy pay-back times for different locations in Europe for multicrystalline panels installed on slanted roofs. The calculation is based on the yearly sum of global irradiation on horizontal surface (kWh/m2) in the period 1981-1990 [46] and the non-renewable cumulative energy demand investigated for the 3kWp plant and the average European electricity mix as a reference. Fig. 8 shows the results of this calculation. The evaluation highlights the large differences of electricity yields depending on the region of installation. Pay-back times lower than two years can be achieved in the South of Spain, Italy, Turkey and in Northern Africa. Pay-back times in the North of Europe might be 2 to 3 times higher.
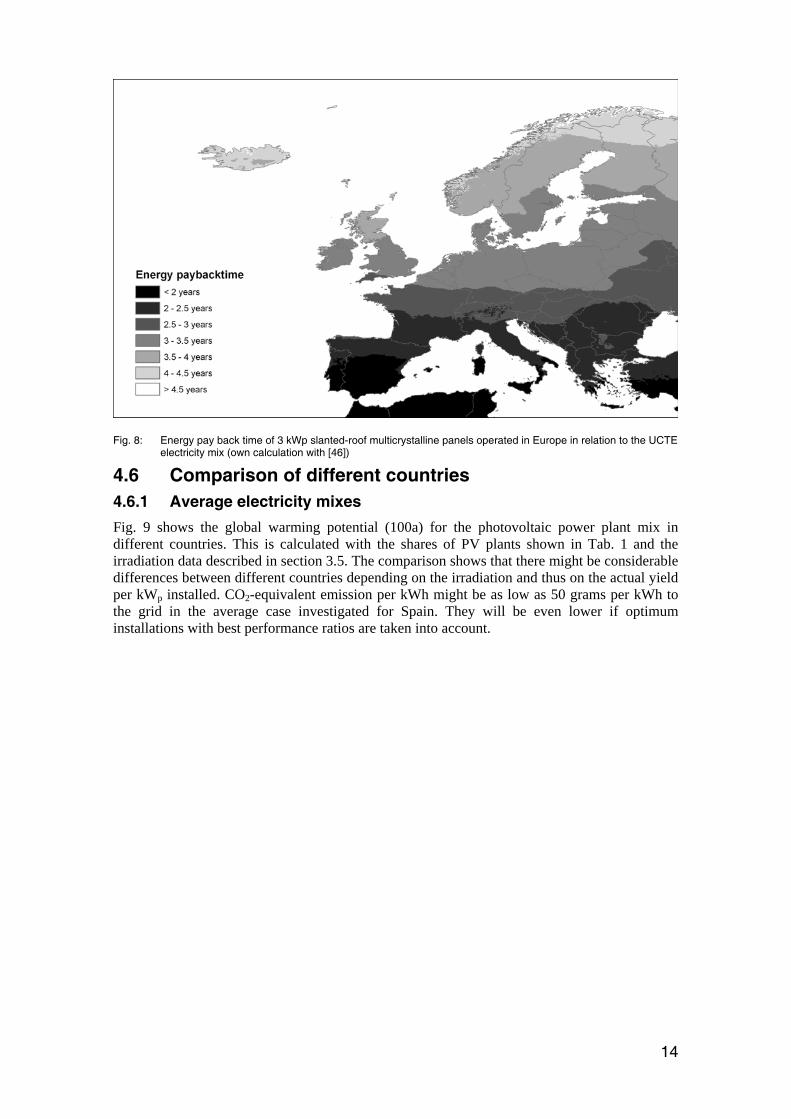
14
Fig. 8: Energy pay back time of 3 kWp slanted-roof multicrystalline panels operated in Europe in relation to the UCTE electricity mix (own calculation with [46])
4.6 Comparison of different countries 4.6.1 Average electricity mixes Fig. 9 shows the global warming potential (100a) for the photovoltaic power plant mix in different countries. This is calculated with the shares of PV plants shown in Tab. 1 and the irradiation data described in section 3.5. The comparison shows that there might be considerable differences between different countries depending on the irradiation and thus on the actual yield per kWp installed. CO2-equivalent emission per kWh might be as low as 50 grams per kWh to the grid in the average case investigated for Spain. They will be even lower if optimum installations with best performance ratios are taken into account.

15
Fig. 9 Global warming potential in kg CO2-eq per kWh for the average photovoltaic electricity mixes in different countries
4.6.2 Potential for CO2 mitigation In order to identify the most promising regions for PV installations it is necessary to consider the irradiation as demonstrated in Fig. 8. A further factor is the actual impacts of the electricity supply replaced by the PV installations. Gaiddon & Jedliczka have used a so-called potential for CO2 mitigation [22]. This is defined as the amount of CO2 emissions, which would be caused if electricity were supplied over the lifetime of the PV plant by the national grid mix minus the amount of CO2 emissions caused by the production of the PV plant. In Fig. 10 we take the national supply mixes including imports and exports of electricity as the reference system [45]. The calculation of electricity yields is based again on European irradiation data [46]. The highest CO2-mitigation potentials can be achieved in countries with high PV electricity yields and high CO2 emissions in the national supply mix. From this perspective Poland, Spain, Italy and Greece are the most promising regions for PV installations.

16
Fig. 10 Potential for CO2 mitigation of multicrystalline slanted-roof PV plants compared to the national electricity supply mixes (t CO2-eq per kWp)
4.6.3 Potential for reduction of nuclear wastes Another important aim of support for PV is the reduction of nuclear wastes. This potential is evaluated in Fig. 11. Here we take the storage capacity for high radioactive nuclear waste, which is avoided over the lifetime of the PV power plant as a yardstick. Now countries with a high share of nuclear power in the supply mix (e.g. France, Switzerland and Bulgaria) are the regions for PV installations with the highest reduction potential.
Fig. 11 Potential for nuclear waste mitigation of multicrystalline slanted-roof PV plants compared to the national electricity supply mixes (cm3 repository for high radioactive waste per kWp). Corsica is connected to the Italian electricity grid trough a high voltage transmission line. Therefore, it is accounted with the same electricity mix as Italy

17
4.7 Comparison with other Energy Systems Fig. 12 shows a comparison of the photovoltaic power mix in Switzerland with other types of power plants. All systems have been modelled in the ecoinvent database. The environmental impacts are evaluated with the greenhouse gas emissions. Greenhouse gas emissions for the average PV mix in Switzerland are about 73 g CO2-eq/kWh. This is lower as for the average supply mixes in Switzerland, Europe and the US. On the other side, this is higher than the figures investigated for other renewable electricity and nuclear energy.
Fig. 12: Comparison of the greenhouse gas emissions by the photovoltaic power mix in Switzerland with other types of power plants
4.8 Comparison with former publications The figures investigated in this study for the energy payback time are somewhat higher than in other recent publications. The following factors can explain the differences.
Fthenakis and Alsema have earlier reported pay-back times of 2.2 and 1 year for multi-Si and CdTe panels, respectively, under an irradiation of 1700 kWh/m2yr, which is the South European average [15]. Corrected to the irradiation level of 1117 kWh/m2/yr in Switzerland this would correspond to 3.3 year for multi-Si and 1.5 year for CdTe.
When we compare the corrected EPBT values from Fthenakis and Alsema for multi-Si (3.3 yr) with our results for "slanted roof, multi-Si, laminated, integrated" systems (2.7 yr) we see that our result is lower. Reasons for this difference are the technology improvements in multi-Si module production since the analysis by Fthenakis and Alsema (e.g. reduced silicon consumption). Further analysis shows that energy requirements for the BOS are considerably higher in our study, for a number of reasons (heavier mounting structures, detailed estimate for inverter electronics).
Furthermore, the share of BOS for the total results in [15] is much lower than in our study and the difference between CdTe and multi-Si panels is only small. CdTe panels have in our study only 60% of the efficiency compared to multi-Si, which result in much higher specific share of
18
mounting structures for the thin-film. In our study the BOS of CdTe amounts to 44% while [15] gives only a share of about 19%.
Comparison of the EPBT values for CdTe technology between Fthenakis and Alsema (1.5 yr), on the one hand, and our results on the other hand (2.7 yr, see Fig. 7) is rather difficult because of differences in the considered module production technology, data sources, module efficiency (9% vs. 7.6%), and background electricity supply (USA vs. UCTE). Tentatively, we could conclude that the energy requirements for the mounting structure specific to the most important markets in Middle Europe, in combination with lower module efficiencies, explains a large part of our higher EPBT result for thin film PVs.
Another publication investigated the cumulative energy demand of CdTe modules from the US to be 1200 MJ/m2 [29], which is quite similar to the 1220 MJ/m2 investigated in our calculation for CdTe laminates produced in the US. The figure for modules produced in Germany is 980 MJ/m2. For the mix, this accounts to 1010 MJ/m2. But, also here a much higher irradiation (1800 kWh/m2/a) has been used and the calculation of the pay-back time as short as 0.75 years does not take into account the BOS necessary for the installation. The efficiency assumed in this study for CdTe (9%, only produced in the US) is considerable higher than the figure of 7.6% used in our study because of the lower efficiency of CdTe panels produced in Germany, which are assumed to be the major product used in Switzerland and Europe.
A relevant difference compared to the cited publications is also the weight of the necessary mounting structures. Based on a large overview with 45 examples and producer information this has been calculated in our survey to be in average 4 kg/m2 (ranging from 1-14 kg/m2) for a slanted-roof construction whereas [24] assumed only about 1.5 kg/m2.
In addition, the environmental impacts of the inverter are more important considering the newest data. The global warming potential per kW of inverter in our calculations is about 72 kg CO2-eq, while [47] calculated only 40 kg CO2-eq per kW. The basic data are the same, but now the electronic components have been investigated in much more detail for the ecoinvent data v2.0 [39].
Besides these main differences there also several smaller differences and changes to the background data used in ecoinvent data v2.0.
5 Conclusion and Outlook The life cycle inventories of photovoltaic power plants performed for the ecoinvent data v2.0 can be assumed to be representative for photovoltaic plants and for the average photovoltaic mix in Switzerland and in other European countries in the year 2005. The analysis of the results shows that it is quite important to take the real market situation into account (raw material supply, electricity, irradiation and performance ratio, etc.).
The study shows the considerable achievements in the last year for reducing the environmental impacts for the production of photovoltaic plants. But, of outermost importance for the environmental impacts are not only the impacts per kWp but also the actual performance of the plants. It seems necessary to install future PV power plants to a larger amount in countries with higher irradiation levels. From this perspective, the present focus on the German market is not optimal.
Differences for the situation in other European countries in comparison to the data modelled for Switzerland are mainly due to different solar irradiation accounted for and the performance ratio. These factors must also be taken into account along with the technology development level for comparisons with other types of electricity generation. Other factors like differences in the shares of imports from different PV producing regions or types of PV cells have not been modelled. It should be considered that the inventory may not be valid for wafers and panels produced outside of Europe or the US, because production technologies and power mix for production processes are generally not the same. The datasets on PV electricity in non-European countries should thus be revised as soon as data are available for production patterns in more producing countries e.g. Japan.
19
For the modelling of a specific power plant or of power plant mixes not addressed in this study it is necessary to consider at least the annual yield (kWh/kWp) and if possible also the actual size of the plant in square metres. Furthermore, it is necessary to clearly define if average, plant-specific or optimum performance ratios are taken into account.
The analysis in this report is focused on the production patterns and operation results in 2005. For the comparison of energy technologies, it is advisable to take into account also future development potentials. Several studies are available for PV technologies, which take into account also possible future improvements in the production chain.
The analysis of the environmental impacts with different LCIA methods shows that it is quite important to include process specific emissions of the production chain. Many, but not all possible emissions are investigated in this study. It is necessary to evaluate all types of environmental impacts with different LCIA methodologies if photovoltaic power plants shall be compared with other energy systems.
Our study shows that also the balance of system components play a more and more important role for the comparison of different types of PV technologies with different efficiencies and thus different sizes of mounting systems for the same electric output. For most indicators these so called balance of system (BOS) elements have a share of 30% to 50%. On the one side, this is due to the improvements, which could be observed for the production chain until the photovoltaic cell. On the other side, now a more detailed investigation of these additional elements is available, which for example includes also electronic components of the inverter. The low efficiency systems need larger amounts of mounting structure and cabling which partly outweighs the better performance per kWp of module alone.
6 Recommendation and Perspective The whole production chain for photovoltaics is subject to rapid changes. An example is the supply situation for the silicon feedstock, which totally changed during the last four years. Since 2005 the capacities for CdTe technology have been increased considerable by the manufacturing plant in the US. Thus, the mix between the US and European production needs to be revised with the next version.
Some emission data in the inventory are based only on single information source, some are from one specific producer only. Thus, they should be verified with data from other production companies and factories to the extent possible. In cases where several information sources were available, they showed partly a large variation. A general problem is that data had to be mixed from different sources with possibly different assumptions and boundaries.
The projected lifetime is a key parameter for the assessment, but operational experience with the new technologies is not yet sufficient to derive reliable conclusions. Many production processes, especially for photovoltaic power, are still under development. Thus, future updates of the LCI should verify key assumptions on energy and material uses as well as emissions, which are important for the LCIA.
The ecoinvent database provides detailed and transparent background data for a range of materials and services used in the production chain of photovoltaics. These data can also be used to assess the environmental impacts for the production of photovoltaic power plants in other countries or to investigate other technologies.
7 Acknowledgement The research work on photovoltaics within the ecoinvent v2.0 project was financed by the Swiss Federal Office of Energy and the European Photovoltaic Industry Association (EPIA). These contributions are highly acknowledged.

20
Thanks go to the colleague Roberto Dones from the Paul Scherrer Institut, Villigen and Rolf Frischknecht from the ecoinvent Centre for the many helpful suggestions during the review of the data v2.0.
Erik Alsema provided us the data from the CrystalClear project and gave some comments on first drafts of this paper. But, besides he send many interesting further information and helped for discussing the appropriate data for different PV technologies. Furthermore he contributed detailed comments to first drafts of the final report. Thank you for this help.
8 References 1. International Organization for Standardization (ISO), Environmental management - Life cycle assessment -
Principles and framework. 2006, ISO 14040:2006; Second Edition 2006-06: Geneva.
2. Palz W & Zibetta H, Energy pay back time of photovoltaic modules. Int. J. Solar Energy, 1991. 10(1991): p. 211-216.
3. Hagedorn G & Hellriegel E, Umweltrelevante Masseneinträge bei der Herstellung von Sonnenzellen, eine vergleichende Analyse konventioneller und ausgewählter neuer Verfahren unter Berücksichtigung der Einsatzstoffe und Prozessketten sowie der Entsorgungs- und Recyclingmöglichkeiten - Endbericht. 1992, München: Forschungsstelle für Energiewirtschaft (FfE).
4. Phylipsen GJM & Alsema EA, Environmental life cycle assessment of multicrystalline silicon solar cell modules. 1995, Report, 95057, Dept. of Science Technology and Society of Utrecht University (STS-UU): The Netherlands. Retrieved from www.chem.uu.nl/nws/www/publica/95057.htm.
5. Frankl P, Life Cycle Assessment of Photovoltaic (PV) Systems. 1998, University of Rome.
6. Alsema EA, Energy pay-back time and CO2 emissions of PV systems. Prog. Photovolt. Res. Appl., 2000. 8(2000): p. 17-25.
7. Knapp KE & Jester TL. Energy balances for photovoltaic modules: status and prospects. in IEEE Photovoltaics specialists conference. 2000. Rohatgi A & Benner J, Anchorage, Alaska. Retrieved from www.ieeepvsc.nrel.gov.
8. Kato K, Energy resource saving and reduction in CO2 emissions as values of PV Technology: A review of life cycle analysis on PV technologies in Japan. 1999.
9. Tsuo YS, Gee JM, Menna P, Strebkov DS, et al. Environmentally benign silicon solar cell manufacturing. in Photovoltaics and the Environment. 1998. Fthenakis V, Moskowitz P, & Zweibel K, Keystone: Brookhaven National Laboratory and the National Renewable Energy Laboratory. Retrieved from www.nrel.gov/ncpv/pdfs/tsuo.pdf.
10. Fthenakis V, Moskowitz P, & Zweibel K, Photovoltaics and the Environment. 1999, Workshop Summary, Brookhaven National Laboratory and the National Renewable Energy Laboratory: Keystone. Retrieved from www.pv.bnl.gov/keystone.htm.
11. Pehnt M, Bubenzer A, & Räuber A, Life-Cycle Assessment of Photovoltaic Systems - Trying to fight Deep-seated Prejudices, in Photovoltaics Guidebook for Decision Makers, Bubenzer A & Luther J, Editors. 2002, Springer: Berlin, DE.
12. Frischknecht R, Bollens U, Bosshart S, Ciot M, et al., Ökoinventare von Energiesystemen: Grundlagen für den ökologischen Vergleich von Energiesystemen und den Einbezug von Energiesystemen in Ökobilanzen für die Schweiz. 1996, Auflage, 3, Gruppe Energie - Stoffe - Umwelt (ESU), Eidgenössische Technische Hochschule Zürich und Sektion Ganzheitliche Systemanalysen, Paul Scherrer Institut, Villigen: Bundesamt für Energie (Hrsg.), Bern, CH. Retrieved from www.energieforschung.ch.
13. Dones R & Frischknecht R, Life-cycle assessment of photovoltaic systems: results of Swiss studies on energy chains. Prog. Photovolt. Res. Appl., 1998. 6(2): p. 117-125. http://www3.interscience.wiley.com/cgi-bin/jhome/5860.
14. Meijer A, Huijbregts MAJ, Schermer JJ, & Reijnders L, Life-cycle Assessment of Photovoltaic Modules: Comparison of mc-Si, InGaP and InGaP/mc-Si Solar Modules. Prog. Photovolt. Res. Appl., 2003. 11(2003): p. 275-287. DOI: 10.1002/pip.489.
15. Fthenakis V & Alsema E, Photovoltaics Energy payback times, Greenhouse Gas Emissions and External Costs: 2004-early 2005 Status. Progress in Photovoltaics: Research and Applications, 2006. 2006(14): p. 275-280.
16. Jungbluth N, Life Cycle Assessment for Crystalline Photovoltaics in the Swiss ecoinvent Database. Prog. Photovolt. Res. Appl., 2005. 2005(13): p. 429-446. http://www3.interscience.wiley.com/cgi-bin/jissue/82003028 or www.esu-services.ch.

21
17. Mohr NJ, Schermer JJ, Huijbregts MAJ, Meijer A, et al., Life Cycle Assessment of Thin-film GaAs and GaInP/GaAs Solar Modules. Prog. Photovolt. Res. Appl., 2007. nd(nd): p. in press. http://www3.interscience.wiley.com/cgi-bin/jissue/82003028.
18. Jungbluth N, Photovoltaik, in Sachbilanzen von Energiesystemen: Grundlagen für den ökologischen Vergleich von Energiesystemen und den Einbezug von Energiesystemen in Ökobilanzen für die Schweiz, Dones R, (Editor). 2003, Final report ecoinvent 2000 No. 6-XII, Paul Scherrer Institut Villigen, Swiss Centre for Life Cycle Inventories: Dübendorf, CH. www.ecoinvent.org.
19. Jungbluth N & Tuchschmid M, Photovoltaics, in Sachbilanzen von Energiesystemen: Grundlagen für den ökologischen Vergleich von Energiesystemen und den Einbezug von Energiesystemen in Ökobilanzen für die Schweiz, Dones R, (Editor). 2007, Paul Scherrer Institut Villigen, Swiss Centre for Life Cycle Inventories: Dübendorf, CH. p. 180. www.ecoinvent.org.
20. ecoinvent Centre, ecoinvent data v2.0, ecoinvent reports No. 1-25. 2007, CD-ROM, Swiss Centre for Life Cycle Inventories: Duebendorf, Switzerland. Retrieved from www.ecoinvent.org.
21. de Wild-Scholten MJ & Alsema EA. Environmental Life Cycle Inventory of Crystalline Silicon Photovoltaic Module Production. in Proceedings of the Materials Research Society Fall 2005 Meeting. 2005. Society MR, Boston, USA. Retrieved from www.mrs.org.
22. Gaiddon B & Jedliczka M, Compared assessment of selected environmental indicators of photovoltaic electricity in OECD cities. 2006, This technical report has been prepared under the supervision of PVPS Task 10, PVPS Task 10, Activity 4.4, Report IEA-PVPS T10-01:2006, The compilation of this report has been supported by the French Agency for Environment and Energy Management, ADEMEIEA: Hespul, Villeurbanne, France.
23. Classen M, Althaus H-J, Blaser S, Doka G, et al., Life Cycle Inventories of Metals. 2007, CD-ROM, ecoinvent report No. 10, v2.0, EMPA Dübendorf, Swiss Centre for Life Cycle Inventories: Dübendorf, CH. Retrieved from www.ecoinvent.org.
24. de Wild-Scholten MJ & Alsema EA, Environmental Life Cycle Inventory of Crystalline Silicon Photovoltaic System Production. 2007, Energy research Center of the Netherlands, Petten, The Netherlands and Copernicus Institute for Sustainable Development and Innovation, Utrecht University, The Netherlands. Retrieved from http://www.ecn.nl/publicaties/default.aspx?au=44649.
25. Aulich HA. PV Industrial Production. in 3rd PV industry forum ath the 21th European Photovoltaic Solar Energy Conference. 2006. EPIA, Dresden, DE. Retrieved from http://www2.dupont.com/Photovoltaics/en_US/news_events/event20060904.html.
26. Rogol M, Silicon and the solar sector. 2005, CLSA Asia Pacific Markets.
27. Krieger T & Roekens-Guibert H. Environmental impacts of Tedlar (R) PVF film for use in photovoltaic modules. in 21th European Photovoltaic Solar Energy Conference. 2006, Dresden, DE. Retrieved from http://www2.dupont.com/Photovoltaics/en_US/news_events/event20060904.html.
28. Sutter J, Life Cycle Inventories of Highly Pure Chemicals. 2007, CD-ROM, ecoinvent report No. 19, v2.0, ETH Zürich, Swiss Centre for Life Cycle Inventories: Dübendorf, CH. Retrieved from www.ecoinvent.org.
29. Fthenakis V & Kim HC. Energy use and greenhouse gas emissions in the life cycle of CdTe photovoltaics. in Materials Research Society Fall Meeting. 2006. Material Research Society, Boston: Mater. Res. Soc. Symp. Proc. Vol 895, 0895-G03-06.1.
30. Fthenakis V, Life cycle impact analysis of cadmium in CdTe PV production. Renewable & sustainable energy reviews, 2004. 2004(8): p. 303-334.
31. Bohland JR & Smigielski K, First Solar's CdTe Module Manufacturing Experience; Environmental, Health And Safety Results. 2000.
32. Raugei M, Advances in Life cycle assessment: Method integration and geographic allocation of environmental impact. 2005, Università degli Studie di Siena, IT.
33. Raugei M, Bargigli S, & Ulgiati S, Life cycle assessment and energy pay-back time of advanced photovoltaic modules: CdTe and CIS compared to poly-Si. Energy, 2006. in press.
34. Steinberger H, Lebenszyklusanalyse von Dünnschichtsolarmodulen auf der Basis der Verbindungshalbleiter Cadmiumtellurid und Kupferindiumdieselenid. 1997, TU München.
35. Ampenberger A, Hellriegel E, & Köhler D, Massen- und Energiebilanzen für die Herstellung von CIS-Dünnschichtsolarmodulen. 1998, Teilprojekt im Rahmen des Bayerischen Forschungsverbundes Solarenergie (FORSOL), Forschungsstelle für Energiewirtschaft (FfE): München, Germany. p. 63. Retrieved from http://www.ffe.de/details/reg_e/forsol/forsol.htm.
36. Pacca S, Sivaraman D, & Keoleian GA, Life Cycle Assessment of the 33 kW Photovoltaic System on the Dana Building at the University of Michigan: Thin Film Laminates, Multi-crystalline Modules, and Balance of System Components. 2006, University of Michigan. Retrieved from http://css.snre.umich.edu.
37. Keoleian GA & Lewis GM, Application of Life Cycle Energy Analysis to Photovoltaic Module Design. Prog. Photovolt. Res. Appl., 1997. 5(1997): p. 287-300. www.epa.gov/ORD/WebPubs/projsum/.

22
38. Siemer J, Konkurenz belebt das Geschäft, in Photon. 2007. www.photon.de.
39. Hischier R, Classen M, Lehmann M, & Scharnhorst W, Life Cycle Inventories of Electric and Electronic Equipment - Production, Use & Disposal. 2007, CD-ROM, ecoinvent report No. 18, v2.0, EMPA St. Gallen, Swiss Centre for Life Cycle Inventories: Dübendorf, CH. Retrieved from www.ecoinvent.org.
40. Hostettler T, Solarstromstatistik 2005 mit Sonderfaktoren. Bulletin SEV/AES, 2006. 10(2006).
41. Jungbluth N & Frischknecht R, Literaturstudie Ökobilanz Photovoltaikstrom und Update der Ökobilanz für das Jahr 2000. 2000, Programm Aktive Sonnenenergienutzung: Photovoltaik Bericht Nr. 39489, ESU-services for Bundesamt für Energie: Uster. p. 43. Retrieved from www.esu-services.ch.
42. Goedkoop M & Spriensma R, The Eco-indicator 99: A damage oriented method for life cycle impact assessment. 2000, Methodology Report, 2nd revised ed., PRé Consultants: Amersfoort, The Netherlands. Retrieved from www.pre.nl/eco-indicator99/.
43. Frischknecht R, Jungbluth N, Althaus H-J, Bauer C, et al., Implementation of Life Cycle Impact Assessment Methods. 2007, CD-ROM, ecoinvent report No. 3, v2.0, Swiss Centre for Life Cycle Inventories: Dübendorf, CH. Retrieved from www.ecoinvent.org.
44. Frischknecht R, Hofstetter P, Knoepfel I, Dones R, et al., Ökoinventare für Energiesysteme. Grundlagen für den ökologischen Vergleich von Energiesystemen und den Einbezug von Energiesystemen in Ökobilanzen für die Schweiz. 1994, Auflage, 1, Gruppe Energie - Stoffe - Umwelt (ESU), Eidgenössische Technische Hochschule Zürich und Sektion Ganzheitliche Systemanalysen, Paul Scherrer Institut Villigen: Bundesamt für Energie (Hrsg.), Bern.
45. Frischknecht R, Tuchschmid M, Faist Emmenegger M, Bauer C, et al., Strommix und Stromnetz, in Sachbilanzen von Energiesystemen: Grundlagen für den ökologischen Vergleich von Energiesystemen und den Einbezug von Energiesystemen in Ökobilanzen für die Schweiz, Dones R, (Editor). 2007, Paul Scherrer Institut Villigen, Swiss Centre for Life Cycle Inventories: Dübendorf, CH. www.ecoinvent.org.
46. Šúri M, Huld TA, Dunlop ED, & Ossenbrink HA, Potential of solar electricity generation in the European Union member states and candidate countries. Solar Energy Materials, 2007. 81: p. 1295–1305. http://re.jrc.ec.europa.eu/pvgis/.
47. de Wild-Scholten MJ, Alsema EA, ter Horst EW, Bächler M, et al. A cost and environmental impact comparision of grid-connected rooftop and ground based PV systems. in 21th European Photovoltaic Solar Energy Conference. 2006, Dresden, DE.