Life Cycle Assessment (LCA) of various solar heat technologies
71
Life Cycle Assessment (LCA) of various solar heat technologies Focus on Heliostat construction and maintenance Francois Winterbach 15335348 Final year project presented in partial fulfilment of the requirements for the degree of Bachelors of Industrial Engineering at Stellenbosch University. Study leader: Mr. Dirkse van Schalkwyk December 2011
Transcript of Life Cycle Assessment (LCA) of various solar heat technologies

Life Cycle Assessment (LCA) of various solar heat technologies
Focus on Heliostat construction and maintenance
Francois Winterbach
15335348
Final year project presented in partial fulfilment of the requirements for the degree of Bachelors of Industrial Engineering at Stellenbosch University.
Study leader: Mr. Dirkse van Schalkwyk
December 2011

ii
Acknowledgements
I would like to express my sincere gratitude to the following people who have contributed
to make this work possible:
• Mr Dirkse van Schalkwyk, for his study guidance, patient and always having an
open door and a ready ear.
• Mr Paul Gauche, for his provision of information that made this study possible.
• Mr Willem Landman, for his advice and provision of information.
• Inke Rupping, for the training she provided in the use of the GaBi Education
software.
• Other staff at the Department of Industrial Engineering who were always willing to
answer questions and assist.
After studying environmental impacts, I realised how precious our earth is. Therefore this
work is dedicated to God, for creating a paradise for us to live in and care for.

iii
Declaration
I, the undersigned, hereby declare that the work contained in this final year project is my
own original work and that I have not previously in its entirety or in part submitted it at
any university for a degree.
Sign on the dotted line:
……………………….. ………………………
Datum
Date

iv
ECSA Exit Level Outcomes References
The following table include references to sections in this report where ECSA exit level
outcomes are addressed.
Exit level outcome Section(s) Page(s)
1. Problem solving 5 6.2
22 – 37 39 - 41
5. Engineering methods, skills & tools, incl. IT
6.2 7.1 7.3 7.4
39 – 41 43 – 46 50 - 51 51 – 53
6. Professional & Technical communication This report All pages
9. Independent learning ability 2 3 7.2
3 – 12 13 – 16 46 – 50
10. Engineering professionalism This report All pages

v
Abstract
Energy is an essential part of the world today. It is difficult to imagine a world without it.
Modern day households rely on it for daily activities and preservation of food. Industries
rely on it for manufacturing and processing. The business world relies on it for ease of
transactions and transfers. Media depends on it for the gathering and distribution of
information. Night life will be much more difficult without advantage of lights.
The major concern is that the means by which most of the energy is produced causes
harm to humans and the environment, including the fauna and flora. Coal fire is the most
prominent way of producing energy, but since it creates the most harm to the
environment, alternatives ways of energy production must be looked at. Other non-
renewable energy sources include oil, natural gas and nuclear energy. All of these have
the potential to be very harmful to the environment. That is why renewable sources of
energy should be considered. Such sources include wind energy, hydro-energy, solar
energy and geothermal energy.
Solar power towers are a solar thermal alternative for energy production. It uses solar
radiation as fuel for the energy generation process. The physical components of this
technology are the heliostat field, the power tower and various machines used in the
power generation cycles. The function of the heliostat field is to intercept, redirect and
concentrate direct solar radiation to a receiver which sits at the top of a power tower.
In this project the heliostats that are necessary to fuel a 100 MW power tower is
analysed to determine the environmental impact throughout their life time. This is a
cradle to grave assessment, which means that the entire life cycle is considered from the
acquiring of raw materials to the disposal of the functional unit.
Software was used to do the life cycle assessment of the heliostat field. From the result
obtained it could be seen which emissions are produced during which processes and the
magnitude of the effect that they have on different environmental categories.

vi
Opsomming
Energie is ʼn belangrike deel van die wêreld vandag. Dit is moeilik om aan ʼn wêreld
daarsonder te dink. Moderne huishoudings maak staat op energie vir daaglikse
aktiwiteite en om kos te preserveer. Nywerhede maak staat daarop vir vervaarding en
prosessering. Die besigheidswêreld maak staat daarop vir die gemak van transaksies en
oordragte. Media is afhanklik daarvan vir die versameling en verspreiding van
informasie. Naglewe sou moeiliker gewees het sonder die voorreg van ligte.
Die grootste bekommernis is dat die manier waarop meeste energie produseer word
skadelik vir die mens en die natuur is, insluitend die fauna en flora. Steenkool is die
mees prominente manier van energie produsering, maar aangesien dit die meeste skade
aan die omgewing aanrig, moet daar gekyk word na alternatiewe maniere van energie
produsering. Ander nie-volhoubare energie bronne sluit in olie, natuurlike gas en
kernenergie. Al hierdie het die potensiaal om baie skadelik vir die omgewing te wees. Dit
is waarom hernubare bronne van energie oorweeg moet word. Sulke bronne sluit in wind
energie, hidro-energie, son energie en geotermiese energie.
Sonkrag torings is ʼn son hitte alternatief vir energie produsering. Dit gebruik radiasie van
die son as brandstof vir energie opwekking. Die fisiese komponente van hierdie
tegnologie is die heliostat veld, die kragtoring en ʼn verskeidenheid ander masjinerie wat
benodig word vir die kragopwekking siklusse. Die funksie van die heliostat veld is om
direkte radiasie van die son te onderskep, weerkaats en dan te konsentreer na ʼn
ontvanger wat bo-op ʼn kragtoring sit.
In die projek word die heliostats wat benodig word vir die aandrywing van ʼn 100 MW
kragtoring geanaliseer om die impak op te omgewing te bereken gedurende hulle
leeftyd. Hierdie is ʼn wieg tot die graf assessering, wat beteken dat die hele lewensiklus
in ag geneem word vanaf die verkryging van grondstowwe tot die wegdoening van die
funksionele eenheid.
Sagteware was gebruik om die lewenssiklus assessering van die heliostat veld te doen.
Vanaf die verkrygde resultate kan gesien word watse uitlaatgasse produseer word
gedurende watter prosesse en die grootte van die impak wat dit op verskillende
omgewings kategorieë het.

Table of Contents vii
Table of Contents
Acknowledgements .................................. .......................................................... ii
Declaration ....................................... .................................................................. iii
ECSA Exit Level Outcomes References ............... ........................................... iv
Abstract .......................................... ..................................................................... v
Opsomming ......................................... ............................................................... vi
List of Figures ................................... .................................................................. x
List of Tables .................................... .................................................................. xi
Glossary .......................................... .................................................................. xii
List of Abbreviations ............................. .......................................................... xiii
1. Introduction ...................................... ............................................................ 1
1.1 Problem Statement ........................................................................................... 1
1.2 Research Approach .......................................................................................... 1
2. Solar Thermal Energy .............................. .................................................... 3
2.1 Different Technologies ...................................................................................... 3
2.2 Solar Power Towers .......................................................................................... 5
2.3 Heliostats .......................................................................................................... 9
2.3.1 Heliostat Types .................................................................................................... 9
3. Life Cycle Assessment ............................. ................................................. 13
3.1 Life Cycle Assessment .................................................................................... 13
3.2 History of Life Cycle Assessment .................................................................... 13
3.3 The Life Cycle Assessment Methodology ........................................................ 14

Table of Contents viii
4. Goal and Scope .................................... ...................................................... 17
4.1 Goal of the Study ............................................................................................ 17
4.2 Objectives ....................................................................................................... 17
4.3 Studied Product............................................................................................... 17
4.4 Functional Unit ................................................................................................ 19
4.5 System Boundaries ......................................................................................... 19
4.6 Quality of Data ................................................................................................ 21
4.7 Limitations ....................................................................................................... 21
5. Life Cycle Inventory Analysis ..................... ............................................... 22
5.1 Components .................................................................................................... 23
5.2 Material Specifications .................................................................................... 24
5.3 Manufacturing Processes ................................................................................ 25
5.4 Assembly and Construction ............................................................................. 29
5.4.1 Assembly ........................................................................................................... 29
5.4.2 Construction ....................................................................................................... 30
5.5 Operation ........................................................................................................ 31
5.6 Maintenance ................................................................................................... 32
5.6.1 General maintenance ......................................................................................... 32
5.6.2 Mirror Washing ................................................................................................... 33
5.7 Disposal .......................................................................................................... 35
5.8 Socioeconomic Impact .................................................................................... 36
6. Methodology ....................................... ........................................................ 38
6.1 GaBi Software ................................................................................................. 38
6.2 Project, Plans, Processes and Flows in GaBi .................................................. 39
6.2.1 Heliostat Project ................................................................................................. 39
6.3 Assumptions that can be made when working with GaBi ................................. 42

Table of Contents ix
7. Life Cycle Impact Assessment ...................... ............................................ 43
7.1 Results ............................................................................................................ 43
7.2 Impact Categories ........................................................................................... 46
7.2.1 Global Warming Potential (GWP) ....................................................................... 46
7.2.2 Acidification Potential (AP) ................................................................................. 48
7.2.3 Eutrophication Potential (EP) .............................................................................. 49
7.3 Classification of Emissions .............................................................................. 50
7.4 Characterization .............................................................................................. 51
8. Conclusion ........................................ .......................................................... 54
References......................................... ................................................................ 55

List of tables x
List of Figures
FIGURE 1: SCHEMATIC OF A PARABOLIC DISH COLLECTOR.................................................... 3
FIGURE 2: VIEW OF THE PSA DISS SOLAR FIELD IN OPERATION ........................................... 4
FIGURE 3: PS10 SCHEMATIC, SANLUCAR LA MAYOR, SPAIN, 2007 ....................................... 6
FIGURE 4: TYPICAL SURROUND FIELD CONFIGURATION ........................................................ 7
FIGURE 5: TYPICAL NORTH FIELD CONFIGURATION .............................................................. 7
FIGURE 6: COLLECTOR FIELD OPTICAL LOSS PROCESSES .................................................... 7
FIGURE 7: CONTOURS OF NORTH AND SURROUND HELIOSTAT FIELD CONFIGURATIONS .......... 8
FIGURE 8: SAIC HELIOSTAT ON TEST AT THE NRE LABORATORY IN GOLDEN, CO, USA. ..... 10
FIGURE 9: SUPPORT STRUCTURE OF A GLASS/METAL HELIOSTAT (COLON 70). .................... 11
FIGURE 10: LIFE CYCLE ASSESSMENT FRAMEWORK, THE STAGES ....................................... 16
FIGURE 11: THE ATS FOURTH-GENERATION PROTOTYPE HELIOSTAT. ................................. 18
FIGURE 12: SYSTEM BOUNDARIES ................................................................................... 20
FIGURE 13: DATA COLLECTION AND CALCULATION PROCESS ............................................ 22
FIGURE 14: FLOAT GLASS MANUFACTURING PROCESS ....................................................... 26
FIGURE 15: THE STEPS IN THE PRODUCTION SEQUENCE IN SAND CASTING .......................... 28
FIGURE 16: THE CROSS-SECTION VIEW OF THE TYPICAL SAND CASTING MOULD ................... 28
FIGURE 17: PHOTOGRAPH OF THE HELIOSTAT WASH TRUCK AT SOLAR ONE ...................... 34
FIGURE 18: HELIOSTAT'S COMPONENT FLOW ................................................................... 40
FIGURE 19: PLAN FOR WASHING OF THE HELIOSTATS ....................................................... 41
FIGURE 20: PLAN FOR OPERATION OF THE HELIOSTATS .................................................... 41
FIGURE 21: THE GREENHOUSE EFFECT ........................................................................... 47
FIGURE 22: ACIDIFICATION POTENTIAL ............................................................................. 48
FIGURE 23: EUTROPHICATION POTENTIAL ........................................................................ 49

List of tables xi
List of Tables
TABLE 1: BILL OF MATERIAL FOR THE MIRROR MODULES ................................................... 23
TABLE 2: BILL OF MATERIAL FOR REST OF THE HELIOSTAT ................................................. 24
TABLE 3: PROCESSES FOR STEEL IN MANUFACTURING ....................................................... 29
TABLE 4: FOUNDATION SPECIFICATION ............................................................................. 30
TABLE 5: POWER UTILIZATION OF THE ATS H150 HELIOSTATS .......................................... 31
TABLE 6: COMPARISON OF ESTIMATED OPERATION & MAINTENANCE STAFFING .................. 37
TABLE 7: ORGANIC AND INORGANIC EMISSIONS FOR THE ENTIRE LIFE CYCLE ..................... 44
TABLE 8: COMPARISON OF DIFFERENT POWER PLANT TECHNOLOGIES .............................. 45
TABLE 9: CLASSIFICATION OF THE DIFFERENT EMISSIONS ................................................. 51
TABLE 10: CHARACTERIZATION OF THE EMISSIONS FOR GWP ........................................... 51
TABLE 11: CHARACTERIZATION OF THE EMISSIONS FOR AP ............................................... 52
TABLE 12: CHARACTERIZATION OF THE EMISSIONS FOR EP ............................................... 53

Glossary xii
Glossary
Aperture Area Area of a collector through which the solar radiation enters
Capacity Factor Ration of solar operating hours per year to total hours per year.
Characterization Factor Factor used to convert the results of the LCI into a reference
unit.
GaBi Life Cycle Assessment software used to determine the impact of
a process or product on the environment.
Lehr A temperature-controlled kiln for annealing objects made of
glass.
Life Cycle Assessment The investigation and evaluation of the environmental impacts
of a given process or product caused by its existence.

List of Abbreviations xiii
List of Abbreviations
AP
ATS
CML
c
EP
GWh
GWP
LCA
LCI
LCIA
MWh
SPT
STE
Acidification Potential
Advanced Thermal Systems
Centre of Environmental Science, University of Leiden, the
Netherlands
Eutrophication Potential
Gigawatt-hours
Global Warming Potential
Life Cycle Assessment
Life Cycle Inventory Analysis
Life Cycle Impact Assessment
Megawatt-hours
Solar Power Tower
Solar Thermal Energy

Chapter 1 Introduction Industrial Engineering
Page 1
University of Stellenbosch Department of Industrial Engineering
1. Introduction
This final year project forms part of a research area of Industrial Engineering applied in
the field of renewable energies, in particular solar thermal energy (STE). Solar thermal
power will be discussed in this report but the focus will be on the heliostats which form
part of the solar power tower technology. The life cycle of a heliostat field, also known as
a collector field, will be analyzed to determine the environmental impact caused by the
existence of the heliostats that will provide solar thermal energy to a 100 MW electrical
power plant. GaBi is the software that is used for the modelling of the heliostats’ life
cycle. This chapter provides a brief description of the problem followed by a short
discussion of how the problem will be approached.
1.1 Problem Statement
With the current technology available, concentrated solar thermal energy is seen as a
viable solution for renewable and clean energy. Although this is seen as clean energy,
there is little information available about the effects that solar power tower plants may
have on the environment. The environmental effects of the manufacturing, construction,
operation and maintenance of the system and its components need to be considered
before this renewable energy technology can be claimed as environmental friendly. The
entire life cycle, from cradle to grave, of the system must be considered to obtain reliable
results that give a true reflection of the environmental impacts.
This report, however, will only focus on one of the components of the solar power tower,
namely the collector field, which consists out of heliostats. Other components of the
system such as the storing of energy, generation of electricity, and processes such as
the Brayton and Rankine cycle will not be discussed in this report.
1.2 Research Approach
The research starts with a literature study. The first part of literature study gives a broad
overview of solar thermal energy by mentioning different technologies. The focus will
narrow down to solar power tower technologies in general. However, the main focus will
then be on one of the components of solar tower power, specifically the heliostats. The
different types of heliostats along with their function are described in detail.

Chapter 1 Introduction Industrial Engineering
Page 2
University of Stellenbosch Department of Industrial Engineering
The second part of the literature study explains the concept of life cycle assessment
(LCA). This consists out of a general description, history and methodology. This then
concludes the literature study.
The actual LCA, of the product studied in this report, follows directly after the literature
study. This part of the report strictly follows the guidelines that are specified in ISO
14040: Environmental Management – Life Cycle Assessment – Principles and
Frameworks. This is where the acquiring of information and assessment of the results
are important.
Information will be acquired from previous and present studies that focus on STE,
heliostats and LCAs. It is important to have accurate and consistent information to
ensure a reliable result. Assumptions are made where there is a lack of information or
proprietary issues. These assumptions are stated and justified where necessary.
The results obtained are summarized, interpreted and compared with other sources of
electricity. Finally the study is concluded to summarise the outcome of the knowledge
gained throughout the study.

Chapter 2 Solar Thermal Energy Industrial Engineering
Page 3
University of Stellenbosch Department of Industrial Engineering
2. Solar Thermal Energy
Due to more environmental concerns and more environmental restrictions, renewable
energies are developing fast these days. One of the main sources of renewable energy
is solar thermal energy (STE). Different technologies are available to harvest this energy.
These technologies will be briefly discussed. This is followed by narrowing the focus to
solar power tower technologies. Finally this chapter will end with a discussion on
heliostats, which will look at different types of designs.
2.1 Different Technologies
Solar thermal technologies can be divided roughly into two groups namely mirror based
systems and moving air based systems. The former can be subdivided into (1) dish
systems, (2) trough systems and (3) tower systems. Moving air based systems can be
subdivided into ascending (up-draught) and descending (down draught) systems. Both of
these air based systems fall outside the scope of this report in will not be discussed
further. (Groenendaal 2007)
Solar dishes, the first type of mirror based systems, track the sun with a dual axis while
focusing its rays on a receiver that is located at the focal point in the front of the
parabolic dish. The radiant solar energy is absorbed by the receiver which converts it to
thermal energy in a circulating fluid. The thermal energy can then be used to operate a
generator that is coupled directly to the receiver or it can be transported through pipes to
a central power conversion system. Figure 1 represents a schematic example of a
parabolic dish reflector. (Kalogirou 2004)
Figure 1: Schematic of a parabolic dish collector
Source: Kalogirou 2004

Chapter 2 Solar Thermal Energy Industrial Engineering
Page 4
University of Stellenbosch Department of Industrial Engineering
Solar trough systems, the second type of mirror based systems, consists of a large
number of single axis tracking parabolic trough solar collectors made by bending a sheet
of reflective material into a parabolic shape. The solar field is modular in nature and is
composed of many of these tracking parabolic trough solar collectors. The collectors
reflect the solar radiation from the sun directly on a linear receiver located at the focus of
the parabola. A heat transfer fluid flows in the linear receiver which absorbs the solar
radiation and converts it into thermal energy. The heated fluid returns to a series of heat
exchangers in the power block. The heated fluid is then used to generate high pressure
superheated steam which is fed to a generator to produce electricity. Figure 2, shown
below, is an example of a parabolic trough collector from the PSA (Plataforma Solar de
Almeria) DISS (DIrect Solar Steam) test facility located in Spain. (Groenendaal 2007)
Figure 2: View of the PSA DISS solar field in opera tion
Source: Zarza et al. 2001
Power towers, the third type of mirror based systems, will be explained in the following
section in detail to ensure that the reader understand exactly how the heliostat fit into the
concept of solar thermal energy and why it is necessary to do a assessment on the
environmental impacts caused by its existence.

Chapter 2 Solar Thermal Energy Industrial Engineering
Page 5
University of Stellenbosch Department of Industrial Engineering
2.2 Solar Power Towers
Solar power tower plants, also known as heliostat power plants, use technology for
harnessing solar energy and converting it into solar heat. Moveable mirrors, called
heliostats, focus concentrated sunlight on a receiver which sits on top of a power tower.
This enormous amount of concentrated energy is used for heating water, molten nitrate
salt, liquid sodium, helium or air. Systems that use a transport fluid other than water
generally require a steam generator in the loop ahead of the generator. The steam
produced is then fed through a turbine generator to produce electricity. Air and helium
systems are associated with a Brayton cycle turbine. Molten nitrate salt, liquid sodium
and water systems are associated with a Rankine cycle turbine. In addition to the turbine
and steam generator, other major subsystems include thermal storage and the collector
field. (Mavis 1989)
Solar thermal’s edge over other renewable energies lies in its storage capacity. Storage
ensures that the power output from the turbine generator remains constant through
fluctuations in solar intensity until all the stored energy is depleted. Solar thermal energy
can be stored in the form of hot nitrate salt or hot sodium which is heated with solar
radiation. In the case of a water system the thermal energy can be stored as oil, or other
suitable material, which is heated by a steam generator (Falcone 1986). When the plant
needs to generate power, the stored fluid is pumped through a steam generating system
which produces superheated steam for a conventional Rankine cycle generator system.
This basically means that the steam moves through a generator to generate electricity.
This method makes the solar tower effective even during nighttimes. Rocks and sand
can even be used to store heat from solar produced steam by using oil, air, or any other
suitable substance, as the heat transfer fluid.
Solar One, located in the USA, is an example of a plant that uses oil and rocks as a
storage medium. A solar tower, located in the California Mojave desert, with energy
storage can be designed for an annual capacity of about 65%, which mean that they
could potentially operate for 65% of the year without the need for a backup fuel source.
Without a storage facility solar tower technologies are limited to an annual capacity
factor near 25% (Groenendaal 2007). The capacity factor is defined as the ratio of solar
operating hours per year to total hours per year (Müller-Steinhagen 2004).

Chapter 2 Solar Thermal Energy Industrial Engineering
Page 6
University of Stellenbosch Department of Industrial Engineering
Figure 3: PS10 schematic, Sanlucar la Mayor, Spain, 2007
Source: Osuna et al. 2000
The collector field is has the basic function of intercepting, redirecting and concentrating
direct solar radiation to a receiver which sits at the top of a power tower. The field consist
of a field of tracking mirrors, called heliostats. A tracking control system ensures that the
heliostats maintain continuous focus of the direct solar radiation on the central receiver
while energy is being collected.
There are two general field configurations that have been developed, a surround field
configuration and a south field configuration (or for plants located in the northern
hemisphere, a north field configuration). In the former all heliostats are arranged around
a tower usually located to the north of the centre (in the southern hemisphere) to
optimize field efficiency. In a south field configuration all heliostats are arranged on the
south side of the tower. Selections between the two types of configurations are a
function of the receiver configuration, which will not be discussed in this report. (Falcone
1986)

Chapter 2 Solar Thermal Energy Industrial Engineering
Page 7
University of Stellenbosch Department of Industrial Engineering
Figure 4: Typical surround field
configuration
Figure 5: Typical north field
configuration
Source: Falcone, 1986 Source: Falcone, 1986
The layout of the field is important to increase the performance, defined in terms of the
optical efficiency. Several losses occur that decrease the optical performance. These
include the cosine effect, shadowing, blocking, mirror reflectivity, atmospheric
transmission and receiver spillage. Below is a visual presentation of these losses.
(Falcone 1986)
Figure 6: Collector field optical loss processes
Source: Falcone, 1986

Chapter 2 Solar Thermal Energy Industrial Engineering
Page 8
University of Stellenbosch Department of Industrial Engineering
Optimization of the shape of the previously mentioned configurations also affects the
performance of the field. Heliostats located too far from the tower greatly suffer from
atmospheric losses because of the long path that the reflected beams travel to the
receiver. The blocking loss is greatest at the inner boundary of the field because of the
density of heliostats. The density decreases with radial distance from the tower. Mirror
density as a ratio of mirror area to land area is typically 0.20 to 0.25. Figure 7 is a
graphical recommendation of the general shapes of a typical field. These field shapes
remains relative constant over a wide range of power levels. (Falcone 1986)
Figure 7: Contours of north and surround heliostat field configurations
Source: Falcone, 1986
The collector field represent the largest land area and capital investment of the power
plant. A heliostat field can consists of thousands of heliostats. This is why it is important
to assess the life cycle of these heliostats to determine where improvements is possible
and to calculate the environmental effect throughout their life time. (Meier, Gremaud &
Steinfeld 2005)

Chapter 2 Solar Thermal Energy Industrial Engineering
Page 9
University of Stellenbosch Department of Industrial Engineering
2.3 Heliostats
The heliostat is the main component of the collector field. Its main function is
intercepting, redirecting and concentrating direct solar radiation to a receiver which sits
at the top of a power tower. A dictionary definition of a heliostat is “a mirror mounted on
an axis moved by clockwork, by which a sunbeam is steadily reflected to one spot”
(Falcone 1986). The major components of a heliostat are (1) the reflector, (2) reflector
support structure, (3) drive systems, (4) pedestal and foundation and (5) the heliostat
control (Mavis 1989). The specifications of these components depend on the type of
heliostat, which will be described in the following section.
2.3.1 Heliostat Types
There is no single design or set of specifications for a heliostat because of the various
types. Heliostats can be divided into three main types depending on the type of mirror
and/or structural arrangement. These types of heliostats are (1) glass/metal, (2) stressed
membrane and (3) heliostats enclosed by a bubble. The latter is subjected to nearly no
wind loads, since it’s enclosed in a bubble, thus can have a lighter support structure.
Although this is an advantage over the other types of heliostats, this type is not really
popular because the solar energy must past through the bubble material twice, and in so
doing can be absorbed and scattered by the bubble material or by dirt on the bubble
material. Because of the lack of popularity, heliostats that are enclosed in bubbles will
not be discussed further in this report. The following part of this section will discuss
glass/metal and stretched membrane heliostats, while considering their differences as
well as their similarities. (Falcone 1986)
The reflector of the heliostat is important to ensure high optical performance. The
reflector, or mirror module, of a glass/metal heliostat will be discussed first. The modules
are usually rectangular and they are ranging in sizes from 0.6 x 3 m to 1.2 x 6.1 m.
Multiple mirror modules are used to make up a single heliostats reflective area (Mavis
1989). These modules consist of a silvered glass mirror and some support structure.
Usually these are constructed of flat float glass in a sandwich design, silvered glass,
backed by float glass for support. Low iron, high transmission glass, is a popular choice
for solar applications because it provides a less “greenish” tint due to the relative low iron
content. Low iron glass has very similar properties and composition as common soda-

Chapter 2 Solar Thermal Energy Industrial Engineering
Page 10
University of Stellenbosch Department of Industrial Engineering
lime glass, also known as soda-lime-silica glass, except that the iron oxide content is
significantly reduced (Industrial Glass Technologies LLC 2007). The second type of
heliostats, stressed membrane, have a reflective silvered polymer coated metal
membrane (Mavis 1989). A thin membrane of steel or aluminium is stretched over a
structural ring to form a flat, “drum” structure. Thin glass or silvered polymer film are
attached to the membrane to give the heliostat its reflective properties (Kolb et al. 2007).
The figure below is an example of a stretch membrane heliostat. Notice that round mirror
facets are used.
Figure 8: SAIC Heliostat on test at the NRE Laborat ory in Golden, Co, USA.
Source: Mancini, 2000
The reflector support structure support the array of mirror modules. This structure
typically consists of a main beam, or torque tube, with several cross beams. The mirror
modules are attached to the cross beams while the main beam is attached to a drive
system. A truss type structure is preferred especially for larger area heliostats because
their depth can be varied to provide the required stiffness, with little weight penalty.
(Falcone 1986)

Chapter 2 Solar Thermal Energy Industrial Engineering
Page 11
University of Stellenbosch Department of Industrial Engineering
Figure 9: Support structure of a glass/metal helios tat (Colon 70).
Source: Mancini, 2000
The pedestal supports the entire heliostat. A single pedestal mounted heliostat is the
preferred configuration, as been identified from previous work. By installing both drives
at the top of the pedestal the pedestal mount cost can be decreased (Mavis 1989). The
size of the pedestal is determined by the dimensions of the heliostat support structure.
Three types of pedestals have been identified, (1) a single steel tube, (2) a concrete
pillar, made from prestressed concrete grouted in place, integrated with a concrete
foundation, and (3) a steel truss frame that heliostats can be mounted on. The latter is
not preferred for larger heliostats.
Most modern day heliostats are orientated by a control system. A computer calculates
the direction of the sun as seen from the mirror. A control system is needed to position
the drive axes independently during plant operation throughout the day. Two types of
control systems are identified for heliostat use, (1) open loop and (2) closed loop (Alexis
2001). An open loop system use control computer software with temporal and geometric
algorithms to position a heliostat correctly. In a closed loop system feedback is provided
by a sun sensor, about whether the heliostat is pointing in the right direction to illuminate

Chapter 2 Solar Thermal Energy Industrial Engineering
Page 12
University of Stellenbosch Department of Industrial Engineering
the receiver. The open loop system is preferred because of lower costs, but to ensure
beam safety the system requires the same accuracy as for tracking (Mavis 1989).
A computer sends a control signal to motors, usually stepper motors, to turn the mirrors
to the correct alignment. This is important to provide accurate sun tracking capability.
Various different system axes have been considered throughout the years such as polar,
equatorial, pitch/yaw and azimuth/elevation. That latter is the proposed system because
of its lower cost. Azimuth tracking typically uses a rotary drive because of a larger
angular motion, approximately 270°, depending on si te latitude and field configuration.
Elevation movement only require 90° of movement. Be cause of this smaller angular
movement a linear actuator, such as a screw jack, can provide the required elevation
adjustment at a lower cost than a rotary drive. (Mavis 1989)
The drive unit is the main cost driver, as well as the most likely component to fail. The
drive system must have the capability of positioning a heliostat to the appropriate
position for cleaning, maintenance or operation. It should not drift in elevation or azimuth
due to environmental loading or wear. The drive system, including the motors, should be
sealed to protect it from mirror washing, rain, wind-blown dust and other environmental
factors. (Alexis 2001)
The heliostats that will be used for assessment in this report are discussed in section 4.3
on p. 17 as the Studied Product.

Chapter 3 Life Cycle Assessment Industrial Engineering
Page 13
University of Stellenbosch Department of Industrial Engineering
3. Life Cycle Assessment
The focus of this chapter is the Life Cycle Assessment (LCA) and its history and
methodology. This technique was developed as a result of the increased awareness of
environmental protection, and the possible effect that products, both manufactured and
consumed, and services may have on the environment. It is important to understand the
methodology because it will give us feedback on what effects a heliostat has on the
environment because of its existence.
3.1 Life Cycle Assessment
Life Cycle Assessment is a tool that systematically investigates and evaluates the
potential environmental impacts of a product, service or process caused or necessitated
by its existence. It quantitatively evaluates the energy and material requirements of a
product from initial raw materials acquisition throughout production, maintenance and
operation until final disposal. Emissions that are assessed include emissions to air, water
and soil.
Although there are numerous application areas of LCA, the main distinction can be made
between public and private application. Public studies are used to support the
development of environmental legislation and regulation. It also provides consumer
information. Public studies should be transparent to ensure that the assumptions made,
conclusions and recommendations are clearly represented. Studies in the private sector
can be used to support product development or marketing by improving the
environmental performance of a product. This can enhance the credibility of the
company’s environmental policy, or to guide it to act in an environmental friendlier way.
(Miettinen, Hamalainen 1997)
3.2 History of Life Cycle Assessment
In the late 1960s LCA started as an exercise to analyse the efficiency of resource use of
products and materials. These inventories were made to claim environmental superiority,
such as polystyrene over paper packaging. It served as a scientific method to compare
different products or systems. The problem was that the LCA didn’t provide a clear
differentiation between products. Instead it showed that all product systems consume

Chapter 3 Life Cycle Assessment Industrial Engineering
Page 14
University of Stellenbosch Department of Industrial Engineering
resources and produces wastes and emissions. Most comparisons were inconclusive
because of the complex and disparate factors of different products and processes.
(Owens 1997)
Initially, practitioners started to explore the instrument of LCA by using inventory data to
assess the specific environmental effect of a product throughout its life. This procedure
was called impact assessment. This procedure was done by (1) classifying and
organizing inventory data into categories, (2) characterizing and modelling the selected
inventory data to provide better perspective data about the emissions released, and (3)
evaluation of data to rank across different categories. (Owens 1997)
After years of improvement, a broadly recognized structure for the LCA method is
available since 1997 as the ISO 14040 standard series. Intensive international
standardization efforts ensured clear definitions of the goal and scope as well as the
inventory analysis phases. The other two phases, impact assessment and interpretation,
are still actively discussed. These phases will be discussed in the next section, the Life
Cycle Assessment Methodology. (ISO 2006)
The new improved method allows the assessment of not only products but in principle
also the assessment of technical processes. (ISO 2006)
3.3 The Life Cycle Assessment Methodology
There are three primary phases of LCA, (1) goal and scope, (2) inventory, (3) impact
analysis, and one secondary phase which is interpretation. It is important to remember
that an LCA study has both objective and subjective steps.
The goal and scope, discussed in section 4.1, states the indented application of the
study and the reason for carrying it out. The goal is stated along with the objectives
which determine how the goal will be achieved. Then the scope should be well defined to
ensure the detail of the study is compatible and sufficient to address the stated goal.
First the studied product, which is the physical entity that the analysis is based on, will be
discussed. This is followed by determining the functional unit so that the results of the
study are comparable to various other systems. System boundaries should also be

Chapter 3 Life Cycle Assessment Industrial Engineering
Page 15
University of Stellenbosch Department of Industrial Engineering
specified in this section and it should include physical and geographical boundaries as
well as the time horizon. The detail of the boundaries determines the materials and
processes that should be included in the study. Furthermore, the quality of data is also
important to ensure that accurate and consistent data is collected which is address the
goal of the study correctly. Finally the limitations of the assessment are discussed to
ensure the results are interpreted with a fair mind. (ISO 2006)
The life cycle inventory phase, discussed in chapter 5, is a compilation and quantification
of all the inputs and outputs, and includes all the material and energy flows that pass the
system boundaries. This data is then analysed and the results are interpreted in the
impact assessment phase. The data collection process is iterative and the reason for this
is that new data and limitations may be identified that require a change in the data
collections procedure to ensure that the goals of the study will still be met. Issues may
even be identified that require the revision of the goal and scope. The first step is to
determine the material specifications, including the type of materials and the quantity.
After this is done the manufacturing processes are discussed to determine where the
materials fit into the bigger picture. Following the manufacturing of the product the
construction process is explained. Then the operation and maintenance of the product,
or process, should be calculated to determine the inputs that keep the product, or
process, working properly. Finally, at the end of the life cycle, the disposal of material
should be considered to minimize wastes. (ISO 2006)
The impact assessment, discussed in chapter 7, uses software to analyse the data
collected in the inventory phase. The analysis evaluates the significance of the different
potential environmental impacts. The main potential impact that is evaluated is that of
the emissions released and this can be divided into two categories, (1) organic and (2)
inorganic emissions. Both of these categories are defined, classified and characterised
separately in section 7.1. This phase of the LCA mentions other potential environmental
impacts in detail. Other relevant impacts, besides emission control, include the impact on
water resource and the ecosystem. Visual and noise pollution can also be considered.
Even the socioeconomic impact of the power plant should be considered, although this
can be discussed in the inventory analysis. Transparency is of critical importance for this
phase of an LCA to ensure that assumptions are clearly described and reported since

Chapter 3 Life Cycle Assessment Industrial Engineering
Page 16
University of Stellenbosch Department of Industrial Engineering
the impact assessment may introduce subjective decisions. This may be a result of
insufficient information since some of the specifications may be confidential and the
information proprietary. (ISO 2006)
The interpretation phase should be done after each of the three primary phases. This
should be done to ensure consistency throughout the assessment. It should reflect the
fact that a LCA is a relative approach that indicates potential environmental effects, and
that it does not predict actual impacts on category endpoints, the exceeding of
thresholds or safety margin or risks. The interpretation also ensure that the information
stated is understandable, complete and in accordance with the goal and scope definition
of the study. Since a LCA consist of iterative processes, the interpretation phase
involves the process of reviewing and revising the scope of the study, as well as the
nature and quality of data collected. (ISO 2006)
Figure 10 gives a visual representation of the four phases and shows how it fits into the
LCA framework. In addition it shows some of the direct applications of LCA.
Figure 10: Life cycle assessment framework, the sta ges
Source: ISO, 2006

Chapter 4 Goal and Scope Industrial Engineering
Page 17
University of Stellenbosch Department of Industrial Engineering
4. Goal and Scope
This chapter focuses on the goal and objectives of the study. The studied product is
specified as well as the boundaries of the system. Specifications of the required data
quality are clarified and the limitations of a LCA study are discussed. This is the first step
in conducting a LCA.
4.1 Goal of the Study
The goal of this report is to evaluate the life cycle of a solar power tower with the focus
on the heliostats because the heliostat field represents the largest land area and capital
investment of the power tower plant. The total emissions throughout the heliostats’ entire
life should be calculated to determine the total impact that it has on the environment
because of its existence.
4.2 Objectives
The objectives of the study need to be completed to achieve the final goal. The amount
of organic and inorganic emissions must be determined to reach a conclusion. This is
done by using LCA software such as GaBi. The product system, process and material
flows, needs to be modelled using the LCA software which will analyse the data and
calculate all the emissions. The environmental effects of all the emissions, organic and
inorganic, must be determined as well. Finally the amount of emissions, along with their
individual effects on the environment, should be evaluated to determine if STE can really
be seen as a clean energy source.
4.3 Studied Product
The heliostat design that was chosen for assessment is based on the Advanced Thermal
Systems (ATS) H150 heliostat. ATS, a spin-off from ARCO Solar, used the existing
148m2 ARCO fourth-generation glass/metal heliostat design during the United States
Depart Of Energy’s (USDOE) large area heliostat development plan in 1985-1986 (Kolb
et al. 2007). An existing heliostat was chosen for the assessment discussed in this
report, since this report does not focus on the design of a heliostat, but only on the
assessment of one. The material specifications and quantities, discussed in section 5.2
on page 24, have been used to do the assessment on for the purpose of this report. This

Chapter 4 Goal and Scope Industrial Engineering
Page 18
University of Stellenbosch Department of Industrial Engineering
section will continue to discuss the components of the ATS H150, but the manufacturing
of the heliostat will be discussed in section 5.3.
The heliostat that is used for assessment in this report has an aperture area of 148.84
m2. It consists of mirror sections that are adhered side-by-side to form mirror modules.
These modules are supported by two racks, made up from trusses, which are attached
the main beam. When the final assembly is done the heliostat supports a total of 20
mirror modules, each with an area of 7.44m2. (Strachan, Houser 1992)
The heliostat features two-stage (two gears in series) worm gears for both azimuth and
elevation drives. The drives are mounted on top of a steel pedestal that is placed in an
augured hole which is filled with reinforced concrete (Kolb et al. 2007). On-site assembly
of the support structure takes place before it’s lifted onto the pedestal. (Strachan, Houser
1992)
It is important to note that 2667 units will be assessed to ensure a large enough total
aperture area to supply the power tower with a sufficient amount of solar radiation. Thus,
the studied product can be seen as 2667 ATS H150 heliostats.
Figure 11: The ATS fourth-generation prototype heli ostat.
Source: Kolb et al. 2007

Chapter 4 Goal and Scope Industrial Engineering
Page 19
University of Stellenbosch Department of Industrial Engineering
4.4 Functional Unit
The functional unit provides a reference to relate the inputs and outputs. This ensures
the results of the study are comparable. Comparability is especially important when
alternative technologies with different products and systems are being assessed. (ISO
2006)
The function of the heliostat, as specified for this study, is to redirect and concentrate
solar radiation onto a receiver at the top of a power tower, which converts it to thermal
energy and ultimately generate electricity. A common measure of electricity is MWh. For
simplicity, the electrical power that the power tower plant generates during the estimated
life span of the heliostats will be used as the functional unit. The plant used in this report
for calculations generates an average of 80.6 MW for an annual output of 706 000 MWh
of electricity per year for 25 years, which is the estimated life span of the studied
product. This data was obtained from the studies of Paul Julian Harper, 2010. Therefore,
the functional unit for this study is 17 650 GWh of electricity. This figure may vary in
different sites due to changing weather conditions. (Nalukowe et al. 2006)
4.5 System Boundaries
The boundaries of the system specify which processes should be included in the product
system. For this study the boundaries are specified for a complete cradle-to-grave LCA.
This includes acquisition of raw materials, manufacturing processes, transportation,
construction, operation, maintenance and recycling of material or disposal.
Different approaches for a LCA are possible. In addition to the cradle-to-grave approach,
followed in this study, there are other variants of LCA available. The scope of a LCA can
specify the boundaries as a cradle-to-gate approach or even a gate-to-gate study
A cradle-to-gate study includes the extraction of raw material to the gate of the factory,
before it is distributed to the consumer. The operation, maintenance and disposal of the
product are omitted from the study. This type of study is seen as an assessment of a
partial product life cycle.
Chapter 4 Goal and Scope Industrial Engineering
Page 20
University of Stellenbosch Department of Industrial Engineering
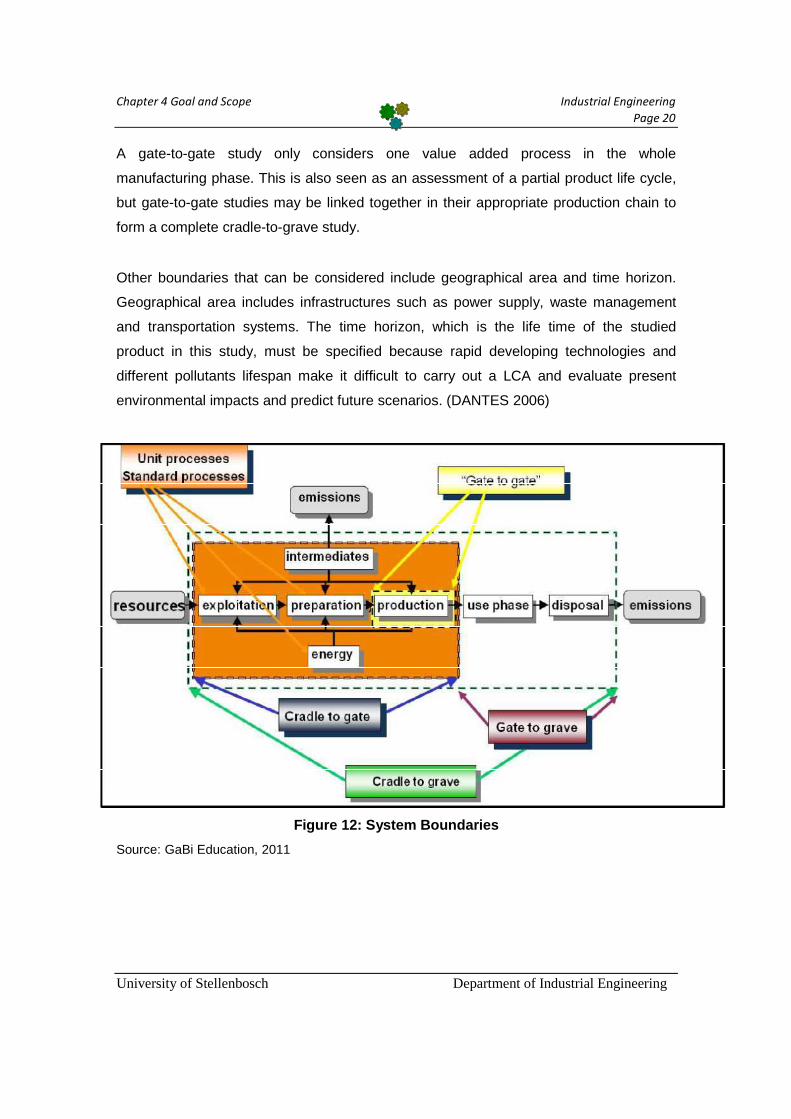
A gate-to-gate study only considers one value added process in the whole
manufacturing phase. This is also seen as an assessment of a partial product life cycle,
but gate-to-gate studies may be linked together in their appropriate production chain to
form a complete cradle-to-grave study.
Other boundaries that can be considered include geographical area and time horizon.
Geographical area includes infrastructures such as power supply, waste management
and transportation systems. The time horizon, which is the life time of the studied
product in this study, must be specified because rapid developing technologies and
different pollutants lifespan make it difficult to carry out a LCA and evaluate present
environmental impacts and predict future scenarios. (DANTES 2006)
Figure 12: System Boundaries
Source: GaBi Education, 2011

Chapter 4 Goal and Scope Industrial Engineering
Page 21
University of Stellenbosch Department of Industrial Engineering
4.6 Quality of Data
The quality requirements specify the characteristics of the data needed for the study. It is
important to understand the required quality of data to ensure reliable results that can be
used for an accurate interpretation. A truthful interpretation is only possible if accurate
and consistent data was used to reach the final results.
The specified boundaries should be taken into account to conform to the goal and
objectives of the study. These parameters include system boundaries, geographical area
and time horizon.
4.7 Limitations
There are several environmental management techniques available such as LCA, risk
assessment, environmental performance evaluation, environmental auditing, and
environmental impact assessment. LCA might not always be the most appropriate
technique to use in every situation. A LCA, by definition, only considers environmental
issues, although there are also other issues such as social, economical, political and
technical. The life cycle approach and methodologies can however be use to deal with
these issues. (ISO 2006)
Sometimes it is necessary to make assumptions which may be completely subjective.
These assumptions, along with the nature of choices, may severely influence the
conclusion made if the writer fails to stay objective. (ISO 2006)
The relevancy of data is of high importance. The accessibility and availability of
applicable data may affect the relevancy of the results. Results that focus on global or
regional issues may not be adequate for local applications (ISO 2006). For this study the
availability of data was sometimes a problem because of confidentiality of data and the
limited set of databases used by GaBi Education. Suppliers want keep their
specifications propriety since they want to ensure that they keep their share of the
market by maintaining an edge over competing companies.

Chapter 5 Life Cycle Inventory Analysis Industrial Engineering
Page 22
University of Stellenbosch Department of Industrial Engineering
5. Life Cycle Inventory Analysis
This chapter discusses the data collection and procedures that was followed to calculate
the relevant inputs and outputs of the system. These inputs and outputs are quantified
for each phase of the heliostat’s life cycle. These phases include manufacturing,
construction, operation, maintenance and disposal. The chapter ends with the staff
requirements that are necessary to ensure smooth operation of the plant. The data that
is collected in this phase of an LCA is used for the final assessment. Since this is an
iterative process it is important to do thorough research to ensure accurate and
consistent data that are in accordance with the goal of the study.
Figure 13: Data Collection and Calculation Process
Source: GaBi Education, 2011

Chapter 5 Life Cycle Inventory Analysis Industrial Engineering
Page 23
University of Stellenbosch Department of Industrial Engineering
The important components of the ATS H150 heliostat are listed at the start of this
section. Since this is an LCA study, not all the potential impacts will be discussed. These
omitted impacts include cultural resource, safety, visual & noise, transportation and
aircraft interference. This section ends with the socioeconomic impact. Although this
usually falls outside the scope of a LCA, it is worth mentioning.
5.1 Components
The main components, and sub components, of the ATS H150 heliostat have been
used. The first table, below, is a summary of all the main components of the mirror
module along with their quantities and mass. The second table summarise the rest of the
heliostat’s components. The manufacturing processes of some of these components are
discussed later in this chapter.
Table 1: Bill of Material for the Mirror Modules
Components Quantity Sub
Components Mass (kg)
Sub Totals (kg)
Mirror Module Assemblies: 20 Glass 100 1496.85 Silvered Glass 374.21 Low Iron Glass 1122.64 Steel 716.68 Hat Sections 80 648.64 Cross Members 60 68.04 Fasteners 80 36.29
Adhesive 72.57
Source: Kolb et al. 2007

Chapter 5 Life Cycle Inventory Analysis Industrial Engineering
Page 24
University of Stellenbosch Department of Industrial Engineering
Table 2: Bill of Material for rest of the Heliostat
Components Quantity Sub
Components Mass (kg)
Sub Totals (kg)
Trusses and Attachment Plates 453.59 Truss Subassembly 4 420.03 Mounting Adaptor Plate 4 33.57 Torque Tube Assemblies 2 975.22 Torque Tube Pipe 2 899.93 Flange 2 64.41 Fasteners 24 10.89 Cross Bracing Structure and Attachments 1 set 246.75 Beams 12 149.69 Long Diagonals 16 52.16 Short Diagonals 8 16.33 Stabilizers 16 6.35 Wing Ties 2 4.99 Brackets 4 7.26 Fasteners 44 9.98 Gear Drives (azimuth & elevation + fasteners) 685.83 Azimuth Subassembly 1 453.59 Elevation Subassembly 1 226.80 Fasteners 12 5.44 Motors & Controls 54.43 Pedestal Assembly 1 1557.18 Pedestal Pipe (Steel) 1 1495.04
Flange (Steel) 1 62.14
Source: Kolb et al. 2007
5.2 Material Specifications
The studied product consists mostly out of steel (±63%) and glass (±24%). These
materials, along with other relevant materials, will be discussed separately for each of
the major components of the heliostat.
To begin with, the composition of the reflectors is important to ensure optimal optical
performance. A thin layer, 1 mm, of silvered float glass is bonded to a glass substrate to
form a mirror of 1.4884 m2. A low iron, float glass is used as the substrate. Although it
has similar properties and chemical composition, except the iron content is significantly

Chapter 5 Life Cycle Inventory Analysis Industrial Engineering
Page 25
University of Stellenbosch Department of Industrial Engineering
reduced, resulting in a less “greenish” tint (Industrial Glass Technologies LLC 2007).
This is a vital characteristic since mirrors for this solar application requires glass with a
high transmission value and low coloration.
The reflector support structure consists entirely of structured steel. Structural steel is
defined as the structural elements that make up the frame that are essential to
supporting the design loads, e.g. beams, columns, braces, plates, trusses, and fasteners
(Berman) . The structural steel that is used for this component include carbon steel and
cast steel. (Kolb et al. 2007)
The gear drives consist out of two main components, an azimuth subassembly and an
elevation subassembly, that is mounted at the top of the pedestal and fastened with steel
parts. These drives are made from steel and cast iron. Both of these drives employ 90
VDC, 1/4-hp motors that are mainly made up of steel and copper (Kolb et al. 2007). A
rotary drive is used in azimuth because of larger angular motion that is required. A linear
actuator can be used for the elevation drive since the rotational requirement is only 90°.
Because of this smaller angular moment, a screw jack was chosen since it can provide
the required elevation adjustment at a lower cost than a rotary drive. (Falcone 1986)
The pedestal of the heliostat is essentially just a large steel pipe with 0.61 m diameter. A
cast steel flange is seam welded onto the pedestal. This pipe is placed in an augured
hole with concrete backfill. The hole is than filled with more concrete to create a stable
foundation that will be able to support the entire heliostat. A lot of factors should be
considered to determine the size of the foundation such as wind loads and the mass of
the structure. (Kolb et al. 2007)
5.3 Manufacturing Processes
The reflector mirrors make up about 24% (in terms of mass) of the material requirements
of the heliostat, therefore the glass production process will be described in detail in this
section.
The float glass that is used for the mirrors uses some of the most abundant raw material
on earth. It consists mainly out of silica sand, but other materials are added to determine
Chapter 5 Life Cycle Inventory Analysis Industrial Engineering
Page 26
University of Stellenbosch Department of Industrial Engineering
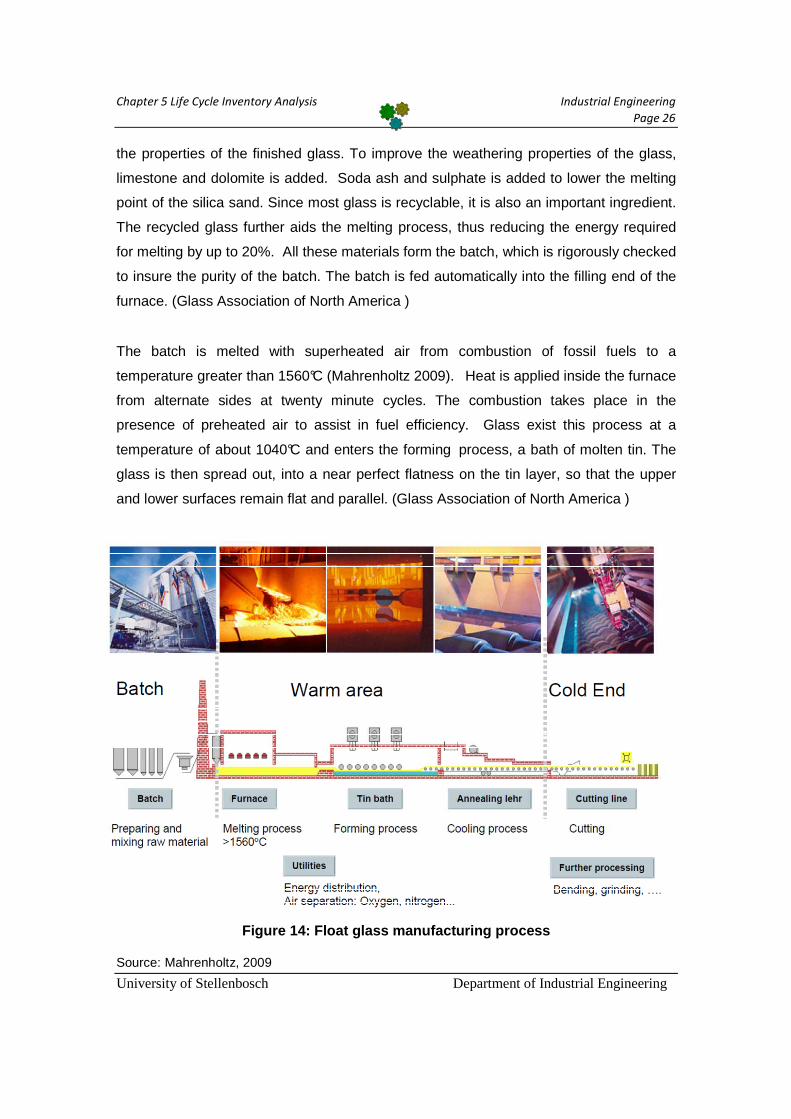
the properties of the finished glass. To improve the weathering properties of the glass,
limestone and dolomite is added. Soda ash and sulphate is added to lower the melting
point of the silica sand. Since most glass is recyclable, it is also an important ingredient.
The recycled glass further aids the melting process, thus reducing the energy required
for melting by up to 20%. All these materials form the batch, which is rigorously checked
to insure the purity of the batch. The batch is fed automatically into the filling end of the
furnace. (Glass Association of North America )
The batch is melted with superheated air from combustion of fossil fuels to a
temperature greater than 1560°C (Mahrenholtz 2009). Heat is applied inside the furnace
from alternate sides at twenty minute cycles. The combustion takes place in the
presence of preheated air to assist in fuel efficiency. Glass exist this process at a
temperature of about 1040°C and enters the forming process, a bath of molten tin. The
glass is then spread out, into a near perfect flatness on the tin layer, so that the upper
and lower surfaces remain flat and parallel. (Glass Association of North America )
Figure 14: Float glass manufacturing process
Source: Mahrenholtz, 2009

Chapter 5 Life Cycle Inventory Analysis Industrial Engineering
Page 27
University of Stellenbosch Department of Industrial Engineering
The molten glass can be made thicker by confining its initial outward spread. This
process is controlled by the pull of a ribbon, which narrows as the molten glass moves
onto the tin bath. The atmosphere is controlled with hydrogen and nitrogen to prevent
the tin from oxidizing. Before the glass leaves the tin batch, extremely thin metallic layers
can be applied to the glass, while it is still hot, so that special properties can be imparted,
including the ability to reflect heat. As the glass exist the forming process, at a
temperature close to 600°C, it enters an annealing lehr, where the temperature is taken
down to room temperature. The glass is then trimmed to remove the indentations that
the top roller left. Glass pieces removed during this trimming process are carried away
on conveyors to be reintroduced at the beginning of the melting process. (Glass
Association of North America )
Although steel make up approximately 63% (in terms of mass) of the material
requirements of the heliostat, various steel manufacturing processes have been used to
produce different steel components. These processes include casting, cold drawing, cold
forming, extrusion, and machining. Describing all these processes in detail would be
redundant. Some of the components may even be produced with different processes.
The pedestal is the largest single contributor of steel, contributing approximately 38% of
the total steel requirement for the heliostat, and it’s basically just a tubular steel pipe.
Since it would be redundant to discuss all the different processes, a table has been
inserted at the end of this section to show the main processes for steel product
manufacturing.
The gear drives includes both steel and cast iron. Machining is used to produce the steel
gears. The housing of the gear drive, as well as the motor, is produce with sand casting.
This process is used since it can be used to create complex part geometries, including
both external and internal shapes. Molten metal is poured into a sand mould, allowing
the metal to solidify. The mould is then broken apart to remove the casting. The casting
is cleaned and inspected, and sometimes it is required to improve the metallurgical
properties through heat treatment. The sand mould utilize a cope (the top half of the
mould) and drag (the bottom half). It consists of silica sand, clay and water. The water is
added to develop the bonding characteristics of the clay, which is required to bind the
sand grains together. The following characteristics should be exhibited by the sand; (1) it

Chapter 5 Life Cycle Inventory Analysis Industrial Engineering
Page 28
University of Stellenbosch Department of Industrial Engineering
should be able to pack tightly around the pattern, (2) strong enough to withstand
pressure of molten metal when the mould is cast, (3) it should be permeable to allow
gases and steam to escape from the mould during casting.
Figure 15: The steps in the production sequence in sand casting
Source: Wang, Conley & Stoll. 1999
Figure 16: The cross-section view of the typical sa nd casting mould
Source: Wang, Conley & Stoll. 1999

Chapter 5 Life Cycle Inventory Analysis Industrial Engineering
Page 29
University of Stellenbosch Department of Industrial Engineering
Table 3: Processes for steel in manufacturing
PROCESS EXAMPLE OF PRODUCTS Casting Gears, engine casings Powder metallurgy Gears, bearings, fasteners, sprockets Forming processes: Rolling Bars, rods, coils, rails, structural shapes Forging Flanges, gears, rings Extrusion Rods, tracks Drawing Bars, tubes, wires Sheet metalworking Shearing, blanking, and punching Disks, washers Bending Brackets, U-shaped parts (and V-shaped) Drawing Cylindrical cup, panels Material removal processes: Turning Cylindrical parts, chucks, collets Drilling Piston rings, ring gear pinions Milling Fittings, valves
5.4 Assembly and Construction
The first part of the section discusses the assembly of the heliostat, starting at the mirror
sections and ending at the mounting of the support structure onto the pedestal. The
second part discusses the construction of the heliostat in its fixed position.
5.4.1 Assembly
Since heliostats are custom made for each plant, there aren’t any mass produced
heliostats that can be compared with the studied product. Therefore the assembly
heavily depends on the use of manual labour. Since an LCA doesn’t consider the
socioeconomic impact of the heliostat, although the operation and maintenance
workforce will be discussed later in this chapter, the size of the workforce needed for
assembly will be ignored.
The mirror sections of the studied product consist out of 1.22 m2, 1 mm thick silver glass
bonded to 3 mm low-iron glass substrate. Five of these mirror section are adhered to
four parallel, aluminized sheet metal hat sections with cross member attached by four
threaded studs, to form the mirror hat sections. The four hat sections are fastened

Chapter 5 Life Cycle Inventory Analysis Industrial Engineering
Page 30
University of Stellenbosch Department of Industrial Engineering
together and stiffened by three cross member to form a rectangular mirror module.
(Strachan, Houser 1992)
The heliostat has two racks, each constructed from two trusses welded to the heliostats
torque tube. There are 10 mirror modules bolted to each rack for a total of 20 mirror
modules. The torque tube itself is bolted to either side of the heliostat’s elevation drive.
(Strachan, Houser 1992)
The gear drives are based on Winsmith low-cost drive systems. Its elevation drive
employs a jack screw, while the azimuth drive is a planocentric drive. The drive system
is equipped with 1/4-hp motors. These motors are controlled and driven by a local
control board that is mounted on the heliostat pedestal. The control board is equipped
with an on-board microprocessor. Operator control of the heliostat is via a computer
program running on a personal computer that is connected by its I/O (input/output) port
to the local control board. (Strachan, Houser 1992)
Assembly of mirror modules, the torque-tube and truss structures take place on-site or
near the plant. The final assembly is done when the heliostat is lifted onto the pedestal.
(Kolb et al. 2007)
5.4.2 Construction
The constructing of the heliostat requires the entire structure to be mounted on a
pedestal and then anchored in the ground.
Each heliostat is planted in an augured hole with concrete backfill. A mobile crane is use
to lift the support structure onto the pedestal and ultimately into the augured hole. Once
the heliostat is in place, the hole is filled with steel reinforced concrete. This forms the
foundation of the heliostat. (Strachan, Houser 1992)
Table 4: Foundation Specification
Material Amount (kg) Reinforced Concrete (2 400 kg/m3) 4 587
Source: Kolb et al. 2007

Chapter 5 Life Cycle Inventory Analysis Industrial Engineering
Page 31
University of Stellenbosch Department of Industrial Engineering
5.5 Operation
The operation of the heliostat is an automated procedure that depends on the control
system that position the heliostat’s drive axis independently throughout the day. Three
main elements of the collector subsystem control system are identified. These are a
heliostat array controller (HAC), a heliostat field controller (HFC), and a heliostat
controller (HC) The HAC is centrally located provide information, as the oversight
computer, to many HFC’s. Each HFC, located through the field, controls a group of
heliostats. The HC, located in the pedestal of the heliostat, controls the motors of the
individual heliostat.
The major operation factor for this report is the power consumptions of the ATS H150
heliostat’s drives. Measurements were made with an AC watt-hour meter during a
typical 10-hour day. The all-day power consumption of drives was measured at 292 watt-
hours (Strachan, Houser 1992). This figure will be used as the daily power consumption
of each heliostat for purposes of this study. The table below show the extended results
of the test.
Table 5: Power Utilization of the ATS H150 heliosta ts
Quiescent Power: 10 W
Avg. Power Draw (both drives) 35 – 75 W
Avg. Power Draw (elev. drive) 22 – 35 W
Typical peak draw (both drives) 175 W
On-sun tracking (average) 80 W
All day power consumption 292 Wh
Source: Strachan, Houser. 1992

Chapter 5 Life Cycle Inventory Analysis Industrial Engineering
Page 32
University of Stellenbosch Department of Industrial Engineering
5.6 Maintenance
Heliostat maintenance has no parallel in conventional utility or industrial plants. Since
heliostat maintenance is dominated by the washing of mirrors, this section will be divided
into two subsections, (1) general maintenance, and (2) mirror washing.
5.6.1 General maintenance
Most of the general maintenance consists out of scheduled maintenance. This includes
all the activities that should be done at fixed time intervals. Activities that fall in this
category include routine inspection, preventive maintenance, cleaning, painting, facet
alignment, control adjustment. The last two activities are prepared through testing and
calibrating. The facets are aligned during initial assembly, and the control bias for the
heliostat is set during the installation of the heliostat. These should be tested regularly,
especially after strong wind conditions or maintenance operations such as mirror facet
replacement. The system should be calibrated if necessary. This is done to ensure that
the reflected solar beam falls within the aim point limits. Since general maintenance
consist out of scheduled activities, and some of them happens quite regularly, careful
consideration of labour saving equipment, optimum maintenance frequency, and time
saving procedures is important because of the large amounts of heliostats that is typical
of a commercial power plant. (Mavis 1989)
Other maintenance activities that’s not included in scheduled maintenance include major
repairs, and repair or replacement of failed components. Major repairs requiring the
disassembly of the heliostat may be necessary. The same type of mobile crane used for
the installation is used to move damaged heliostats to the shop for disassembly and
reassembly. (Mavis 1989)
Repair or replacement is necessary for failed parts. Since all the heliostats are identical,
enough parts can be stored to ensure quick replacement. Repairs can be done in the
maintenance shop or offsite. Items that typically require repair is electronics, motors,
connectors, mirror facets, and drive mechanisms. Cracked mirrors do not require
immediate replacement although water seepage will slowly degrade the reflective
surface. (Mavis 1989)

Chapter 5 Life Cycle Inventory Analysis Industrial Engineering
Page 33
University of Stellenbosch Department of Industrial Engineering
5.6.2 Mirror Washing
Optimum plant performance requires maintaining high mirror reflectivity. Soiling is the
main reason for reflectivity losses and therefore it’s necessary to do periodic heliostat
cleaning. The reflectivity is measured in terms of a cleanliness factor. This factor,
expressed as a percent of the field’s reflectivity, measures the cleanliness of the
heliostat field. (Falcone 1986)
There was some speculation that a small amount of total reflectivity of mirror (<2%) may
be permanently lost as a result of soiling or damage done to the glass surface by the
soiling. Other investigations believed that the losses can be recovered by mechanical
scrubbing or by high pressure washing with dilute hydrofluoric or hydrochloric acid.
Previous records from the IEA/SSPS central receiver plant in Almeria, Spain, indicate
that water spray and/or rain is sufficient to clean the mirrors to an acceptable levels
(>97% clean). Some amount of mirror washing is probably necessary at most sites,
although the Central Receiver Test Facility (CRTF) at Sandia National Laboratories in
Albuquerque, NM, USA, relies exclusively on cleaning by natural precipitation (Mavis
1989). Research has indicated that it could be cost effective to wash the field frequently,
as often as bi-weekly (Falcone 1986). This will also ensure high mirror cleanliness.
For the purpose of this study, heliostat cleaning will rely on rainfall and high-pressure
spraying. For spraying, deionised water is preferred over soft water because of the
residue left by the soft water after rinsing. The water requirements for a solar central
receiver plant are essentially the same as those of a fossil fuel power plant with
comparable electrical output rating and capacity factor. However, for a solar central
receiver plant, additional deionised water is required for washing the heliostats. The
additional water requirement for heliostat washing depends on the washing frequency
but it is typically between 5,000 and 15.000 m3 (Falcone 1986). Washing frequencies
normally range from 10 to 30 per year. The washing frequency for this study is specified
as 26 since washing happens bi-weekly. (Mavis 1989).
Heliostat wash trucks, similar to the trucks used at solar one, will be utilize for cleaning
purposes. Results from Solar One indicated that one truck operator with a wash rate of

Chapter 5 Life Cycle Inventory Analysis Industrial Engineering
Page 34
University of Stellenbosch Department of Industrial Engineering
150-170 heliostats per eight hour shift could restore mirror cleanliness to 99% of the
clean value, which would provide a 97% average cleanness with biweekly washing. Note
that the heliostats implemented at Solar One have a aperture area of about 40 m2, this is
small in comparison with the studied product in this report that have an aperture area of
about 148 m2. This data has been extrapolated to determine the amount of wash trucks
required to perform bi-weekly washing of the collector field. (Falcone 1986)
Figure 17: Photograph of the Heliostat Wash Truck a t Solar One
Source: Falcone, 1986

Chapter 5 Life Cycle Inventory Analysis Industrial Engineering
Page 35
University of Stellenbosch Department of Industrial Engineering
5.7 Disposal
The end of a product’s life cycle is important to sustain its clean carbon footprint.
When all stages of implementation are considered, from manufacture to disposal,
heliostats are among the cleanest energy sources available. Heliostats are primarily
composed of steel and glass, both of which are readily recyclable. Neither steel nor
glass is considered particularly hazardous to human health or the environment. The
concrete used for the foundation is land filled. (NMT)
Steel is 100% recyclable and can be recycled an infinite amount of times. Each time the
steel is re-processed it saves energy and raw materials. Most of today’s steel has
around 20% recycled content. Recycling steel diverts these products from landfill, and
enables the material to be reprocessed, thereby conserving raw materials. For every ton
of steel recycled, 1131 kg of iron ore, 633 kg of coal and 54 kg of limestone are saved.
(Planet Ark)
Since the glass is mostly silicon dioxide, soda ash and limestone, it is relatively easy to
recycle it. Producing glass from recycled glass rather than raw materials uses 75% less
energy. This is largely due to the much lower production temperature, which is
mentioned previously in this chapter. The lower production temperature conserves
energy and oil, and extends the life of the furnace. Recycling glass therefore results in a
reduction in greenhouse gas emissions. For every ton of glass recycled, there is a
saving of 225 kg carbon dioxide. Furthermore, using recycled glass conserves more than
1.1 ton of raw materials per ton.(Planet Ark)
A small amount of copper can also be recovered from the motors. The energy
consumption during copper production is 130.3 GJ/ton. Energy consumption for copper
recycling is 13% of production. (Nalukowe et al. 2006)
Finally, heliostat arrays do not suffer from the ongoing natural degradation that plagues
selenium-based solar panels. They offer a comparatively long service life, minimizing the
frequency of manufacturing new heliostats and disposing of old ones. (NMT)

Chapter 5 Life Cycle Inventory Analysis Industrial Engineering
Page 36
University of Stellenbosch Department of Industrial Engineering
5.8 Socioeconomic Impact
This section takes a look at the socioeconomic impact of the solar power plant. Although
this is not normally included in a convention LCA, it is mentioned in this study because of
the potential environmental impact that it may have on the surrounding area. (Reilly,
Kolb 2001)
The construction of the solar central receiver plant is generally intense, but of short
duration while the impact of plant operation tends to be generally mild, but of longer
duration. Plant construction may result in a significant, but short term, housing demand.
This depends on the ability of nearby communities to supply labour and the level of on-
site housing. The operation of the plant may result in addition, permanent on-site
housing. (Falcone 1986)
Public facilities such as schools, hospitals, and churches as well as the need for
additional police and fire protection may grow. Local traffic congestion may occur as a
result of an increase in vehicles, or inadequate number of roadways to the plant site and
the temporary addition of construction worker traffic. This may result in the construction
of more roadways. (Falcone 1986)
Since the magnitude of these impacts depends on the size of the staff requirements for
the operation and maintenance of the plant, it is important to consider the manpower
needed. Manpower estimates for a 100 MW commercial power plant (Solar 100) were
independently done by ESI and Bechtel, in 1998, and were based on the limited
experience at Solar Two. Solar two is a 10 MW solar power tower plant located near
Barstow in California, U.S.A. Table 6 compare these estimates made by both companies
with the actual staffing at Solar Two. It can be seen that Bechtel’s overall manpower is
more aggressive than ESI’s and that the job categories of the O&M crew are somewhat
different, since they assume a non-union labour force is used, unlike ESI. Comparing
these estimates with the experience at the 80 MW SEGS VIII and IX plants (~40 to 50
total O&M crew) again suggests that the O&M of trough and tower projects of similar
size should be about the same. However, the heliostat washers required might be more
for the plant studied in this report since it relies on a frequent cleaning cycle. (Reilly, Kolb
2001)

Chapter 5 Life Cycle Inventory Analysis Industrial Engineering
Page 37
University of Stellenbosch Department of Industrial Engineering
Table 6: Comparison of estimated Operation & Mainte nance Staffing
Staff 10 MW Solar Two
(Test & Evaluation) Solar 100
(ESI) Solar 100 (Bechtel)
Plant Manager 1 1 1
Secretary 2 2 1
Operations Manager 1 1 1
Senior Operators 5 5 4
Control Operators 4 5 4
Plant Equipment Operators 0 5 4
Assistant Plant Equipment Operators
0 0 4
Maintenance Supervisor 3 6 1
Electricians 0 0 2
Instrument Technicians 7 5 2
Mechanics 0 5 2
Machinist/Welder 2 1 1
Warehouse Clerk 1 2 1
Equipment Mechanic 0 0 1
Heliostat Washers 3 0 6
Engineering 3 5 1
Chemical Technicians 1 1 1
Security 1 1 0
Clerk Supervisor 1 1 0
Test & Evaluation Manager 1 0 0
TOTAL 36 46 37
Source: Reilly, Kolb. 2001

Chapter 6 Methodology Industrial Engineering
Page 38
University of Stellenbosch Department of Industrial Engineering
6. Methodology
Although there are many tools available to support the Life Cycle Assessment (LCA)
technique, the tool chosen for this specific study is the Educational version of the GaBi
software. This is use in addition with the LCA methodology to simplify the data analysis
and emission calculations. This chapter will provide a description of GaBi and the flow of
materials will be identified.
6.1 GaBi Software
GaBi is a powerful software tool that is used for product and process sustainability. The
user builds models for product systems by specifying inputs and outputs for each
specific process. Strategic differentiation is made between materials, products and
processes. GaBi identifies optimisation potentials by determining what the CO2
emissions are. It also support environmental monitoring and risk analysis while delivering
comprehensive arguments. (GaBi Education, 2011)
A model, which GaBi refers to as a plan, is built that represents the flow of material and
the processes involved in the actual life of the studied product. The scope of the LCA
determines the boundaries of this model. Flows that enter the product system coming
from the natural system (e.g. resources as iron ore) or that leave the system (e.g. CO2
emissions) are called elementary flows. The inventory analysis, done in the previous
chapter, is the input list of all the elementary flows associated with the system. (GaBi
Education, 2011)
The most important information of GaBi is the flow information. Flows are characterised
by mass and energy with their respective quantities. These flows can contain information
for different raw materials, plastics, metals, emissions to air and water and many more.
(GaBi Education, 2011)
GaBi analysed the flows specified in the plan and calculated all the outputs. The outputs
are categorised and summarised to give a clear representation of the environmental
influence caused by the flows. These outputs can then be used to form a conclusion and
make recommendations to improve the processes in the future.

Chapter 6 Methodology Industrial Engineering
Page 39
University of Stellenbosch Department of Industrial Engineering
6.2 Project, Plans, Processes and Flows in GaBi
The first step in GaBi is to create a project and activate it. This is the main database of
the project that contains all the plans, processes and flows. Once the project is active, a
plan can be created.
Plans contain processes and flows that were identified in the LCI. A plan can contain
other plans, which is then called a subsystem. The subsystem can also contain other
subsystems.
The processes contain flows, which represent the inputs and outputs of the system.
These flows may already be defined in the database or new flows can be created. Flows
that are used by other processes as well are marked with an “X” to show that they
should be tracked. Flows that represent the waste of a process are marked with an
asterisk (*).
Flows must be specified with material quantity or amount of energy required to produce
a product or drive a system. The flows are the links that connect all the processes and
that’s why it is important to remember that the output of one process is the input of
another process.
6.2.1 Heliostat Project
The project created for this study was called “Heliostat”, since it describes the life cycle
of the ATS H150 heliostat. It consists of three separate plans that contain all the
processes and flows that are required for manufacture, maintenance and operation of
the heliostats required for the collector field.
The first plan represents the processes and flows required to manufacture the heliostats.
The environmental effects resulting from the mining processes involved to acquire the
raw materials are automatically considered in GaBi when the material and manufacturing
processes are specified. The second plan represents the cleaning of the collector field
and consists only of the deionization of water and the water trucks required for spraying
the mirrors. The third, and final, plan represents the operation of the heliostats, and only
considers the electrical usage of the motors that’s use to power the heliostats’ drives.

Chapter 6 Methodology Industrial Engineering
Page 40
University of Stellenbosch Department of Industrial Engineering
The figure below shows how all the heliostat’s components fit together. These flows
were used to develop the first plan in GaBi. This figure only shows the component flow
and materials, since the masses were already discussed in the LCI.
Mirror Module
(20)
Heliostat
(1)
Component
(Total Quantity
Per Heliostat)
Cross
Members
(60)
Hat Sections
(80)
Silvered
Glass
Material
Low Iron
Glass
Adhesive
Trusses and
Attachment Plates
(4)
Cross Bracing
(1)
Pedestal
(1)
Steel Sheet Metal
Torque Tube
Pipe
(2)
Glass Mirror
(100)
SteelFasteners
(80)
Beams
(12)
Pedestal Pipe
(1)
Flange
(2)
Long
Diagonals
(16)
Fasteners
(2)
Flange
(1)
Wing Ties
(2)
Stabilizers
(16)
Short
Diagonals
(8)
Brackets
(4)
Fasteners
(44)
Steel
Steel
Truss
Subassembly
(4)
Torque Tube
Assemblies
(2)
Mounting
Adaptor Plate
(4)
Steel
Steel
Gear Drives
(1 set)
Motors & Controls
(1 set)
Fasteners
(12)
Elevation
Assembly
(1)
Azimuth
Assembly
(1)
Steel
Steel
Cast Iron
Copper
Steel
Support Structure
(1)
Figure 18: Heliostat's Component Flow

Chapter 6 Methodology Industrial Engineering
Page 41
University of Stellenbosch Department of Industrial Engineering
The figure below is a screenshot from GaBi for the second plan, heliostat washing. This
is a very simple plan since the only primary flow, that is tracked, is that of deionised
water. The flows for the manufacturing process is much more complex, as can be seen
from figure 18, which is a flow diagram of all the heliostat’s components. This diagram
was created in Microsoft Visio, since the plan for manufacturing, which was created in
GaBi as well, is too large to display on one page.
Figure 19: Plan for Washing of the Heliostats
The third and final plan is the simplest of the three since it only consists of the supplying
of electricity to the heliostats’ motors.
Figure 20: Plan for Operation of the Heliostats

Chapter 6 Methodology Industrial Engineering
Page 42
University of Stellenbosch Department of Industrial Engineering
6.3 Assumptions that can be made when working with GaBi
There are certain assumptions that have to be made when working with GaBi education.
This might be because of several different reasons that may include the lack of
information caused by proprietary materials and processes. It is also important to
remember that and LCA has some objective steps that may influence the final results
and interpretation.
Four types of assumptions were identified while doing this project. These are (1)
construction, (2) installation, (3) decommissioning and (4) operation.
The materials used for construction couldn’t be specifically identified, and since different
types of steel and glass are available, standard steel and float glass were used for
modelling most processes.
GaBi doesn’t make provision for auguring the holes that is required for heliostat
installation. The assumption was made that auguring contribution to emissions is so
small it is negligible.
The problem with the energy consumption of the motors, which are the single largest
contributor to operating costs, is that it is based on estimates made more than 15 years
ago. The electrical usage and maintenance cost for different motor manufacturers might
be different.
The disposal of the heliostats and the decommissioning of the collector area is a topic
that many companies haven’t considered in their strategic plan. It is difficult to determine
the energy use and emissions associated with removing the collector field. Recycling will
not be considered in the model, although it was discussed in the inventory analysis.
The final assumption is made regarding the maintenance of the heliostats. Minimum
provision is made for broken pedestals or supporting structures. Spare parts will be
available on site, but will not be taken into account in the model. These include motors,
drives and mirror modules. In reality the amount of spares will be taken as a percentage
of the total amount of parts needed for normal operation.

Chapter 7 Life Cycle Impact Assessment Industrial Engineering
Page 43
University of Stellenbosch Department of Industrial Engineering
7. Life Cycle Impact Assessment
This chapter use a four step methodology to assess the results of the analysed data.
These steps include (1) acquiring and comparison of results, (2) selection of impact
categories, (3) classification of results, and (4) characterisation of results. The aim of the
impact analysis is to evaluate the significance of different types of potential
environmental impacts of the studied product.
The transparency of this chapter is important to give an open, comprehensive and
understandable presentation of information. This chapter provide the information for the
interpretation phase. (ISO 2006)
7.1 Results
The results that were obtained were the different emissions from the entire life cycle of
2667 heliostats, as calculated by GaBi. It is divided into three plans according to how it
was modelled in GaBi. These are (1) manufacturing, (2) washing and (3) operation. The
primary outputs that will be discussed are the emissions to air which will be classified,
later in this chapter, according to three different impact categories.
Emissions to air consist of two primary types that are organic and inorganic. Organic
emissions are chemical compounds that contain carbon (not metal carbonate, hydrogen
carbonate or cyanides), whereas inorganic emissions are compounds that do not contain
carbon or hydrogen bonds. The organic emissions to air, considered in this study, are
halogenated organic emissions to air, methane and Volatile Organic Compounds (VOC).
The inorganic emissions are ammonia, carbon dioxide, hydrogen chloride, hydrogen
sulphide, nitrogen oxides, nitrous oxides and sulphur oxides.
GaBi’s weak point analysis tool was used to filter out insignificant small emission
contributors that are not displayed in the results. This is a feature of GaBi that identify
the weak points of the life cycle that are that main contributors to the environmental
impacts.

Chapter 7 Life Cycle Impact Assessment Industrial Engineering
Page 44
University of Stellenbosch Department of Industrial Engineering
Table 7: Organic and Inorganic Emissions for the En tire Life Cycle
Values in kg Manufacturing Mirror Washing Operation INORGANIC EMISIONS 42 933 704.114 5 592 085.823 4 784 148.722 Ammonia 225.412 68.912 32.777 Carbon Dioxide 42 726 815.438 5 544 850.144 4 774 133.910 Hydrogen Chloride 1 459.770 13.783 41.781 Hydrogen Sulphide 835.187 10.597 3.462 Nitrogen Oxides 99 093.256 43 043.918 4 509.401 Nitrous Oxide 10 454.583 201.207 172.008 Sulphur Dioxide 94 820.468 3 897.261 5 255.384 ORGANIC EMMISIONS 126 991.134 7 942.216 8 162.064 Halogenated organic emissions to air 3.459 0.260 1.062 Methane 126 364.518 7 940.480 8 160.549
VOC (unspecified) 623.157 1.476 0.453
The table above shows the raw results calculated by GaBi. From the table it can be seen
that the manufacturing process is responsible for approximately 80% of the total
emissions. This is understandable considering that mirror washing and heliostat
operation only utilize deionised water and electricity respectively. The potential for
decreasing the life cycle emissions is definitively in the manufacturing process, since
new, more efficient, manufacturing processes are developing and different heliostat
designs can be considered.
Two methods are used in this report to interpret the raw results. The first method simply
compares the results obtained with the results from various other power plants that use
different technologies. The second method discusses the potential environmental effects
of the chosen emissions. This section is concluded with the comparison method while
the succeeding sections of this chapter focus on the potential environmental impacts.
The results used for comparison were obtained from GaBi by modelling different power
plant technologies using a referent value. The referent value for this comparison is MWh.
Since the functional unit for this study is 17 650 GWh of electricity, it was easy to
normalise the results to kilogram per MWh. This made it possible to calculate the
emissions for various different power plant technologies and compare it with each other.

Chapter 7 Life Cycle Impact Assessment Industrial Engineering
Page 45
University of Stellenbosch Department of Industrial Engineering
Table 8: Comparison of Different Power Plant Techno logies
Renewable Energy Non-renewable Energy
Values in kg/MWh SPT Wind Hydro Nuclear Natural
Gas Oil Coal Source Nation Calculated Germany Germany Global Germany Germany Germany Carbon Dioxide 3.005 6.090 24.290 28.838 506.034 869.862 901.212 Nitrogen Oxides 0.001 0.012 0.008 0.050 0.378 0.700 0.944 Sulphur Dioxide 0.006 0.017 0.002 0.118 0.189 1.692 0.812
The table above compare the emissions from solar power tower technology with other
power plant technologies. The emissions from the heliostats’ life cycle are assumed to
be the major contributor to emissions resulting from solar power towers, although the
physical tower may have some significant contributions as well. This statement is
supported by studies done by current final year students on the other parts of solar
power tower technologies. Their studies concluded minimal emission contribution
relative to the result obtained in this study. Therefore the SPT emissions are a result of
only the heliostats’ life cycle’s emissions.
All the results for the power plant technologies used for comparison, except the nuclear
plant, were obtained from a German database that GaBi uses. The German data was
used since most of the processes modelled in GaBi, for purposes of this study, use data
from Germany by default. This ensures an accurate comparison since the source of the
data is mostly the same.
The table is divided into two types of power plants, those who use renewable energy as
fuel and those who use non-renewable fuel as energy source. Renewable energy is
energy which comes from natural resources such as solar radiation, wind, tides,
geothermal heat, and hydropower, which are naturally replenished. Non-renewable
energy comes from natural gas, nuclear power, and more conventional resources such
as oil and coal.
From the comparison table it can be seen that solar power towers are indeed a clean
source of generating electricity, with only 3 kg of CO2 released per MWh. Even in
comparison with other renewable energy sources this is relatively low. The only non-
renewable source of energy that can compete with renewable energy, in terms of

Chapter 7 Life Cycle Impact Assessment Industrial Engineering
Page 46
University of Stellenbosch Department of Industrial Engineering
emissions released, is nuclear power. Other non-renewable sources of energy, such as
natural gas, oil and coal power plants are very environmentally unfriendly with emission
as high as 900 kg/MWh released into the air resulting from coal power plants.
There are many factors that can decrease SPTs emission per MWh even more. These
include the manufacturing of heliostats, different designs, material specification and
washing methods. If these processes improve to increase the efficiency of heliostat field
it would be possible to produce energy that is even cleaner than the energy currently
generated by SPTs.
7.2 Impact Categories
This section focuses on the different environmental categories that are impacted by the
emissions released during the life cycle of the studied product. The quantity of emissions
gives a false idea of how clean the energy is if the potential environmental impacts of the
different emissions aren’t understood. Three impact categories were identified for this
LCA study. These categories include (1) global warming potential (GWP), (2)
acidification potential (AP) and (3) eutrophication potential (EP).
The identified categories reflect a comprehensive set of environmental issues related to
the studied product since the goal and scope of the study was taken into consideration
throughout the identification process.
7.2.1 Global Warming Potential (GWP)
Gases that contribute to GWP are known as greenhouse gasses because of the
greenhouse effect, which can be observed on a small scale, as the name suggest, in a
greenhouse. The GWP of these greenhouse gasses are calculated in carbon dioxide
equivalents (CO2-Eq.). Since CO2 is the referent unit it has a GWP of 1. The GWP of a
greenhouse gas is used as reference of how much heat is trapped by a gas relative to
the amount of heat trapped by the same amount of carbon dioxide in a certain amount of
time. (GaBi Education, 2011)
The GWP of a gas depends on three factors, (1) the absorption of infrared radiation, (2)
the spectral location of its absorbing wavelengths, and (3) the atmospheric lifetime of the
gas. A high GWP correlates with a large infrared absorption and a long atmospheric

Chapter 7 Life Cycle Impact Assessment Industrial Engineering
Page 47
University of Stellenbosch Department of Industrial Engineering
lifetime. The occurring short-wave radiation from the sun comes into contact with the
earth’s surface and is partly absorbed and partly reflected as infrared radiation. The
absorbed part directly leads to global warming while the reflected part is absorbed by the
greenhouse gasses in the troposphere and is reradiated back in all directions, including
back to earth. This results in the warming effect at the earth’s surface. (GaBi Education,
2011)
Figure 21: The Greenhouse Effect
Source: Pidwirny, 2006
Since the GWP of a gas depends on its lifetime, the studied time span should be stated
to use as reference for the calculation. This is because a greenhouse gas which is
quickly removed from the atmosphere may initially have a large effect but for longer time
periods as it has been removed becomes less important. An example of this is the GWP
of methane which is 25 over 100 years, but 72 over 20 years. A time horizon of 100
years has been chosen for this study since it’s commonly used by regulators. (GaBi
Education, 2011)

Chapter 7 Life Cycle Impact Assessment Industrial Engineering
Page 48
University of Stellenbosch Department of Industrial Engineering
7.2.2 Acidification Potential (AP)
The acidification of soils and waters is a natural process that occurs predominately
through the transformation of air pollutant into acids. This leads to the decrease of the
pH-value of rainwater and fog from 5.6 to 4 and below. The AP is given in sulphur
dioxide equivalents (SO2-Eq.). Since SO2 is the referent unit it has an AP of 1. (GaBi
Education, 2011)
The AP is described as the ability to of certain substances to build and release H+-ions.
Certain emissions can also be considered to have an AP, if the given sulphur, nitrogen
and halogen atoms are set in proportion to the molecular mass of the emission (GaBi
Education, 2011). An example of this is atmospheric pollution arising from anthropogenic
gasses derived from sulphur and nitrogen. These pollutant depositions enhance the
rates of acidification, which may then exceed the natural neutralising capacity of soils.
(Pidwirny, 2006)
Figure 22: Acidification Potential
Source: Pidwirny, 2006

Chapter 7 Life Cycle Impact Assessment Industrial Engineering
Page 49
University of Stellenbosch Department of Industrial Engineering
The environmental impacts of acidification are one of the major contemporary
environmental issues. These impacts can be divided into two categories namely direct
and indirect impacts. Direct acidification affects all aspects of the natural environment
including soils, waters, flora and fauna. Indirect damaging effects include nutrients being
washed out of soils or an increased solubility of metals into soil. Even buildings and
building materials can be damaged by corrosion or disintegration that is increased by
acidification. (GaBi Education, 2011)
7.2.3 Eutrophication Potential (EP)
Eutrophication is the enrichment of nutrients in a certain place. Air pollutants, waste
water and fertilization in agriculture all contribute to eutrophication. The EP is calculated
in phosphate equivalents (PO4-Eq.). Since PO4 is the referent unit it has an EP of 1.
(GaBi Education, 2011)
Figure 23: Eutrophication Potential
Source: Joshua, Hoffmeier. 2010

Chapter 7 Life Cycle Impact Assessment Industrial Engineering
Page 50
University of Stellenbosch Department of Industrial Engineering
The impacts if eutrophication can be divided into two main categories namely aquatic
and terrestrial eutrophication. The result of aquatic eutrophication is accelerated algae
grow in water which prevents sunlight from reaching the lower depths, ultimately
decreasing photosynthesis which leads to less oxygen production. In addition, oxygen is
needed for the decomposition of dead algae. Both of these effects cause a decrease in
oxygen concentration in the water, which can lead to fish dying and to anaerobic
decomposition. Hydrogen sulphide and methane are thereby produced which can lead to
the destruction of the eco-system. (GaBi Education, 2011)
The result of terrestrial eutrophication is an increased susceptibility of plants to diseases
and pests. This affects the stability of the fauna in the environment. If the nitrification
level exceeds the amounts of nitrogen necessary for maximum harvest, it can lead to the
enrichment of nitrate. The nitrate content in the groundwater can increase and also ends
up in drinking water. Nitrate at low levels is harmless from a toxicological point of view.
However, if the nitrate reacts and form nitrite, it is toxic to humans. (GaBi Education,
2011)
7.3 Classification of Emissions
It is difficult to interpret the results of the LCI when the impact of each emission on the
environment is not clear. This is why three environmental impact categories were
identified. The impact of these categories has been discussed previously in this chapter.
The different types of emissions must be categories to determine their specific
environmental impact.
The following table classify each of the emissions, which were selected for this study,
according to the impact category that they contribute to. This relevant category is
denoted by an “X”. The organic emissions contribute only to GWP since its carbon
based. It is important to note that some of the inorganic emissions such as ammonia,
nitrogen oxides, nitrous oxides and sulphur dioxide, contribute to more than one impact
category, thus making it even more harmful to the environment.

Chapter 7 Life Cycle Impact Assessment Industrial Engineering
Page 51
University of Stellenbosch Department of Industrial Engineering
Table 9: Classification of the Different Emissions
GWP AP EP INORGANIC EMISIONS Ammonia X X Carbon Dioxide X Hydrogen Chloride X Hydrogen Sulphide X Nitrogen Oxides X X Nitrous Oxide X X Sulphur Dioxide X ORGANIC EMMISIONS Halogenated organic emissions to air X Methane X
VOC (unspecified) X
Reference Unit kg CO 2 -Equivalent
kg SO 2 -Equivalent
kg PO 4 -Equivalent
7.4 Characterization
This is the final step in the life cycle impact assessment (LCIA). The impact categories
have been identified and the emissions have been classified. This section quantifies the
magnitude of the emissions in each impact in terms of the reference unit for each
category. Characterization factors are applied to the relevant quantities to determine the
magnitude of the environmental impact. The table below shows the impact if the
greenhouse gasses quantified in terms of kg CO2-equivalent for the GWP category.
Table 10: Characterization of the Emissions for GWP
kg CO 2-Equivalent Manufacturing Mirror Washing Operation INORGANIC EMISIONS 45 842 281.100 5 604 809.842 4 825 392.146 Ammonia - - - Carbon Dioxide 42 726 815.438 5 544 850.144 4 774 133.910 Hydrogen Chloride - - - Hydrogen Sulphide - - - Nitrogen Oxides - - - Nitrous Oxide 3 115 465.662 59 959.698 51 258.236 Sulphur Dioxide - - - ORGANIC EMMISIONS 3 195 915.149 200 393.451 212 028.415 Halogenated organic emissions to air 26 769.386 1 857.687 8 007.392 Methane 3 159 112.939 198 512.002 204 013.733 VOC (unspecified) 10 032.824 23.762 7.290

Chapter 7 Life Cycle Impact Assessment Industrial Engineering
Page 52
University of Stellenbosch Department of Industrial Engineering
From the GWP table it is clear that there are three major contributors to the GWP of the
system, with carbon dioxide alone contributing to more than 80% of the total kg CO2-
equivelant. The other two emissions that are a concern are the nitrous oxide and
methane emissions with characterization factors of 298 and 25 respectively. The high
factors explain the large difference between the original mass and the CO2-equivalent.
Table 11: Characterization of the Emissions for AP
kg SO 2-Equivalent Manufacturing Mirror Washing Operation INORGANIC EMISIONS 167 464.271 34 189.610 8 516.861 Ammonia 423.774 129.554 61.620 Carbon Dioxide - - - Hydrogen Chloride 1 284.598 12.129 36.768 Hydrogen Sulphide 1 570.152 19.923 6.509 Nitrogen Oxides 69 365.280 30 130.743 3 156.581 Nitrous Oxide - - - Sulphur Dioxide 94 820.468 3 897.261 5 255.384 ORGANIC EMMISIONS 0.000 0.000 0.000 Halogenated organic emissions to air - - - Methane - - -
VOC (unspecified) - - -
From the AP table above, it is clear that there are two major contributors to the AP of the
system, with nitrogen oxide and sulphur dioxide each contributing to almost 50% of the
total kg SO2-equivelant respectively. Sulphur dioxide has a characterization factor of 1
since it’s the referent unit, and for nitrous oxide the factor’s 0.7.
From the following EP table, it can be seen that there are only three of the selected
emissions that contribute to the EP of the system. Nitrogen oxides is the major concern
since it alone contributes to more than 85% of the PO4-equivalent. Although the
characterization factor for the nitrogen oxides is only 0.13, the large quantity that is
released into the air is alarming.

Chapter 7 Life Cycle Impact Assessment Industrial Engineering
Page 53
University of Stellenbosch Department of Industrial Engineering
Table 12: Characterization of the Emissions for EP
kg PO 4-Equivalent Manufacturing Mirror Washing Operation INORGANIC EMISIONS 15 783.755 5 674.154 644.136 Ammonia 78.894 24.119 11.472 Carbon Dioxide - - - Hydrogen Chloride - - - Hydrogen Sulphide - - - Nitrogen Oxides 12 882.123 5 595.71 586.222 Nitrous Oxide 2 822.737 54.326 46.442 Sulphur Dioxide - - - ORGANIC EMMISIONS 0.000 0.000 0.000 Halogenated organic emissions to air - - - Methane - - -
VOC (unspecified) - - -
From these three tables the conclusion can be made that there are three major
emissions that are of concern. These three emissions are respectively used as the
reference unit for the three different impact categories. The three are carbon dioxide,
causing GWP concern, sulphur dioxide, causing AP concern, and nitrogen oxides,
causing both AP as well as EP concern.
It is recommended that each part of the heliostats’ life cycle is divided into the most basic
of processes to find the root cause of these emissions. Although these emissions are the
lowest of all power sources discussed in the first part of this chapter, there are still room
for improvement since this technology is still not entirely environmental friendly. This
creates the opportunity for future research in this field.

Chapter 8 Conclusion Industrial Engineering
Page 54
University of Stellenbosch Department of Industrial Engineering
8. Conclusion
In this final year project a life cycle assessment (LCA) model was developed in GaBi to
determine the impact of a heliostat field for a 100 MW power tower. In the field of energy
generation, it is important to considered sustainability and cleanliness of the technology.
Hence; the LCA that was done on the heliostats needed to fuel the power tower can be
used to see the magnitude of the environmental impact that implementation of this
technology will have. However, the results obtained are mostly based on data from
Germany because of the lack of other data sources in GaBi.
In this LCA it can be seen that carbon dioxide, sulphur dioxide and nitrogen oxides are
the emissions that have the greatest environmental impact in their different
environmental impact categories respectively. The manufacturing of the heliostats
contribute to more than 80% of the emissions. This creates the opportunity to look at the
improvement of this process.
This LCA forms a basis on which further research and assessments can be done. The
assessment can be more in-depth than the current LCA by breaking the three main
processes down into their most basic processes. Each process can then be individually
assessed to determine the root cause of the majority of emissions.
Reliable data is recommended, because some of the data in this LCA was assumed
because of proprietary rights and inaccessibility of data.
Taking all of these factors into account, the conclusion that is made is that the use of
solar power towers is one of the cleanest methods of generating energy, relative to other
technologies. It is more sustainable and helpful towards the environment. Thus it is
indeed a “green” technology.

References Industrial Engineering
Page 55
University of Stellenbosch Department of Industrial Engineering
References
Alexis, B.Z. 2001, "Solar power tower design basis document", Sandia National
Laboratories.doi, vol. 10, pp. 786629.
Berman, G.S, Structural Steel Design And Construction [Homepage of Greyhawk],
[Online]. Available:
http://www.greyhawk.com/news/technical/Design_Structural_Steel_Design_and_Constru
ction.pdf [2011, 10/10].
DANTES 2006, More about LCA. Available:
http://www.dantes.info/Tools&Methods/Environmentalassessment/enviro_asse_lca_detai
l.html [2011, 7/18/2011].
Education, G.B. 2011, "Handbook for Life Cycle Assessment (LCA)", Using the GaBi
Education Software Package, PE International, .
Falcone, P.K. 1986, A handbook for solar central receiver design, Sandia National Labs.,
Livermore, CA (USA).
Glass Association of North America, Glass in Today’s Architecture [Homepage of
GANA], [Online]. Available:
http://www.glasswebsite.com/aia/Glass%20in%20Today%27s%20Architecture.pdf
[2011, 10/01].
Groenendaal, B.J. 2007, "Solar thermal power technologies", PDF).Monograph in the
framework of the VLEEM Project.Energy research Centre of the Netherlands:
ECN.http://www.ecn.nl/docs/library/report/2002/c02062.pdf.Retrieved on, , pp. 03-30.
Industrial Glass Technologies LLC 2007, , Low Iron & Solar [Homepage of Industrial
Glass Technologies LLC], [Online]. Available:
http://www.industrialglasstech.com/lowiron.html [2011, September].

References Industrial Engineering
Page 56
University of Stellenbosch Department of Industrial Engineering
ISO 2006, "14040: Environmental management–life cycle assessment—Principles and
framework", International organization for standardization, .
Joshua, P.M. & Hoffmeier, A. 2010, 11/04/2011-last update, Eutrophication [Homepage
of Appropedia], [Online]. Available:
http://www.cd3wd.com/cd3wd_40/ap/Eutrophication.html [September, 10/01].
Kalogirou, S.A. 2004, "Solar thermal collectors and applications", Progress in Energy
and Combustion Science, vol. 30, no. 3, pp. 231-295.
Kolb, G.J., Jones, S.A., Donnelly, M.W., Gorman, D., Thomas, R., Davenport, R. &
Lumia, R. 2007, "Heliostat Cost Reduction Study", SAND2007-3293, Sandia National
Laboratory, Albuquerque, NM, USA, June, .
Mahrenholtz, H. 2009, , The solar glass challenge [Homepage of Linde], [Online].
Available: http://linde-electronics.com/files/solar/Glass%20-%20H.Mahrenholtz.pdf
[2011, 10/01].
Mancini, T.R. 2000, "Catalog of Solar Heliostats", IEA SolarPACES Report, vol. 3, no. 1,
pp. 00.
Mavis, C.L. 1989, A description and assessment of heliostat technology, Sandia National
Labs., Livermore, CA (USA).
Meier, A, Gremaud, N. & Steinfeld, A. 2005, "Economic evaluation of the industrial solar
production of lime", Energy conversion and management, vol. 46, no. 6, pp. 905-926.
Miettinen, P. & Hamalainen, R.P. 1997, "How to benefit from decision analysis in
environmental life cycle assessment (LCA)", European Journal of Operational Research,
vol. 102, no. 2, pp. 279-294.
Müller-Steinhagen, H. 2004, "Concentrating solar power"

References Industrial Engineering
Page 57
University of Stellenbosch Department of Industrial Engineering
Nalukowe, B.B., Liu, J., Damien, W. & Lukawski, T. 2006, "Life cycle assessment of a
wind turbine", Retrieved October, vol. 11, pp. 2008.
NMT, NMT Heliostat Project [Homepage of New Mexico Tech], [Online]. Available:
http://infohost.nmt.edu/~helio/background.html [2011, 10/01].
Osuna, R., Fernandez, V., Romero, M. & Marcos, M.J. 2000, "PS10, A 10 MW Solar
Tower Power Plant for Southern Spain", Energy 2000: the beginning of a new millenium:
ENERGEX 2000: proceedings of the 8th International Energy Forum, Las Vegas, July
23-28 2000CRC, , pp. 386.
Owens, J.W. 1997, "Life‐Cycle Assessment: Constraints on Moving from Inventory to
Impact Assessment", Journal of Industrial Ecology, vol. 1, no. 1, pp. 37-49.
Pidwirny, M. 2006, "Acid Precipitation" in Fundamentals of Physical Geography, 2nd
Edition edn,.
Planet Ark a, Glass Recycling [Homepage of Planet Ark], [Online]. Available:
http://recyclingweek.planetark.org/documents/doc-184-glass-factsheet-2011.pdf [2011,
10/01].
Planet Ark b, Steel Recycling [Homepage of Planet Ark], [Online]. Available:
http://recyclingweek.planetark.org/documents/doc-184-glass-factsheet-2011.pdf [2011,
10/01].
Reilly, H.E. & Kolb, G.J. 2001, An Evaluation of Molten-Salt Power Towers Including
Results of the Solar Two Project, .
Strachan, J.W. & Houser, R.M. 1992, "Testing and evaluation of large-area heliostats for
solar thermal applications", Report SAND92-1381, Sandia National Laboratories,
Livermore

References Industrial Engineering
Page 58
University of Stellenbosch Department of Industrial Engineering
Wang, W., Conley, J.G. & Stoll, H.W. 1999, "Rapid Prototyping Journal", vol. 5, no. 2,
pp. 134.
Zarza, E., Valenzuela, L., León, J., Weyers, H., Eickhoff, M., Eck, M. & Hennecke, K.
2001, "The DISS Project: Direct Steam Generation in Parabolic Troughs: Operation and
Maintenance Experience-Update on Project Status", SOLAR ENGINEERING, pp. 419-
426.