Life-Cycle Assessment (LCA) - dartmouth.educushman/courses/engs171/LCA.pdf · 2 Life-Cycle...
21
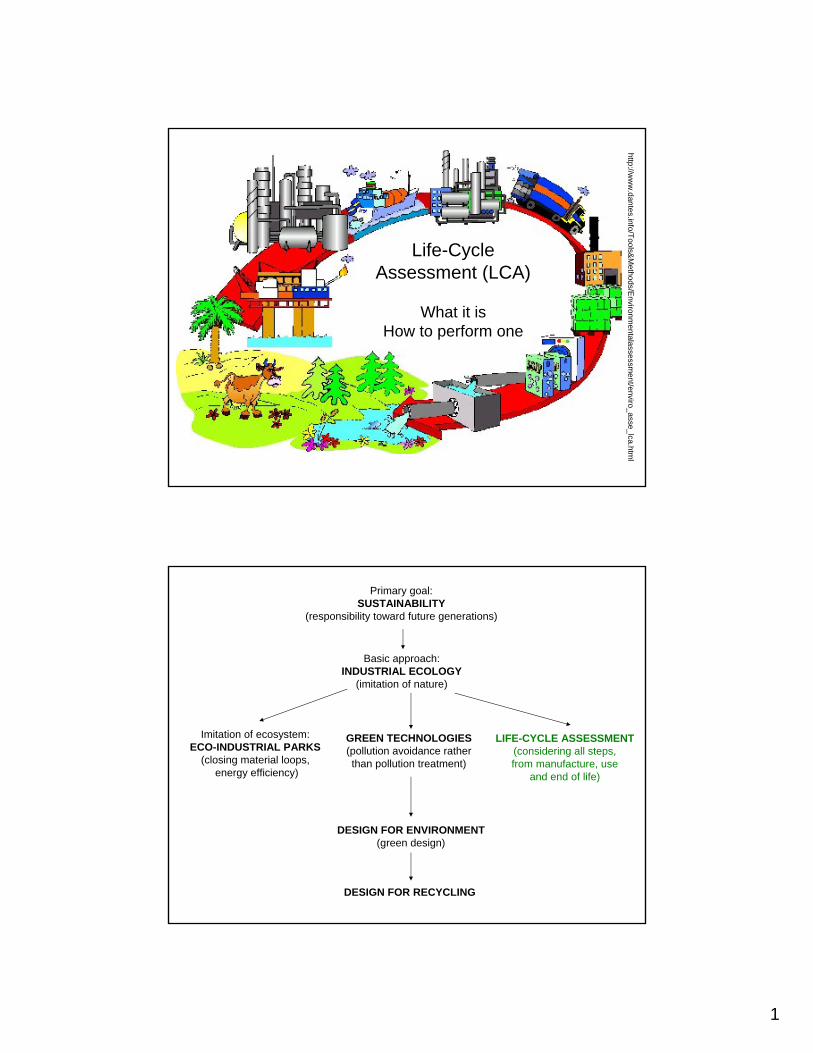
1 http://www.dantes.info/Tools&Methods/Environmentalassessment/enviro_asse_lca.html Life-Cycle Assessment (LCA) What it is How to perform one Primary goal: SUSTAINABILITY (responsibility toward future generations) GREEN TECHNOLOGIES (pollution avoidance rather than pollution treatment) DESIGN FOR ENVIRONMENT (green design) Basic approach: INDUSTRIAL ECOLOGY (imitation of nature) Imitation of ecosystem: ECO-INDUSTRIAL PARKS (closing material loops, energy efficiency) DESIGN FOR RECYCLING LIFE-CYCLE ASSESSMENT (considering all steps, from manufacture, use and end of life)
Transcript of Life-Cycle Assessment (LCA) - dartmouth.educushman/courses/engs171/LCA.pdf · 2 Life-Cycle...
1
http://ww
w.dantes.info/Tools&
Methods/E
nvironmentalassessm
ent/enviro_asse_lca.html
Life-Cycle Assessment (LCA)
What it isHow to perform one
Primary goal:SUSTAINABILITY
(responsibility toward future generations)
GREEN TECHNOLOGIES(pollution avoidance rather than pollution treatment)
DESIGN FOR ENVIRONMENT(green design)
Basic approach:INDUSTRIAL ECOLOGY
(imitation of nature)
Imitation of ecosystem:ECO-INDUSTRIAL PARKS
(closing material loops,energy efficiency)
DESIGN FOR RECYCLING
LIFE-CYCLE ASSESSMENT(considering all steps,from manufacture, use
and end of life)
2
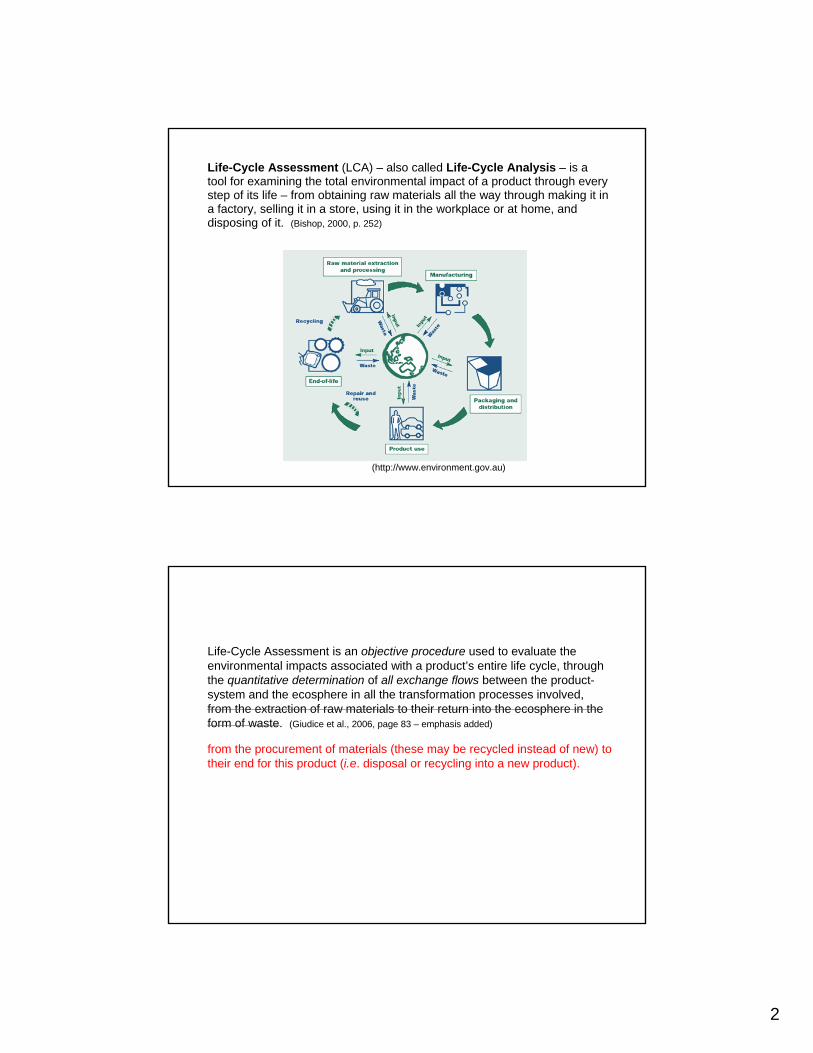
Life-Cycle Assessment (LCA) – also called Life-Cycle Analysis – is a tool for examining the total environmental impact of a product through every step of its life – from obtaining raw materials all the way through making it in a factory, selling it in a store, using it in the workplace or at home, and disposing of it. (Bishop, 2000, p. 252)
(http://www.environment.gov.au)
Life-Cycle Assessment is an objective procedure used to evaluate the environmental impacts associated with a product’s entire life cycle, through the quantitative determination of all exchange flows between the product-system and the ecosphere in all the transformation processes involved, from the extraction of raw materials to their return into the ecosphere in the form of waste. (Giudice et al., 2006, page 83 – emphasis added)
from the procurement of materials (these may be recycled instead of new) to their end for this product (i.e. disposal or recycling into a new product).
3
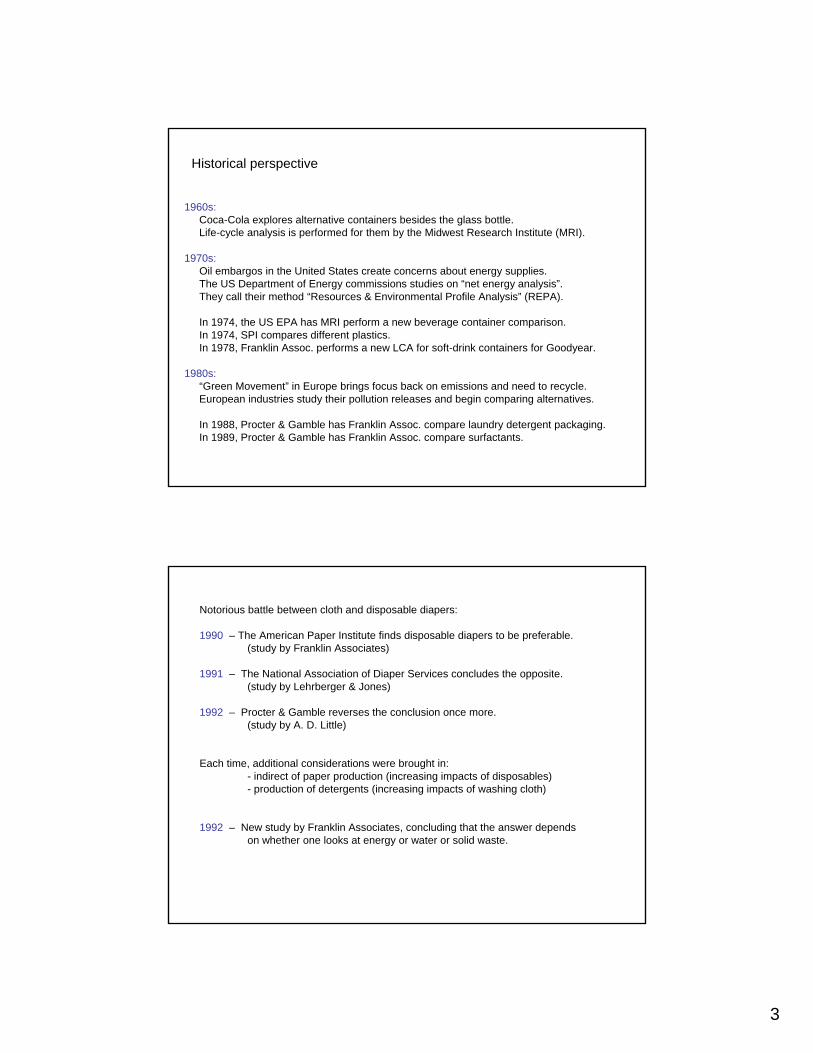
Historical perspective
1960s:Coca-Cola explores alternative containers besides the glass bottle.Life-cycle analysis is performed for them by the Midwest Research Institute (MRI).
1970s:Oil embargos in the United States create concerns about energy supplies.The US Department of Energy commissions studies on “net energy analysis”.They call their method “Resources & Environmental Profile Analysis” (REPA).
In 1974, the US EPA has MRI perform a new beverage container comparison.In 1974, SPI compares different plastics.In 1978, Franklin Assoc. performs a new LCA for soft-drink containers for Goodyear.
1980s:“Green Movement” in Europe brings focus back on emissions and need to recycle.European industries study their pollution releases and begin comparing alternatives.
In 1988, Procter & Gamble has Franklin Assoc. compare laundry detergent packaging.In 1989, Procter & Gamble has Franklin Assoc. compare surfactants.
Notorious battle between cloth and disposable diapers:
1990 – The American Paper Institute finds disposable diapers to be preferable.(study by Franklin Associates)
1991 – The National Association of Diaper Services concludes the opposite.(study by Lehrberger & Jones)
1992 – Procter & Gamble reverses the conclusion once more.(study by A. D. Little)
Each time, additional considerations were brought in:- indirect of paper production (increasing impacts of disposables)- production of detergents (increasing impacts of washing cloth)
1992 – New study by Franklin Associates, concluding that the answer depends on whether one looks at energy or water or solid waste.
4
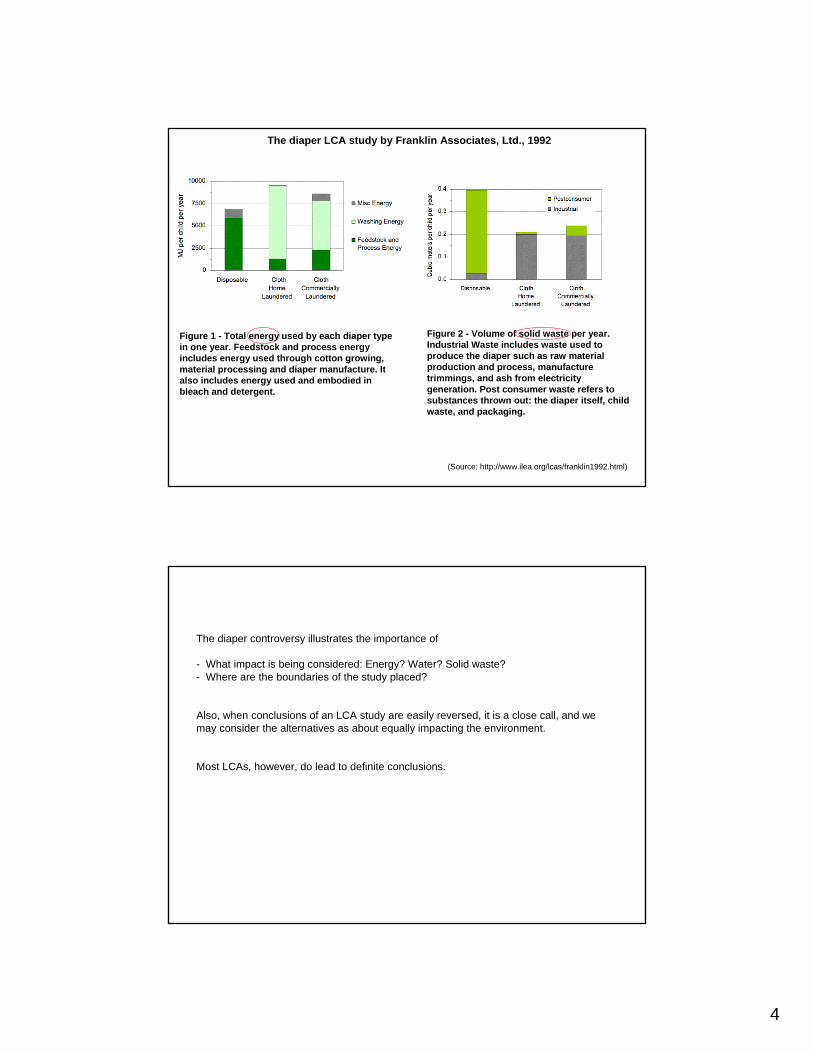
(Source: http://www.ilea.org/lcas/franklin1992.html)
Figure 2 - Volume of solid waste per year. Industrial Waste includes waste used to produce the diaper such as raw material production and process, manufacture trimmings, and ash from electricity generation. Post consumer waste refers to substances thrown out: the diaper itself, child waste, and packaging.
Figure 1 - Total energy used by each diaper type in one year. Feedstock and process energy includes energy used through cotton growing, material processing and diaper manufacture. It also includes energy used and embodied in bleach and detergent.
The diaper LCA study by Franklin Associates, Ltd., 1992
The diaper controversy illustrates the importance of
- What impact is being considered: Energy? Water? Solid waste?- Where are the boundaries of the study placed?
Also, when conclusions of an LCA study are easily reversed, it is a close call, and we may consider the alternatives as about equally impacting the environment.
Most LCAs, however, do lead to definite conclusions.

5
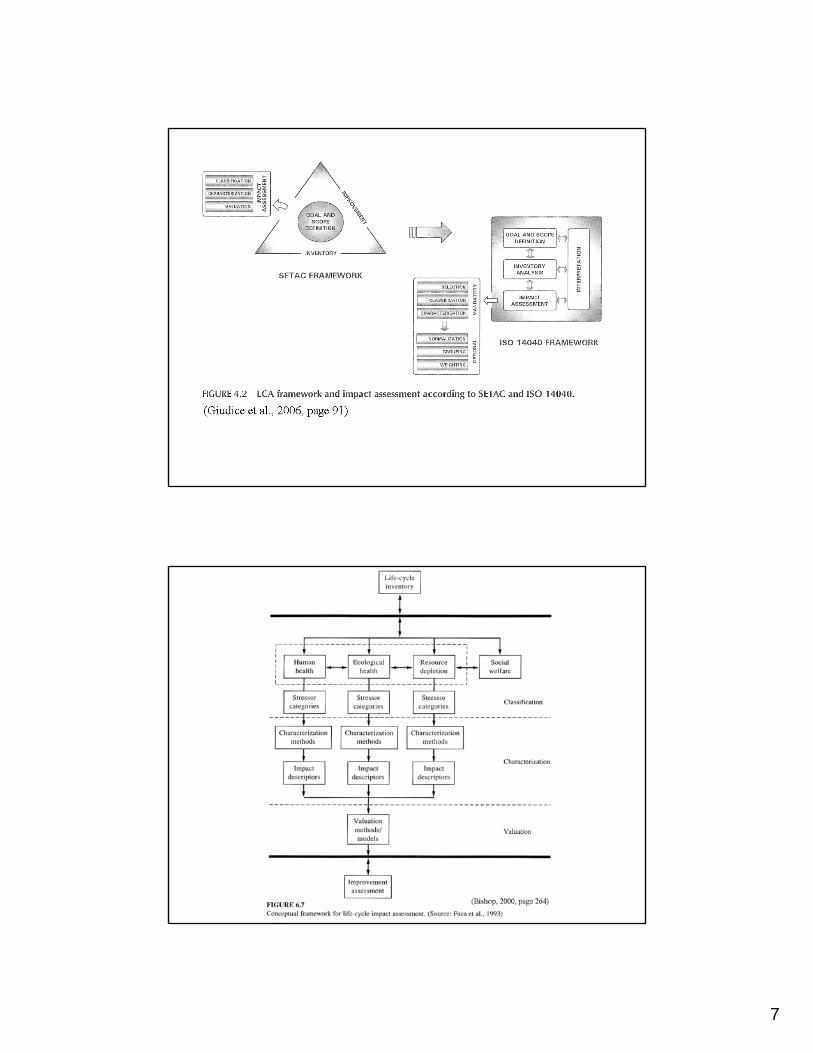
UNEP = United Nations Environmental ProgrammeSETAC = Society for Environmental Toxicology & ChemistryISO = International Standards Organization
6
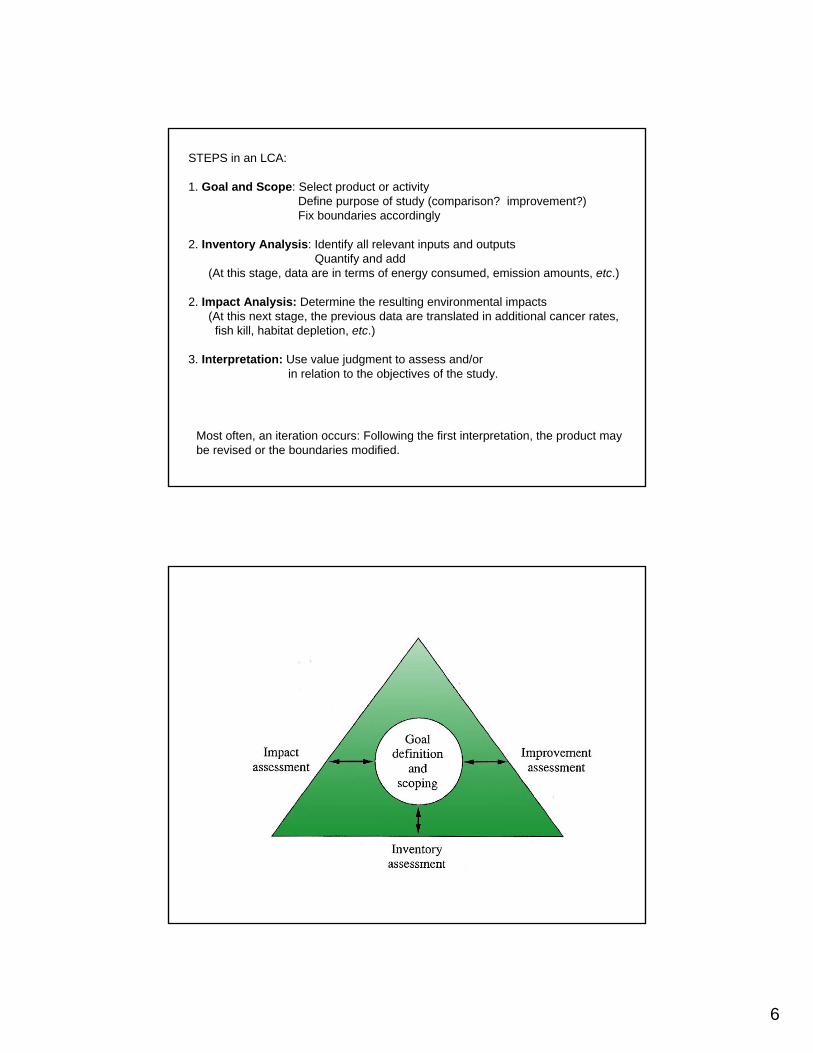
STEPS in an LCA:
1. Goal and Scope: Select product or activityDefine purpose of study (comparison? improvement?)Fix boundaries accordingly
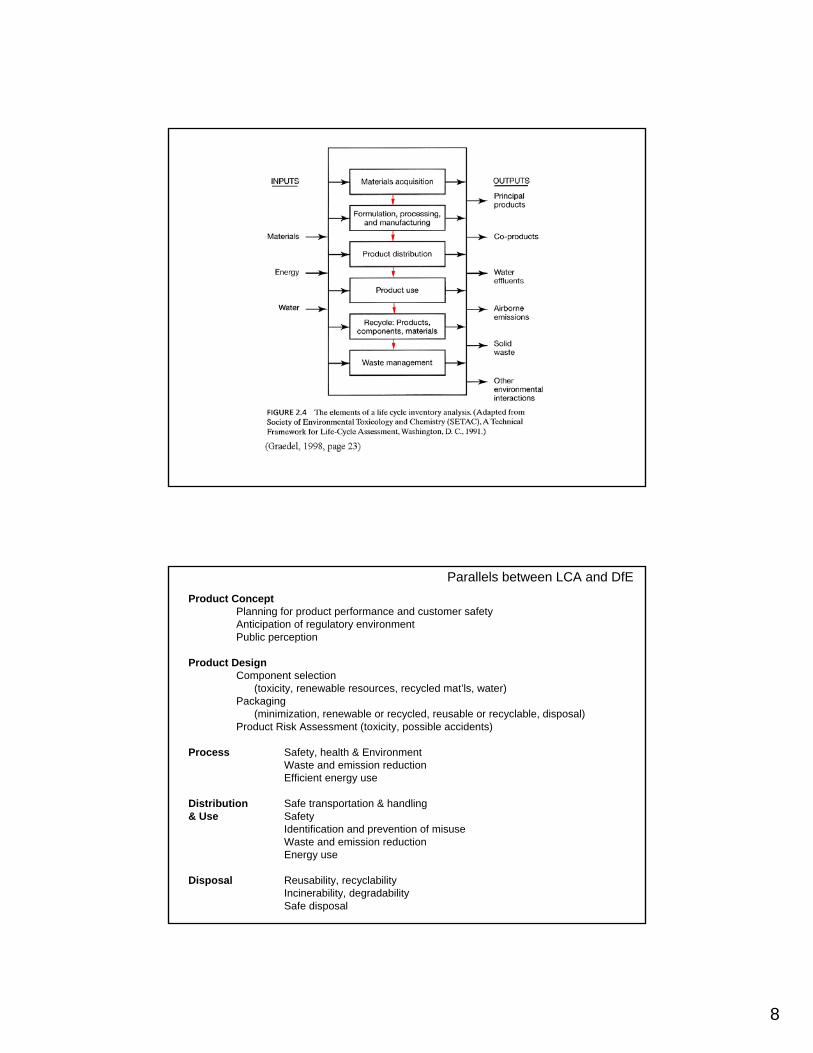
2. Inventory Analysis: Identify all relevant inputs and outputsQuantify and add
(At this stage, data are in terms of energy consumed, emission amounts, etc.)
2. Impact Analysis: Determine the resulting environmental impacts(At this next stage, the previous data are translated in additional cancer rates, fish kill, habitat depletion, etc.)
3. Interpretation: Use value judgment to assess and/or in relation to the objectives of the study.
Most often, an iteration occurs: Following the first interpretation, the product may be revised or the boundaries modified.
7
8
Product ConceptPlanning for product performance and customer safetyAnticipation of regulatory environmentPublic perception
Product DesignComponent selection
(toxicity, renewable resources, recycled mat’ls, water)Packaging
(minimization, renewable or recycled, reusable or recyclable, disposal)Product Risk Assessment (toxicity, possible accidents)
Process Safety, health & EnvironmentWaste and emission reductionEfficient energy use
Distribution Safe transportation & handling& Use Safety
Identification and prevention of misuseWaste and emission reductionEnergy use
Disposal Reusability, recyclabilityIncinerability, degradabilitySafe disposal
Parallels between LCA and DfE
9

10
Where boundaries may be placed in an LCA study of paper
11
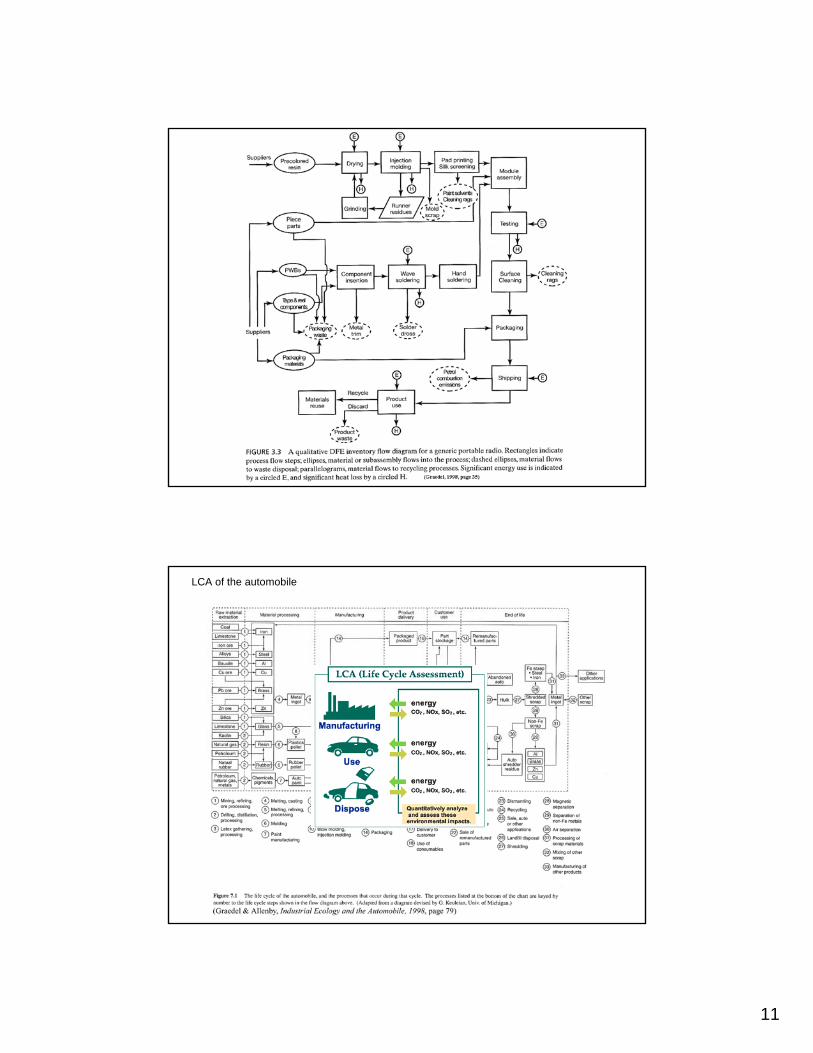
LCA of the automobile
12
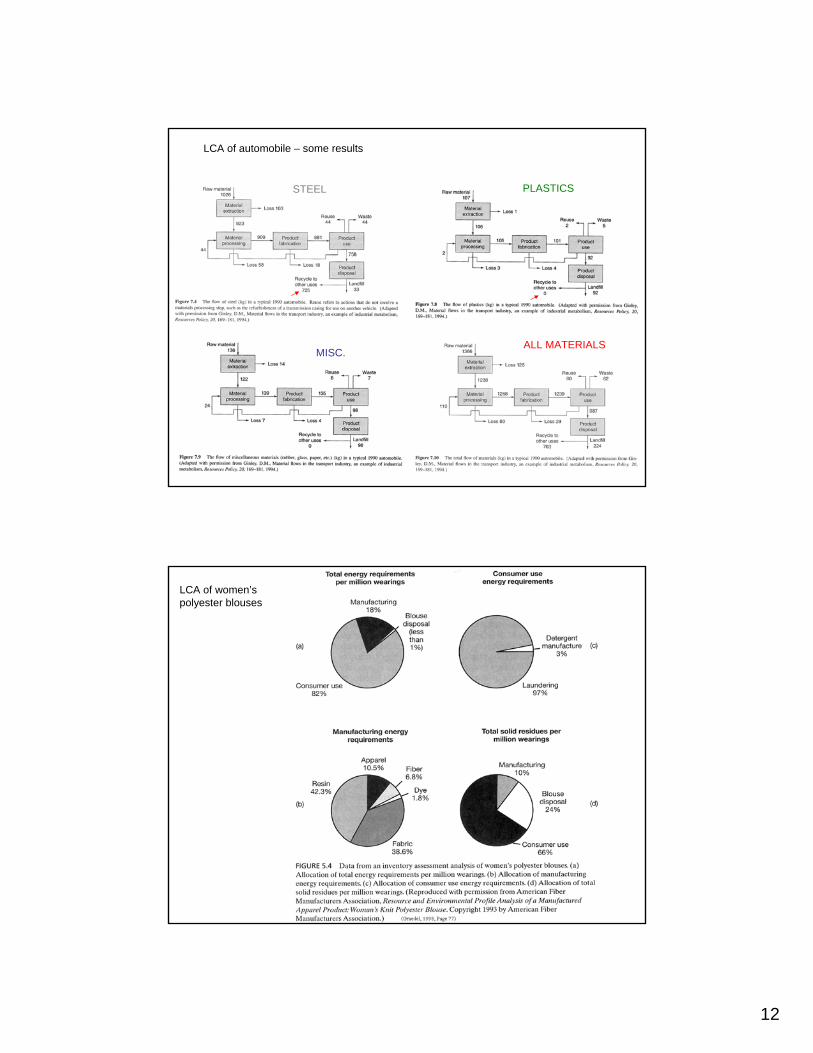
LCA of automobile – some results
STEEL PLASTICS
MISC.ALL MATERIALS
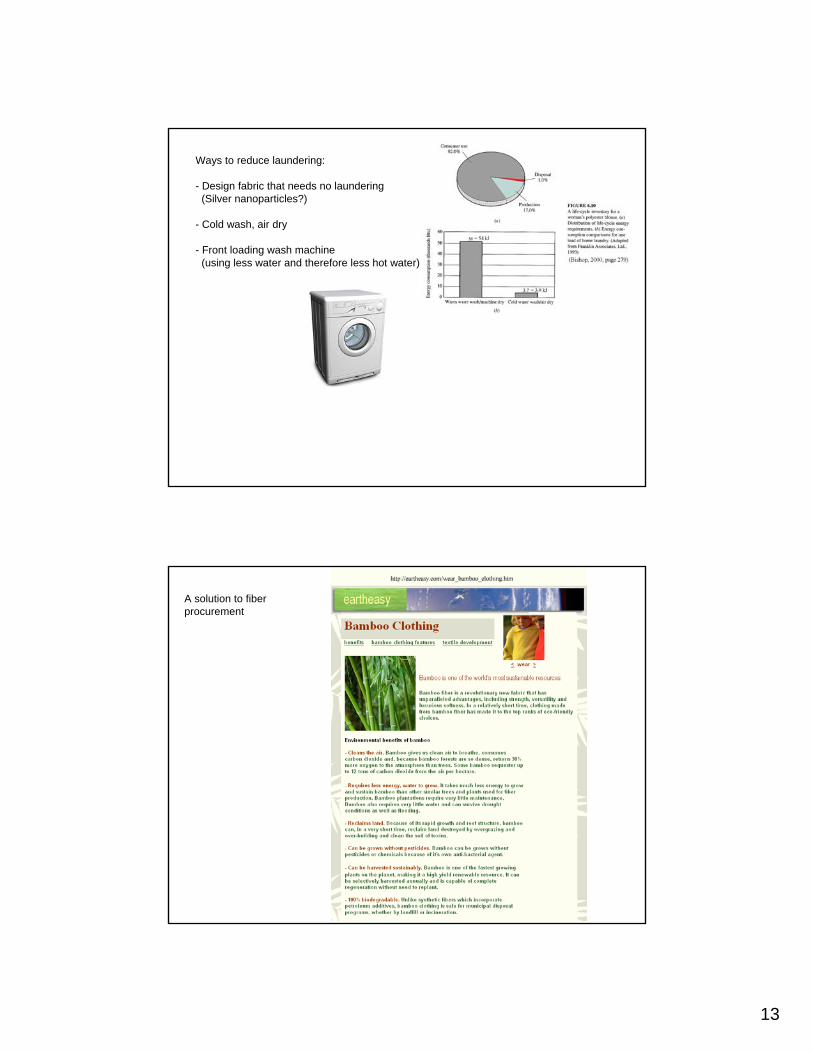
LCA of women’s polyester blouses
13
Ways to reduce laundering:
- Design fabric that needs no laundering(Silver nanoparticles?)
- Cold wash, air dry
- Front loading wash machine(using less water and therefore less hot water)
A solution to fiber procurement
14
15
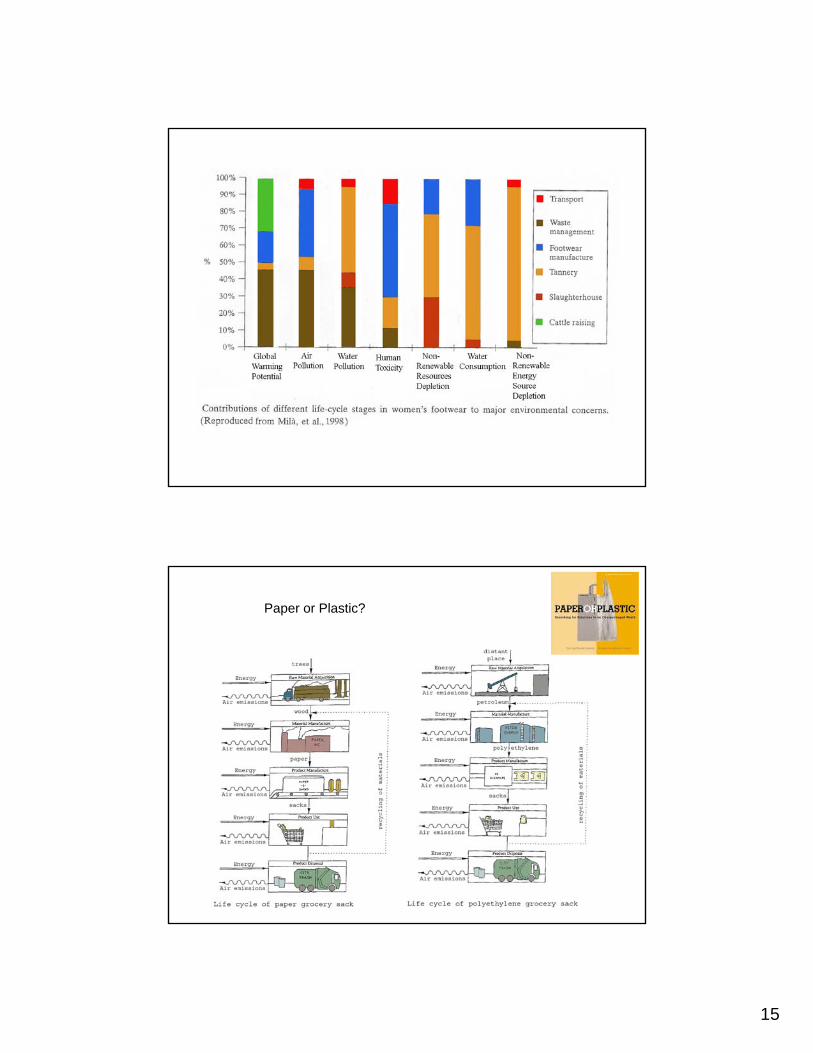
Paper or Plastic?
16
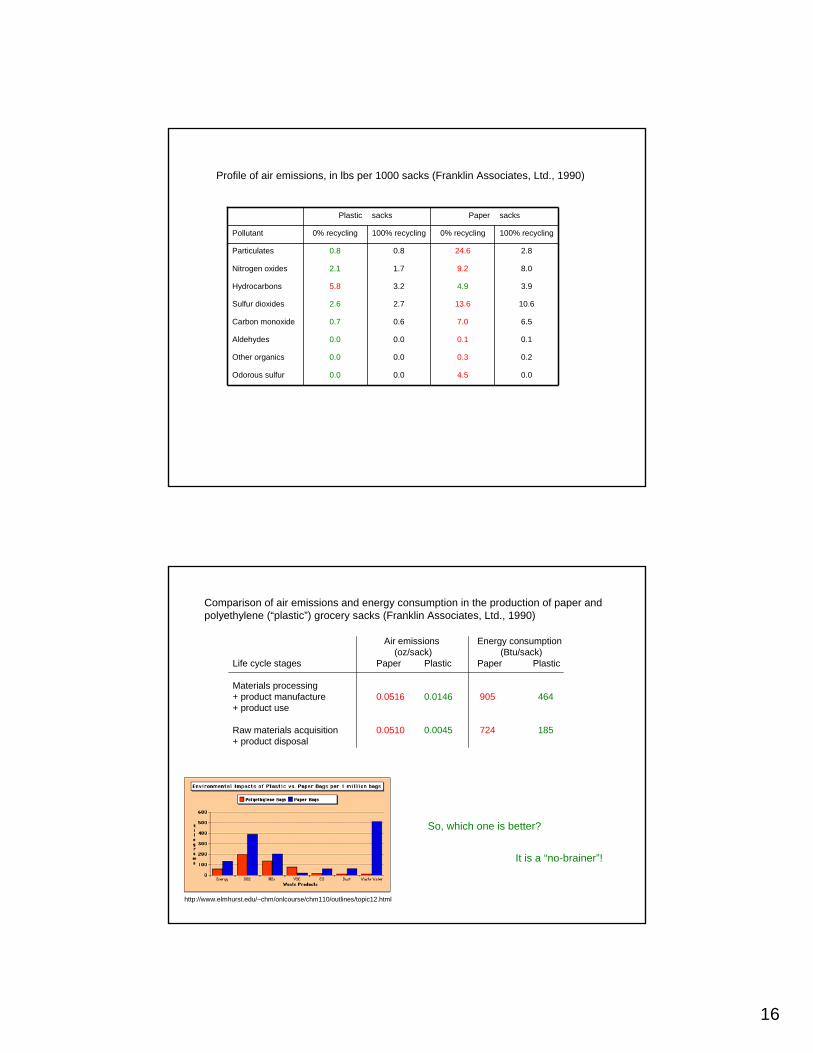
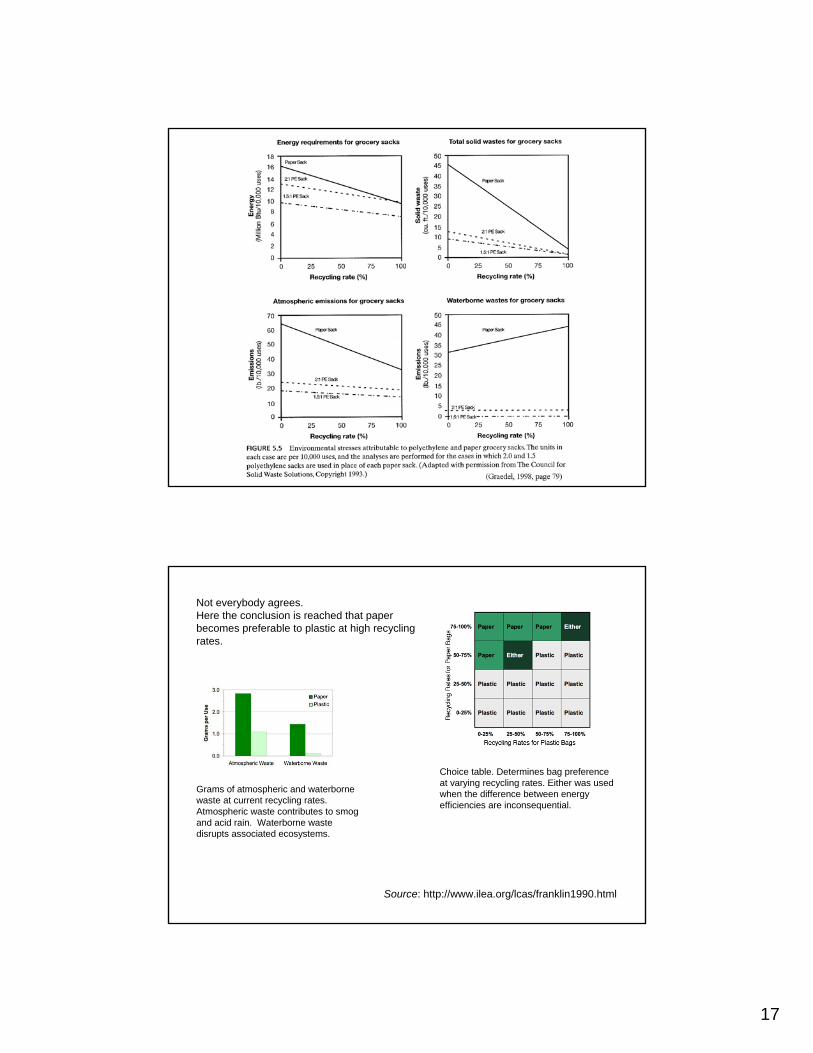
Profile of air emissions, in lbs per 1000 sacks (Franklin Associates, Ltd., 1990)
0.04.50.00.0Odorous sulfur
0.20.30.00.0Other organics
0.10.10.00.0Aldehydes
6.57.00.60.7Carbon monoxide
10.613.62.72.6Sulfur dioxides
3.94.93.25.8Hydrocarbons
8.09.21.72.1Nitrogen oxides
2.824.60.80.8Particulates
100% recycling0% recycling100% recycling0% recyclingPollutant
sacksPapersacks Plastic
Comparison of air emissions and energy consumption in the production of paper and polyethylene (“plastic”) grocery sacks (Franklin Associates, Ltd., 1990)
Air emissions Energy consumption(oz/sack) (Btu/sack)
Life cycle stages Paper Plastic Paper Plastic
Materials processing+ product manufacture 0.0516 0.0146 905 464+ product use
Raw materials acquisition 0.0510 0.0045 724 185+ product disposal
So, which one is better?
It is a “no-brainer”!
http://www.elmhurst.edu/~chm/onlcourse/chm110/outlines/topic12.html
17
Source: http://www.ilea.org/lcas/franklin1990.html
Choice table. Determines bag preference at varying recycling rates. Either was used when the difference between energy efficiencies are inconsequential.
Not everybody agrees.Here the conclusion is reached that paper becomes preferable to plastic at high recycling rates.
Grams of atmospheric and waterborne waste at current recycling rates. Atmospheric waste contributes to smog and acid rain. Waterborne waste disrupts associated ecosystems.
18
19
?http://w
ww
.ecojoes.com/styrofoam
-cups-vs-paper-cups/
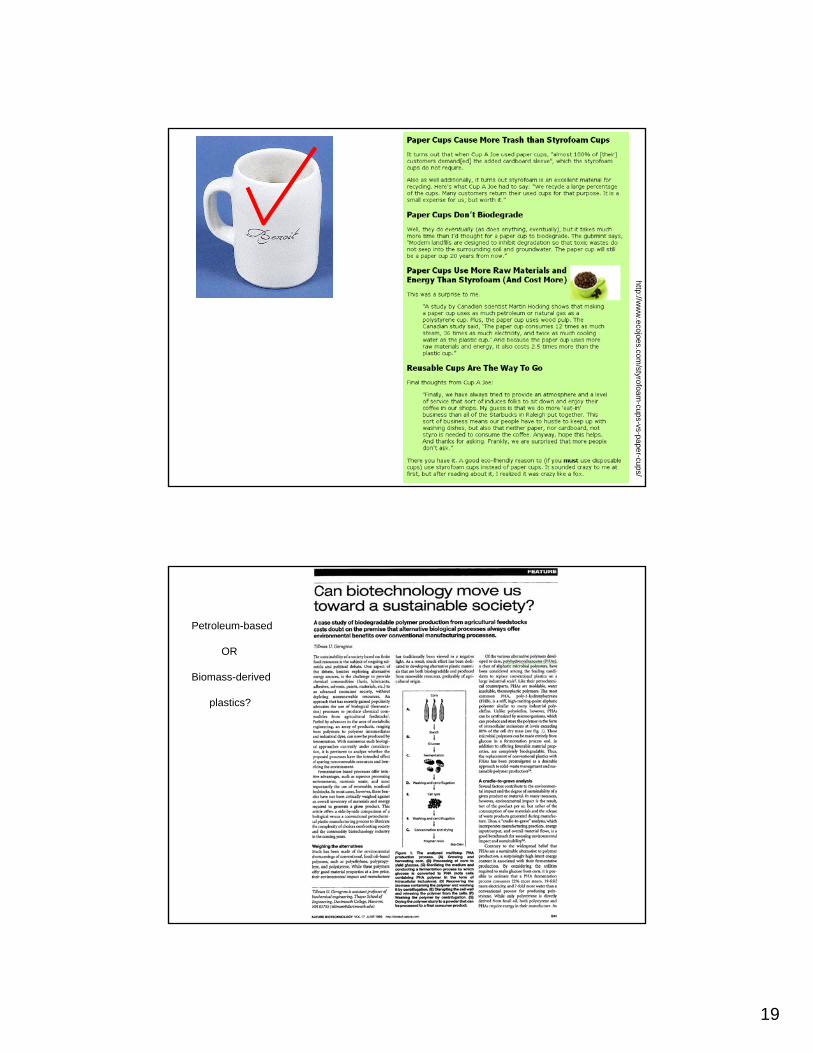
Petroleum-based
OR
Biomass-derived
plastics?
20
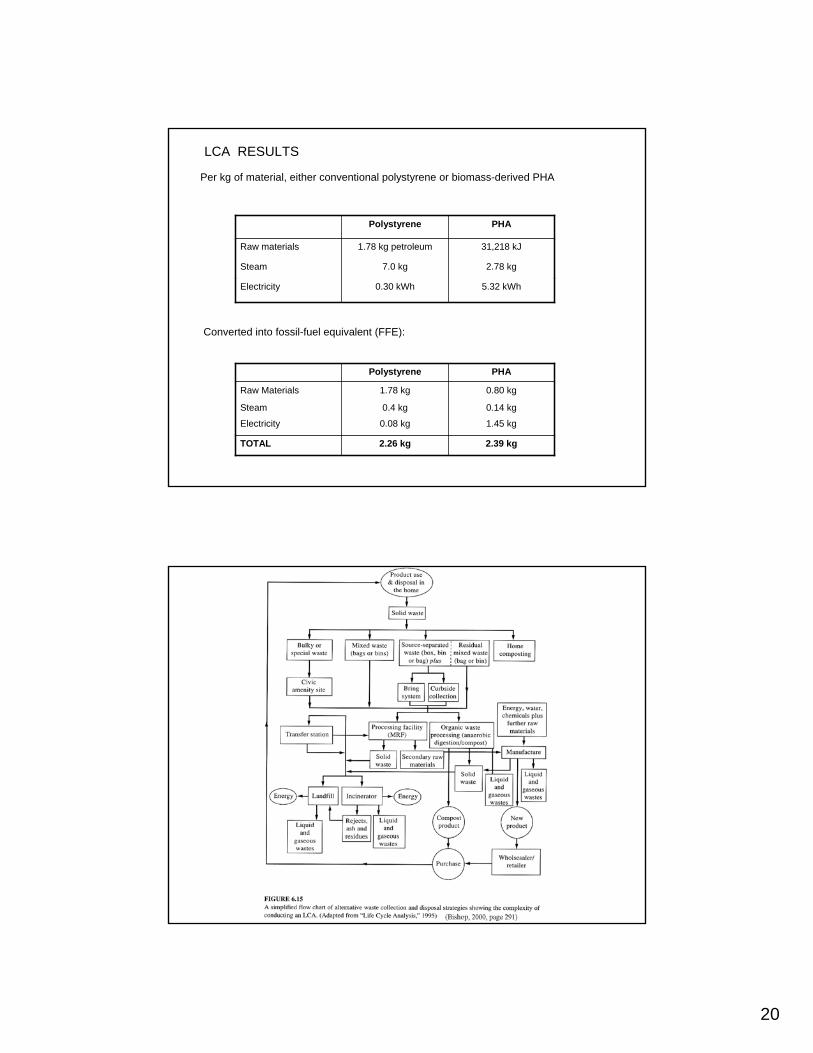
LCA RESULTS
2.39 kg2.26 kgTOTAL
1.45 kg0.08 kgElectricity
0.14 kg0.4 kgSteam
0.80 kg1.78 kgRaw Materials
PHAPolystyrene
Per kg of material, either conventional polystyrene or biomass-derived PHA
5.32 kWh0.30 kWhElectricity
2.78 kg7.0 kgSteam
31,218 kJ1.78 kg petroleumRaw materials
PHAPolystyrene
Converted into fossil-fuel equivalent (FFE):
21
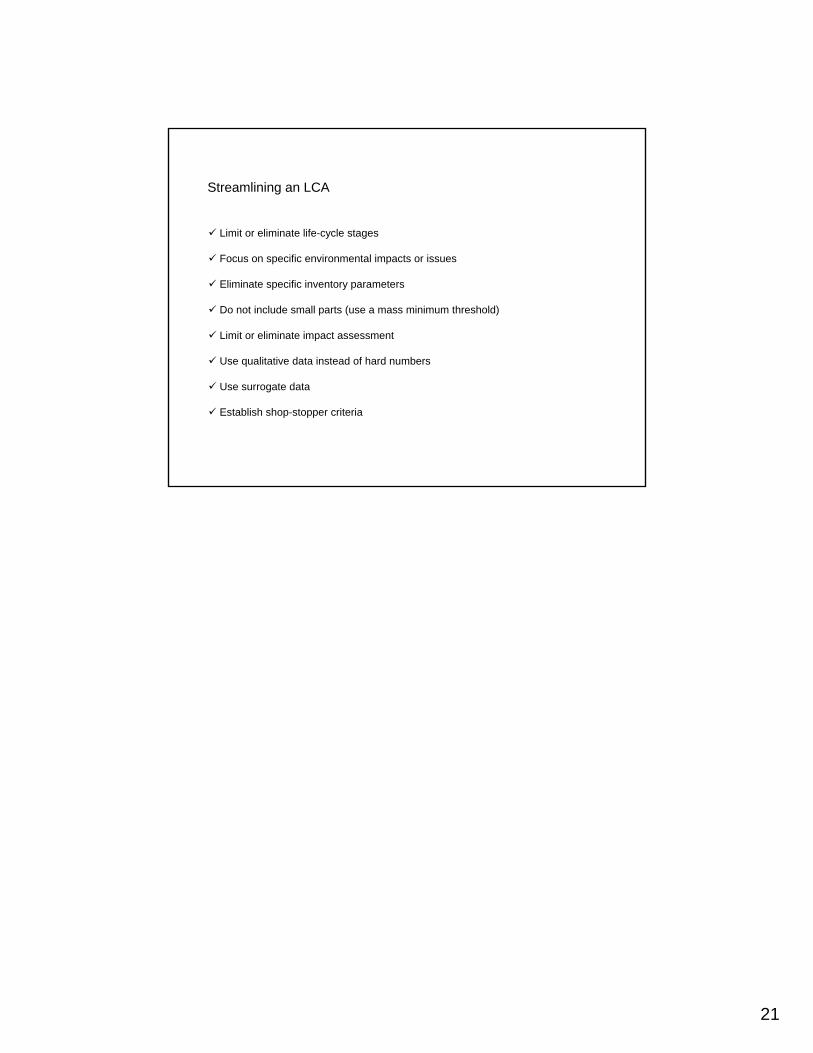
Streamlining an LCA
Limit or eliminate life-cycle stages
Focus on specific environmental impacts or issues
Eliminate specific inventory parameters
Do not include small parts (use a mass minimum threshold)
Limit or eliminate impact assessment
Use qualitative data instead of hard numbers
Use surrogate data
Establish shop-stopper criteria