LIFE CYCLE ANALYSIS OF THE H.R. MAC ... - … iii ABSTRACT A life cycle analysis of the materials...
90
LIFE CYCLE ANALYSIS OF THE H.R. MACMILLAN BUILDING, UNIVERSITY OF BRITISH COLUMBIA Ivan Yip-Hang Tang CIVL 498C, University of British Columbia March 30, 2009
Transcript of LIFE CYCLE ANALYSIS OF THE H.R. MAC ... - … iii ABSTRACT A life cycle analysis of the materials...

LIFE CYCLE ANALYSIS OF THE H.R. MACMILLAN BUILDING,
UNIVERSITY OF BRITISH COLUMBIA
Ivan Yip-Hang Tang
CIVL 498C, University of British Columbia
March 30, 2009

ii Tang

Tang iii
ABSTRACT
A life cycle analysis of the materials used for the structural and envelope elements was
completed for the H.R. MacMillan building at the University of British Columbia (UBC). This study,
completed in conjunction with twelve other studies on UBC buildings, was done to determine the
environmental impacts of the building design and its construction elements. The scope of this LCA
study covers the structure, envelope and operational energy usage of the H.R. MacMillan building on
a square foot basis.
OnCenter’s OnScreen Takeoff and the Athena Sustainable Materials Institute’s Impact
Estimator (IE) were the two main software tools used. OnScreen Takeoff was first used to create an
inventory of the construction elements in the building. That data was then formatted and entered
into the Impact Estimator, from which reports can be generated to show measures based on the
Tool for the Reduction and Assessment of Chemical and other environmental Impacts (TRACI)
version 2.2, developed by the US Environmental Protection Agency (US EPA). The environmental
impacts of the building are quantified in eight TRACI impact categories, such as primary energy
consumption and global warming potential. In both performing the takeoffs and creating the
building model in IE, a number of assumptions had to be made, adding uncertainties to the results.
For this LCA, only the manufacturing and construction life cycle stages are considered.
Highlights of the results include: 437 MJ of embodied energy per square foot, 250 kg of
weighted raw resource use per square foot, and less than 0.01 kg CFC-11 equivalent/kg ozone
depletion potential per square foot. It was concluded that the H.R. MacMillan building has a higher
environmental impact that the average academic building. A sensitivity analysis was completed to
analyze the relative effects of five materials. Concrete and bricks had by far the largest effects in each
of the impact categories. An analysis was also completed to assess the energy performance of the
building. The current insulation of the building was compared to improved insulation to meet the
Residential Environmental Assessment Program (REAP) standards. The payback period of the
building with the improved insulation was found to be less than three years.
iv Tang
TABLE OF CONTENTS
List of Figures............................................................................................................................v
List of Tables .............................................................................................................................v
Introduction............................................................................................................................... 1
Goal and Scope ..........................................................................................................................3
Goal of Study...........................................................................................................................................................3
Scope of Study .........................................................................................................................................................4
Tools, Methodology and Data................................................................................................................................4
Building Model..........................................................................................................................7
Takeoffs....................................................................................................................................................................7
Bill of Materials......................................................................................................................................................12
Summary Measures................................................................................................................................................14
Sensitivity Analysis ............................................................................................................................................17
Building Performance .............................................................................................................27
Conclusions .............................................................................................................................30
Author’s Commentary ....................................................................Error! Bookmark not defined.
Appendix A – Formatted Inputs
Appendix B – Input Assumptions

Tang v
LIST OF FIGURES
Figure 1 - Aerial View of the H.R. MacMillan Building...............................................................................1
Figure 2 - Sensitivity Analysis of Primary Energy Consumption ...............................................................1
Figure 3 – Sensitivity Analysis of Weighted Resource Consumption........................................................1
Figure 4 - Sensitivity Analysis of Global Warming Potential ......................................................................1
Figure 5 - Sensitivity Analysis of Acidification Potential .............................................................................1
Figure 6 - Sensitivity Analysis of Human Health Respiratory Effects Potential ......................................1
Figure 7 - Sensitivity Analysis of Eutrophication Potential.........................................................................1
Figure 8 - Sensitivity Analysis of Ozone Depletion Potential.....................................................................1
Figure 9 - Sensitivity Analysis of Smog Potential..........................................................................................1
Figure 10 - Comparison of Energy Usage of Current Insulation vs Improved Insulation.....................1
Figure 11 - Consumption of Steam Energy in 2008.....................................................................................1
LIST OF TABLES
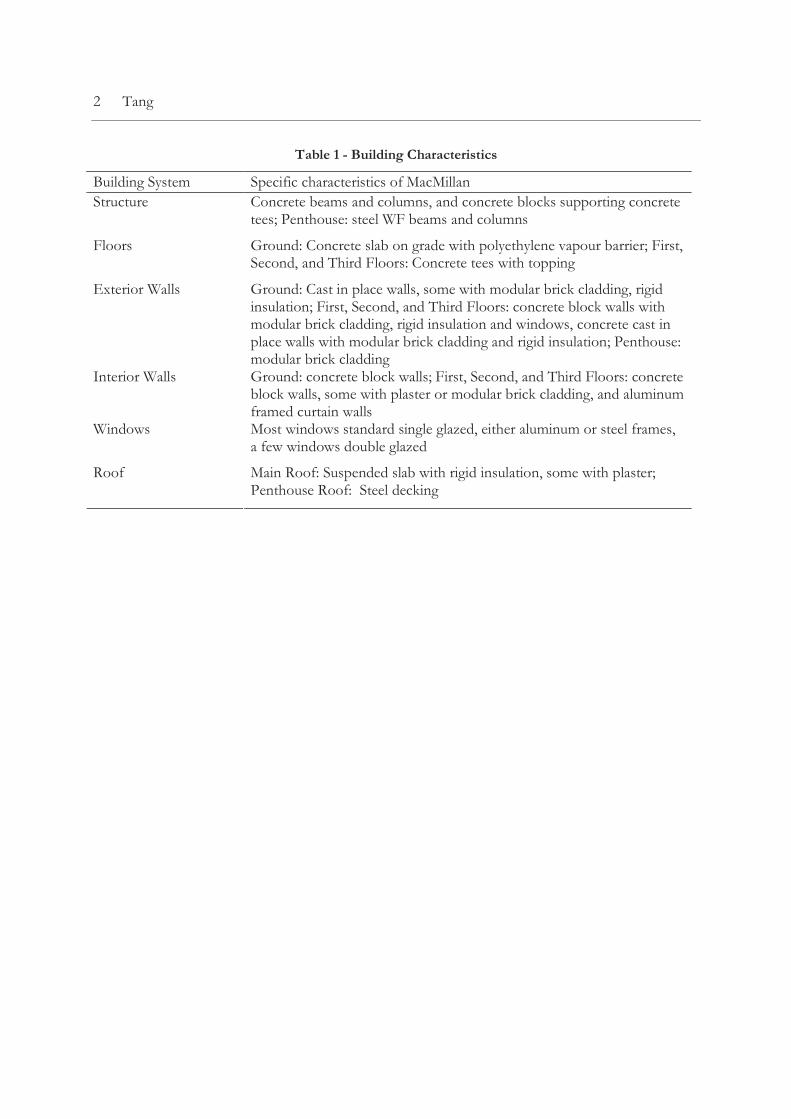
Table 1 - Building Characteristics....................................................................................................................2
Table 2 – H.R. MacMillan Bill of Materials .................................................................................................13
Table 3 - Summary Measures by Life Cycle Stage ......................................................................................14
Table 4 - Sensitivity Analysis Percentage Results........................................................................................17
Table 5 – Comparison of Insulation Types with Embodied Energy .......................................................27

vi Tang

Tang 1
INTRODUCTION
The H.R. MacMillan building, originally the Forestry Agriculture building, was built in 1967
on the Point Grey campus of the University of British Columbia. The design of the concrete and
brick building was of ‘Modern Tudor’ architecture, featuring Gothic-style ornaments and brick
pilasters. It has a unique shape, enclosing a semi-vegetated courtyard containing several trees (see
Figure 1). The three-storey-plus-one-ground-floor building serves as an academic research building,
originally containing approximately 11 classrooms, 43 labs and 65 offices. It also features one large
lecture theatre, and a library on the top floor. Table 1 details the building’s structural and envelope
elements. The building is heated by steam provided from a centralized generator on campus burning
natural gas.
Figure 1 - Aerial View of the H.R. MacMillan Building
2 Tang
Table 1 - Building Characteristics
Building System Specific characteristics of MacMillan
Structure Concrete beams and columns, and concrete blocks supporting concrete tees; Penthouse: steel WF beams and columns
Floors Ground: Concrete slab on grade with polyethylene vapour barrier; First, Second, and Third Floors: Concrete tees with topping
Exterior Walls Ground: Cast in place walls, some with modular brick cladding, rigid insulation; First, Second, and Third Floors: concrete block walls with modular brick cladding, rigid insulation and windows, concrete cast in place walls with modular brick cladding and rigid insulation; Penthouse: modular brick cladding
Interior Walls Ground: concrete block walls; First, Second, and Third Floors: concrete block walls, some with plaster or modular brick cladding, and aluminum framed curtain walls
Windows Most windows standard single glazed, either aluminum or steel frames, a few windows double glazed
Roof Main Roof: Suspended slab with rigid insulation, some with plaster; Penthouse Roof: Steel decking
Tang 3
GOAL AND SCOPE
The goal and scope of this study, as discussed in the subsequent sections, was defined in
accordance to International Standard ISO 14044:2006, Environmental management – Life cycle
assessment – Requirements and guidelines.
Goal of Study
This life cycle analysis (LCA) of the H.R. MacMillan building (hereafter referred to as
MacMillan) at the University of British Columbia (UBC) was carried out as an exploratory study to
determine the environmental impact of its design. This LCA of MacMillan is also part of a series of
twelve others being carried out simultaneously on respective buildings at UBC with the same goal
and scope.
The main outcomes of this LCA study are the establishment of a materials inventory and
environmental impact references for the H.R. MacMillan building. An exemplary application of
these references is in the assessment of potential future performance upgrades to the structure and
envelope of MacMillan. When this study is considered in conjunction with the twelve other UBC
building LCA studies, further applications include the possibility of carrying out environmental
performance comparisons across UBC buildings over time and between different materials,
structural types and building functions. Furthermore, as demonstrated through these potential
applications, this MacMillan LCA can be seen as an essential part of the formation of a powerful
tool to help inform the decision making process of policy makers in establishing quantified
sustainable development guidelines for future UBC construction, renovation and demolition
projects.
The intended core audience of this LCA study are those involved in building development
related policy making at UBC, such as the Sustainability Office, who are involved in creating policies
and frameworks for sustainable development on campus. Other potential audiences include
developers, architects, engineers and building owners involved in design planning, as well as external
organizations such as governments, private industry and other universities whom may want to learn
more or become engaged in performing similar LCA studies within their organizations.

4 Tang
Scope of Study
The product system studied in this LCA are the structure, envelope and operational energy
usage associated with space conditioning of MacMillan on a square foot finished floor area of
academic building basis. In order to focus on design related impacts, this LCA encompasses a
cradle-to-gate scope that includes the raw material extraction, manufacturing of construction
materials and construction of the structure and envelope of MacMillan, as well as associated
transportation effects throughout.
Tools, Methodology and Data
There were two main software tools utilized to complete this LCA study; OnCenter’s
OnScreen Takeoff and the Athena Sustainable Materials Institute’s Impact Estimator (IE) for
buildings.
The initial stage of the study was a materials quantity takeoff, which involved performing
linear, area and count measurements of the building’s structure and envelope. To accomplish this,
OnScreen Takeoff version 3.6.2.25 was used, which is a software tool designed to perform material
takeoffs with increased accuracy and speed in order to enhance the bidding capacity of its users.
Using imported digital plans, the program simplifies the calculation and measurement of the takeoff
process, while reducing the error associated with these two activities. The measurements generated
are formatted into the inputs required for the IE building LCA software to complete the takeoff
process. These formatted inputs as well as their associated assumptions can be viewed in
Appendices A and B, respectively.
Using the formatted takeoff data, version 4.0.51 of the IE software, the only available
software capable of meeting the requirements of this study, was used to generate a whole building
LCA model for MacMillan in the Vancouver region as an Institutional building type. The IE
software is designed to aid the building community in making more environmentally conscious
material and design choices. The tool achieves this by applying a set of algorithms to the inputted
takeoff data in order to complete the takeoff process and generate a bill of materials (BoM). This
BoM then utilizes the Athena Life Cycle Inventory (LCI) Database, version 4.6, in order to generate
a cradle-to-grave LCI profile for the building. In this study, LCI profile results focus on the
manufacturing and transportation of materials and their installation into the initial structure and
envelope assemblies. As this study is a cradle-to-gate assessment, the expected service life of

Tang 5
MacMillan is set to 1 year, which results in the maintenance, operating energy and end-of-life stages
of the building’s life cycle being left outside the scope of assessment.
The IE then filters the LCA results through a set of characterization measures based on the
mid-point impact assessment methodology developed by the US Environmental Protection Agency
(US EPA), the Tool for the Reduction and Assessment of Chemical and other environmental
Impacts (TRACI) version 2.2. In order to generate a complete environmental impact profile for
MacMillan, all of the available TRACI impact assessment categories available in the IE are included
in this study, and are listed as;
• Primary energy consumption
• Weighted raw resource use
• Global warming potential
• Acidification potential
• Human health respiratory effects potential
• Eutrophication potential
• Ozone depletion potential
• Photochemical smog potential
Using the summary measure results, a sensitivity analysis was then conducted in order to
reveal the effect of material changes on the impact profile of MacMillan. Finally, using the UBC
Residential Environmental Assessment Program (REAP) as a guide, this study then estimates the
embodied energy involved in upgrading the insulation and window R-values to REAP standards and
calculates the energy payback period of investing in a better performing envelope.
The primary sources of data for this LCA are the original architectural and structural
drawings from when the H.R. MacMillan building was initially constructed in 1967. The assemblies
of the building that were modelled include the foundation, columns and beams, floors, walls and
roofs, as well as the associated envelope and openings (i.e. doors and windows) within each of these
assemblies. The decision to omit other building components, such as flooring, electrical aspects,
heating, ventilation and air conditioning (HVAC) system, finishing and detailing, etc., are associated
with the limitations of available data and the IE software, as well as to minimize the uncertainty of
the model. In the analysis of these assemblies, some of the drawings lack sufficient material details,
which necessitate the usage of assumptions to complete the modelling of the building in the IE

6 Tang
software. Furthermore, there are inherent assumptions made by the IE software in order to generate
the bill of materials and limitations to what it can model, which necessitated further assumptions to
be made. These assumptions and limitations will be discussed further in the Building Model section
and, as previously mentioned, all specific input related assumptions are contained in the Input
Assumptions document in Appendix B.
Tang 7
BUILDING MODEL
To model the H.R. MacMillan building, the software program OnScreen Takeoff was first
used to measure, count and inventory the building elements. The measurements were then
formatted in order to create a model of the building in the Athena Sustainable Materials Institute’s
Impact Estimator (IE) for buildings. This section details the process used for performing the
takeoffs and discusses any assumptions and limitations throughout the whole modelling process.
The bill of materials (BoM) is also presented, discussing the five largest amounts and how
assumptions in the modelling process may have lead to deviations of material amounts. Lastly, the
summary measures by life cycle stage are presented and further analyzed with a sensitivity analysis.
Takeoffs
In OnScreen Takeoff, three measurement conditions are used: linear, area, and count. After
importing the architectural and structural drawings into the program and applying the appropriate
scale factor, these conditions are used to inventory all the elements of the building to be considered.
The linear condition records distances and was used for items such as walls, strip foundations, and
height measurements. The area condition records areas and was used for items such as floors and
roof area. The count condition records multiples of repeated items and was used for items such as
pad footings, windows, and doors. The takeoffs were performed as precisely as practically possible,
but some challenges arose during the process. Since the drawings were hand-drawn from 1967, the
digital versions were scanned copies of the original. For this reason, there were instances where
assumptions were used when poor quality (i.e. blurry sections or scan lines confused with dimension
lines) affected the accuracy of the takeoffs. In addition, the accuracy of the building model was
affected if required data was not available. For example, the size of rebar may not be specified and it
would have to be assumed.
A number of assembly groups were modelled for entry into the Impact Estimator (IE); these
include slab on grade foundations, footings, block walls, cast in place walls, curtain walls, columns
and beams, suspended slab roofs, open web steel joist roofs, and concrete precast double tee floors.
The following provides a description of each assembly group and how it was modelled, and any
high-level assumptions that were made that affect all the inputs in the particular assembly group.

8 Tang
Concrete slabs on grade foundation
The concrete slab on grade (SOG) foundation at the floor of the ground level was modelled
using the area condition. In the Impact Estimator (IE), there are two options for the SOG thickness:
4” or 8” thickness. In cases where the ideal rebar input was unavailable in the Impact Estimator, the
next nearest option was selected and assumed for modelling purposes. The concrete flyash content
was not specified in the drawings; it was assumed to be the average amount. Concrete is assumed to
have a strength of 3000 psi for all cases unless otherwise noted, as specified. Also, the vapour barrier
was assumed to be 6 mil, instead of 4 mil, as this was the only option in the IE.
Concrete footings
Concrete footings used to help form the building foundation were modelled using either the
linear condition (e.g. strip/wall footings with specified cross-sectional dimensions) or the count
condition (e.g. pad/column footings with specified dimensions). The IE limits the thickness of
footings to 19.7". For footings thicker than this limit, the thickness was set to 19.7" and the width
was increased accordingly to maintain equal volume. See drawings 386-07-009 and 386-07-010 for
specifications of footing dimensions.
The linear condition was used to model the concrete stairs as footings. After measuring an
average stair thickness (assumed to be 10”) and width, the length of stairs was measured using a
linear condition. The internal stairs have a 1” plaster topping which was omitted as the IE does not
have an option to add a layer of plaster to concrete footings.
The concrete columns inside the pilasters surrounding the exterior of the building are
modelled as footings. The cross-sectional dimensions are specified (drawings 386-07-011 and
drawings 386-07-013) and the lengths were measured using a linear condition. The pilaster columns
contain various rebar sizes; #4 rebar was assumed to be the average.
For all concrete footings, the flyash content was not specified in the drawings; it was
assumed to be the average amount. Concrete is assumed to have a strength of 3000 psi for all cases
unless otherwise noted, as specified.
Concrete block walls
The majority of walls in the H.R. MacMillan building are concrete block walls. They were
modelled using the linear condition for distances. The linear condition was also used to measure the
wall height and it was found to be 12’. This value is used as an assumption for the heights of all

Tang 9
walls. A different category was used to measure walls depending on the type of wall construction.
Some walls have 1” rigid insulation (assumed to be 1” extruded polystyrene), modular brick
cladding, or plaster finish, or a combination of these elements. A different category was also used for
walls with differing openings, such as solid wood doors, glazed steel doors, or window openings. In
the IE, concrete block walls are assumed to use 8” x 8” x 16” hollow concrete blocks with every
third vertical core grouted and reinforced with one steel bar (assumed to be #4), and additional
grouting and rebar is included at all openings. These conditions are assumed for all concrete block
walls in MacMillan. For all instances where walls had a plaster finish, it was assumed to be regular
5/8” thick gypsum board (plaster is not available as an option in the IE). Even though operable
windows are an option in the IE, all windows are considered fixed for conformity to the rest of the
LCA studies conducted on other UBC buildings. Steel window frames are also assumed to be
aluminum frames in the IE as there is no option for steel. All doors made from wood, including
those that are glazed, are assumed to be solid wooden doors. Glazed aluminum doors were assumed
to be 80% glazed.
Cast in place walls
Some of the walls of the ground floor are cast in place concrete walls. They were measured
using the linear condition. Similar to concrete block walls, different categories were used to perform
takeoffs depending on the wall construction and wall openings. All the same assumptions were
made. Note that bituminous waterproof compound was omitted as it is not available in the IE.
Glazed curtain walls
Glazed curtain walls occur most often at the doorways to external and internal stairs. They
are also modelled using the linear condition. It was assumed that the curtain walls had 90% viewable
glazing and 10% opaque metal spandrel. The IE also requires a positive input for thickness of
insulation. Since there was no insulation, this was assumed to be 0.0001. All the glazed metal doors
were assumed to be 80% glazed aluminum doors.
Concrete columns and beams
Concrete columns and beams support the floors in H.R. MacMillan. The linear and count
conditions were used to measure these elements. The count condition was used to measure the
number of columns and beams. The linear condition was used to measure the floor to floor height.

10 Tang
The bay size measurement was obtained by using the linear condition to measure the total distance
between a series of columns, then dividing that by the number of columns to produce the average
bay size. The IE requires that the bay size be 10’ or greater. The bay size was assumed to be 10’ in
cases where the average bay size was less than 10’. The supported span was obtained by using the
linear condition to measure the total span, then dividing that by two to produce the average span.
The total span was divided by two since the floors are supported at each external wall, and in
between by one series of columns. In the IE, three options are available for the live load: 45 psf, 75
psf, and 100 psf. None of the specified live loads matched these options so the closest options were
assumed. For labs and offices, 100 psf was used instead of the specified 120 psf (labs) and 50 psf
(offices) for a conservative assumption. For classrooms, 45 psf was used instead of the specified 60
psf since 100 psf was an overestimation for labs and offices; this creates a more balanced overall
estimate. For the third floor columns supporting the roof, 45 psf was used for the specified snow
load of 40 psf. Note that the size of the columns and beams are calculated by metrics embedded in
the IE.
Steel wide flange (WF) columns and beams
Steel wide flange columns and beams are used for the ‘penthouse’, which acts as a protective
housing for the exhaust ducts from the labs. Similar to concrete columns and beams, the count
condition was used to measure the number of columns and beams, and the linear condition was
used to measure the floor to floor height. The same technique was used to obtain the average bay
size. The calculated average bay size was 5.85’ but it is assumed to be 10’ due to this limitation in the
IE.
Suspended slab roofs
A suspended slab roof is used for the H.R. MacMillan building. The linear condition was
used to measure the width and spans of the roof. The IE requires the span input to be 30’. Thus for
instances where the span is greater than 30’, the span is set to 30’ and the width is adjusted
accordingly to maintain the same area. The live load was assumed to be 45 psi, the nearest option to
the specified 40 psf snow load. The plaster finish was assumed to be regular 5/8” gypsum board as
plaster is not available as an option in the IE. The 1” rigid insulation was assumed to be 1” extruded
polystyrene. The flyash content was not specified in the drawings; it was assumed to be the average

Tang 11
amount. Concrete is assumed to have a strength of 3000 psi for all cases unless otherwise noted, as
specified.
Open web steel joist roofs
The roof of the ‘penthouse’ was assumed to be an open web steel joist roof. Similar to the
suspended slab roof, the width and span was measured using the linear condition. In the IE, the
span requires a minimum of 15.09’. The span was set to 15.09’ and the width was adjusted
accordingly to maintain the same area. It was assumed to be a commercial steel roof system.
Concrete precast double tee floors
Concrete precast tees are used for the flooring system. Although the precast tees in the H.R.
MacMillan building are single and not double tees, this was assumed to be the case as it is the closest
option. The count and linear condition was used to take measurements. The count condition was
used to measure the number of bays and the linear condition was used to measure the bay size and
the span size. The technique used to measure span size was the same as that used in concrete
columns and beams. Due the span size being limited to 30’, the span was set to 30’ and the number
of bays was adjusted accordingly to produce the equivalent floor size. The live load assumptions
were the same as that used in concrete columns and beams.
Extra basic materials
In the Impact Estimator, additional materials can be entered manually to account for any
components that are not covered by the default assembly groups. For the H.R. MacMillan building,
this section was used to add concrete (20 MPa = 3000 psi) for the precast concrete caps that are on
top of the pilasters and that surround the exterior edge at the roof. Modular brick was added for the
penthouse walls and for the pilasters. Finally, mortar was added for the penthouse brick walls and
the brick cladding on the pilasters.
Refer to Appendix B for the Impact Estimator Input Assumptions, which outlines all the high-
level and specific assumptions, including detailed calculations, used in the IE model.

12 Tang
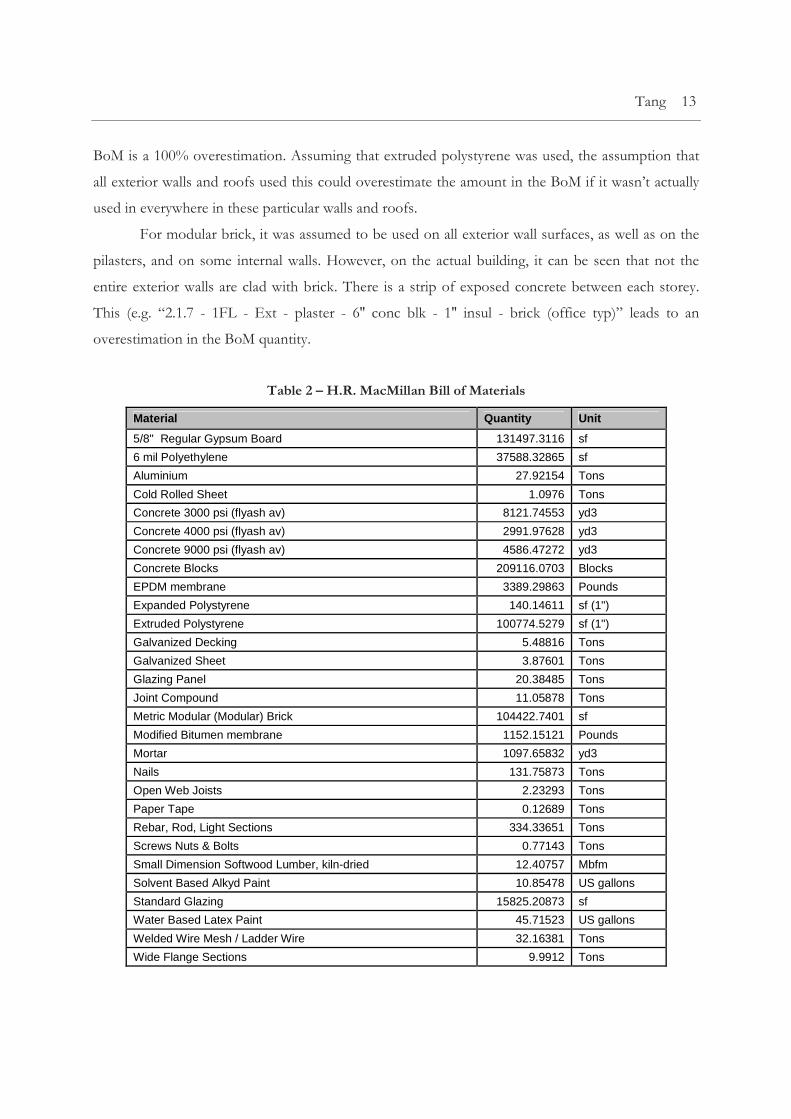
Bill of Materials
After all the inputs have been entered into the Impact Estimator, a bill of materials (BoM)
can be generated to list all the materials and their amounts used in the building model. See Table 2
for the BoM for the H.R. MacMillan building. Five materials with among the largest quantities are:
5/8” regular gypsum board, 3000 psi concrete (average flyash), concrete blocks, extruded
polystyrene, and modular brick. The quantities of these materials have been affected by certain
assumptions which could make them overestimations or underestimations.
Since plaster is not available in the Impact Estimator as a wall or roof envelope material, an
assumption was made to replace plaster with 5/8” regular gypsum board in all cases where plaster
existed for roofs and walls. Because of this assumption, the entire quantity of gypsum board is an
overestimation. No gypsum board was shown to exist in the original drawings.
The 3000 psi concrete unsurprisingly shows up as one of the highest quantities as it was used
for the foundations, cast in place walls, suspended slab roof, and in extra basic materials for the
precast concrete caps. For all instances where the concrete strength was not specified, it was
assumed to be 3000 psi. This was noted in the General Notes in drawing 386-07-009. However, the
concrete caps were precast, meaning they were made at a manufacturing plant away from the site. If
the manufacturing company used a different type of concrete, not 3000 psi, then the quantity in the
BoM has been overestimated due to the “6.1.1 - Precast Concrete Cap for Pilaster Col'n 0,1,2,3FL
Types A,B,H,M” and “6.1.2 - Precast Concrete Cap linear” inputs.
For concrete blocks, assumptions were made regarding the heights of various walls. To a
certain extent, the lengths of various walls were assumed as well. For example, there was no drawing
provided for the wall layout of the north side of the ground floor. Thus, the walls lengths (0FL - Int
- 8" conc blk (corridor typ)” were estimated based on a physical site visit of the building. It was also
assumed that all concrete block walls used the same concrete block wall construction as is defined in
the IE, which is not the case for the real building. Adding up the total effects of the assumed wall
dimensions, combined with the assumption that all concrete blocks are the same, this could lead to
an overestimation or underestimation of the quantity of concrete blocks in the BoM.
Extruded polystyrene was assumed to be used when the drawings specified 1” rigid
insulation. It is assumed that all parts of the roofs and exterior walls (e.g. “2.1.5 - 1FL - Ext - 6'' conc
blk - 1'' insul - brick (lab typ)”) contain this layer of insulation. However, it is not known if extruded
polystyrene was actually used as the insulation in the building. If it wasn’t, then the quantity in the
Tang 13
BoM is a 100% overestimation. Assuming that extruded polystyrene was used, the assumption that
all exterior walls and roofs used this could overestimate the amount in the BoM if it wasn’t actually
used in everywhere in these particular walls and roofs.
For modular brick, it was assumed to be used on all exterior wall surfaces, as well as on the
pilasters, and on some internal walls. However, on the actual building, it can be seen that not the
entire exterior walls are clad with brick. There is a strip of exposed concrete between each storey.
This (e.g. “2.1.7 - 1FL - Ext - plaster - 6'' conc blk - 1'' insul - brick (office typ)” leads to an
overestimation in the BoM quantity.
Table 2 – H.R. MacMillan Bill of Materials
Material Quantity Unit
5/8" Regular Gypsum Board 131497.3116 sf
6 mil Polyethylene 37588.32865 sf
Aluminium 27.92154 Tons
Cold Rolled Sheet 1.0976 Tons
Concrete 3000 psi (flyash av) 8121.74553 yd3
Concrete 4000 psi (flyash av) 2991.97628 yd3
Concrete 9000 psi (flyash av) 4586.47272 yd3
Concrete Blocks 209116.0703 Blocks
EPDM membrane 3389.29863 Pounds
Expanded Polystyrene 140.14611 sf (1")
Extruded Polystyrene 100774.5279 sf (1")
Galvanized Decking 5.48816 Tons
Galvanized Sheet 3.87601 Tons
Glazing Panel 20.38485 Tons
Joint Compound 11.05878 Tons
Metric Modular (Modular) Brick 104422.7401 sf
Modified Bitumen membrane 1152.15121 Pounds
Mortar 1097.65832 yd3
Nails 131.75873 Tons
Open Web Joists 2.23293 Tons
Paper Tape 0.12689 Tons
Rebar, Rod, Light Sections 334.33651 Tons
Screws Nuts & Bolts 0.77143 Tons
Small Dimension Softwood Lumber, kiln-dried 12.40757 Mbfm
Solvent Based Alkyd Paint 10.85478 US gallons
Standard Glazing 15825.20873 sf
Water Based Latex Paint 45.71523 US gallons
Welded Wire Mesh / Ladder Wire 32.16381 Tons
Wide Flange Sections 9.9912 Tons

14 Tang
Summary Measures
After the inputs have been entered into the Impact Estimator, a results report of summary
measures can be generated showing the environmental effects of the building model by life cycle
stage (or by assembly group). The Impact Estimator can produce a report of summary measures for
five life cycle stages: manufacturing, construction, maintenance, end-of-life, and operating energy.
For the purpose of this LCA, only the manufacturing and construction stages are considered. The
effects of the H.R. MacMillan building are shown in Table 3. The summary measures are the output
assessment results for the building’s impacts for eight environmental impact categories, based on the
US EPA’s midpoint impact estimation Tool for the Reduction and Assessment of Chemical and
Other Environmental Impacts (TRACI): embodied primary energy consumption, weighted raw
resource use, global warming potential, acidification potential, human health respiratory effects
potential, aquatic eutrophification potential, ozone depletion potential, and photochemical smog
potential.
Table 3 - Summary Measures by Life Cycle Stage
Impact Category
Primary Energy
Consumption
Weighted Resource
Use
Global Warming Potential
Acidification Potential
HH Respiratory
Effects Potential
Eutrophi-cation
Potential
Ozone Depletion Potential
Smog Potential
MJ kg (kg CO2 eq / kg)
(moles of H+ eq / kg)
(kg PM2.5 eq / kg)
(kg N eq / kg)
(kg CFC-11 eq / kg)
(kg NOx eq / kg)
Manufacturing
Material 57,453,810 37,266,745 5,514,303 1,760,862 14,822 104.39 0.01 21,106
Transportation 1,323,886 41,088 2,307 790 0.95 0.01 0.00 17.81
Total 58,777,696 37,307,833 5,516,610 1,761,651 14,823 104.40 0.01 21,124
Construction
Material 1,473,406 67,684 101,997.41 51,324 54.83 0.00 0.00 2,025
Transportation 6,028,675 137,201 9,705.58 3,156 3.80 0.02 0.00 70.65
Total 7,502,081 204,885 111,703.00 54,479 58.62 0.02 0.00 2,095
Total Effects
Overall 66,279,777 37,512,718 5,628,313 1,816,131 14,882 104.42 0.01 23,220
Per sq.ft. 437.12 247.40 37.12 11.98 0.10 0.00 0.00 0.15
Primary energy consumption
Primary energy consumption is all the embodied primary energy, including all direct and
indirect energy used to make a product from raw material extraction to the finished product. In the
Impact Estimator, it is reported in megajoules (MJ). This category encompasses the energy used in

Tang 15
all processes of the product’s creation, including energy associated with powering manufacturing
machines. The Impact Estimator also accounts for indirect energy use associated with transporting,
converting and delivering fuel and energy. The higher the embodied energy, the less desirable it is as
it means more energy was required to produce the item. Each component in the building model has
an effect on embodied energy. Since even small components can have a large embodied energy, the
uncertainty in the building model can create very imprecise primary energy consumption values.
Weighted raw resource use
Raw resource use is the amount of raw resources used in the production of a building
material or product, and is reported in kilograms (kg). However, since resources cannot be
compared by a unit mass, a weighting factor is applied. For example, a unit of timber cannot be
compared to a unit of metal ore. The weighting index numbers that the Impact Estimator reference
were established through a survey of a number of resource extraction and environmental specialists
across Canada. The value that the Impact Estimator reports is a summed total of the raw resource
usage after applying the index numbers. The factored numbers can be thought of as ‘ecologically
weighted kilograms’ but the weighting is reflective of the opinions of the surveyed experts. As with
embodied energy, all components have an effect on this impact category as raw materials are
required to produce any building product or material. However, it is uncertain how much each
product or assembly group affects the final reported value.
Global warming potential
Global warming potential is the measure of a product or material’s potential to contribute to
global warming via the greenhouse effect, and is measured relative to the effect of carbon dioxide
(CO2). The units are in kilograms or tonnes CO2 equivalent. The effect of all other chemicals is
assigned a multiple of the CO2 equivalent. Due to the unknown reactivity and stability of chemicals
in the atmospheric environment, the temporal effects of chemicals on global warming are uncertain.
Greenhouse gas emissions are primarily produced when fuels are combusted, but some products
also produce emissions during manufacture or processing. The Impact Estimator uses a detailed life
cycle modelling technique that captures all the relevant emissions, including any released during
processing. Uncertainty arises in modelling greenhouse gas emissions and global warming potential
as it is difficult to account for emissions produced during complex processes, such as those for
manufacture.

16 Tang
Acidification potential
Acidification potential is a regional effect that concerns human health and the health of
other living organisms. The acidification potential of air or water emissions are calculated based on
of its H+ equivalence effect on a mass basis. It is reported in moles of H+ equivalent/kg. High
concentrations of NOx and SO2 are thought to produce adverse effects on life. However, much
uncertainty is present in this field as it is not yet widely understood.
Human health respiratory effects potential
Human health respiratory effects potential deals with the effects particulate matter have on
human health, particularly the respiratory system. Particulates have a serious impact on human
health, e.g. the EPA says particulates from diesel fuel combustion are the number one source of
respiratory deterioration and diseases such as asthma and bronchitis. This impact category is
reported in kg PM2.5 equivalent/kg.
Aquatic eutrophification potential
Eutrophication is the process of enriching previously nutrient scarce surface water bodies
with more nutrients and is measured relative to nitrogen equivalents. The addition of nutrients to a
body of water leads to an increase in photosynthetic aquatic plant life (e.g. algae). The new growth
can dominate and devastate natural species and cause other consequences such as foul odours or
dead fish. Aquatic eutrophication potential is reported in kg N equivalent/kg.
Ozone depletion potential
Ozone depletion potential measures impacts related to the reduction of ozone layer within
the stratosphere. This is a protective layer in the atmosphere which absorbs the large majority of the
sun’s ultraviolet light. The depletion is caused by emissions of ozone depleting substances, including
CFCs, HFCs, and halons. The ozone depletion potential of each of a chemical or substance is
measured relative to CFC-11, and is reported in kg CFC-11 equivalent/kg.
Photochemical smog potential
Smog is a type of air pollution, the product of industrial and/or transportation emissions
being trapped close to ground level where it reacts under certain atmospheric condition with
sunlight. Smog is a serious issue affecting human health in many cities. Industries release nitrogen

Tang 17
oxides (NOx) and other man-made products release volatile organic compounds (VOCs). Such
compounds can severely affect people with heart and lung diseases such as bronchitis and asthma.
Smog potential is reported in kg NOx equivalent/kg.
Sensitivity Analysis
To analyze the relative effects that materials have on each of the TRACI impact categories, a
sensitivity analysis for five materials was completed. The summary measures were re-evaluated after
adding and subtracting 10% of the material from the Bill of Materials for the following materials:
concrete (20 MPa = 3000 psi), concrete (60 MPa = 9000 psi), concrete blocks, extruded polystyrene,
and modular brick. The effects on each of the impact categories are shown in Table 4. The
highlighted values are those with the largest impact for a given impact category. Note that the waste
factors inherent to the Impact Estimator when manually adding or subtracting materials was not
accounted for this sensitivity analysis.
Table 4 - Sensitivity Analysis Percentage Results
on Construction and Manufacturing Life Cycle Stages
Impact Category
Primary Energy
Consumption
Weighted Resource
Use
Global Warming Potential
Acidification Potential
HH Respiratory
Effects Potential
Eutrophi-cation
Potential
Ozone Depletion Potential
Smog Potential
MJ kg (kg CO2 eq / kg)
(moles of H+ eq / kg)
(kg PM2.5 eq / kg)
(kg N eq / kg)
(kg CFC-11 eq / kg)
(kg NOx eq / kg)
Concrete+10% (20 MPa) 1.37% 4.49% 2.24% 2.33% 2.14% 0.07% 3.35% 2.76%
Concrete-10% (20 MPa) -1.37% -4.49% -2.24% -2.33% -2.14% -0.07% -3.35% -2.76%
Concrete+10% (60 MPa) 1.09% 2.74% 1.94% 2.05% 1.70% 0.05% 2.99% 2.45%
Concrete-10% (60 MPa) -1.09% -2.74% -1.94% -2.05% -1.70% -0.05% -2.99% -2.45%
Concrete Blocks+10% 0.67% 0.08% 0.80% 0.89% 0.75% 0.04% 0.92% 0.77%
Concrete Blocks-10% -0.67% -0.08% -0.80% -0.89% -0.75% -0.04% -0.92% -0.77%
Extruded Polystyrene+10% 0.11% 0.01% 0.06% 0.06% 0.01% 0.00% 0.00% 0.31%
Extruded Polystyrene-10% -0.11% -0.01% -0.06% -0.06% -0.01% 0.00% 0.00% -0.31%
Brick+10% 2.28% 0.31% 1.50% 1.86% 1.43% 0.07% 0.00% 0.10%

18 Tang
Brick-10% -2.30% -0.31% -1.51% -1.88% -1.44% -0.07% 0.00% -0.10%
From the results shown in Table 4, it can be seen that 3000 psi concrete has the largest effect in
every impact category, except embodied primary energy which modular brick has the biggest effect
in. Brick also has an equal effect to 3000 psi concrete in eutrophification potential. Interesting, 9000
psi (primarily used for the precast concrete double tees) had much less of an effect than the 3000 psi
concrete. Also interesting is that extruded polystyrene had minimal effect in any of the impact
categories. It was expected to have a greater effect due to its chemical nature. Comparing concrete
blocks to the 3000 and 9000 psi concrete is also interesting. The effects of the concrete blocks are
small compared to the both types of concrete, even though all three are made from concrete.
This type of analysis is very valuable when performing an LCA on a building at the design
stage or the renovation stage as it shows the potential impacts before the building is built or
renovated. For example, from this analysis, one can conclude that building a brick wall instead of a
concrete wall is a better choice since bricks have a much less impact on each of the impact
categories (except embodied primary energy and eutrophification potential) compared to 3000 psi
concrete.
The following graphs compare the effect of adding or subtracting 10% of the five materials
for each impact category. The amounts are separated into the manufacturing and construction life
cycle stages.

Tang 19
Figure 2 shows the sensitivity analysis for embodied primary energy. One can conclude from this
graph that the majority of the embodied energy is in the manufacturing of the materials, and not in
their construction/transportation stage. As mentioned in the previous section, modular brick has the
largest effect on embodied primary energy.
Figure 2 - Sensitivity Analysis of Primary Energy Consumption

20 Tang
Figure 3 shows the sensitivity analysis for weighted raw resource consumption. One can conclude
from this graph that the large majority of raw resources are consumed in the manufacturing stage.
The construction/transportation stage represents a very small amount of resource consumption.
Concrete (20 MPa = 3000 psi) has the largest effect of resource consumption by far.
Figure 3 – Sensitivity Analysis of Weighted Resource Consumption

Tang 21
Figure 4 shows the sensitivity analysis for global warming potential. One can conclude from this
graph that the majority of global warming potential is produced in the manufacturing stage. The
construction/transportation stage represents a much smaller potential. Concrete (20 MPa = 3000
psi) has the largest global warming potential, followed by modular brick.
Figure 4 - Sensitivity Analysis of Global Warming Potential

22 Tang
Figure 5 shows the sensitivity analysis for acidification potential. One can conclude from this graph
that the large majority of acidification potential is developed in the manufacturing stage. Concrete
(20 MPa = 3000 psi) has the largest acidification potential, closely followed by modular brick.
Figure 5 - Sensitivity Analysis of Acidification Potential

Tang 23
Figure 6 shows the sensitivity analysis for human health respiratory effects potential. One can
conclude from this graph that the manufacturing stage creates a large cause for concern for
respiratory effects. The construction/transportation stage represents a relatively small concern. The
two types of concretes have the highest effect in this impact category.
Figure 6 - Sensitivity Analysis of Human Health Respiratory Effects Potential
24 Tang
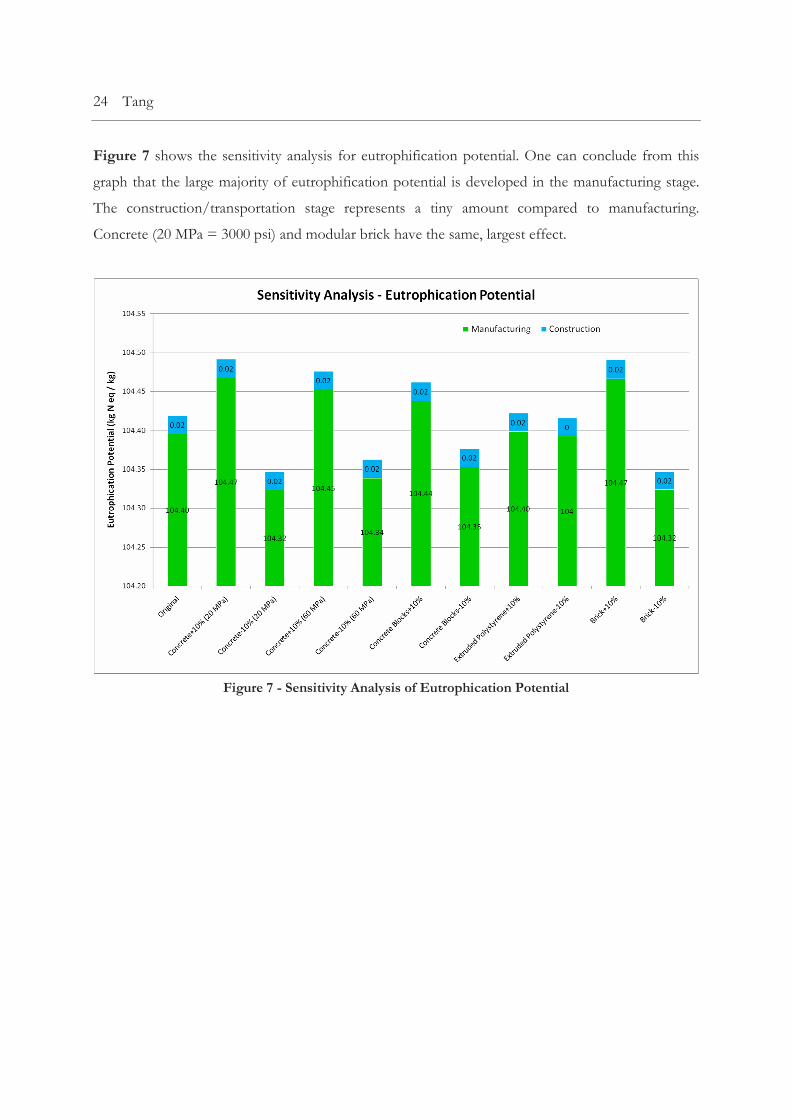
Figure 7 shows the sensitivity analysis for eutrophification potential. One can conclude from this
graph that the large majority of eutrophification potential is developed in the manufacturing stage.
The construction/transportation stage represents a tiny amount compared to manufacturing.
Concrete (20 MPa = 3000 psi) and modular brick have the same, largest effect.
Figure 7 - Sensitivity Analysis of Eutrophication Potential

Tang 25
Figure 8 shows the sensitivity analysis for ozone depletion potential. One can conclude from this
graph that all of the ozone depletion potential is due to the manufacturing of materials. The two
types of concretes have the biggest effect on ozone depletion by far.
Figure 8 - Sensitivity Analysis of Ozone Depletion Potential
26 Tang
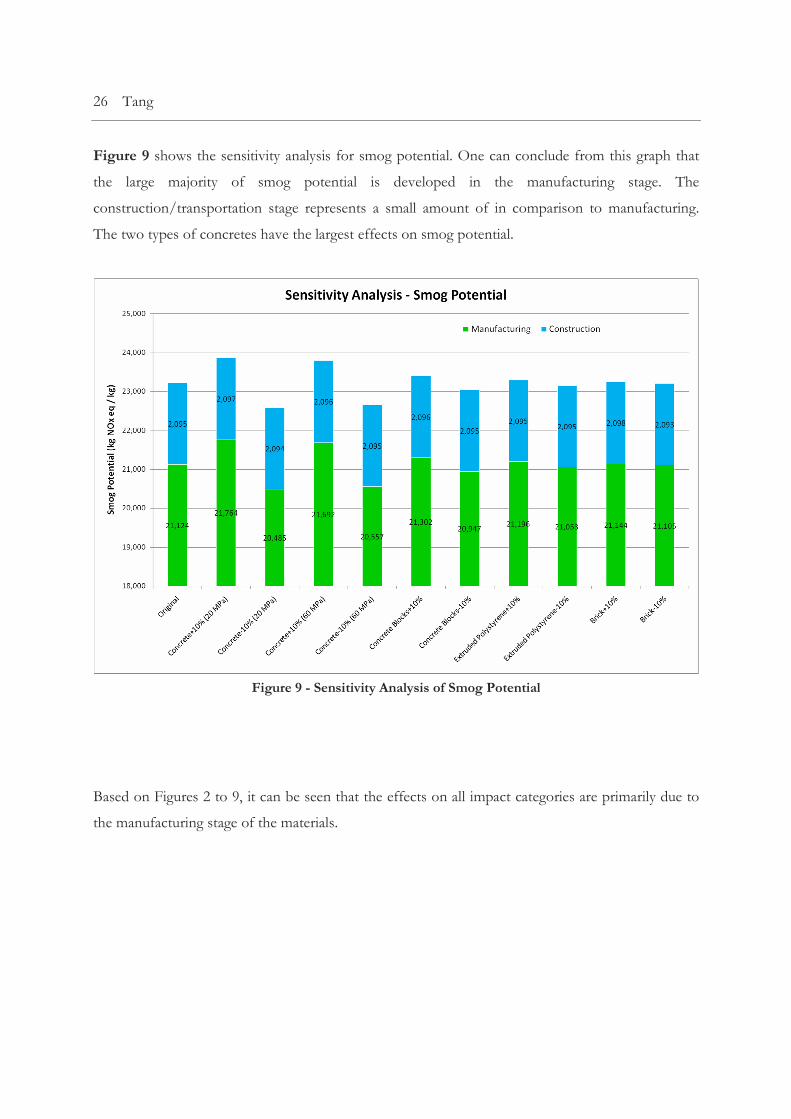
Figure 9 shows the sensitivity analysis for smog potential. One can conclude from this graph that
the large majority of smog potential is developed in the manufacturing stage. The
construction/transportation stage represents a small amount of in comparison to manufacturing.
The two types of concretes have the largest effects on smog potential.
Based on Figures 2 to 9, it can be seen that the effects on all impact categories are primarily due to
the manufacturing stage of the materials.
Figure 9 - Sensitivity Analysis of Smog Potential

Tang 27
BUILDING PERFORMANCE
It is also important to analyze operational energy building performance in an LCA, if
possible. The insulation in the walls and roofs is the main element that traps the heat and prevents it
from being lost to the external environment (in heating dominated climates such as Vancouver). To
determine the best type of insulation (available in the Impact Estimator) in terms of performance
and embodied energy, the manufacturing embodied energy for one square feet of one inch of each
type of insulation was evaluated. The embodied energy in the construction was omitted as it was
relatively much less. The results are presented in Table 5 with the R-value for one inch of
corresponding insulation.
Table 5 – Comparison of Insulation Types with Embodied Energy
Insulation Fiberglass
Batt Rockwool
Batt Blown
Cellulose Expanded
Polystyrene Extruded
Polystyrene Foam Poly-isocyanurate
Embodied Energy (MJ) 1.56 2.45 0.174 3.60 7.19 6.11
R-value 3.14 3.14 3.10 4.00 5.00 6.25
Embodied Energy/ R-value
0.50 0.78 0.06 0.90 1.44 0.98
From Table 5, after normalizing the embodied energy to R-values, blown cellulose is by far the
lowest embodied energy per R-value. However, it also has the lowest R-value per inch of material.
This means it would take 13” (ie. 40/3.1) of blown cellulose to reach the R-40 requirement for roofs
under the Residential Environmental Assessment Program (REAP) standards. This is obviously
impractical for renovation purposes. The foam polyisocyanurate is a good candidate as replacement
insulation. It has a relatively high embodied energy to R-value ratio but the highest R-value per inch.
It would only take 40/6.25 = 6.4” to achieve the R-40 requirement for roofs. This is much more
practical. Since it has such a high R-value, the energy payback period due to savings from
operational energy loss is much quicker.
Figure 10 compares the energy usage between the current insulation versus the same
building with insulation improved to REAP standards (R-40 for roofs, R-18 for walls). For the
purpose of this analysis, the energy usage is assumed to be the same as the energy loss. These energy

28 Tang
loss values are calculated using this formula: Q = (1/R)A∆T, where R is the R-value of the
insulation, A is the area of the material (insulation) undergoing conductive heat transfer, and ∆T is
the temperature difference between the inside of the building and the outside ambient temperature.
Three building components are considered for this calculation: exterior walls, windows, and
roofs. The areas of these components are measured from OnScreen Takeoff using linear and area
conditions. The current R-values of the components are 5.0, 0.91, and 5.0, respectively. The
embodied energy from the Impact Estimator summary measures is the initial embodied primary
energy of the building with the current insulation. Then, the building model is adjusted by removing
the current insulation and ‘new’ insulation was added to meet REAP standards. 2.5” of
polyisocyanurate (R-7.2/inch) for the walls and 5.6” of polyisocyanurate for the roof were added.
The windows were also changed to low E silver argon filled glazed windows (R-3.75). The embodied
energy of this improved building was re-evaluated. The embodied energies of the current and
improved buildings are entered at year 0 (when the building was hypothetically constructed). Using
Figure 10 - Comparison of Energy Usage of Current Insulation vs Improved Insulation
Tang 29
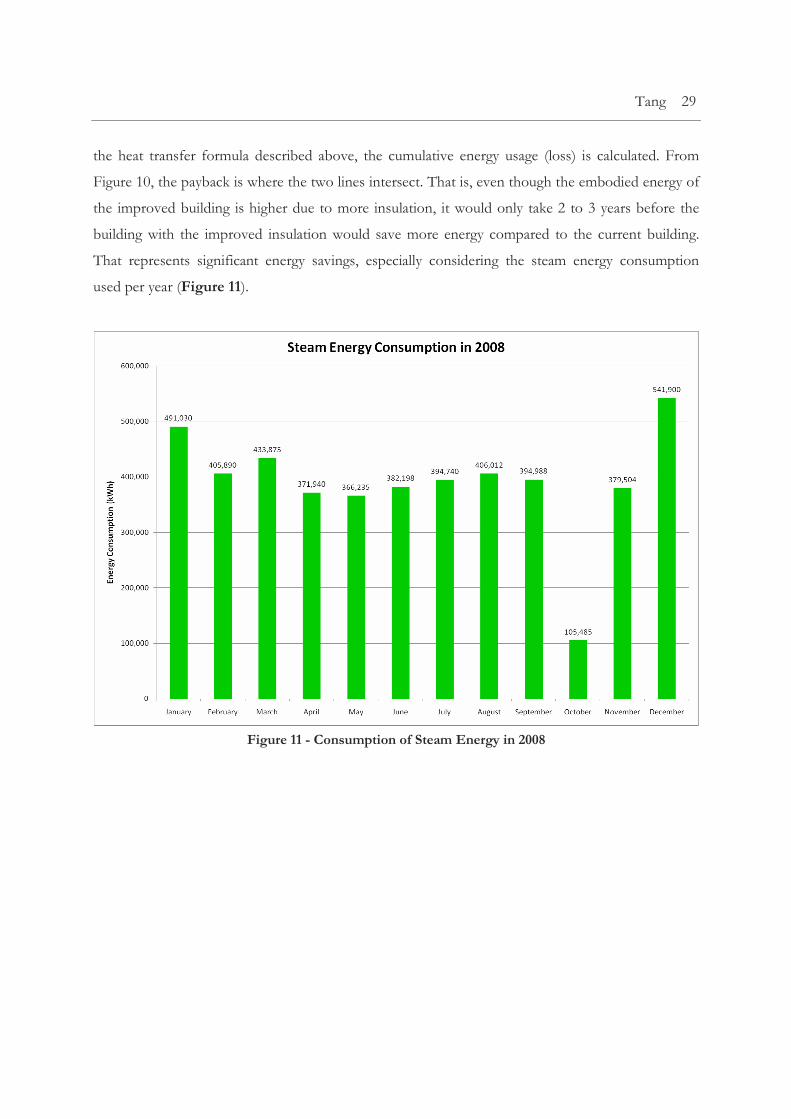
the heat transfer formula described above, the cumulative energy usage (loss) is calculated. From
Figure 10, the payback is where the two lines intersect. That is, even though the embodied energy of
the improved building is higher due to more insulation, it would only take 2 to 3 years before the
building with the improved insulation would save more energy compared to the current building.
That represents significant energy savings, especially considering the steam energy consumption
used per year (Figure 11).
Figure 11 - Consumption of Steam Energy in 2008

30 Tang
CONCLUSIONS
After creating the building model in the Athena Sustainable Materials Institute’s Impact
Estimator (IE), a Bill of Materials and summary measure reports were generated. The results of the
summary measures, normalized to per square foot of usable building space, are: 437 MJ embodied
energy, 250 kg of weighted raw resource use, 37 kg CO2 equivalent/kg global warming potential, 12
moles H+ equivalent/kg acidification potential, 0.10 kg PM2.5 equivalent/kg respiratory effects
potential, 104 kg N equivalent/kg eutrophification potential, less than 0.01 kg CFC-11 equivalent/kg
ozone depletion potential, and 0.15 kg NOx equivalent/kg photochemical smog potential.
Compared to the averaged results from the other LCA studies completed for academic buildings, the
H.R. MacMillan building has a higher value for every impact category except for eutrophification
potential and ozone depletion potential. In these two categories, the final values are too small and
too close to draw definite conclusions. These results mean that the H.R. MacMillan building has a
higher environmental impact compared to the average UBC academic building.
A sensitivity analysis was completed to analyze the relative effects of five materials. Concrete
(20 MPa = 3000 psi) and modular bricks had by far the largest effects in each of the impact
categories. Also from the sensitivity analysis, it was concluded that the large majority of the effects in
the impact categories occurred in the manufacturing life cycle stage, and not in the construction
stage. An analysis was also completed to assess the performance of the building. The current
insulation of the building was compared to improved insulation to meet Residential Environmental
Assessment Program (REAP) standards. The payback period of the building with the improved
insulation was found to be between two to three years.
The results of this LCA are very important to analyze the building design and construction
elements, as well as to assess potential upgrades to the building. Namely, improved insulation could
significantly reduce the operational energy consumption. When these results are combined with the
other LCA studies of other buildings on campus, it creates a powerful network of information from
which to make informed decisions or to make new assessments. It is recommended that these
results be shared with sustainability groups, the building and construction industry, as well as the
University of British Columbia community.

APPENDIX A – FORMATTED INPUTS

General Description Project Name H.R. MacMillan Project Location Vancouver
Building Life Expectancy 1 year
Building Type Institutional
Operating Energy Consumption
1,329,042 kWh/month
Assembly
Group Assembly Type Assembly Name Input Fields Input Values
Known/Measured EIE Inputs 1 Foundation
1.1 Concrete Slab on Grade
1.1.1 - Slab 4'' thick #3 Length (ft) 100 100 Width (ft) 354.34 354.34 Thickness (in) 4 4 Concrete (psi) 3000 3000 Concrete flyash % - average Envelope Category Vapour Barrier Vapour Barrier
Material Polyethylene 4
mil Polyethylene 6
mil 1.1.2 - Slab 8'' thick #4 Length (ft) 100 100 Width (ft) 9.34 9.34 Thickness (in) 8 8 Concrete (psi) 3000 3000 Concrete flyash % - average
1.2 Concrete Footing
1.2.1 - Ftg Linear 14'' x
10'' Length (ft) 25 25 Width (ft) 1.17 1.17 Thickness (in) 10 10 Concrete (psi) 3000 3000 Concrete flyash % - average

Rebar #5 #5
1.2.2 - Ftg Linear 14'' x
12'' Length (ft) 147 147 Width (ft) 1 1 Thickness (in) 12 12 Concrete (psi) 3000 3000 Concrete flyash % - average Rebar #5 #5
1.2.3 - Ftg Linear 16'' x
10'' Length (ft) 19 19 Width (ft) 1.33 1.33 Thickness (in) 10 10 Concrete (psi) 3000 3000 Concrete flyash % - average Rebar #5 #5
1.2.4 - Ftg Linear 16'' x
12'' Length (ft) 150 150 Width (ft) 1.33 1.33 Thickness (in) 12 12 Concrete (psi) 3000 3000 Concrete flyash % - average Rebar #5 #5
1.2.5 - Ftg Linear 20'' x
12'' Length (ft) 1460 1460 Width (ft) 1.67 1.67 Thickness (in) 12 12 Concrete (psi) 3000 3000 Concrete flyash % - average Rebar #5 #5
1.2.6 - Ftg Linear 24'' x
10'' Length (ft) 34 34 Width (ft) 2 2 Thickness (in) 10 10 Concrete (psi) 3000 3000 Concrete flyash % - average Rebar #5 #5
1.2.7 - Ftg Linear 28'' x
10'' Length (ft) 178 178 Width (ft) 2.33 2.33
Thickness (in) 10 10 Concrete (psi) 3000 3000 Concrete flyash % - average Rebar #5 #5
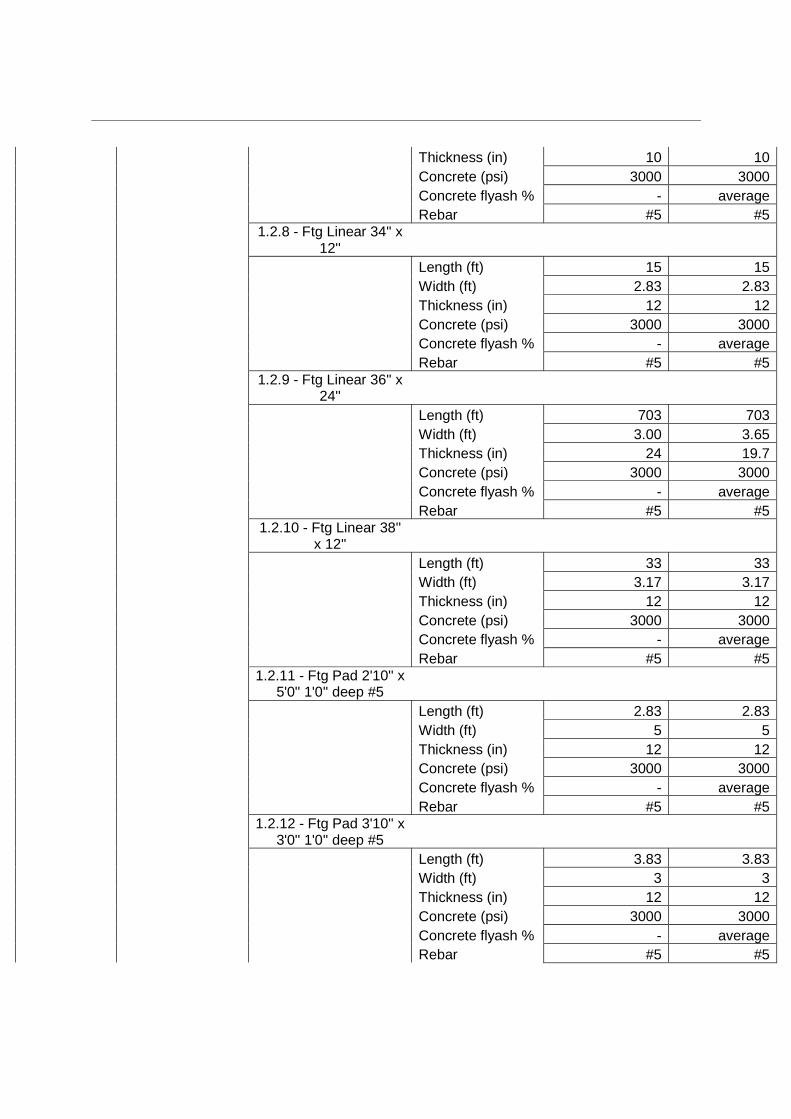
1.2.8 - Ftg Linear 34'' x
12'' Length (ft) 15 15 Width (ft) 2.83 2.83 Thickness (in) 12 12 Concrete (psi) 3000 3000 Concrete flyash % - average Rebar #5 #5
1.2.9 - Ftg Linear 36'' x
24'' Length (ft) 703 703 Width (ft) 3.00 3.65 Thickness (in) 24 19.7 Concrete (psi) 3000 3000 Concrete flyash % - average Rebar #5 #5
1.2.10 - Ftg Linear 38''
x 12'' Length (ft) 33 33 Width (ft) 3.17 3.17 Thickness (in) 12 12 Concrete (psi) 3000 3000 Concrete flyash % - average Rebar #5 #5
1.2.11 - Ftg Pad 2'10'' x
5'0'' 1'0'' deep #5 Length (ft) 2.83 2.83 Width (ft) 5 5 Thickness (in) 12 12 Concrete (psi) 3000 3000 Concrete flyash % - average Rebar #5 #5
1.2.12 - Ftg Pad 3'10'' x
3'0'' 1'0'' deep #5 Length (ft) 3.83 3.83 Width (ft) 3 3 Thickness (in) 12 12 Concrete (psi) 3000 3000 Concrete flyash % - average Rebar #5 #5

1.2.13 - Ftg Pad 4'0'' sq
1'3'' deep #5 Length (ft) 4 4 Width (ft) 4 4 Thickness (in) 15 15 Concrete (psi) 3000 3000 Concrete flyash % - average Rebar #5 #5
1.2.14 - Ftg Pad 4'6'' sq
1'3'' deep #5 Length (ft) 4.5 4.5 Width (ft) 4.5 4.5 Thickness (in) 15 15 Concrete (psi) 3000 3000 Concrete flyash % - average Rebar #5 #5
1.2.15 - Ftg Pad 4'6'' sq
1'3'' deep #6 Length (ft) 4.5 4.5 Width (ft) 4.5 4.5 Thickness (in) 15 15 Concrete (psi) 3000 3000 Concrete flyash % - average Rebar #6 #6
1.2.16 - Ftg Pad 4'6'' x
5'2'' 1'9'' deep #5 Length (ft) 4.5 4.5 Width (ft) 5.17 5.51 Thickness (in) 21 19.7 Concrete (psi) 3000 3000 Concrete flyash % - average Rebar #5 #5
1.2.17 - Ftg Pad 5'0'' sq
1'6'' deep #5 Length (ft) 5 5 Width (ft) 5 5 Thickness (in) 18 18 Concrete (psi) 3000 3000 Concrete flyash % - average Rebar #5 #5
1.2.18 - Ftg Pad 5'2'' sq
1'6'' deep #5 Length (ft) 5.17 5.17 Width (ft) 5.17 5.17 Thickness (in) 18 18
Concrete (psi) 3000 3000 Concrete flyash % - average Rebar #5 #5
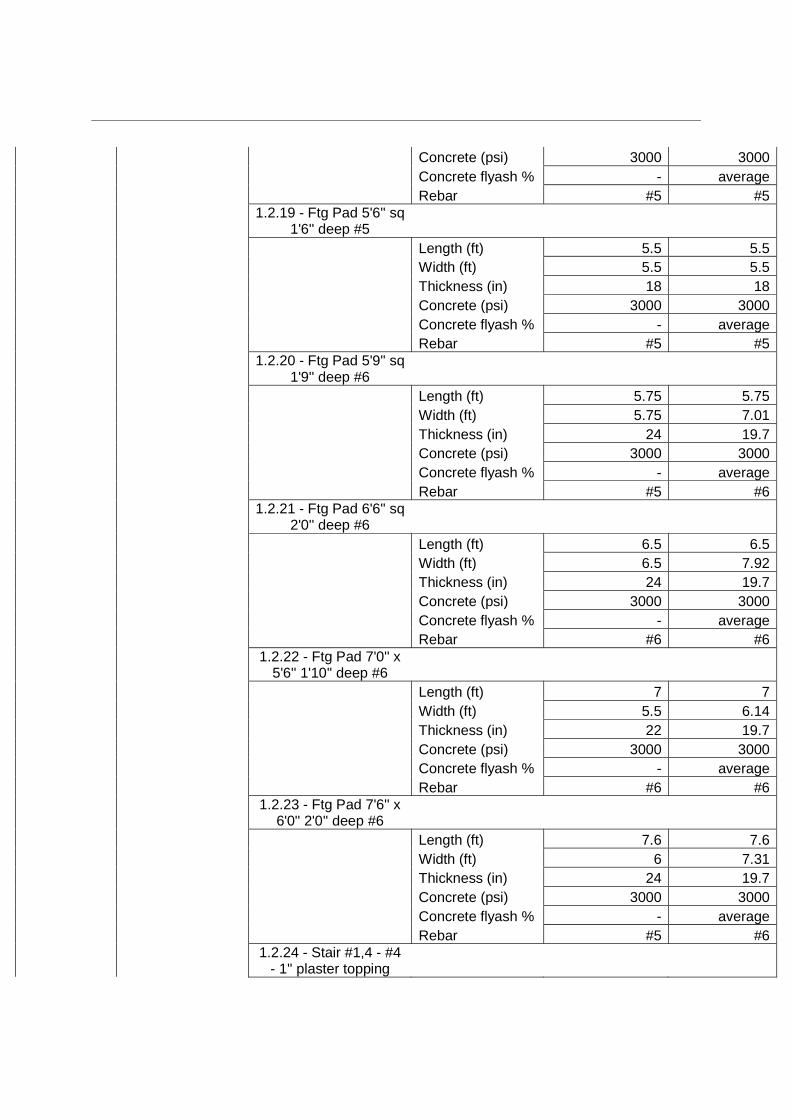
1.2.19 - Ftg Pad 5'6'' sq
1'6'' deep #5 Length (ft) 5.5 5.5 Width (ft) 5.5 5.5 Thickness (in) 18 18 Concrete (psi) 3000 3000 Concrete flyash % - average Rebar #5 #5
1.2.20 - Ftg Pad 5'9'' sq
1'9'' deep #6 Length (ft) 5.75 5.75 Width (ft) 5.75 7.01 Thickness (in) 24 19.7 Concrete (psi) 3000 3000 Concrete flyash % - average Rebar #5 #6
1.2.21 - Ftg Pad 6'6'' sq
2'0'' deep #6 Length (ft) 6.5 6.5 Width (ft) 6.5 7.92 Thickness (in) 24 19.7 Concrete (psi) 3000 3000 Concrete flyash % - average Rebar #6 #6
1.2.22 - Ftg Pad 7'0'' x
5'6'' 1'10'' deep #6 Length (ft) 7 7 Width (ft) 5.5 6.14 Thickness (in) 22 19.7 Concrete (psi) 3000 3000 Concrete flyash % - average Rebar #6 #6
1.2.23 - Ftg Pad 7'6'' x
6'0'' 2'0'' deep #6 Length (ft) 7.6 7.6 Width (ft) 6 7.31 Thickness (in) 24 19.7 Concrete (psi) 3000 3000 Concrete flyash % - average Rebar #5 #6
1.2.24 - Stair #1,4 - #4
- 1'' plaster topping

Length (ft) 276 276 Width (ft) 4.25 4.25 Thickness (in) 10 10 Concrete (psi) 3000 3000 Concrete flyash % - average Rebar #4 #4
1.2.25 - Stair #2,3 - #4
- 1'' plaster topping Length (ft) 342 342 Width (ft) 7.33 7.33 Thickness (in) 10 10 Concrete (psi) 3000 3000 Concrete flyash % - average Rebar #4 #4 1.2.26 - Stair ext - #4 Length (ft) 23 23 Width (ft) 6 6 Thickness (in) 10 10 Concrete (psi) 3000 3000 Concrete flyash % - average Rebar #4 #4
1.2.27 - Pilaster Col'n 0FL Type A 1'0" x 1'7"
Length (ft) 1500 1500 Width (ft) 1.58 1.58 Thickness (in) 12 12 Concrete (psi) 3000 3000 Concrete flyash % - average Rebar #4 #4
1.2.28 - Pilaster Col'n 0FL Type B 1'0" x 1'9"
Length (ft) 3100 3100 Width (ft) 1.75 1.75 Thickness (in) 12 12 Concrete (psi) 3000 3000 Concrete flyash % - average Rebar #4 #4
1.2.29 - Pilaster Col'n 0FL Type C 1'0" x 1'9"
Length (ft) 234 234 Width (ft) 1.75 1.75 Thickness (in) 12 12 Concrete (psi) 3000 3000 Concrete flyash % - average

Rebar #4 #4
1.2.30 - Pilaster Col'n 0FL Type D 1'0" x 1'7"
#7Vert Length (ft) 663 663 Width (ft) 1.75 1.75 Thickness (in) 12 12 Concrete (psi) 3000 3000 Concrete flyash % - average Rebar #4 #4
1.2.31 - Pilaster Col'n 1,2,3FL Type H 1'2.5" x
8" #5Vert Length (ft) 1419 1419 Width (ft) 0.67 0.67 Thickness (in) 14.5 14.5 Concrete (psi) 3000 3000 Concrete flyash % - average Rebar #4 #4
1.2.32 - Pilaster Col'n 1,2,3FL Type M 1'11" x
1'1.5" #5Vert Length (ft) 510 510 Width (ft) 1.25 1.25 Thickness (in) 13.5 13.5 Concrete (psi) 3000 3000 Concrete flyash % - average Rebar #4 #4 2 Custom Wall
2.1 Concrete Block Wall
2.1.1 - 0FL - Int - 4'' conc blk - brick (partial
corridor) Wall Type Interior Interior Length (ft) 308 308 Height (ft) 12 8
Window Opening Number of Windows 0 0
Total Window Area (ft2) 0 0
Fixed or Operable None Fixed Frame Type None None Glazing Type None None Door Opening Number of Doors 8 8

Door Type Solid wood door Solid wood
door Envelope Category Cladding Cladding
Material Bricks - modular Bricks -
modular
2.1.2 - 0FL - Int - 4'' conc blk - plaster (stair
typ) Wall Type Interior Interior Length (ft) 50 50 Height (ft) 12 12
Window Opening Number of Windows 0 0
Total Window Area (ft2) 0 0
Fixed or Operable None Fixed Frame Type None None Glazing Type None None Door Opening Number of Doors 0 0 Door Type None None
Envelope Category Gypsum Board Gypsum
Board
Material Plaster 5/8" Gypsum
regular 5/8"
2.1.3 - 0FL - Int - 4'' conc blk (lab partition
typ) Wall Type Interior Interior Length (ft) 557 557 Height (ft) 12 12
Window Opening Number of Windows 0 0
Total Window Area (ft2) 0 0
Fixed or Operable None Fixed Frame Type None None Glazing Type None None Door Opening Number of Doors 8 8
Door Type Solid wood door Solid wood
door Envelope Category None None Material None None
2.1.4 - 0FL - Int - 8''
conc blk (corridor typ) Wall Type Interior Interior Length (ft) 1250 1250
Height (ft) 12 12
Window Opening Number of Windows 0 0
Total Window Area (ft2) 0 0
Fixed or Operable None Fixed Frame Type None None Glazing Type None None Door Opening Number of Doors 24 24
Door Type Solid wood door Solid wood
door Envelope Category None None Material None None
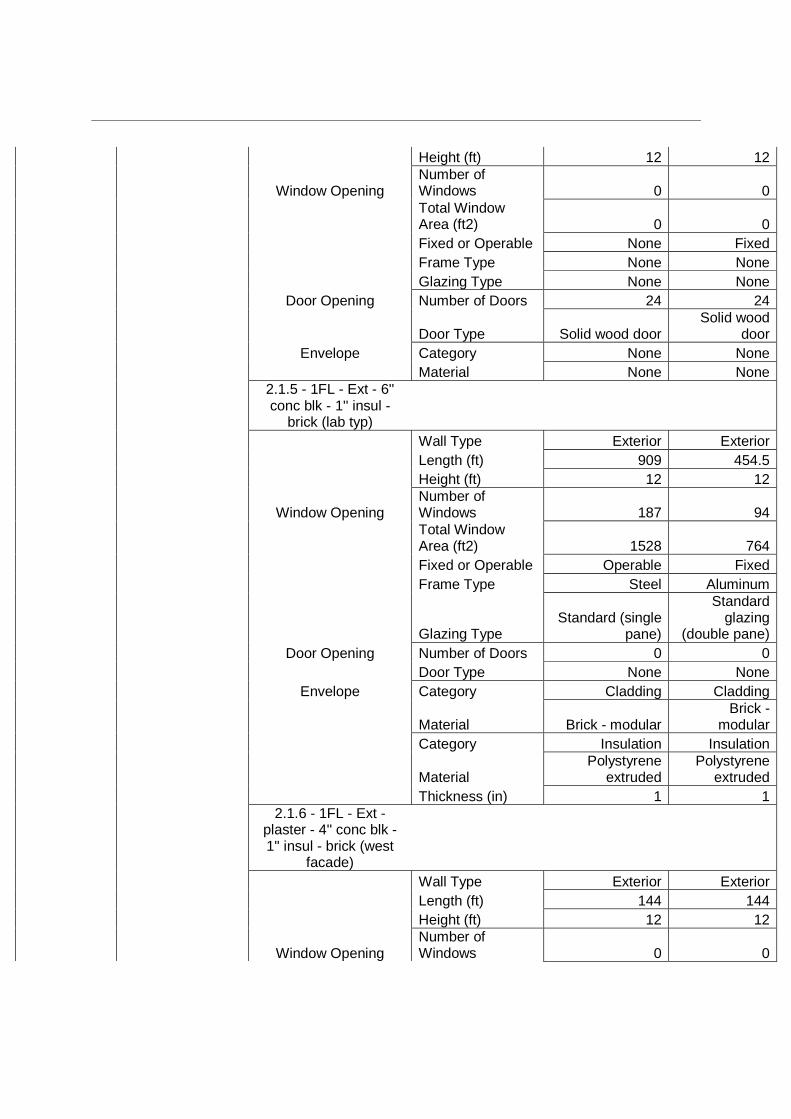
2.1.5 - 1FL - Ext - 6'' conc blk - 1'' insul -
brick (lab typ) Wall Type Exterior Exterior Length (ft) 909 454.5 Height (ft) 12 12
Window Opening Number of Windows 187 94
Total Window Area (ft2) 1528 764
Fixed or Operable Operable Fixed Frame Type Steel Aluminum
Glazing Type Standard (single
pane)
Standard glazing
(double pane) Door Opening Number of Doors 0 0 Door Type None None Envelope Category Cladding Cladding
Material Brick - modular Brick -
modular Category Insulation Insulation
Material Polystyrene
extruded Polystyrene
extruded Thickness (in) 1 1
2.1.6 - 1FL - Ext - plaster - 4'' conc blk - 1'' insul - brick (west
facade) Wall Type Exterior Exterior Length (ft) 144 144 Height (ft) 12 12
Window Opening Number of Windows 0 0

Total Window Area (ft2) 0 0
Fixed or Operable Operable Fixed Frame Type Steel Aluminum
Glazing Type Standard (single
pane)
Standard glazaing
(double pane) Door Opening Number of Doors 0 0 Door Type None None
Envelope Category Gypsum Board Gypsum
Board
Material Plaster 5/8" Gypsum
regular 5/8" Category Insulation Insulation
Material Polystyrene
extruded Polystyrene
extruded Thickness (in) 1 1 Category Cladding Cladding
Material Brick - modular Brick -
modular
2.1.7 - 1FL - Ext - plaster - 6'' conc blk - 1'' insul - brick (office
typ) Wall Type Exterior Exterior Length (ft) 444 444 Height (ft) 12 12
Window Opening Number of Windows 77 77
Total Window Area (ft2) 1177.4 1177.4
Fixed or Operable Operable Fixed Frame Type Steel Aluminum
Glazing Type Standard (single
pane)
Standard glazaing
(double pane) Door Opening Number of Doors 0 0 Door Type None None
Envelope Category Gypsum Board Gypsum
Board
Material Plaster 5/8" Gypsum
regular 5/8" Category Insulation Insulation
Material Polystyrene
extruded Polystyrene
extruded Thickness (in) 1 1 Category Cladding Cladding

Material Brick - modular Brick -
modular
2.1.8 - 1FL - Int - 4''
conc blk - 80% glz door Wall Type Interior Interior Length (ft) 26 26 Height (ft) 12 12
Window Opening Number of Windows 0 0
Total Window Area (ft2) 0 0
Fixed or Operable None Fixed Frame Type None None Glazing Type None None Door Opening Number of Doors 4 4
Door Type Aluminum, 80%
glazing Aluminum,
80% glazing Envelope Category None None Material None None
2.1.9 - 1FL - Int - 4'' conc blk - plaster (stair
typ) Wall Type Interior Interior Length (ft) 75 75 Height (ft) 12 12
Window Opening Number of Windows 0 0
Total Window Area (ft2) 0 0
Fixed or Operable None Fixed Frame Type None None Glazing Type None None Door Opening Number of Doors 0 0 Door Type None None
Envelope Category Gypsum Board Gypsum
Board
Material Plaster 5/8" Gypsum
regular 5/8"
2.1.10 - 1FL - Int - 4'' conc blk (corridor typ)
Wall Type Interior Interior Length (ft) 739 739 Height (ft) 12 12
Window Opening Number of Windows 0 0
Total Window 0 0

Area (ft2)
Fixed or Operable None Fixed Frame Type None None Glazing Type None None Door Opening Number of Doors 35 35
Door Type Solid wood door Solid wood
door Envelope Category None None Material None None
2.1.11 - 1FL - Int - 4'' conc blk (lab partition
typ) Wall Type Interior Interior Length (ft) 1542 1542 Height (ft) 12 12
Window Opening Number of Windows 0 0
Total Window Area (ft2) 0 0
Fixed or Operable None Fixed Frame Type None None Glazing Type None None Door Opening Number of Doors 18 18
Door Type Solid wood door Solid wood
door Envelope Category None None Material None None
2.1.12 - 1FL - Int - plaster - 4'' conc blk - brick (west corridor)
Wall Type Interior Interior Length (ft) 283 283 Height (ft) 12 12
Window Opening Number of Windows 0 0
Total Window Area (ft2) 0 0
Fixed or Operable None Fixed Frame Type None None Glazing Type None None Door Opening Number of Doors 13 13
Door Type Solid wood door Solid wood
door
Envelope Category Gypsum Board Gypsum
Board Material Plaster 5/8" Gypsum
regular 5/8"
Category Cladding Cladding
Material Brick - modular Brick -
modular
2.1.13 - 1FL - Int - plaster - 4'' conc blk - plaster (office/class
partition typ) Wall Type Interior Interior Length (ft) 408 408 Height (ft) 12 12
Window Opening Number of Windows 0 0
Total Window Area (ft2) 0 0
Fixed or Operable None Fixed Frame Type None None Glazing Type None None Door Opening Number of Doors 0 0 Door Type None None
Envelope Category Gypsum Board Gypsum
Board
Material Plaster 5/8" Gypsum
regular 5/8"
Category Gypsum Board Gypsum
Board
Material Plaster 5/8" Gypsum
regular 5/8"
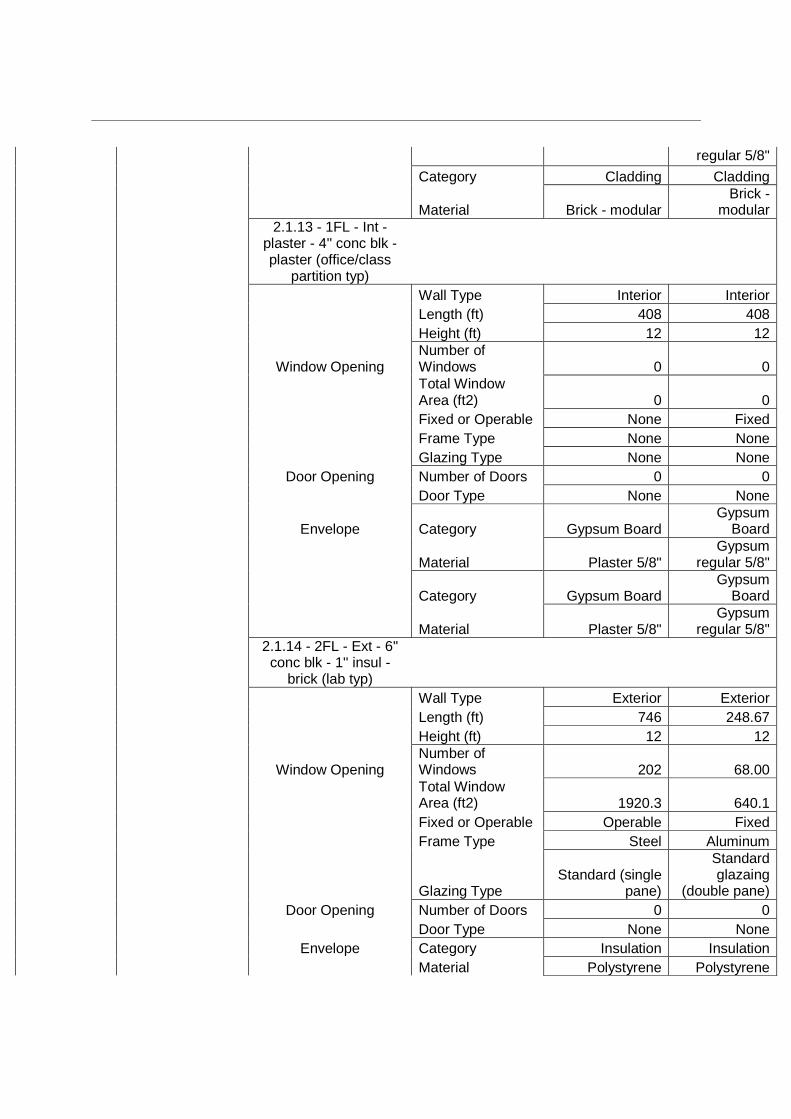
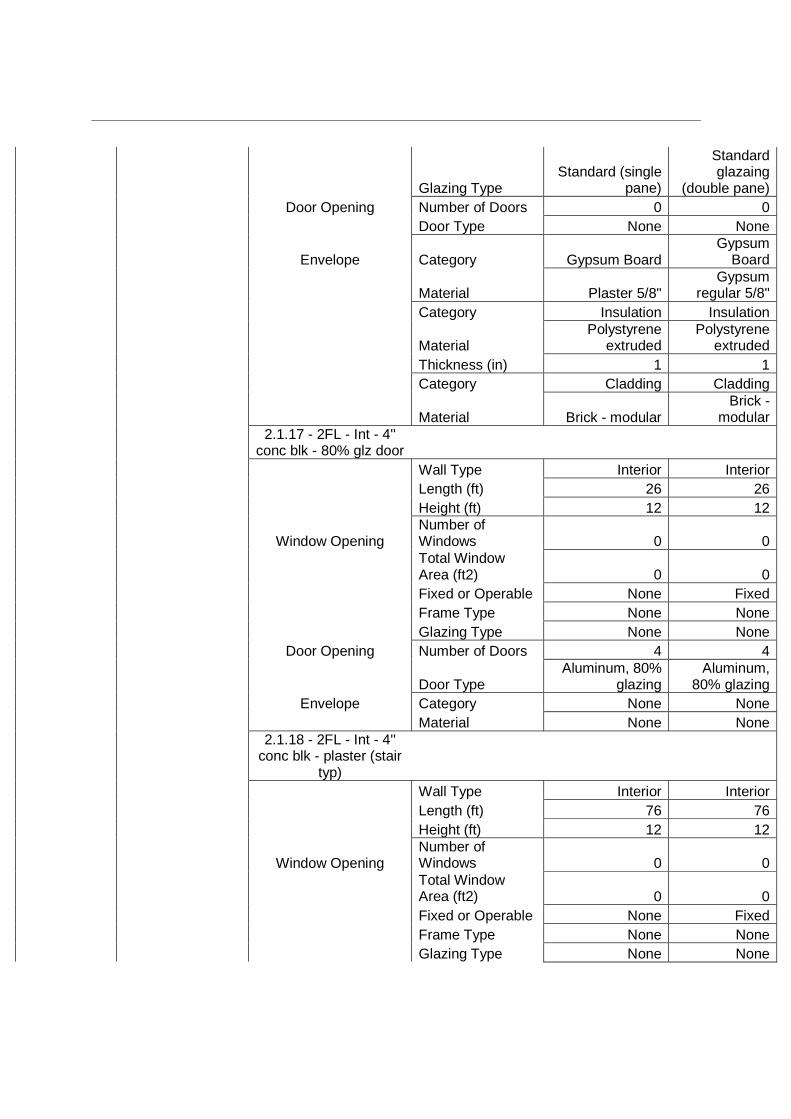
2.1.14 - 2FL - Ext - 6'' conc blk - 1'' insul -
brick (lab typ) Wall Type Exterior Exterior Length (ft) 746 248.67 Height (ft) 12 12
Window Opening Number of Windows 202 68.00
Total Window Area (ft2) 1920.3 640.1
Fixed or Operable Operable Fixed Frame Type Steel Aluminum
Glazing Type Standard (single
pane)
Standard glazaing
(double pane) Door Opening Number of Doors 0 0 Door Type None None Envelope Category Insulation Insulation Material Polystyrene Polystyrene

extruded extruded
Thickness (in) 1 1 Category Cladding Cladding
Material Brick - modular Brick -
modular
2.1.15 - 2FL - Ext - plaster - 6'' conc blk - 1'' insul - brick (office
typ) Wall Type Exterior Exterior Length (ft) 478 746 Height (ft) 12 12
Window Opening Number of Windows 77 77
Total Window Area (ft2) 1177.4 1920.3
Fixed or Operable Operable Fixed Frame Type Steel Aluminum
Glazing Type Standard (single
pane)
Standard glazaing
(double pane) Door Opening Number of Doors 0 0 Door Type None None
Envelope Category Gypsum Board Gypsum
Board
Material Plaster 5/8" Gypsum
regular 5/8" Category Insulation Insulation
Material Polystyrene
extruded Polystyrene
extruded Thickness (in) 1 1 Category Cladding Cladding
Material Brick - modular Brick -
modular
2.1.16 - 2FL - Ext - plaster - 4'' conc blk - 1'' insul - brick (west
facade) Wall Type Exterior Exterior Length (ft) 231 231 Height (ft) 12 12
Window Opening Number of Windows 0 0
Total Window Area (ft2) 0 0
Fixed or Operable Operable Fixed Frame Type Steel Aluminum
Glazing Type Standard (single
pane)
Standard glazaing
(double pane) Door Opening Number of Doors 0 0 Door Type None None
Envelope Category Gypsum Board Gypsum
Board
Material Plaster 5/8" Gypsum
regular 5/8" Category Insulation Insulation
Material Polystyrene
extruded Polystyrene
extruded Thickness (in) 1 1 Category Cladding Cladding
Material Brick - modular Brick -
modular
2.1.17 - 2FL - Int - 4''
conc blk - 80% glz door Wall Type Interior Interior Length (ft) 26 26 Height (ft) 12 12
Window Opening Number of Windows 0 0
Total Window Area (ft2) 0 0
Fixed or Operable None Fixed Frame Type None None Glazing Type None None Door Opening Number of Doors 4 4
Door Type Aluminum, 80%
glazing Aluminum,
80% glazing Envelope Category None None Material None None
2.1.18 - 2FL - Int - 4'' conc blk - plaster (stair
typ) Wall Type Interior Interior Length (ft) 76 76 Height (ft) 12 12
Window Opening Number of Windows 0 0
Total Window Area (ft2) 0 0
Fixed or Operable None Fixed Frame Type None None Glazing Type None None

Door Opening Number of Doors 0 0 Door Type None None
Envelope Category Gypsum Board Gypsum
Board
Material Plaster 5/8" Gypsum
regular 5/8"
2.1.19 - 2FL - Int - 4'' conc blk (corridor typ)
Wall Type Interior Interior Length (ft) 763 763 Height (ft) 12 12
Window Opening Number of Windows 0 0
Total Window Area (ft2) 0 0
Fixed or Operable None Fixed Frame Type None None Glazing Type None None Door Opening Number of Doors 43 43
Door Type Solid wood door Solid wood
door Envelope Category None None Material None None
2.1.20 - 2FL - Int - 4'' conc blk (lab partition
typ) Wall Type Interior Interior Length (ft) 1623 1623 Height (ft) 12 12
Window Opening Number of Windows 0 0
Total Window Area (ft2) 0 0
Fixed or Operable None Fixed Frame Type None None Glazing Type None None Door Opening Number of Doors 29 29
Door Type Solid wood door Solid wood
door Envelope Category None None Material None None
2.1.21 - 2FL - Int - plaster - 4'' conc blk - brick (west corridor)
Wall Type Interior Interior Length (ft) 263 263

Height (ft) 12 12
Window Opening Number of Windows 0 0
Total Window Area (ft2) 0 0
Fixed or Operable None Fixed Frame Type None None Glazing Type None None Door Opening Number of Doors 9 9
Door Type Solid wood door Solid wood
door
Envelope Category Gypsum Board Gypsum
Board
Material Plaster 5/8" Gypsum
regular 5/8" Category Cladding Cladding
Material Brick - modular Brick -
modular
2.1.22 - 2FL - Int - plaster - 4'' conc blk - plaster (office/class
partition typ) Wall Type Interior Interior Length (ft) 623 623 Height (ft) 12 12
Window Opening Number of Windows 0 0
Total Window Area (ft2) 0 0
Fixed or Operable None Fixed Frame Type None None Glazing Type None None Door Opening Number of Doors 0 0 Door Type None None
Envelope Category Gypsum Board Gypsum
Board
Material Plaster 5/8" Gypsum
regular 5/8"
Category Gypsum Board Gypsum
Board
Material Plaster 5/8" Gypsum
regular 5/8"
2.1.23 - 3FL - Ext - 6'' conc blk - 1'' insul -
brick (lab typ) Wall Type Exterior Exterior Length (ft) 746 373

Height (ft) 12 12
Window Opening Number of Windows 135 68
Total Window Area (ft2) 2019.7 1009.85
Fixed or Operable Operable Fixed Frame Type Steel Aluminum
Glazing Type Standard (single
pane)
Standard glazaing
(double pane) Door Opening Number of Doors 0 0 Door Type None None Envelope Category Insulation Insulation
Material Polystyrene
extruded Polystyrene
extruded Thickness (in) 1 1 Category Cladding Cladding
Material Brick - modular Brick -
modular
2.1.24 - 3FL - Ext - plaster - 6'' conc blk - 1'' insul - brick (office
typ) Wall Type Exterior Exterior Length (ft) 485 485 Height (ft) 12 12
Window Opening Number of Windows 77 77
Total Window Area (ft2) 1177.4 1177.4
Fixed or Operable Operable Fixed Frame Type Steel Aluminum
Glazing Type Standard (single
pane)
Standard glazaing
(double pane) Door Opening Number of Doors 0 0 Door Type None None
Envelope Category Gypsum Board Gypsum
Board
Material Plaster 5/8" Gypsum
regular 5/8" Category Insulation Insulation
Material Polystyrene
extruded Polystyrene
extruded Thickness (in) 1 1 Category Cladding Cladding Material Brick - modular Brick -

modular
2.1.25 - 3FL - Int - 4''
conc blk - 80% glz door Wall Type Interior Interior Length (ft) 25 25 Height (ft) 12 12
Window Opening Number of Windows 0 0
Total Window Area (ft2) 0 0
Fixed or Operable None Fixed Frame Type None None Glazing Type None None Door Opening Number of Doors 4 4
Door Type Aluminum, 80%
glazing Aluminum,
80% glazing Envelope Category None None Material None None
2.1.26 - 3FL - Int - 4'' conc blk - plaster (stair
typ) Wall Type Interior Interior Length (ft) 79 79 Height (ft) 12 12
Window Opening Number of Windows 0 0
Total Window Area (ft2) 0 0
Fixed or Operable None Fixed Frame Type None None Glazing Type None None Door Opening Number of Doors 0 0 Door Type None None
Envelope Category Gypsum Board Gypsum
Board
Material Plaster 5/8" Gypsum
regular 5/8"
2.1.27 - 3FL - Int - 4'' conc blk (corridor typ)
Wall Type Interior Interior Length (ft) 772 772 Height (ft) 12 12
Window Opening Number of Windows 0 0
Total Window Area (ft2) 0 0
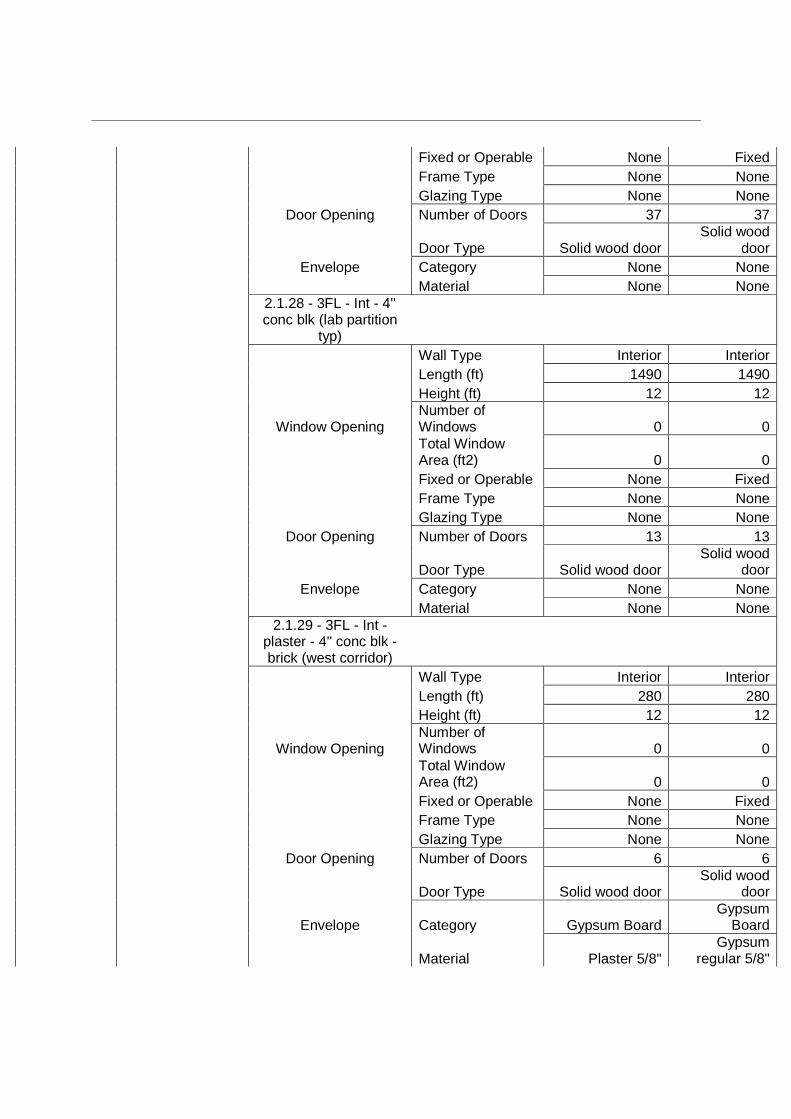
Fixed or Operable None Fixed Frame Type None None Glazing Type None None Door Opening Number of Doors 37 37
Door Type Solid wood door Solid wood
door Envelope Category None None Material None None
2.1.28 - 3FL - Int - 4'' conc blk (lab partition
typ) Wall Type Interior Interior Length (ft) 1490 1490 Height (ft) 12 12
Window Opening Number of Windows 0 0
Total Window Area (ft2) 0 0
Fixed or Operable None Fixed Frame Type None None Glazing Type None None Door Opening Number of Doors 13 13
Door Type Solid wood door Solid wood
door Envelope Category None None Material None None
2.1.29 - 3FL - Int - plaster - 4'' conc blk - brick (west corridor)
Wall Type Interior Interior Length (ft) 280 280 Height (ft) 12 12
Window Opening Number of Windows 0 0
Total Window Area (ft2) 0 0
Fixed or Operable None Fixed Frame Type None None Glazing Type None None Door Opening Number of Doors 6 6
Door Type Solid wood door Solid wood
door
Envelope Category Gypsum Board Gypsum
Board
Material Plaster 5/8" Gypsum
regular 5/8"
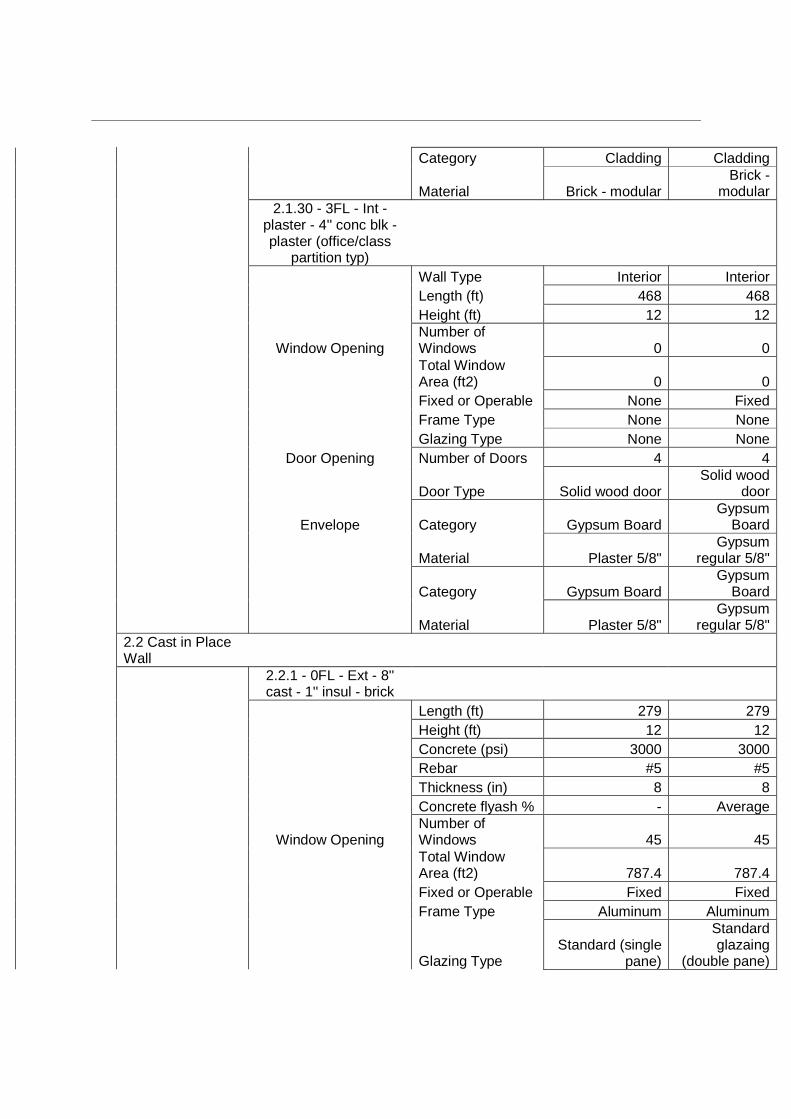
Category Cladding Cladding
Material Brick - modular Brick -
modular
2.1.30 - 3FL - Int - plaster - 4'' conc blk - plaster (office/class
partition typ) Wall Type Interior Interior Length (ft) 468 468 Height (ft) 12 12
Window Opening Number of Windows 0 0
Total Window Area (ft2) 0 0
Fixed or Operable None Fixed Frame Type None None Glazing Type None None Door Opening Number of Doors 4 4
Door Type Solid wood door Solid wood
door
Envelope Category Gypsum Board Gypsum
Board
Material Plaster 5/8" Gypsum
regular 5/8"
Category Gypsum Board Gypsum
Board
Material Plaster 5/8" Gypsum
regular 5/8"
2.2 Cast in Place Wall
2.2.1 - 0FL - Ext - 8'' cast - 1'' insul - brick
Length (ft) 279 279 Height (ft) 12 12 Concrete (psi) 3000 3000 Rebar #5 #5 Thickness (in) 8 8 Concrete flyash % - Average
Window Opening Number of Windows 45 45
Total Window Area (ft2) 787.4 787.4
Fixed or Operable Fixed Fixed Frame Type Aluminum Aluminum
Glazing Type Standard (single
pane)
Standard glazaing
(double pane)

Door Opening Number of Doors 5 5
Door Type Aluminum, 80%
glazing Aluminum,
80% glazing Envelope Category Insulation Insulation
Material Polystyrene
extruded Polystyrene
extruded Thickness (in) 1 1 Category Cladding Cladding
Material Brick - modular Brick -
modular
2.2.2 - 0FL - Ext - 8''
cast - brick Length (ft) 338 338 Height (ft) 12 12 Concrete (psi) 3000 3000 Rebar #5 #5 Thickness (in) 8 8 Concrete flyash % - Average Door Opening Number of Doors 4 4
Door Type Aluminum, 80%
glazing Aluminum,
80% glazing Envelope Category Cladding Cladding
Material Brick - modular Brick -
modular
2.2.3 - 0FL - Ext - plaster - 1'' insul - cast
8'' (below grade) Length (ft) 1255 1255 Height (ft) 15 15 Concrete (psi) 3000 3000 Rebar #5 #5 Thickness (in) 8 8 Concrete flyash % - Average
Window Opening Number of Windows 64 64
Total Window Area (ft2) 741.1 741.1
Fixed or Operable Fixed Fixed Frame Type Aluminum Aluminum
Glazing Type Standard (single
pane)
Standard glazaing
(double pane) Door Opening Number of Doors 4 4
Door Type Aluminum, 80%
glazing Aluminum,
80% glazing Envelope Category Gypsum Board Gypsum

Board
Material Plaster 5/8" Gypsum
regular 5/8" Category Insulation Insulation
Material Polystyrene
extruded Polystyrene
extruded Thickness (in) 1 1
2.2.4 - 1FL - Ext - brick
- 8'' cast - brick Length (ft) 135 135 Height (ft) 12 12 Concrete (psi) 3000 3000 Rebar #5 #5 Thickness (in) 8 8 Concrete flyash % - Average Envelope Category Cladding Cladding
Material Brick - modular Brick -
modular
2.2.5 - 2FL - Ext - brick
- 8'' cast - brick Length (ft) 134 134 Height (ft) 12 12 Concrete (psi) 3000 3000 Rebar #5 #5 Thickness (in) 8 8 Concrete flyash % - Average Envelope Category Cladding Cladding
Material Brick - modular Brick -
modular
2.2.6 - 2FL - Int - 2'' cast - brick (balcony
long) Length (ft) 127 31.75 Height (ft) 7.25 7.25 Concrete (psi) 3000 3000 Rebar #5 #5 Thickness (in) 2 8 Concrete flyash % - Average Envelope Category Cladding Cladding
Material Brick - modular Brick -
modular
2.2.7 - 2FL - Int - 2'' cast - brick (balcony
short) Length (ft) 126 31.5 Height (ft) 3.31 3.31

Concrete (psi) 3000 3000 Rebar #5 #5 Thickness (in) 2 8 Concrete flyash % - Average Envelope Category Cladding Cladding
Material Brick - modular Brick -
modular
2.2.8 - 3FL - Ext - brick
- 8'' cast - brick Length (ft) 130 130 Height (ft) 12 12 Concrete (psi) 3000 3000 Rebar #5 #5 Thickness (in) 8 8 Concrete flyash % - Average Envelope Category Cladding Cladding
Material Brick - modular Brick -
modular
2.2.9 - 3FL - Ext - plaster - 4'' cast - 1''
rigid insul - brick (library)
Length (ft) 225 112.5 Height (ft) 18 18 Concrete (psi) 3000 3000 Rebar #5 #5 Thickness (in) 4 8 Concrete flyash % - Average
Window Opening Number of Windows 1 1
Total Window Area (ft2) 91.1 91.1
Fixed or Operable Fixed Fixed Frame Type Aluminum Aluminum
Glazing Type Standard (single
pane)
Standard glazaing
(double pane)
Envelope Category Gypsum Board Gypsum
Board
Material Plaster 5/8" Gypsum
regular 5/8" Category Insulation Insulation
Material Polystyrene
extruded Polystyrene
extruded Thickness (in) 1 1 Category Cladding Cladding

Material Brick - modular Brick -
modular
2.2.10 - 0FL - Ext - 8" cast - 1" insul - brick (N
loading area) Length (ft) 70 70 Height (ft) 12 12 Concrete (psi) 3000 3000 Rebar #5 #5 Thickness (in) 8 8 Concrete flyash % - Average
Window Opening Number of Windows 0 0
Total Window Area (ft2) 0 0
Fixed or Operable None Fixed Frame Type None None Glazing Type None None Door Opening Number of Doors 4 4
Door Type Steel exterior
door Steel exterior
door Envelope Category Insulation Insulation
Material Polystyrene
extruded Polystyrene
extruded Thickness (in) 1 1 Category Cladding Cladding
Material Brick - modular Brick -
modular 2.3 Curtain Wall
2.3.1 - 0FL - Int - curtain - 90% glz
Length (ft) 31 31 Height (ft) 12 12
Percent Viewable Glazing % 90 90
Percent Spandrel Panel % 10 10
Thickness of insulation (in) 0 0.0001
Metal or Opaque Glass Spandrel Metal Metal
Door Opening Number of Doors 6 6
Door Type Aluminum, 80%
glazing Aluminum,
80% glazing
2.3.2 - 1FL - Int - curtain - 90% glz
Length (ft) 182 182

Height (ft) 12 12
Percent Viewable Glazing % 90 90
Percent Spandrel Panel % 10 10
Thickness of insulation (in) 0 0
Metal or Opaque Glass Spandrel Metal Metal
Door Opening Number of Doors 22 22
Door Type Aluminum, 80%
glazing Aluminum,
80% glazing
2.3.3 - 2FL - Int - curtain - 90% glz
Length (ft) 203 203 Height (ft) 12 12
Percent Viewable Glazing % 90 90
Percent Spandrel Panel % 10 10
Thickness of insulation (in) 0 0
Metal or Opaque Glass Spandrel Metal Metal
Concrete flyash % - Average Door Opening Number of Doors 7 7
Door Type Aluminum, 80%
glazing Aluminum,
80% glazing
2.3.4 - 3FL - Int - curtain - 90% glz
Length (ft) 189 189 Height (ft) 12 12
Percent Viewable Glazing % 90 90
Percent Spandrel Panel % 10 10
Thickness of insulation (in) 0 0
Metal or Opaque Glass Spandrel Metal Metal
Door Opening Number of Doors 13 13
Door Type Aluminum, 80%
glazing Aluminum,
80% glazing 3 Mixed Columns and Beams
3.1 Concrete Column and

Concrete Beam
3.1.1 - 0FL Beams (E wing) & 0FL Beams (E
wing) Number of Beams 10 10
Number of Columns 10 10
Floor to floor height (ft) 13.5 13.5
Bay sizes (ft) 11.7 11.7 Supported span 20.5 20.5 Live load (psf) 120 100
3.1.2 - 0FL Columns (N & S wing) & 0FL
Beams (N & S wing) Number of Beams 48 48
Number of Columns 13 13
Floor to floor height (ft) 13.5 13.5
Bay sizes (ft) 24.77 24.77 Supported span 27 27 Live load (psf) 120 100
3.1.3 - 0FL Columns (W wing) & 0FL Beams
(W wing) Number of Beams 20 20
Number of Columns 20 20
Floor to floor height (ft) 13.5 13.5
Bay sizes (ft) 8.85 10 Supported span 21.5 21.5 Live load (psf) 60 45
3.1.4 - 1FL Columns (E wing) & 1FL Beams (E
wing) Number of Beams 16 16
Number of Columns 10 10
Floor to floor height (ft) 13 13
Bay sizes (ft) 11.90 11.90 Supported span 20.5 20.5 Live load (psf) 120 100
3.1.5 - 1FL Columns (N
& S wing) & 1FL

Beams (N & S wing)
Number of Beams 51 51
Number of Columns 24 24
Floor to floor height (ft) 13 13
Bay sizes (ft) 13.42 13.42 Supported span 27 27 Live load (psf) 120 100
3.1.6 - 1FL Columns (W wing) & 1FL Beams
(W wing) Number of Beams 18 18
Number of Columns 19 19
Floor to floor height (ft) 13 13
Bay sizes (ft) 9.37 10 Supported span 21.5 21.5 Live load (psf) 60 45
3.1.7 - 2FL Columns (E wing) & 2FL Beams (E
wing) Number of Beams 16 16
Number of Columns 10 10
Floor to floor height (ft) 13 13
Bay sizes (ft) 11.8 11.8 Supported span 20.5 20.5 Live load (psf) 120 100
3.1.8 - 2FL Columns (N & S wing) & 2FL
Beams (N & S wing) Number of Beams 48 48
Number of Columns 24 24
Floor to floor height (ft) 13 13
Bay sizes (ft) 13.42 13.42 Supported span 27 27 Live load (psf) 120 100
3.1.9 - 2FL Columns (W wing) & 2FL Beams
(W wing) Number of Beams 18 18 Number of 19 19

Columns
Floor to floor height (ft) 13 13
Bay sizes (ft) 9.32 10 Supported span 21.5 21.5 Live load (psf) 120 100
3.1.10 - 3FL Columns (E wing) & 3FL Beams
(E wing) Number of Beams 17 17
Number of Columns 9 9
Floor to floor height (ft) 13 13
Bay sizes (ft) 10.56 10.56 Supported span 20.5 20.5 Live load (psf) 40 45
3.1.11 - 3FL Columns (N & S wing) & 3FL Beams (N & S wing)
Number of Beams 44 44
Number of Columns 24 24
Floor to floor height (ft) 13 13
Bay sizes (ft) 13.38 13.38 Supported span 27 27 Live load (psf) 40 45
3.1.12 - 3FL Columns (W wing) & 3FL Beams
(W wing) Number of Beams 32 32
Number of Columns 18 18
Floor to floor height (ft) 17.5 17.5
Bay sizes (ft) 9.33 10 Supported span 21.5 21.5 Live load (psf) 40 45
3.2 WF Column and Beam
3.2.1 - Penthouse Columns WF &
Penthouse Beams WF Number of Beams 73 73
Number of Columns 149 149

Floor to floor height (ft) 6 6
Bay sizes (ft) 5.85 10 Supported span 14 14 Live load (psf) 40 45 4 Roofs
4.1 Suspended Slab
4.1.1 - plaster - 4'' Susp slab - cement top
- 1'' rigid insul (W wing)
Roof Width (ft) 148 202.27 Span (ft) 41 30 Concrete (psi) 3000 3000 Concrete flyash % - average Live load (psf) 40 45
Envelope Category Gypsum Board Gypsum
Board
Material Plaster 5/8" Gypsum
regular 5/8" Category Insulation Insulation
Material Polystyrene
extruded Polystyrene
extruded Thickness (in) 1 1
4.1.2 - plaster - 4'' Susp slab - cement top - 1'' rigid insul (E wing)
Roof Width (ft) 148 202.27 Span (ft) 41 30 Concrete (psi) 3000 3000 Concrete flyash % - average Live load (psf) 40 45
Envelope Category Gypsum Board Gypsum
Board
Material Plaster 5/8" Gypsum
regular 5/8" Category Insulation Insulation
Material Polystyrene
extruded Polystyrene
extruded Thickness (in) 1 1
4.1.3 - plaster - 4'' Susp slab - cement top - 1'' rigid insul (N & S
wing) Roof Width (ft) 364 667.33 Span (ft) 55 30

Concrete (psi) 3000 3000 Concrete flyash % - average Live load (psf) 40 45
Envelope Category Gypsum Board Gypsum
Board
Material Plaster 5/8" Gypsum
regular 5/8" Category Insulation Insulation
Material Polystyrene
extruded Polystyrene
extruded Thickness (in) 1 1
4.2 Open Web Steel Joist
4.2.1 - Width - Penthouse - steel joist - metal decking - 1" rigid
insul Roof Width (ft) 436 404.51 Span (ft) 14 15.09 Topping Excluded Excluded Live load (psf) 40 45
Envelope Category Steel Roof
System Steel Roof
System Material Commercial Commercial Category Insulation Insulation
Material Polystyrene
extruded Polystyrene
extruded Thickness (in) 1 1 5 Floors
5.1 Concrete Precast Double T
5.2.1 - 1,2,3 FL + roof - double T - cement top
(E wing typ) Number of bays 693 947 Bay sizes (ft) 2 2 Span (ft) 41 30 Live load (psf) 120 100 Topping Included Included
5.2.2 - 1,2,3 FL + roof - double T - cement top
(N & S wing typ) Number of bays 2214 3985 Bay sizes (ft) 2 2 Span (ft) 54 30 Live load (psf) 120 100

Topping Included Included
5.2.3 - Roof - double T - cement top (E wing)
Number of bays 231 316 Bay sizes (ft) 2 2 Span (ft) 41 30 Live load (psf) 40 45 Topping Included Included
5.2.4 - Roof - double T - cement top (N & S
wing) Number of bays 738 1328 Bay sizes (ft) 2 2 Span (ft) 54 30 Live load (psf) 40 45 Topping Included Included
5.2.5 - 1FL - double T - cement top (W wing)
Number of bays 389 635 Bay sizes (ft) 2 2 Span (ft) 49 30 Live load (psf) 60 45 Topping Included Included
5.2.6 - 2FL - double T - cement top (W wing)
Number of bays 384 512 Bay sizes (ft) 2 2 Span (ft) 40 30 Live load (psf) 60 45 Topping Included Included
5.2.7 - 3FL - double T - cement top (W wing)
Number of bays 368 613 Bay sizes (ft) 2 2 Span (ft) 50 30 Live load (psf) 150 100 Topping Included Included
5.2.8 - Roof - double T - cement top (W wing)
Number of bays 53 87 Bay sizes (ft) 2 2 Span (ft) 49 30 Live load (psf) 40 45 Topping Included Included 6 Extra Basic

Materials
6.1 Concrete Total
20 MPa average flyash (m3) 130.17 130.17
Mortar (m3) 8.63 7.18
6.1.1 - Precast Concrete Cap for
Pilaster Col'n 0,1,2,3FL Types A,B,H,M
20 MPa average flyash (m3) 20.26 20.26
6.1.2 - Precast
Concrete Cap linear
20 MPa average flyash (m3) 109.91 109.91
6.2.1 - Penthouse brick
wall length Mortar (m3) 1.1 1.1
6.2.2 - Pilaster Col'n 0,1,2,3FL Types
A,B,H,M Mortar (m3) 7.53 6.08
6.2 Extra Materials - Cladding
Total
Modular brick (m2) 3393.47 3248.72
6.3.1 - Penthouse brick
wall length
Modular brick (m2) 498.51 498.51
6.3.2- Pilaster Col'n 0,1,2,3FL Types
A,B,H,M
Modular brick (m2) 2894.96 2750.21

APPENDIX B – INPUT ASSUMPTIONS

Assembly Group
Assembly Type Assembly Name Specific Assumptions
1 Foundation The concrete slab on grade (SOG) foundation at the floor of the ground level was modelled using the area condition. In the Impact Estimator (IE), there are two options for the SOG thickness: 4” or 8” thickness. In cases where the ideal rebar input was unavailable in the Impact Estimator, the next nearest option was selected and assumed for modelling purposes. The concrete flyash content was not specified in the drawings; it was assumed to be the average amount. Concrete is assumed to have a strength of 3000 psi for all cases unless otherwise noted, as specified. Also, the vapour barrier was assumed to be 6 mil, instead of 4 mil, as this was the only option in the IE. Concrete footings used to help form the building foundation were modelled using either the linear condition (e.g. strip/wall footings with specified cross-sectional dimensions) or the count condition (e.g. pad/column footings with specified dimensions). The IE limits the thickness of footings to 19.7". For footings thicker than this limit, the thickness was set to 19.7" and the width was increased accordingly to maintain equal volume. See drawings 386-07-009 and 386-07-010 for specifications of footing dimensions. The linear condition was used to model the concrete stairs as footings. After measuring an average stair thickness (assumed to be 10”) and width, the length of stairs was measured using a linear condition. The internal stairs have a 1” plaster topping which was omitted as the IE does not have an option to add a layer of plaster to concrete footings. The concrete columns inside the pilasters surrounding the exterior of the building are modelled as footings. The cross-sectional dimensions are specified (drawings 386-07-011 and drawings 386-07-013) and the lengths were measured using a linear condition. The pilaster columns contain various rebar sizes; #4 rebar was assumed to be the average. For all concrete footings, the flyash content was not specified in the drawings; it was assumed to be the average amount. Concrete is assumed to have a strength of 3000 psi for all cases unless otherwise noted, as specified.
1.1 Concrete Slab-on-Grade
1.1.1 - Slab 4'' thick #3 The area of this slab was measured to be 35434 square feet. The following calculation determines the width input after arbitrarily selecting 100 feet as the length. = (35454 ft2) / (100 ft) = 354.34 ft
1.1.2 - Slab 8'' thick #4 The area of this slab was measured to be 934 square feet. The following calculation determines the width input after arbitrarily selecting 100 feet as the length. = (934 ft2) / (100 ft) = 9.34 ft
1.2 Concrete Footing 1.2.9 - Ftg Linear 36'' x 24'' The Impact Estimator limits the thickness of a
footing to be a maximum of 19.7". The measured length was maintained and the thickness was set at 19.7". The following calculation determines the width input based on the same volume of concrete footing. = [length x width x thickness] / [length x (19.7"/12)] = [703' x 3' x (24"/12)] / [703' x (19.7"/12)]

= 3.65 feet
1.2.16 - Ftg Pad 4'6'' x 5'2'' 1'9'' deep #5
The Impact Estimator limits the thickness of a footing to be a maximum of 19.7". The measured length was maintained and the thickness was set at 19.7". The following calculation determines the width input based on the same volume of concrete footing. = [length x width x thickness] / [length x (19.7"/12)] = [4.5' x (5+2/12)' x (21"/12)] / [4.5' x (19.7"/12)] = 5.51 feet
1.2.20 - Ftg Pad 5'9'' sq 1'9'' deep #6
The Impact Estimator limits the thickness of a footing to be a maximum of 19.7". The measured length was maintained and the thickness was set at 19.7". The following calculation determines the width input based on the same volume of concrete footing. = [length x width x thickness] / [length x (19.7"/12)] = [5.75' x 5.75' x (24"/12)] / [5.75' x (19.7"/12)] = 7.01 feet
1.2.21 - Ftg Pad 6'6'' sq 2'0'' deep #6
The Impact Estimator limits the thickness of a footing to be a maximum of 19.7". The measured length was maintained and the thickness was set at 19.7". The following calculation determines the width input based on the same volume of concrete footing. = [length x width x thickness] / [length x (19.7"/12)] = [6.5' x 6.5' x (24"/12)] / [6.5' x (19.7"/12)] = 7.92 feet
1.2.22 - Ftg Pad 7'0'' x 5'6'' 1'10'' deep #6
The Impact Estimator limits the thickness of a footing to be a maximum of 19.7". The measured length was maintained and the thickness was set at 19.7". The following calculation determines the width input based on the same volume of concrete footing. = [length x width x thickness] / [length x (19.7"/12)] = [7' x 5.5' x (22"/12)] / [7' x (19.7"/12)] = 6.14 feet

1.2.23 - Ftg Pad 7'6'' x 6'0'' 2'0'' deep #6
The Impact Estimator limits the thickness of a footing to be a maximum of 19.7". The measured length was maintained and the thickness was set at 19.7". The following calculation determines the width input based on the same volume of concrete footing. = [length x width x thickness] / [length x (19.7"/12)] = [7.6' x 6' x (24"/12)] / [7.6' x (19.7"/12)] = 7.31 feet
1.2.24 - Stair #1,4 - #4 - 1'' plaster topping
The concrete footing assembly group was used to model stairs because of its flexibility in adjusting thickness. The linear condition was used to measure the length after the width and average thickness was measured, also using a linear condition. Stairs #1 and #4 are identical. The following calculation calculates the length of both. = (number of stairs) x (length of stairs) = 2 x 138' = 276 feet The Impact Estimator does not have an option add a plaster topping to the concrete footing so the plaster topping was omitted.
1.2.25 - Stair #2,3 - #4 - 1'' plaster topping
The concrete footing assembly group was used to model stairs because of its flexibility in adjusting thickness. The linear condition was used to measure the length after the width and average thickness was measured, also using a linear condition. Stairs #2 and #3 are identical. The following calculation calculates the length of both. = (number of stairs) x (length of stairs) = 2 x 171' = 342 feet The Impact Estimator does not have an option add a plaster topping to the concrete footing so the plaster topping was omitted.
1.2.26 - Stair ext - #4 The thickness of the external stairs were unspecified nor was there a clear cross-sectional view of the stairs. The thickness was assumed to be the same as those of other stairs (10"). The #4 rebar was also assumed as it was unspecified.

1.2.27 - Pilaster Col'n 0FL Type A 1'0" x 1'7"
The following calculation determines the length input for all Type A pilasters modelled as a concrete footing. = (height of one pilaster) x (number of Type A pilasters) = 50' x 30 = 1500 feet
1.2.28 - Pilaster Col'n 0FL Type B 1'0" x 1'9"
The following calculation determines the length input for all Type B pilasters modelled as a concrete footing. = (height of one pilaster) x (number of Type B pilasters) = 50' x 62 = 3100 feet
1.2.29 - Pilaster Col'n 0FL Type C 1'0" x 1'9"
The following calculation determines the length input for all Type C pilasters modelled as a concrete footing. = (height of one pilaster) x (number of Type C pilasters) = 39' x 6 = 234 feet
1.2.30 - Pilaster Col'n 0FL Type D 1'0" x 1'7" #7Vert
The following calculation determines the length input for all Type D pilasters modelled as a concrete footing. = (height of one pilaster) x (number of Type D pilasters) = 39' x 17 = 663 feet
1.2.31 - Pilaster Col'n 1,2,3FL Type H 1'2.5" x 8" #5Vert
The following calculation determines the length input for all Type H pilasters modelled as a concrete footing. = (height of one pilaster) x (number of Type H pilasters) = 43' x 33 = 1419 feet

1.2.32 - Pilaster Col'n 1,2,3FL Type M 1'11" x 1'1.5" #5Vert
The following calculation determines the length input for all Type H pilasters modelled as a concrete footing. = (height of one pilaster) x (number of Type H pilasters) = 30' x 17 = 510 feet
2 Custom Wall The majority of walls in the H.R. MacMillan building are concrete block walls. They were modelled using the linear condition for distances. The linear condition was also used to measure the wall height and it was found to be 12’. This value is used as an assumption for the heights of all walls. A different category was used to measure walls depending on the type of wall construction. Some walls have 1” rigid insulation (assumed to be 1” extruded polystyrene), modular brick cladding, or plaster finish, or a combination of these elements. A different category was also used for walls with differing openings, such as solid wood doors, glazed steel doors, or window openings. In the IE, concrete block walls are assumed to use 8” x 8” x 16” hollow concrete blocks with every third vertical core grouted and reinforced with one steel bar (assumed to be #4), and additional grouting and rebar is included at all openings. These conditions are assumed for all concrete block walls in MacMillan. For all instances where walls had a plaster finish, it was assumed to be regular 5/8” thick gypsum board (plaster is not available as an option in the IE). Even though operable windows is an option in the IE, all windows are considered fixed for conformity to the rest of the LCA studies conducted on other UBC buildings. Steel window frames are also assumed to be aluminum frames in the IE as there is no option for steel. All doors made from wood, including those that are glazed, are assumed to be solid wooden doors, as there are no options for partially glazed wooden doors in the IE. Glazed aluminum doors were assumed to be 80% glazed. Some of the walls of the ground floor are cast in place concrete walls. They were measured using the linear condition. Similar to concrete block walls, different categories were used to perform takeoffs depending on the wall construction and wall openings. All the same assumptions were made. Note that bituminous waterproof compound was omitted as it is not available in the IE. Glazed curtain walls occur most often at the doorways to external and internal stairs. They are also modelled using the linear condition. It was assumed that the curtain walls had 90% viewable glazing and 10% opaque metal spandrel. The IE also requires a positive input for thickness of insulation. Since there was no insulation, this was assumed to be 0.0001. All the glazed metal doors were assumed to be 80% glazed aluminum doors.
2.1 Concrete Block Wall
2.1.3 - 0FL - Int - 4'' conc blk (lab partition typ)
The wall layout drawings for the north side of the ground floors were unavailable. Thus the walls on the north side were estimated based on a physical site visit. The total length for this type of wall is 557' is based on a known length of 486' measured from drawings for the south side and an estimated length of 71' for the north side.

2.1.4 - 0FL - Int - 8'' conc blk (corridor typ)
The wall layout drawings for the north side of the ground floors were unavailable. Thus the walls on the north side were estimated based on a physical site visit. The total length for this type of wall is 1250' is based on a known length of 510' measured from drawings for the south side and an estimated length of 740' for the north side.
2.1.5 - 1FL - Ext - 6'' conc blk - 1'' insul - brick (lab typ)
The Impact Estimator limits the door or window openings to a maximum of 100. In such cases, the total length of the wall, the number of window openings, and the window area are divided by 2 or 3, to decrease the number of openings (door or window) to less than 100. Then the assembly can be duplicated 2 or 3 times, accordingly, in the Impact Estimator. The following calculation determines the length and number of windows input. = total length of wall / 2 = 909' / 2 = 454.5 feet = number of windows / 2 = 187 / 2 = 94 = total window area / 2 = 1528 ft2 / 2 = 764 square feet The assembly was duplicated one time.
2.1.14 - 2FL - Ext - 6'' conc blk - 1'' insul - brick (lab typ)
The Impact Estimator limits the door or window openings to a maximum of 100. In such cases, the total length of the wall, the number of window openings, and the window area are divided by 2 or 3, to decrease the number of openings (door or window) to less than 100. Then the assembly can be duplicated 2 or 3 times, accordingly, in the Impact Estimator. The following calculation determines the length and number of windows input. = total length of wall / 3 = 746' / 3 = 248.67 feet = number of windows / 3 = 202 / 3 = 68 = total window area / 3 = 1920.3 ft2 / 3 = 640.1 square feet The assembly was duplicated two times.

2.1.23 - 3FL - Ext - 6'' conc blk - 1'' insul - brick (lab typ)
The Impact Estimator limits the door or window openings to a maximum of 100. In such cases, the total length of the wall, the number of window openings, and the window area are divided by 2 or 3, to decrease the number of openings (door or window) to less than 100. Then the assembly can be duplicated 2 or 3 times, accordingly, in the Impact Estimator. The following calculation determines the length and number of windows input. = total length of wall / 2 = 746' / 2 = 373 feet = number of windows / 2 = 135 / 2 = 68 = total window area / 2 = 2019.7 ft2 / 2 = 1009.85 square feet The assembly was duplicated one time.
2.2.6 - 2FL - Int - 2'' cast - brick (balcony long)
The Impact Estimator has two options for the thickness of a cast in place wall: 8" or 12". This 4" cast balcony wall on the 2nd floor has brick on both sides but up to different heights. The measured height was maintained and the thickness was set to 8". The following calculation determines the length input based on the same volume. = [length x width x thickness] / [length x (8"/12)] = [127.5 x 7.25' x (2"/12)] / [7.25' x (8"/12)] = 31.75 feet
2.2.7 - 2FL - Int - 2'' cast - brick (balcony short)
The Impact Estimator has two options for the thickness of a cast in place wall: 8" or 12". This 4" cast balcony wall on the 2nd floor has brick on both sides but up to different heights. The measured height was maintained and the thickness was set to 8". The following calculation determines the length input based on the same volume. = [length x width x thickness] / [length x (8"/12)] = [126 x 3.31' x (2"/12)] / [3.31" x (8"/12)] = 31.5 feet

3 Mixed Columns and Beams
Concrete columns and beams support the floors in H.R. MacMillan. The linear and count conditions were used to measure these elements. The count condition was used to measure the number of columns and beams. The linear condition was used to measure the floor to floor height. The bay size measurement was obtained by using the linear condition to measure the total distance between a series of columns, then dividing that by the number of columns to produce the average bay size. The IE requires that the bay size be 10’ or greater. The bay size was assumed to be 10’ in cases where the average bay size was less than 10’. The supported span was obtained by using the linear condition to measure the total span, then dividing that by two to produce the average span. The total span was divided by two since the floors are supported at each external wall, and in between by one series of columns. In the IE, three options are available for the live load: 45 psf, 75 psf, and 100 psf. None of the specified live loads matched these options so the closest options were assumed. For labs and offices, 100 psf was used instead of the specified 120 psf (labs) and 50 psf (offices) for a conservative assumption. For classrooms, 45 psf was used instead of the specified 60 psf since 100 psf was an overestimation for labs and offices; this creates a more balanced overall estimate. For the third floor columns supporting the roof, 45 psf was used for the specified snow load of 40 psf. Note that the size of the columns and beams are not considered by the IE. Steel wide flange columns and beams are used for the ‘penthouse’, which acts as a protective housing for the exhaust ducts from the labs. Similar to concrete columns and beams, the count condition was used to measure the number of columns and beams, and the linear condition was used to measure the floor to floor height. The same technique was used to obtain the average bay size. The calculated average bay size was 5.85’ but it is assumed to be 10’ due to this limitation in the IE.
3.1 Concrete Column and Concrete Beam
3.1.1 - 0FL Beams (E wing) & 0FL Beams (E wing)
The bay size was calculated by measuring the total distance of a series of columns then dividing that by the number of columns for the average bay size. The following calculation determines the bay size input based on the measured total bay size and the number of columns. = (measured total bay size) / (number of columns) = 117' / 10 = 11.7 feet The following calculation determines the span size input based on the measured total span and two sides that the column supports. = (measured total span size) / 2 = 41' / 2 = 20.5 feet

3.1.2 - 0FL Columns (N & S wing) & 0FL Beams (N & S wing)
The bay size was calculated by measuring the total distance of a series of columns then dividing that by the number of columns for the average bay size. The following calculation determines the bay size input based on the measured total bay size and the number of columns. = (measured total bay size) / (number of columns) = 322' / 13 = 24.77 feet The following calculation determines the span size input based on the measured total span and two sides that the column supports. = (measured total span size) / 2 = 54' / 2 = 27 feet
3.1.3 - 0FL Columns (W wing) & 0FL Beams (W wing)
The bay size was calculated by measuring the total distance of a series of columns then dividing that by the number of columns for the average bay size. The following calculation determines the bay size input based on the measured total bay size and the number of columns. = (measured total bay size) / (number of columns) = 177' / 20 = 8.85 feet --> 10 feet The Impact Estimator requires the bay size to be a minimum of 10'. In cases where the bay size is less than 10', it is assumed to be 10'. The following calculation determines the span size input based on the measured total span and two sides that the column supports. = (measured total span size) / 2 = 43' / 2 = 21.5 feet

3.1.4 - 1FL Columns (E wing) & 1FL Beams (E wing)
The bay size was calculated by measuring the total distance of a series of columns then dividing that by the number of columns for the average bay size. The following calculation determines the bay size input based on the measured total bay size and the number of columns. = (measured total bay size) / (number of columns) = 119' / 10 = 11.9 feet The following calculation determines the span size input based on the measured total span and two sides that the column supports. = (measured total span size) / 2 = 41' / 2 = 20.5 feet
3.1.5 - 1FL Columns (N & S wing) & 1FL Beams (N & S wing)
The bay size was calculated by measuring the total distance of a series of columns then dividing that by the number of columns for the average bay size. The following calculation determines the bay size input based on the measured total bay size and the number of columns. = (measured total bay size) / (number of columns) = 322' / 24 = 13.42 feet The following calculation determines the span size input based on the measured total span and two sides that the column supports. = (measured total span size) / 2 = 54' / 2 = 27 feet

3.1.6 - 1FL Columns (W wing) & 1FL Beams (W wing)
The bay size was calculated by measuring the total distance of a series of columns then dividing that by the number of columns for the average bay size. The following calculation determines the bay size input based on the measured total bay size and the number of columns. = (measured total bay size) / (number of columns) = 178' / 19 = 9.37 feet --> 10 feet The Impact Estimator requires the bay size to be a minimum of 10'. In cases where the bay size is less than 10', it is assumed to be 10'. The following calculation determines the span size input based on the measured total span and two sides that the column supports. = (measured total span size) / 2 = 43' / 2 = 21.5 feet
3.1.7 - 2FL Columns (E wing) & 2FL Beams (E wing)
The bay size was calculated by measuring the total distance of a series of columns then dividing that by the number of columns for the average bay size. The following calculation determines the bay size input based on the measured total bay size and the number of columns. = (measured total bay size) / (number of columns) = 118' / 10 = 11.8 feet The following calculation determines the span size input based on the measured total span and two sides that the column supports. = (measured total span size) / 2 = 41' / 2 = 20.5 feet
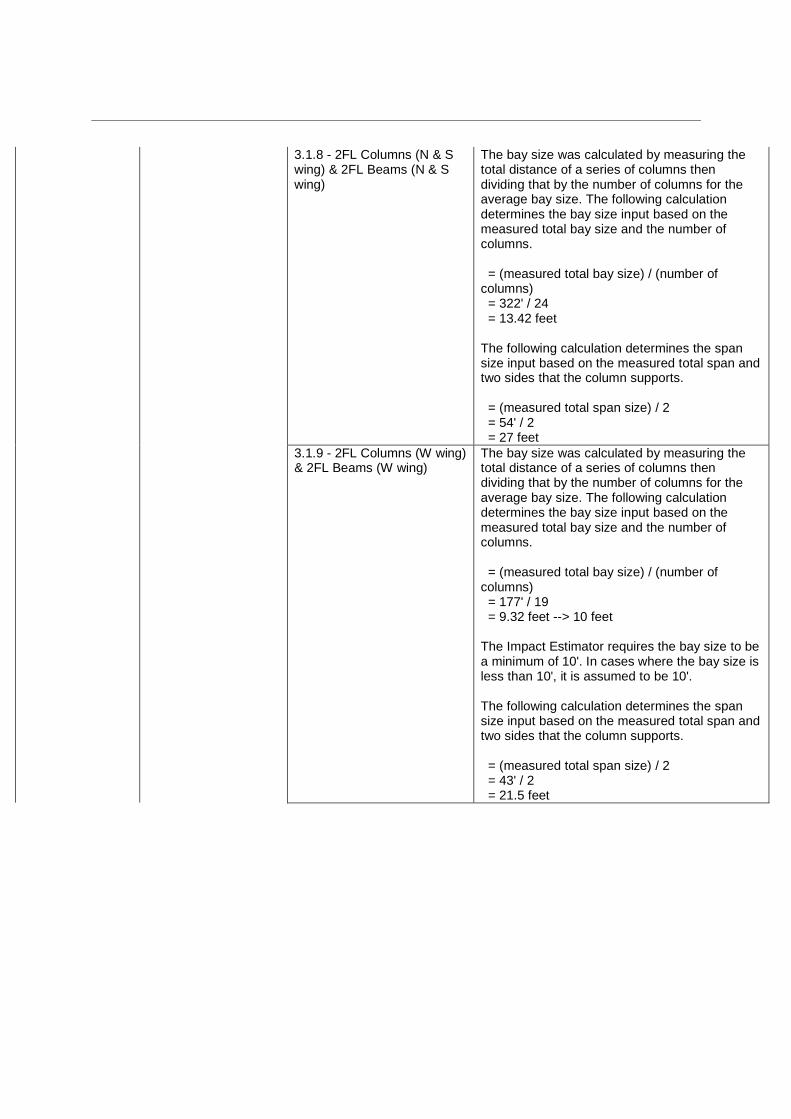
3.1.8 - 2FL Columns (N & S wing) & 2FL Beams (N & S wing)
The bay size was calculated by measuring the total distance of a series of columns then dividing that by the number of columns for the average bay size. The following calculation determines the bay size input based on the measured total bay size and the number of columns. = (measured total bay size) / (number of columns) = 322' / 24 = 13.42 feet The following calculation determines the span size input based on the measured total span and two sides that the column supports. = (measured total span size) / 2 = 54' / 2 = 27 feet
3.1.9 - 2FL Columns (W wing) & 2FL Beams (W wing)
The bay size was calculated by measuring the total distance of a series of columns then dividing that by the number of columns for the average bay size. The following calculation determines the bay size input based on the measured total bay size and the number of columns. = (measured total bay size) / (number of columns) = 177' / 19 = 9.32 feet --> 10 feet The Impact Estimator requires the bay size to be a minimum of 10'. In cases where the bay size is less than 10', it is assumed to be 10'. The following calculation determines the span size input based on the measured total span and two sides that the column supports. = (measured total span size) / 2 = 43' / 2 = 21.5 feet

3.1.10 - 3FL Columns (E wing) & 3FL Beams (E wing)
The bay size was calculated by measuring the total distance of a series of columns then dividing that by the number of columns for the average bay size. The following calculation determines the bay size input based on the measured total bay size and the number of columns. = (measured total bay size) / (number of columns) = 95' / 9 = 10.56 feet The following calculation determines the span size input based on the measured total span and two sides that the column supports. = (measured total span size) / 2 = 41' / 2 = 20.5 feet
3.1.11 - 3FL Columns (N & S wing) & 3FL Beams (N & S wing)
The bay size was calculated by measuring the total distance of a series of columns then dividing that by the number of columns for the average bay size. The following calculation determines the bay size input based on the measured total bay size and the number of columns. = (measured total bay size) / (number of columns) = 321' / 24 = 13.38 feet The following calculation determines the span size input based on the measured total span and two sides that the column supports. = (measured total span size) / 2 = 54' / 2 = 27 feet

3.1.12 - 3FL Columns (W wing) & 3FL Beams (W wing)
The bay size was calculated by measuring the total distance of a series of columns then dividing that by the number of columns for the average bay size. The following calculation determines the bay size input based on the measured total bay size and the number of columns. = (measured total bay size) / (number of columns) = 168' / 18 = 9.33 feet --> 10 feet The Impact Estimator requires the bay size to be a minimum of 10'. In cases where the bay size is less than 10', it is assumed to be 10'. The following calculation determines the span size input based on the measured total span and two sides that the column supports. = (measured total span size) / 2 = 43' / 2 = 21.5 feet
3.2 WF Column and Beam
3.2.1 - Penthouse Columns
WF & Penthouse Beams WF The bay size was calculated by measuring the total distance of a series of columns then dividing that by the number of columns for the average bay size. The following calculation determines the bay size input based on the measured total bay size and the number of columns. = (measured total bay size) / (number of columns) = 2 x 436' / 149 = 5.85 feet --> 10 feet The Impact Estimator requires the bay size to be a minimum of 10'. In cases where the bay size is less than 10', it is assumed to be 10'.
4 Roofs A suspended slab roof is used for the H.R. MacMillan building. The linear condition was used to measure the width and spans of the roof. The IE requires the span input to be 30’. Thus for instances where the span is greater than 30’, the span is set to 30’ and the width is adjusted accordingly to maintain the same area. The live load was assumed to be 45 psi, the nearest option to the specified 40 psf snow load. The plaster finish was assumed to be regular 5/8” gypsum board as plaster is not available as an option in the IE. The 1” rigid insulation was assumed to be 1” extruded polystyrene. The flyash content was not specified in the drawings; it was assumed to be the average amount. Concrete is assumed to have a strength of 3000 psi for all cases unless otherwise noted, as specified. The roof of the ‘penthouse’ was assumed to be an open web steel joist roof. Similar to the suspended slab roof, the width and span was measured using the linear condition. In the IE, the span requires a minimum of 15.09’. The span was set to 15.09’ and the width was adjusted accordingly to maintain the same area. It

was assumed to be a commercial steel roof system.
4.1 Suspended Slab 4.1.1 - plaster - 4'' Susp slab -
cement top - 1'' rigid insul (W wing)
In the Impact Estimator, the span is limited to a maximum of 30'. The following calculation determines the width input based on setting the span to 30' and to maintain the same area. = (measured length) x (measured span) / 30' = 148' x 41' / 30' = 202.27 feet
4.1.2 - plaster - 4'' Susp slab - cement top - 1'' rigid insul (E wing)
In the Impact Estimator, the span is limited to a maximum of 30'. The following calculation determines the width input based on setting the span to 30' and to maintain the same area. = (measured length) x (measured span) / 30' = 148' x 41' / 30' = 202.27 feet
4.1.3 - plaster - 4'' Susp slab - cement top - 1'' rigid insul (N & S wing)
In the Impact Estimator, the span is limited to a maximum of 30'. The following calculation determines the width input based on setting the span to 30' and to maintain the same area. = (measured length) x (measured span) / 30' = 364' x 55' / 30' = 667.33 feet
4.2 Open Web Steel Joist
4.2.1 - Width - Penthouse - steel joist - metal decking - 1" rigid insul
In the Impact Estimator, the span is limited to a minimum of 15.09'. The following calculation determines the width input based on setting the span to 15.09' and to maintain the same area. = (measured length) x (measured span) / 15.09' = 436' x 14' / 15.09' = 404.51 feet The commercial steel roof system was the nearest option to the actual steel roof assembly.
5 Floors Concrete precast tees are used for the flooring system. Although the precast tees in the H.R. MacMillan building are single and not double tees, this was assumed to be the case as it is the closest option. The count and linear condition was used to take measurements. The count condition was used to measure the number of bays and the linear condition was used to measure the bay size and the span size. The technique used to measure span size was the same as that used in concrete columns and beams. Due the

span size being limited to 30’, the span was set to 30’ and the number of bays was adjusted accordingly to produce the equivalent floor size. The live load assumptions were the same as that used in concrete columns and beams.
5.1 Concrete Precast Double T
5.2.1 - 1,2,3 FL + roof - double T - cement top (E wing typ)
In the Impact Estimator, the span is limited to a maximum of 30'. The following calculation determines the number of bays input based on setting the span to 30' and to maintain the same area. It is also multiplied by 3 for 3 repeated floors. = (number of floors) x (number of bays) x (measured span) / 30' = 3 x 231 x 41' / 30' = 947 bays
5.2.2 - 1,2,3 FL + roof - double T - cement top (N & S wing typ)
In the Impact Estimator, the span is limited to a maximum of 30'. The following calculation determines the number of bays input based on setting the span to 30' and to maintain the same area. It is also multiplied by 2 for the north and side sides, and by 3 for 3 repeated floors. = (number of sides) x (number of floors) x (number of bays) x (measured span) / 30' = 2 x 3 x 369 x 54' / 30' = 3985 bays
5.2.3 - Roof - double T - cement top (E wing)
In the Impact Estimator, the span is limited to a maximum of 30'. The following calculation determines the number of bays input based on setting the span to 30' and to maintain the same area. = (number of bays) x (measured span) / 30' = 231 x 41' / 30' = 316 bays
5.2.4 - Roof - double T - cement top (N & S wing)
In the Impact Estimator, the span is limited to a maximum of 30'. The following calculation determines the number of bays input based on setting the span to 30' and to maintain the same area. It is also multiplied by 2 for the north and side sides. = (number of sides) x (number of bays) x (measured span) / 30' = 2 x 369 x 54' / 30' = 1328 bays

5.2.5 - 1FL - double T - cement top (W wing)
In the Impact Estimator, the span is limited to a maximum of 30'. The following calculation determines the number of bays input based on setting the span to 30' and to maintain the same area. = (number of bays) x (measured span) / 30' = 389 x 49' / 30' = 635 bays
5.2.6 - 2FL - double T - cement top (W wing)
In the Impact Estimator, the span is limited to a maximum of 30'. The following calculation determines the number of bays input based on setting the span to 30' and to maintain the same area. = (number of bays) x (measured span) / 30' = 384 x 40' / 30' = 512 bays
5.2.7 - 3FL - double T - cement top (W wing)
In the Impact Estimator, the span is limited to a maximum of 30'. The following calculation determines the number of bays input based on setting the span to 30' and to maintain the same area. = (number of bays) x (measured span) / 30' = 368 x 50' / 30' = 613 bays
5.2.8 - Roof - double T - cement top (W wing)
In the Impact Estimator, the span is limited to a maximum of 30'. The following calculation determines the number of bays input based on setting the span to 30' and to maintain the same area. = (number of bays) x (measured span) / 30' = 53 x 49' / 30' = 87 bays
6 Extra Basic Materials
In the Impact Estimator, additional materials can be entered manually to account for any components that are not covered by the default assembly groups. For the H.R. MacMillan building, this section was used to add concrete (20 MPa = 3000 psi) for the precast concrete caps that are on top of the pilasters and that surround the exterior edge at the roof. Modular brick was added for the penthouse walls and for the pilasters. Finally, mortar was added for the penthouse brick walls and the brick cladding on the pilasters.
6.1 Concrete 6.1.1 - Precast Concrete Cap
for Pilaster Col'n 0,1,2,3FL Types A,B,H,M
The number of precast concrete caps for the pilasters were 30 + 62 + 33 + 17 = 161; each number corresponds to the number of each type of pilasters A, B, H, and M. The length, width, and height dimensions were specified so the total volume of concrete is determined by the following calculation. It was assumed to be 20 MPa = 3000 psi concrete. = (number of concrete caps) x (height) x (width) x (volume) = 161 x 3.33' x 1' x 1.33' = 715.56 ft3

= 20.26 m3
6.1.2 - Precast Concrete Cap linear
The linear condition was used to measure the total distance that the strip concrete caps covered the exterior edge of the roof. The cross-sectional dimensions were specified. The total volume of the concrete is determined by the following calculation. It was assumed to be 20 MPa = 3000 psi concrete. = (measured distance) x (height) x (width) = 2911' x 1.33' x 1' = 3881.33 ft3 = 109.91 m3
6.2.1 - Penthouse brick wall length
The mortar for the penthouse brick wall was determined by first determining the amount of mortar associated with one square meter of brick wall. Linear conditions were used to measure the length and height of the brick wall. The following calculation determines the amount mortar used for the penthouse brick wall. = (wall length) x (wall height) = wall area = 897' x 6' = 5382 sf = 498.51 m2 = (wall area) x (mortar per wall area) = 498.51 m2 x 0.00221 m3/m2 = 1.10 m3

6.2.2 - Pilaster Col'n 0,1,2,3FL Types A,B,H,M
The mortar for the brick on the pilasters wall was determined by first determining the amount of mortar associated with one square meter of brick wall. Linear conditions were used to measure the length and width of the pilasters to obtain the brick area. This was multiplied by the number of pilasters to determine the total brick area. The following table determines the amount mortar used for the pilaster bricks.
6.2 Extra Materials - Cladding
6.3.1 - Penthouse brick wall length
The brick for the penthouse walls was obtained by first measuring the length and height of the walls using a linear condition. The following calcuation determines the area of brick wall. = (length of wall) x (height of wall) = 897' x 6' = 5382 ft2 = 498.51 m2
6.3.2- Pilaster Col'n 0,1,2,3FL Types A,B,H,M
The brick for the pilasters was calculated by first using linear conditions to measure the length and width of the pilasters. Then the areas for each pilasters were multiplied by the number of pilasters. See the above table for the detailed calculation.
Column
type
avg height
(ft)
length
(ft)
width
(ft)
A 50 1 1.58
B 50 1 1.75
C 39 1 1.75
D 39 1 1.75
H 43 1.21 0.67
M 30 1.13 1.25