LEVELLING AND SEISMIC REFRACTION MEASUREMENTS OF …
7
Acta Geodyn. Geomater., Vol.2, No.3 (139), 151-157, 2005 LEVELLING AND SEISMIC REFRACTION MEASUREMENTS OF GROUND SUBSIDENCE IN A MINING AREA Krzysztof JOCHYMCZYK Faculty of Earth Sciences, University of Silesia, Będzińska 60, 41-200 Sosnowiec, Poland Corresponding author‘s e-mail: [email protected] (Received January 2005, accepted May 2005) ABSTRACT Surface deformations are one of the most disadvantageous effects resulting from coal mining exploitation. Changes of stress in rock mass causing such deformations have a significant impact on variations in values of physical parameters of rocks. In these cases applying some geophysical methods seems to be very useful and practical. The analysis of two-year cyclic levelling and seismic refraction measurements carried out in area of mining exploitation is presented in this paper. The application of complex researches and the detailed study of head wave velocity and mining subsidence allowed to describe much more accurately the deformation process occurring in a shallow subsurface. KEYWORDS: subsiding trough, levelling, velocity of head wave, seismic refraction depths. Applying both geophysical and geodesic methods seems to be very useful in better recognising the process of formation of subsiding troughs on the surface resulted in mining exploitation. 2. DESCRIPTION OF AREA UNDER STUDY The area, which was chosen for this study, is a typical example of deformations occurring in the Upper Silesia Coal Basin (South Poland) due to underground mining exploitation. It is situated between two cities - Katowice and Chorzów - and includes the coal fields of the Katowice-Kleofas Coal Mine (Fig 1). During the time the measurements were conducted, the A-4 motorway was simultaneously being built in the vicinity of the region assigned for scientific research. The geological structure of the area consists of Carboniferous sandstone, mudstone, schist and coal beds covered with a four-meter layer of clay. The roof of the Carboniferous consists of about a one-meter-thick weathered coal bed interbedded with schist. The surface deformation process of rock mass resulting from mining exploitation of the 510 coal bed deposited at a depth of 700 meters was studied. During the research period the longwalls No. 201 and No. 202 were driven using the fall of roof method. The thickness of the exploited layer was 2 meters. In the past in the region under study, above- lying coal beds had been exploited several times. This is why the rock mass is considerably disturbed at present. The rate of the longwall exploitation is illustrated in Fig. 1 1. INTRODUCTION Surface deformations resulting from mining exploitation are reckoned among the most disadvantageous and dangerous hazards particularly in those regions which are inhabited and industrialised. Geodesic and geophysical methods can be successfully applied to estimate such deformations in rock mass. As well as the standard geodesic methods, the use of satellite lets researchers accurately calculate the values of parameters of deformations. Similar results can be obtained using tensometric research (Kanciruk et al.). To estimate spatially the values of subsidence radar satellite interferometry (InSAR) is successfully used (Perski, 1999). This also allows to make an investigation in the relatively large area included in the satellite photograph. The accuracy of this method is less than in the case of application of other geodesic methods. The above-mentioned methods can provide some general information about the process of displacement of measured points on the surface. Geophysical researches, including seismic prospecting (Schwarz, 1990;Johnston and Carpenter, 1998), gravimetry (Szczerbowski, 2001), geoelectric (Kaczor, 2003) and electromagnetic methods are used to monitor the process of deformation in rock mass, as well as to indicate the zones which might be under threat of deformation. However, seismic methods have been applied predominantly because of the fact that the velocity and attenuation of seismic waves are closely connected with stress and fracture in rock mass. Geophysical methods also allow to observe the variation in values of physical parameters at different
Transcript of LEVELLING AND SEISMIC REFRACTION MEASUREMENTS OF …
Acta Geodyn. Geomater., Vol.2, No.3 (139), 151-157, 2005
LEVELLING AND SEISMIC REFRACTION MEASUREMENTS OF GROUND SUBSIDENCE IN A MINING AREA
Krzysztof JOCHYMCZYK
Faculty of Earth Sciences, University of Silesia, Będzińska 60, 41-200 Sosnowiec, Poland Corresponding author‘s e-mail: [email protected] (Received January 2005, accepted May 2005) ABSTRACT Surface deformations are one of the most disadvantageous effects resulting from coal mining exploitation. Changes of stressin rock mass causing such deformations have a significant impact on variations in values of physical parameters of rocks. Inthese cases applying some geophysical methods seems to be very useful and practical. The analysis of two-year cyclic levelling and seismic refraction measurements carried out in area of mining exploitation ispresented in this paper. The application of complex researches and the detailed study of head wave velocity and miningsubsidence allowed to describe much more accurately the deformation process occurring in a shallow subsurface. KEYWORDS: subsiding trough, levelling, velocity of head wave, seismic refraction
depths. Applying both geophysical and geodesic methods seems to be very useful in better recognising the process of formation of subsiding troughs on the surface resulted in mining exploitation.
2. DESCRIPTION OF AREA UNDER STUDY
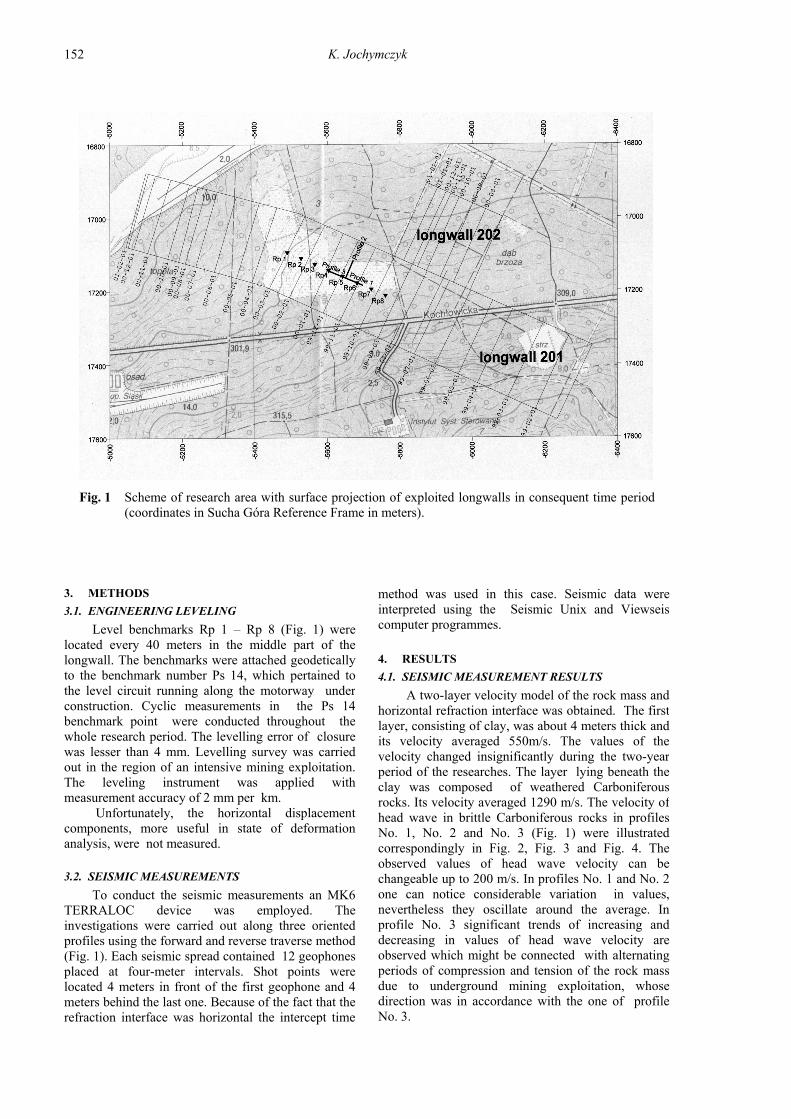
The area, which was chosen for this study, is a typical example of deformations occurring in the Upper Silesia Coal Basin (South Poland) due to underground mining exploitation. It is situated between two cities - Katowice and Chorzów - and includes the coal fields of the Katowice-Kleofas Coal Mine (Fig 1). During the time the measurements were conducted, the A-4 motorway was simultaneously being built in the vicinity of the region assigned for scientific research. The geological structure of the area consists of Carboniferous sandstone, mudstone, schist and coal beds covered with a four-meter layer of clay. The roof of the Carboniferous consists of about a one-meter-thick weathered coal bed interbedded with schist. The surface deformation process of rock mass resulting from mining exploitation of the 510 coal bed deposited at a depth of 700 meters was studied. During the research period the longwalls No. 201 and No. 202 were driven using the fall of roof method. The thickness of the exploited layer was 2 meters.
In the past in the region under study, above-lying coal beds had been exploited several times. This is why the rock mass is considerably disturbed at present. The rate of the longwall exploitation is illustrated in Fig. 1
1. INTRODUCTION Surface deformations resulting from mining
exploitation are reckoned among the mostdisadvantageous and dangerous hazards particularly inthose regions which are inhabited and industrialised.Geodesic and geophysical methods can besuccessfully applied to estimate such deformations inrock mass. As well as the standard geodesic methods,the use of satellite lets researchers accurately calculatethe values of parameters of deformations. Similarresults can be obtained using tensometric research(Kanciruk et al.). To estimate spatially the values ofsubsidence radar satellite interferometry (InSAR) issuccessfully used (Perski, 1999). This also allows tomake an investigation in the relatively large areaincluded in the satellite photograph. The accuracy ofthis method is less than in the case of application ofother geodesic methods.
The above-mentioned methods can provide somegeneral information about the process ofdisplacement of measured points on the surface.
Geophysical researches, including seismicprospecting (Schwarz, 1990;Johnston and Carpenter,1998), gravimetry (Szczerbowski, 2001), geoelectric(Kaczor, 2003) and electromagnetic methods are usedto monitor the process of deformation in rock mass, aswell as to indicate the zones which might be underthreat of deformation. However, seismic methods have been applied predominantly because of the factthat the velocity and attenuation of seismic waves areclosely connected with stress and fracture in rockmass. Geophysical methods also allow to observe thevariation in values of physical parameters at different
K. Jochymczyk
152
Fig. 1 Scheme of research area with surface projection of exploited longwalls in consequent time period(coordinates in Sucha Góra Reference Frame in meters).
method was used in this case. Seismic data were interpreted using the Seismic Unix and Viewseis computer programmes. 4. RESULTS 4.1. SEISMIC MEASUREMENT RESULTS
A two-layer velocity model of the rock mass and horizontal refraction interface was obtained. The first layer, consisting of clay, was about 4 meters thick and its velocity averaged 550m/s. The values of the velocity changed insignificantly during the two-year period of the researches. The layer lying beneath the clay was composed of weathered Carboniferous rocks. Its velocity averaged 1290 m/s. The velocity of head wave in brittle Carboniferous rocks in profiles No. 1, No. 2 and No. 3 (Fig. 1) were illustrated correspondingly in Fig. 2, Fig. 3 and Fig. 4. The observed values of head wave velocity can be changeable up to 200 m/s. In profiles No. 1 and No. 2 one can notice considerable variation in values, nevertheless they oscillate around the average. In profile No. 3 significant trends of increasing and decreasing in values of head wave velocity are observed which might be connected with alternating periods of compression and tension of the rock mass due to underground mining exploitation, whose direction was in accordance with the one of profile No. 3.
3. METHODS 3.1. ENGINEERING LEVELING
Level benchmarks Rp 1 – Rp 8 (Fig. 1) were located every 40 meters in the middle part of thelongwall. The benchmarks were attached geodeticallyto the benchmark number Ps 14, which pertained tothe level circuit running along the motorway underconstruction. Cyclic measurements in the Ps 14benchmark point were conducted throughout thewhole research period. The levelling error of closurewas lesser than 4 mm. Levelling survey was carriedout in the region of an intensive mining exploitation.The leveling instrument was applied withmeasurement accuracy of 2 mm per km.
Unfortunately, the horizontal displacementcomponents, more useful in state of deformationanalysis, were not measured. 3.2. SEISMIC MEASUREMENTS
To conduct the seismic measurements an MK6 TERRALOC device was employed. Theinvestigations were carried out along three orientedprofiles using the forward and reverse traverse method(Fig. 1). Each seismic spread contained 12 geophonesplaced at four-meter intervals. Shot points werelocated 4 meters in front of the first geophone and 4meters behind the last one. Because of the fact that therefraction interface was horizontal the intercept time

LEVELLING AND SEISMIC REFRACTION MEASUREMENTS OF GROUND …
153
Profile 1
50070090011001300150017001900
2.9.1999
2.11.1999
2.1.2000
2.3.2000
2.5.2000
2.7.2000
2.9.2000
2.11.2000
2.1.2001
2.3.2001
2.5.2001
2.7.2001
2.9.2001
Velo
city
of h
ead
wav
e [m
/s]
Fig. 2 Variation in velocity of head wave in profile No.1 in accordance with the direction of exploitation.
Profile 2
50070090011001300150017001900
2.9.1999
2.11.1999
2.1.2000
2.3.2000
2.5.2000
2.7.2000
2.9.2000
2.11.2000
2.1.2001
2.3.2001
2.5.2001
2.7.2001
2.9.2001Velo
city
of h
ead
wav
e [m
/s]
Fig. 3 Variation in velocity of head wave in profile No.2 perpendicular to the direction of exploitation.
Profile 3
50070090011001300150017001900
2.9.1999
2.11.1999
2.1.2000
2.3.2000
2.5.2000
2.7.2000
2.9.2000
2.11.2000
2.1.2001
2.3.2001
2.5.2001
2.7.2001
2.9.2001Velo
city
of h
ead
wav
e [m
/s]
Fig. 4 Variation in velocity of head wave in profile No. 3 in accordance with the direction ofexploitation.
K. Jochymczyk
154
Rp 8
012345678910
1999-09-02
1999-11-02
2000-01-02
2000-03-02
2000-05-02
2000-07-02
2000-09-02
2000-11-02
2001-01-02
2001-03-02
2001-05-02
2001-07-02
2001-09-02
Velo
city
of s
ubsi
denc
e [m
m/d
ay]
302
302,5
303
303,5
304
304,5
Elev
atio
n [m
]
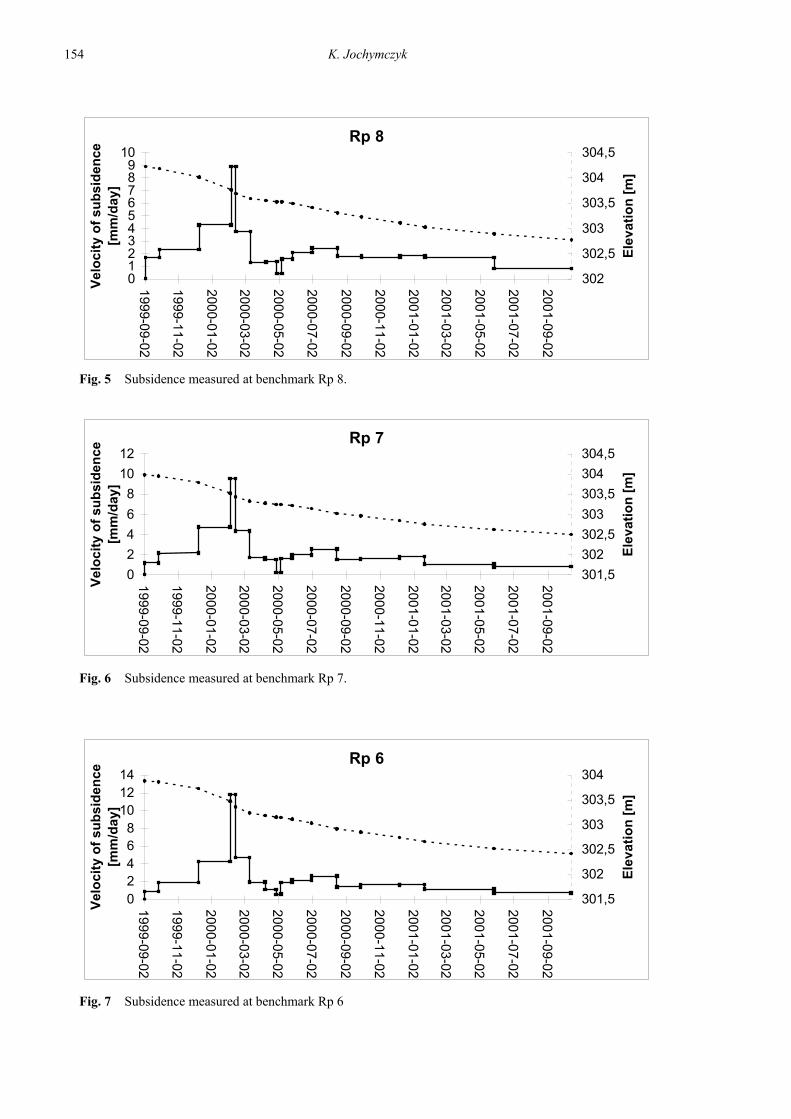
Fig. 5 Subsidence measured at benchmark Rp 8.
Rp 7
024681012
1999-09-02
1999-11-02
2000-01-02
2000-03-02
2000-05-02
2000-07-02
2000-09-02
2000-11-02
2001-01-02
2001-03-02
2001-05-02
2001-07-02
2001-09-02
Velo
city
of s
ubsi
denc
e [m
m/d
ay]
301,5302302,5303303,5304304,5
Elev
atio
n [m
]
Fig. 6 Subsidence measured at benchmark Rp 7.
Rp 6
02468101214
1999-09-02
1999-11-02
2000-01-02
2000-03-02
2000-05-02
2000-07-02
2000-09-02
2000-11-02
2001-01-02
2001-03-02
2001-05-02
2001-07-02
2001-09-02
Velo
city
of s
ubsi
denc
e [m
m/d
ay]
301,5
302
302,5
303
303,5
304
Elev
atio
n [m
]
Fig. 7 Subsidence measured at benchmark Rp 6
LEVELLING AND SEISMIC REFRACTION MEASUREMENTS OF GROUND …
155
Rp 5
024681012
2.9.1999
2.11.1999
2.1.2000
2.3.2000
2.5.2000
2.7.2000
2.9.2000
2.11.2000
2.1.2001
2.3.2001
2.5.2001
2.7.2001
2.9.2001
Velo
city
of s
ubsi
denc
e [m
m/d
ay]
301.5302302.5303303.5304304.5
Elev
atio
n [m
]
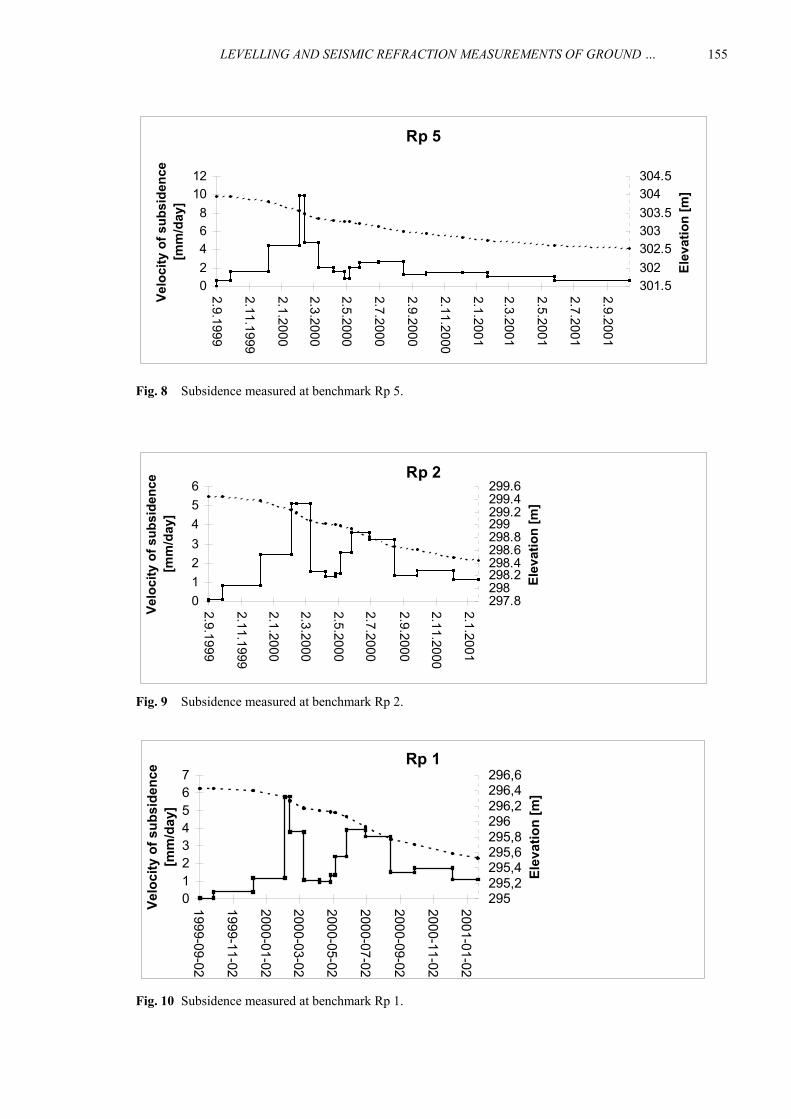
Fig. 8 Subsidence measured at benchmark Rp 5.
Rp 2
0123456
2.9.1999
2.11.1999
2.1.2000
2.3.2000
2.5.2000
2.7.2000
2.9.2000
2.11.2000
2.1.2001
Velo
city
of s
ubsi
denc
e [m
m/d
ay]
297.8298298.2298.4298.6298.8299299.2299.4299.6
Elev
atio
n [m
]
Fig. 9 Subsidence measured at benchmark Rp 2.
Rp 1
01234567
1999-09-02
1999-11-02
2000-01-02
2000-03-02
2000-05-02
2000-07-02
2000-09-02
2000-11-02
2001-01-02
Velo
city
of s
ubsi
denc
e [m
m/d
ay]
295295,2295,4295,6295,8296296,2296,4296,6
Elev
atio
n [m
]
Fig. 10 Subsidence measured at benchmark Rp 1.
K. Jochymczyk
156
Rp 3
012345678910
1999-09-02
1999-11-02
2000-01-02
2000-03-02
2000-05-02
2000-07-02
2000-09-02
2000-11-02
2001-01-02
Velo
city
of s
ubsi
denc
e [m
m/d
ay]
299,2299,4299,6299,8300300,2300,4300,6300,8301
Elev
atio
n [m
]
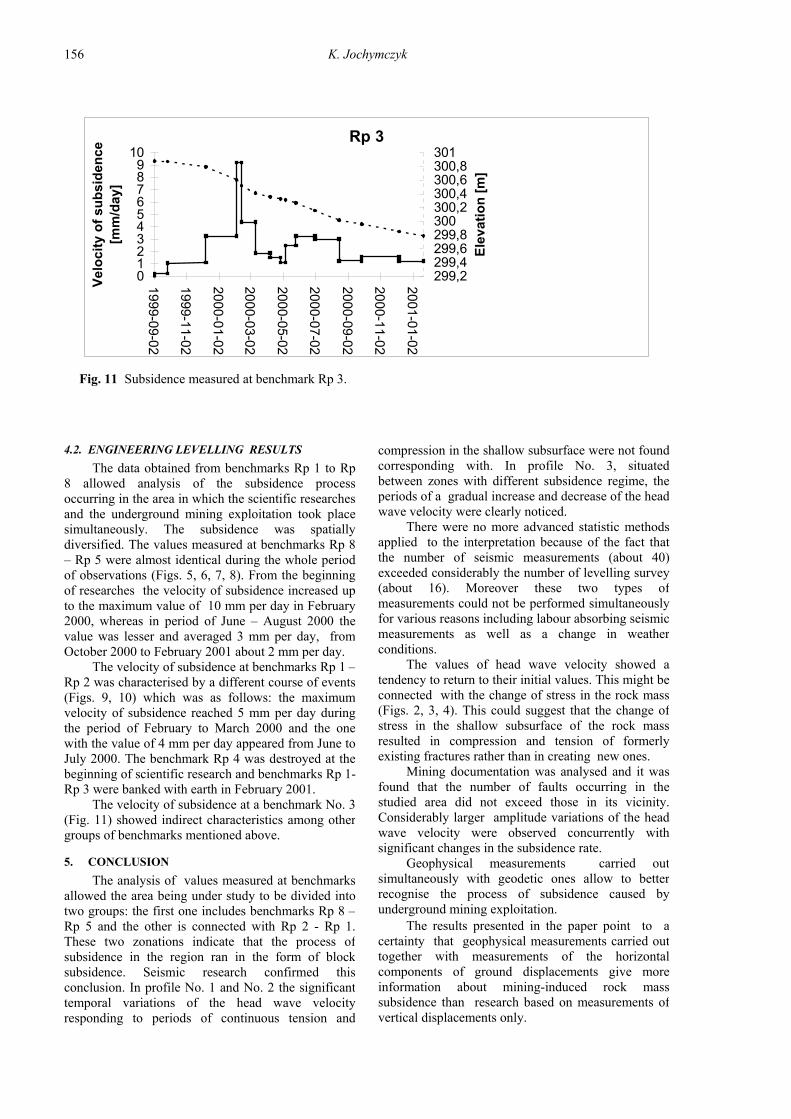
Fig. 11 Subsidence measured at benchmark Rp 3.
compression in the shallow subsurface were not found corresponding with. In profile No. 3, situated between zones with different subsidence regime, the periods of a gradual increase and decrease of the head wave velocity were clearly noticed.
There were no more advanced statistic methods applied to the interpretation because of the fact that the number of seismic measurements (about 40) exceeded considerably the number of levelling survey (about 16). Moreover these two types of measurements could not be performed simultaneously for various reasons including labour absorbing seismic measurements as well as a change in weather conditions.
The values of head wave velocity showed a tendency to return to their initial values. This might be connected with the change of stress in the rock mass (Figs. 2, 3, 4). This could suggest that the change of stress in the shallow subsurface of the rock mass resulted in compression and tension of formerly existing fractures rather than in creating new ones.
Mining documentation was analysed and it was found that the number of faults occurring in the studied area did not exceed those in its vicinity. Considerably larger amplitude variations of the head wave velocity were observed concurrently with significant changes in the subsidence rate.
Geophysical measurements carried out simultaneously with geodetic ones allow to better recognise the process of subsidence caused by underground mining exploitation.
The results presented in the paper point to a certainty that geophysical measurements carried out together with measurements of the horizontal components of ground displacements give more information about mining-induced rock mass subsidence than research based on measurements of vertical displacements only.
4.2. ENGINEERING LEVELLING RESULTS The data obtained from benchmarks Rp 1 to Rp
8 allowed analysis of the subsidence processoccurring in the area in which the scientific researchesand the underground mining exploitation took placesimultaneously. The subsidence was spatiallydiversified. The values measured at benchmarks Rp 8– Rp 5 were almost identical during the whole periodof observations (Figs. 5, 6, 7, 8). From the beginningof researches the velocity of subsidence increased upto the maximum value of 10 mm per day in February2000, whereas in period of June – August 2000 thevalue was lesser and averaged 3 mm per day, fromOctober 2000 to February 2001 about 2 mm per day.
The velocity of subsidence at benchmarks Rp 1 –Rp 2 was characterised by a different course of events(Figs. 9, 10) which was as follows: the maximumvelocity of subsidence reached 5 mm per day duringthe period of February to March 2000 and the onewith the value of 4 mm per day appeared from June toJuly 2000. The benchmark Rp 4 was destroyed at thebeginning of scientific research and benchmarks Rp 1-Rp 3 were banked with earth in February 2001.
The velocity of subsidence at a benchmark No. 3(Fig. 11) showed indirect characteristics among othergroups of benchmarks mentioned above.
5. CONCLUSION
The analysis of values measured at benchmarksallowed the area being under study to be divided intotwo groups: the first one includes benchmarks Rp 8 –Rp 5 and the other is connected with Rp 2 - Rp 1.These two zonations indicate that the process ofsubsidence in the region ran in the form of blocksubsidence. Seismic research confirmed thisconclusion. In profile No. 1 and No. 2 the significanttemporal variations of the head wave velocityresponding to periods of continuous tension and
LEVELLING AND SEISMIC REFRACTION MEASUREMENTS OF GROUND …
157
REFERENCES Johnston, M. and Carpenter, P.: 1998, Use of seismic
refraction surveys to identify mine subsidencefractures in glacial drift and bedrock, Journal of Environmental and Engineering Geophysics,issue 3, 213-221.
Kaczor, D.: 2003, Deformation process model ofsubsurface rock layers on the base of apparentresistivity rock changes, Proc. Of RecentResults Derived from Seismological,Geophysical and Geotechnical Investigation,Ostrava, 109 – 118.
Kanciruk, A., Rogowska, J., Stanisławski, L.,Popiołek, E. and Ostrowski, J.: 2002, Badaniaskutków ujawniania się przerw eksploatacyjnychna powierzchni z wykorzystaniem pomiarówtensometrycznych i geodezyjnych, MateriałyXXV Zimowej Szkoły Mechaniki Górotworu, Wydawnictwo Katedry Geomechaniki,Budownictwa i Geotechniki AGH, Kraków.
Perski, Z.: 1999, Abilities of Satellite RadarInterferometry In Application To TheMonitoring of Groung Subsidence Induced ByUnderground Mining, Publs. Inst. Geophys. Pol.Acad. SC., M-22 (310), 275 – 282.
Schwarz, S.: 1990, Detection of destressed rock andpotential collapse features above old mineworkings by the seismic refraction method,Geotechnical and Environmental Geophysics, 3,SEG, 281-287.
Szczerbowski, Z.: 2001, Deformacje powierzchni azmiany siły ciężkości – relacje w warunkacheksploatowanego górotworu, Biblioteka SzkołyEksploatacji Podziemnej, Kraków.