Level 2 Mathematics and Statistics (91267) 2017€¦ · Mathematics and Statistics 91267, 2017 ......
16
912670 2 SUPERVISOR’S USE ONLY 91267 © New Zealand Qualifications Authority, 2017. All rights reserved. No part of this publication may be reproduced by any means without the prior permission of the New Zealand Qualifications Authority. ASSESSOR’S USE ONLY TOTAL Level 2 Mathematics and Statistics, 2017 91267 Apply probability methods in solving problems 2.00 p.m. Friday 24 November 2017 Credits: Four Achievement Achievement with Merit Achievement with Excellence Apply probability methods in solving problems. Apply probability methods, using relational thinking, in solving problems. Apply probability methods, using extended abstract thinking, in solving problems. Check that the National Student Number (NSN) on your admission slip is the same as the number at the top of this page. You should attempt ALL the questions in this booklet. Make sure that you have Formulae Sheet L2–MATHF. Show ALL working. If you need more space for any answer, use the page(s) provided at the back of this booklet and clearly number the question. Check that this booklet has pages 2 – 15 in the correct order and that none of these pages is blank. YOU MUST HAND THIS BOOKLET TO THE SUPERVISOR AT THE END OF THE EXAMINATION.
Transcript of Level 2 Mathematics and Statistics (91267) 2017€¦ · Mathematics and Statistics 91267, 2017 ......

912670
2SUPERVISOR’S USE ONLY
9 1 2 6 7
© New Zealand Qualifications Authority, 2017. All rights reserved.No part of this publication may be reproduced by any means without the prior permission of the New Zealand Qualifications Authority.
ASSESSOR’S USE ONLY
TOTAL
Level 2 Mathematics and Statistics, 201791267 Apply probability methods in solving problems
2.00 p.m. Friday 24 November 2017 Credits: Four
Achievement Achievement with Merit Achievement with ExcellenceApply probability methods in solving problems.
Apply probability methods, using relational thinking, in solving problems.
Apply probability methods, using extended abstract thinking, in solving problems.
Check that the National Student Number (NSN) on your admission slip is the same as the number at the top of this page.
You should attempt ALL the questions in this booklet.
Make sure that you have Formulae Sheet L2–MATHF.
Show ALL working.
If you need more space for any answer, use the page(s) provided at the back of this booklet and clearly number the question.
Check that this booklet has pages 2 – 15 in the correct order and that none of these pages is blank.
YOU MUST HAND THIS BOOKLET TO THE SUPERVISOR AT THE END OF THE EXAMINATION.

QUESTION ONE
Regular surveys are taken of New Zealanders to find out about the state of their health and well-being.
A random sample of 2500 young adults from the age group 15 –24 years gave the following results for obesity.
Table 1Obese Not Obese Total
Male 222 983 1205Female 285 1010 1295Total 507 1993 2500
(a) (i) What proportion of obese young adults in the sample were male?
(ii) At the time of the survey, there were known to be about 585 000 young adults in the age group 15 –24 years in New Zealand.
From the results of this survey, how many young adults in this age group would you estimate to be obese?
2
Mathematics and Statistics 91267, 2017
ASSESSOR’S USE ONLY
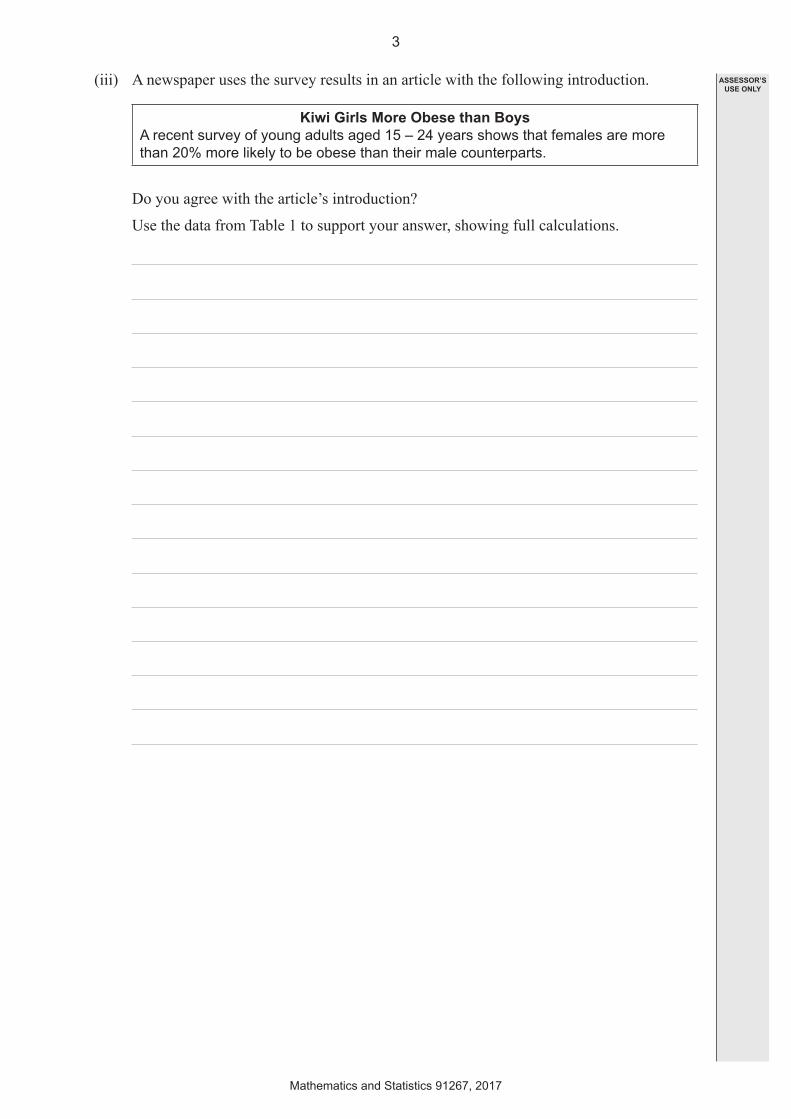
(iii) A newspaper uses the survey results in an article with the following introduction.
Kiwi Girls More Obese than BoysA recent survey of young adults aged 15 – 24 years shows that females are more than 20% more likely to be obese than their male counterparts.
Do you agree with the article’s introduction?
Use the data from Table 1 to support your answer, showing full calculations.
3
Mathematics and Statistics 91267, 2017
ASSESSOR’S USE ONLY

(b) Table 1 from Page 2 is repeated below.
Table 1Obese Not Obese Total
Male 222 983 1205Female 285 1010 1295Total 507 1993 2500
The survey also obtained information about the current smoking habits of participants.
It was found that of the young adults in the survey who were defined as obese, 103 were current smokers, and that 53 of the current smokers were male.
(i) What proportion of obese young adults in the sample were female non-smokers?
(ii) Table 2 below gives further information on the participants in the survey who were in the age group 15 –24 years.
Table 2Obese Not Obese Total
Current smoker 103 317 420Non-smoker 404 1676 2080Total 507 1993 2500
It is claimed that young adult smokers are more at risk of being obese than young adult
non-smokers.
Do the results of the survey support this claim?
Support your answer with appropriate calculations.
4
Mathematics and Statistics 91267, 2017
ASSESSOR’S USE ONLY

5
Mathematics and Statistics 91267, 2017
ASSESSOR’S USE ONLY
QUESTION TWO
(a) Merino ewes that produce lambs usually have either single lambs or twins. Multiple births other than twins are extremely rare.
A long-term study has shown that 65% of Merino ewes that produce a lamb will have a single lamb, and of those lambs, 86% survive until they are weaned (separated from their mothers).
Of the ewes that produce twins, about one in five lose both lambs before they are weaned. Approximately equal numbers of one twin or both twins survive until they are weaned.
(i) Find the probability that a ewe gives birth to a single lamb that survives until it is weaned.
(ii) What proportion of ewes give birth to twins that both survive until they are weaned?
https://milligansganderhillfarm.wordpress.com/2013/06/06/merino-sheep/
6
Mathematics and Statistics 91267, 2017
ASSESSOR’S USE ONLY

(iii) What is the probability that a randomly selected lamb that survives until it is weaned will be from a ewe that produced a single lamb?
Hint: Remember that there is an equal number of one twin or both twins surviving until they are weaned.
(iv) ‘Lambing percentage’ is the number of lambs that survive until they are weaned compared to the number of breeding ewes, expressed as a percentage.
It is known that about 85% of breeding Merino ewes actually produce lambs.
What was the lambing percentage for this long-term study?
7
Mathematics and Statistics 91267, 2017
ASSESSOR’S USE ONLY

(b) On Highbrook Station there are two breeds of sheep, Merino and Romney.
Table 3 below gives information about the lambs born in the 2016 lambing season. It shows the proportion of ewes that did not produce a lamb, had a single birth, or had multiple births, for each breed of sheep.
Table 3No lamb Single Multiple
Merino 0.13 0.62 0.25Romney 0.06 0.48 0.46
After the lambs were weaned, the ewes were sorted. Some were culled (not kept) and others were kept for breeding in the 2017 lambing season.
Table 4 shows the proportion of Romney ewes that were either culled or kept for the 2017 lambing season.
Table 4No lamb Single Multiple
Romney ewes culled 0.88 0.68 0.40Romney ewes kept 0.12 0.32 0.60
The ratio of Romney to Merino breeding ewes on Highbrook Station at the beginning of the season was approximately 3:2.
According to the data in tables 3 and 4, at the end of the 2016 lambing season, what proportion of the total breeding ewes on Highbrook Station were Romneys that were ‘empty’ (did not produce a lamb) and were culled?
8
Mathematics and Statistics 91267, 2017
ASSESSOR’S USE ONLY

9
Mathematics and Statistics 91267, 2017
This page has been deliberately left blank.
The examination continues on the following page.

QUESTION THREE
(a) Salmon are grown in sea pens. Each pen contains several thousand salmon.
After one year in the pens, male salmon have weights that are approximately normally distributed, with mean 4125 grams and standard deviation 65 grams.
(i) Find the probability that after one year in a pen, a randomly selected male will weigh between 4125 and 4200 grams.
(ii) What is the maximum weight of the lightest 10% of salmon?
www.technologybloggers.org/wp-content/uploads/2013/06/big-glory-bay.jpg
10
Mathematics and Statistics 91267, 2017
ASSESSOR’S USE ONLY

(iii) After one year in the pens, female salmon have weights that are approximately normally distributed with mean 3975 grams.
If 40% of female salmon exceed 4000 grams, then what would be the standard deviation?
(iv) The pens contain approximately equal numbers of male and female salmon.
When they are harvested, the weights of all the salmon are approximately normally distributed, with mean 4050 grams and standard deviation 84 grams.
When the salmon are harvested, each member of the harvest team is given two salmon to take home.
If these two salmon are selected at random, what is the probability that both of the salmon will each weigh more than 4025 grams?
11
Mathematics and Statistics 91267, 2017
ASSESSOR’S USE ONLY
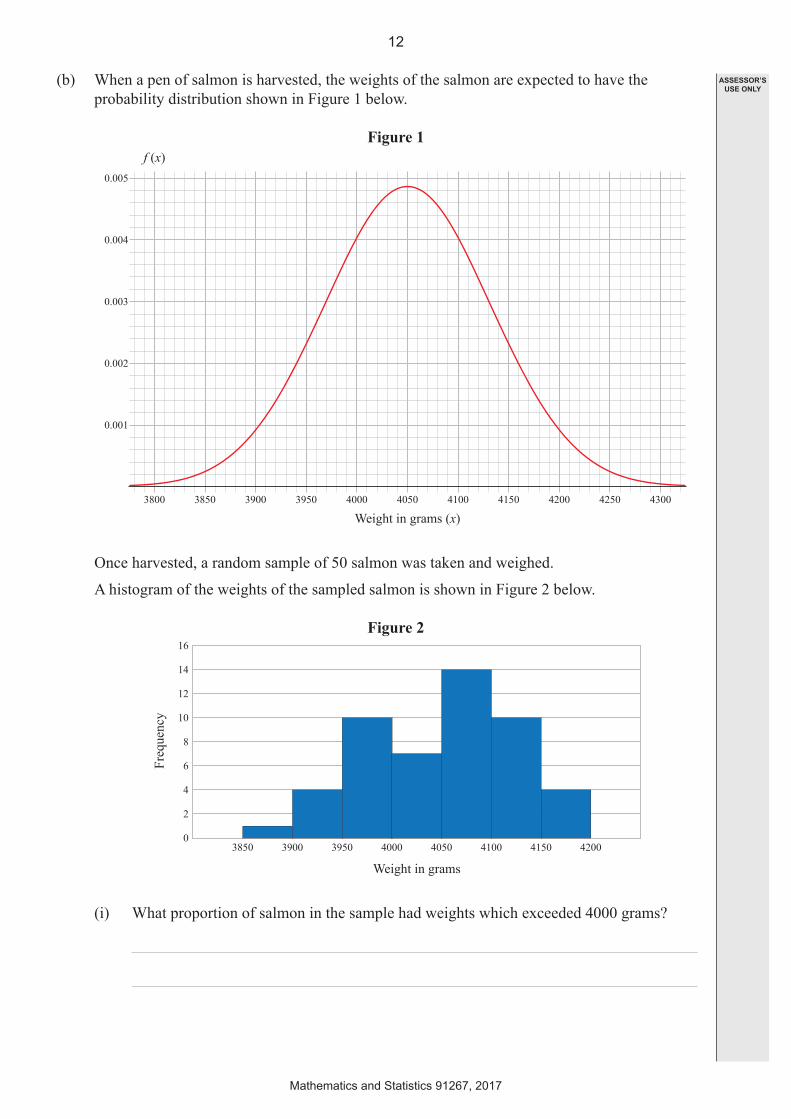
(b) When a pen of salmon is harvested, the weights of the salmon are expected to have the probability distribution shown in Figure 1 below.
Figure 1
3800
0.001
0.002
0.003
0.004
0.005
f (x)
Weight in grams (x)3850 3900 3950 4000 4050 4100 4150 4200 4250 4300
Once harvested, a random sample of 50 salmon was taken and weighed.
A histogram of the weights of the sampled salmon is shown in Figure 2 below.
Figure 2
38500
Weight in grams
Sample Results
Freq
uenc
y
2
4
6
8
10
12
14
16
3900 3950 4000 4050 4100 4150 4200
(i) What proportion of salmon in the sample had weights which exceeded 4000 grams?
12
Mathematics and Statistics 91267, 2017
ASSESSOR’S USE ONLY

(ii) Compare the probability distribution and the histogram that resulted from the sample results.
In your answer you should consider the shape, centre, and spread of both distributions, and should provide numerical evidence where appropriate.
13
Mathematics and Statistics 91267, 2017
ASSESSOR’S USE ONLY

14
Mathematics and Statistics 91267, 2017
ASSESSOR’S USE ONLY
QUESTION NUMBER
Extra paper if required.Write the question number(s) if applicable.

15
Mathematics and Statistics 91267, 2017
ASSESSOR’S USE ONLY
QUESTION NUMBER
Extra paper if required.Write the question number(s) if applicable.

91
26
7