Level 1 - api.joondalup.wa.gov.auapi.joondalup.wa.gov.au/files/City of Joondalup - Annual...
60
-
Upload
vuongquynh -
Category
Documents
-
view
219 -
download
0
Transcript of Level 1 - api.joondalup.wa.gov.auapi.joondalup.wa.gov.au/files/City of Joondalup - Annual...

Level 1
10 Kings Park Road
West Perth WA 6005
Correspondence to:
PO Box 570
West Perth WA 6872
T +61 8 9480 2000
F +61 8 9322 7787
W www.grantthornton.com.au
Grant Thornton Audit Pty Ltd ACN 130 913 594
a subsidiary or related entity of Grant Thornton Australia Ltd ABN 41 127 556 389
‘Grant Thornton’ refers to the brand under which the Grant Thornton member firms provide assurance, tax and advisory services to their clients and/or refers to one or more member firms, as the
context requires. Grant Thornton Australia Ltd is a member firm of Grant Thornton International Ltd (GTIL). GTIL and the member firms are not a worldwide partnership. GTIL and each member firm
is a separate legal entity. Services are delivered by the member firms. GTIL does not provide services to clients. GTIL and its member firms are not agents of, and do not obligate one another and
are not liable for one another’s acts or omissions. In the Australian context only, the use of the term ‘Grant Thornton’ may refer to Grant Thornton Australia Limited ABN 41 127 556 389 and its
Australian subsidiaries and related entities. GTIL is not an Australian related entity to Grant Thornton Australia Limited.
Liability limited by a scheme approved under Professional Standards Legislation. Liability is limited in those States where a current scheme applies.
Independent Auditor’s Report
To the Ratepayers of City of Joondalup
We have audited the accompanying financial report of City of Joondalup, which comprises
the statement of financial position as at 30 June 2015, and the statement of comprehensive
income, statement of changes in equity, statement of cash flows, and rate setting statement
for the year then ended, notes comprising a summary of significant accounting policies and
other explanatory information to the financial report and the statement by the Chief
Executive Officer.
Responsibility of Council for the financial report
The Council of the City of Joondalup is responsible for the preparation and fair
presentation of the financial report in accordance with Australian Accounting Standards
(including the Australian Accounting Interpretations) and the Local Government Act 1995.
This responsibility includes such internal controls as Council determine are necessary to
enable the preparation of the financial report to be free from material misstatement,
whether due to fraud or error.
Auditor’s responsibility
Our responsibility is to express an opinion on the financial report based on our audit. We
conducted our audit in accordance with Australian Auditing Standards which require us to
comply with relevant ethical requirements relating to audit engagements and plan and
perform the audit to obtain reasonable assurance whether the financial report is free from
material misstatement.
An audit involves performing procedures to obtain audit evidence about the amounts and
disclosures in the financial report. The procedures selected depend on the auditor’s
judgement, including the assessment of the risks of material misstatement of the financial
report, whether due to fraud or error.
In making those risk assessments, the auditor considers internal control relevant to the City
of Joondalup’s preparation and fair presentation of the financial report in order to design
audit procedures that are appropriate in the circumstances, but not for the purpose of
expressing an opinion on the effectiveness of the City of Joondalup’s internal control. An
audit also includes evaluating the appropriateness of accounting policies used and the
reasonableness of accounting estimates made by Council, as well as evaluating the overall
presentation of the financial report.
We believe that the audit evidence we have obtained is sufficient and appropriate to provide
a basis for our audit opinion.
Independence
In conducting our audit, we have complied with the applicable independence requirements
of the Accounting Professional and Ethical Standards Board.
Auditor’s Opinion
In our opinion,
a the financial report of City of Joondalup
i presents fairly, in all material respects, the City of Joondalup’s financial position as
at 30 June 2015 and of its performance and cash flows for the year then ended ; and
ii complies with Australian Accounting Standards (including the Australian
Accounting Interpretations);
iii is prepared in accordance with the requirements of the Local Government act 1995
(as amended) and Regulations under that Act.
Other Matter
I did not, during the course of my audit, become aware of any instance where the Council
did not comply with the requirements of the Local Government Act 1995 and Local
Government (Financial Management) Regulations 1996, as they relate to the financial
statements.
GRANT THORNTON AUDIT PTY LTD Chartered Accountants
M J Hillgrove
Partner - Audit & Assurance
Perth, 6 November 2015

CITY OF JOONDALUP
FINANCIAL REPORT
FOR THE YEAR ENDED 30 JUNE 2015
TABLE OF CONTENTS
Income Statement by Nature or Type 1
Income Statement by Program 2
Statement of Financial Position 3
Statement of Changes in Equity 4
Statement of Cash Flows 5
Rate Setting Statement 6
Notes to and Forming Part of the Financial Report 7-51
Addendum – New Accounting Standards and Interpretations 52-55

1
CITY OF JOONDALUP STATEMENT OF COMPREHENSIVE INCOME
BY NATURE OR TYPE FOR THE YEAR ENDED 30 JUNE 2015
NOTE 2015 2015 2014
Actual Budget Actual
$ $ $
REVENUE
Rates 3 (q) 87,213,374 86,466,338 82,573,393
Grants and Subsidies 7 5,849,873 4,095,510 2,349,439
Contributions, Reimbursements and Donations 4 1,419,787 1,477,802 2,073,239
Interest Earnings 8 4,674,144 4,027,651 4,740,101
Profit on Disposal of Assets 22 4,570,792 431,228 3,927,540
Fees and Charges 6 38,526,436 39,103,040 37,743,422
Other Revenue 605,058 123,000 271,806
142,859,464 135,724,569 133,678,940
EXPENSE
Employee Costs (56,814,375) (58,065,565) (55,127,264)
Materials and Contracts (46,504,500) (50,669,375) (47,435,690)
Utilities (5,733,481) (6,165,121) (6,029,342)
Depreciation, Impairment & Revaluation Decrement 4 (29,582,283) (19,331,487) (27,476,675)
Loss on Disposal of Assets 22 (239,802) (1,275,392) (200,087)
Interest Expense 24(a) (455,328) (616,230) (488,961)
Insurance (1,612,867) (1,639,249) (1,625,926)
(140,942,636) (137,762,419) (138,383,945)
Net Result from Operating Activities 1,916,828 (2,037,850) (4,705,005)
Non-Operating Activities
Grants and Subsidies 7 8,952,318 9,277,327 4,318,894
Other Capital Contributions 406,950 - 1,484,104
Acquired Infrastructure Assets 5 - 500,000 -
Equity Distribution - 2,500,000 -
Profit/(Loss) 11,276,096 10,239,477 1,097,993
Other Comprehensive Income
Changes on revaluation of non-current assets 17 112,874,638 - 363,171,530
Total Comprehensive Income 124,150,734 10,239,477 364,269,523
This statement is to be read in conjunction with the accompanying notes.

2
CITY OF JOONDALUP STATEMENT OF COMPREHENSIVE INCOME
BY PROGRAM FOR THE YEAR ENDED 30 JUNE 2015
NOTE 2015 2015 2014
Actual Budget Actual
$ $ $
REVENUE
Governance 5,007,969 34,704 4,029,307
General Purpose Funding 97,833,156 94,652,354 89,748,743
Law, Order, Public Safety 843,521 943,477 912,210
Health 404,742 323,000 358,329
Education and Welfare 498,887 451,951 469,072
Community Amenities 23,042,307 23,454,044 17,582,320
Recreation and Culture 10,236,243 10,628,495 11,949,070
Transport 4,043,849 4,017,249 7,811,436
Other Property & Services 948,790 1,219,295 818,453
142,859,464 135,724,569 133,678,940
EXPENSE EXCLUDING FINANCE COSTS
Governance (8,339,651) (8,297,763) (5,820,799)
General Purpose Funding (2,430,390) (2,468,000) (2,879,255)
Law, Order, Public Safety (5,360,891) (5,688,583) (4,733,442)
Health (1,863,789) (1,939,831) (1,555,045)
Education and Welfare (2,648,504) (2,718,035) (2,207,538)
Community Amenities (29,500,940) (32,343,449) (27,165,020)
Recreation & Culture (48,239,100) (48,632,148) (36,405,253)
Transport (34,829,287) (27,500,921) (30,638,209)
Economic Services (1,384,121) (1,370,544) (334,723)
Other Property & Services (5,890,634) (6,186,914) (26,155,700)
(140,487,307) (137,146,189) (137,894,984)
Net Operating Surplus before Finance Costs 2,372,156 (1,421,620) (4,216,044)
Finance Costs
General Purpose Funding (455,328) (616,230) (488,961)
Net Result from Operating Activities 1,916,828 (2,037,850) (4,705,005)
Capital Grants and Contributions
Grants for the development of assets 7 8,952,318 9,277,327 4,318,894
Other Capital Contributions 406,950 - 1,484,104
Acquired Infrastructure Assets 5 - 500,000 -
Equity Distribution - 2,500,000 -
Profit/(Loss) 11,276,096 10,239,477 1,097,993
Other Comprehensive Income
Changes on revaluation of non-current assets 17 112,874,638 - 363,171,530
Total Comprehensive Income 124,150,734 10,239,477 364,269,523
This statement is to be read in conjunction with the accompanying notes.

3
CITY OF JOONDALUP
STATEMENT OF FINANCIAL POSITION AS AT 30 JUNE 2015
NOTE 2015 2014
$ $
CURRENT ASSETS
Cash and Cash Equivalents 8 88,083,406 72,069,087
Trade and Other Receivables 9 6,040,601 4,945,569
Inventories 70,370 80,296
TOTAL CURRENT ASSETS 94,194,377 77,094,952
NON-CURRENT ASSETS
Other Receivables 9 1,520,537 1,871,120
Equity Investments 10 8,628,975 7,642,834
Property, Plant and Equipment 11 280,500,566 283,844,002
Infrastructure Assets 12 988,474,447 868,074,789
TOTAL NON-CURRENT ASSETS 1,279,124,525 1,161,432,745
TOTAL ASSETS 1,373,318,902 1,238,527,697
CURRENT LIABILITIES
Trade and Other Payables 13 13,037,624 10,404,485
Borrowings 14 1,823,565 1,399,466
Provisions 15 12,336,956 11,752,972
TOTAL CURRENT LIABILITIES 27,198,145 23,556,923
NON-CURRENT LIABILITIES
Borrowings 14 12,512,950 5,836,515
Provisions 15 1,845,280 2,083,126
TOTAL NON-CURRENT LIABILITIES 14,358,230 7,919,641
TOTAL LIABILITIES 41,556,375 31,476,564
NET ASSETS 1,331,762,527 1,207,051,133
EQUITY
Retained Surplus 542,448,011 542,657,848
Reserve Accounts 16.2 63,835,515 51,788,922
Reserves - Asset Revaluation 17 725,479,001 612,604,363
TOTAL EQUITY 1,331,762,527 1,207,051,133
This statement is to be read in conjunction with the accompanying notes.

4
CITY OF JOONDALUP
STATEMENT OF CHANGES IN EQUITY FOR THE YEAR ENDED 30 JUNE 2015
NOTE 2015 2014
Actual Actual
$ $
RETAINED SURPLUS
Balance as at 1 July 2014 542,657,848 535,282,252
Net result 11,276,096 1,097,993
Transfer from/(to) Reserves (12,046,593) 5,848,887
Transfer from/(to) Trust Funds 560,660 428,716
Balance as at 30 June 2015 542,448,011 542,657,848
RESERVES ACCOUNTS
Balance as at 1 July 2014 51,788,922 57,637,810
Transfer from/(to) Retained Surplus 12,046,593 (5,848,888)
Balance as at 30 June 2015 16.2 63,835,515 51,788,922
RESERVES - ASSET REVALUATION
Balance as at 1 July 2014 612,604,363 249,432,833
Change in Revaluation 112,874,638 363,171,530
Balance as at 30 June 2015 17 725,479,001 612,604,363
TOTAL EQUITY 1,331,762,527 1,207,051,133
This statement is to be read in conjunction with the accompanying notes.
5
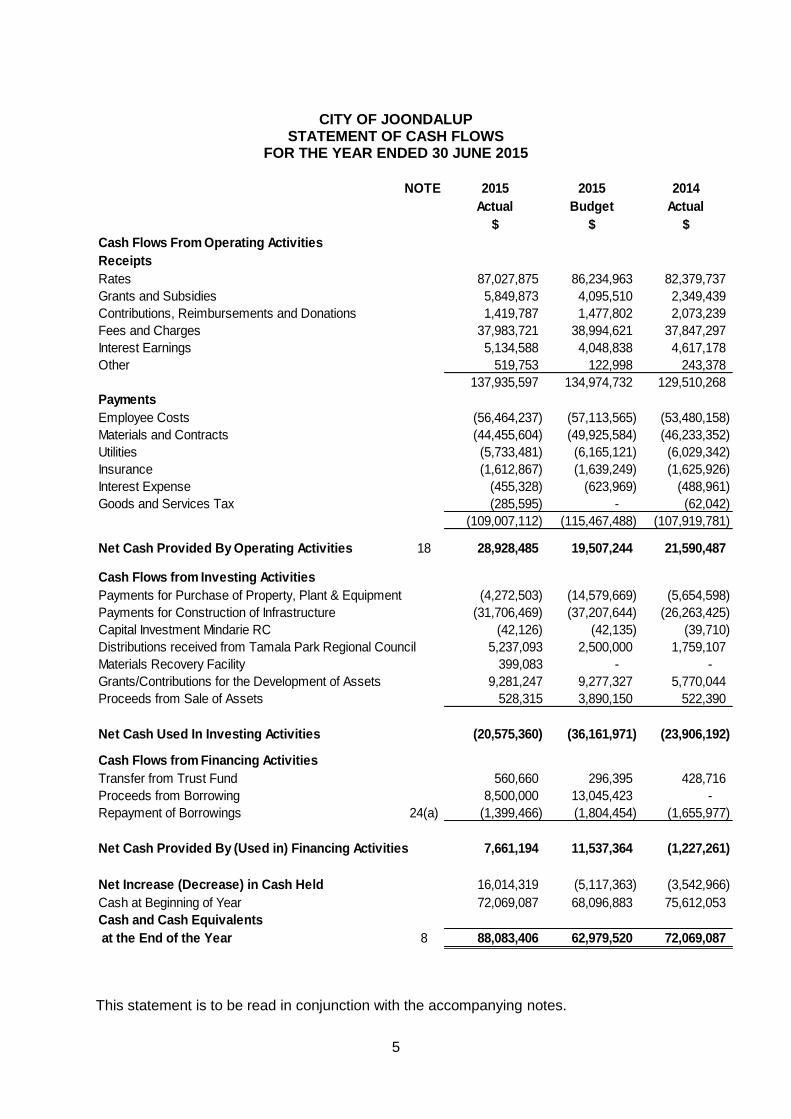
CITY OF JOONDALUP
STATEMENT OF CASH FLOWS FOR THE YEAR ENDED 30 JUNE 2015
NOTE 2015 2015 2014
Actual Budget Actual
$ $ $
Cash Flows From Operating Activities
Receipts
Rates 87,027,875 86,234,963 82,379,737
Grants and Subsidies 5,849,873 4,095,510 2,349,439
Contributions, Reimbursements and Donations 1,419,787 1,477,802 2,073,239
Fees and Charges 37,983,721 38,994,621 37,847,297
Interest Earnings 5,134,588 4,048,838 4,617,178
Other 519,753 122,998 243,378
137,935,597 134,974,732 129,510,268
Payments
Employee Costs (56,464,237) (57,113,565) (53,480,158)
Materials and Contracts (44,455,604) (49,925,584) (46,233,352)
Utilities (5,733,481) (6,165,121) (6,029,342)
Insurance (1,612,867) (1,639,249) (1,625,926)
Interest Expense (455,328) (623,969) (488,961)
Goods and Services Tax (285,595) - (62,042)
(109,007,112) (115,467,488) (107,919,781)
Net Cash Provided By Operating Activities 18 28,928,485 19,507,244 21,590,487
Cash Flows from Investing Activities
Payments for Purchase of Property, Plant & Equipment (4,272,503) (14,579,669) (5,654,598)
Payments for Construction of Infrastructure (31,706,469) (37,207,644) (26,263,425)
Capital Investment Mindarie RC (42,126) (42,135) (39,710)
Distributions received from Tamala Park Regional Council 5,237,093 2,500,000 1,759,107
Materials Recovery Facility 399,083 - -
Grants/Contributions for the Development of Assets 9,281,247 9,277,327 5,770,044
Proceeds from Sale of Assets 528,315 3,890,150 522,390
Net Cash Used In Investing Activities (20,575,360) (36,161,971) (23,906,192)
Cash Flows from Financing Activities
Transfer from Trust Fund 560,660 296,395 428,716
Proceeds from Borrowing 8,500,000 13,045,423 -
Repayment of Borrowings 24(a) (1,399,466) (1,804,454) (1,655,977)
Net Cash Provided By (Used in) Financing Activities 7,661,194 11,537,364 (1,227,261)
Net Increase (Decrease) in Cash Held 16,014,319 (5,117,363) (3,542,966)
Cash at Beginning of Year 72,069,087 68,096,883 75,612,053
Cash and Cash Equivalents
at the End of the Year 8 88,083,406 62,979,520 72,069,087
This statement is to be read in conjunction with the accompanying notes.
6
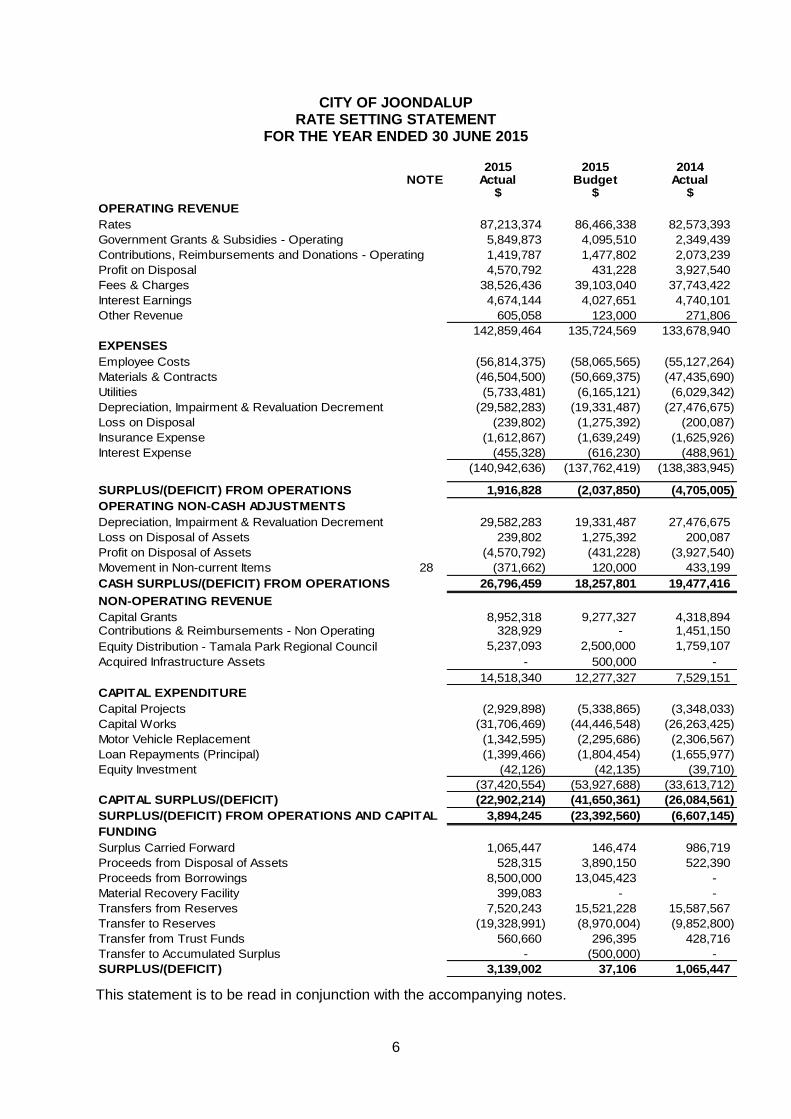
CITY OF JOONDALUP RATE SETTING STATEMENT
FOR THE YEAR ENDED 30 JUNE 2015
2015 2015 2014NOTE Actual Budget Actual
$ $ $
OPERATING REVENUE
Rates 87,213,374 86,466,338 82,573,393
Government Grants & Subsidies - Operating 5,849,873 4,095,510 2,349,439
Contributions, Reimbursements and Donations - Operating 1,419,787 1,477,802 2,073,239
Profit on Disposal 4,570,792 431,228 3,927,540
Fees & Charges 38,526,436 39,103,040 37,743,422
Interest Earnings 4,674,144 4,027,651 4,740,101
Other Revenue 605,058 123,000 271,806
142,859,464 135,724,569 133,678,940
EXPENSES
Employee Costs (56,814,375) (58,065,565) (55,127,264)
Materials & Contracts (46,504,500) (50,669,375) (47,435,690)
Utilities (5,733,481) (6,165,121) (6,029,342)
Depreciation, Impairment & Revaluation Decrement (29,582,283) (19,331,487) (27,476,675)
Loss on Disposal (239,802) (1,275,392) (200,087)
Insurance Expense (1,612,867) (1,639,249) (1,625,926)
Interest Expense (455,328) (616,230) (488,961)
(140,942,636) (137,762,419) (138,383,945)
SURPLUS/(DEFICIT) FROM OPERATIONS 1,916,828 (2,037,850) (4,705,005)
OPERATING NON-CASH ADJUSTMENTS
Depreciation, Impairment & Revaluation Decrement 29,582,283 19,331,487 27,476,675
Loss on Disposal of Assets 239,802 1,275,392 200,087
Profit on Disposal of Assets (4,570,792) (431,228) (3,927,540)
Movement in Non-current Items 28 (371,662) 120,000 433,199
CASH SURPLUS/(DEFICIT) FROM OPERATIONS 26,796,459 18,257,801 19,477,416
NON-OPERATING REVENUE
Capital Grants 8,952,318 9,277,327 4,318,894 Contributions & Reimbursements - Non Operating 328,929 - 1,451,150
Equity Distribution - Tamala Park Regional Council 5,237,093 2,500,000 1,759,107
Acquired Infrastructure Assets - 500,000 -
14,518,340 12,277,327 7,529,151
CAPITAL EXPENDITURE
Capital Projects (2,929,898) (5,338,865) (3,348,033)
Capital Works (31,706,469) (44,446,548) (26,263,425)
Motor Vehicle Replacement (1,342,595) (2,295,686) (2,306,567)
Loan Repayments (Principal) (1,399,466) (1,804,454) (1,655,977)
Equity Investment (42,126) (42,135) (39,710)
(37,420,554) (53,927,688) (33,613,712)
CAPITAL SURPLUS/(DEFICIT) (22,902,214) (41,650,361) (26,084,561)
SURPLUS/(DEFICIT) FROM OPERATIONS AND CAPITAL 3,894,245 (23,392,560) (6,607,145)
FUNDING
Surplus Carried Forward 1,065,447 146,474 986,719
Proceeds from Disposal of Assets 528,315 3,890,150 522,390
Proceeds from Borrowings 8,500,000 13,045,423 -
Material Recovery Facility 399,083 - -
Transfers from Reserves 7,520,243 15,521,228 15,587,567
Transfer to Reserves (19,328,991) (8,970,004) (9,852,800)
Transfer from Trust Funds 560,660 296,395 428,716
Transfer to Accumulated Surplus - (500,000) -
SURPLUS/(DEFICIT) 3,139,002 37,106 1,065,447
This statement is to be read in conjunction with the accompanying notes.
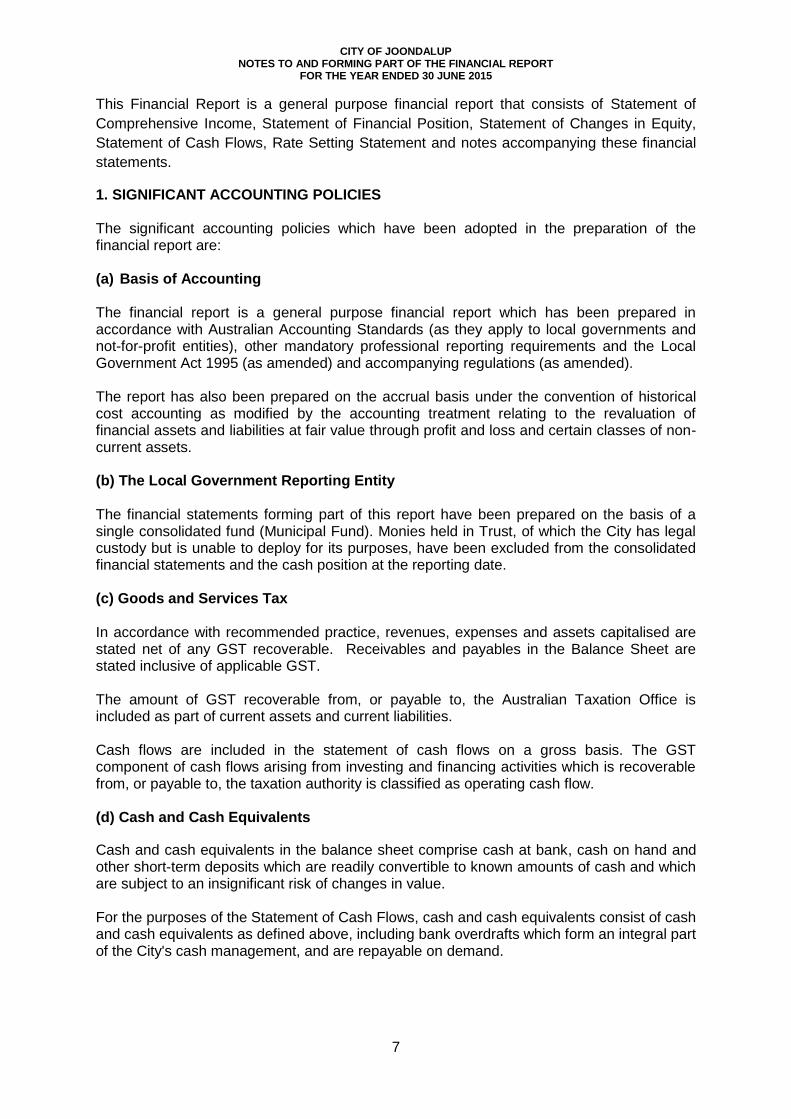
CITY OF JOONDALUP NOTES TO AND FORMING PART OF THE FINANCIAL REPORT
FOR THE YEAR ENDED 30 JUNE 2015
7
This Financial Report is a general purpose financial report that consists of Statement of
Comprehensive Income, Statement of Financial Position, Statement of Changes in Equity,
Statement of Cash Flows, Rate Setting Statement and notes accompanying these financial
statements.
1. SIGNIFICANT ACCOUNTING POLICIES The significant accounting policies which have been adopted in the preparation of the financial report are: (a) Basis of Accounting The financial report is a general purpose financial report which has been prepared in accordance with Australian Accounting Standards (as they apply to local governments and not-for-profit entities), other mandatory professional reporting requirements and the Local Government Act 1995 (as amended) and accompanying regulations (as amended). The report has also been prepared on the accrual basis under the convention of historical cost accounting as modified by the accounting treatment relating to the revaluation of financial assets and liabilities at fair value through profit and loss and certain classes of non-current assets. (b) The Local Government Reporting Entity The financial statements forming part of this report have been prepared on the basis of a single consolidated fund (Municipal Fund). Monies held in Trust, of which the City has legal custody but is unable to deploy for its purposes, have been excluded from the consolidated financial statements and the cash position at the reporting date. (c) Goods and Services Tax In accordance with recommended practice, revenues, expenses and assets capitalised are stated net of any GST recoverable. Receivables and payables in the Balance Sheet are stated inclusive of applicable GST. The amount of GST recoverable from, or payable to, the Australian Taxation Office is included as part of current assets and current liabilities. Cash flows are included in the statement of cash flows on a gross basis. The GST component of cash flows arising from investing and financing activities which is recoverable from, or payable to, the taxation authority is classified as operating cash flow. (d) Cash and Cash Equivalents
Cash and cash equivalents in the balance sheet comprise cash at bank, cash on hand and other short-term deposits which are readily convertible to known amounts of cash and which are subject to an insignificant risk of changes in value. For the purposes of the Statement of Cash Flows, cash and cash equivalents consist of cash and cash equivalents as defined above, including bank overdrafts which form an integral part of the City's cash management, and are repayable on demand.
CITY OF JOONDALUP NOTES TO AND FORMING PART OF THE FINANCIAL REPORT
FOR THE YEAR ENDED 30 JUNE 2015
8
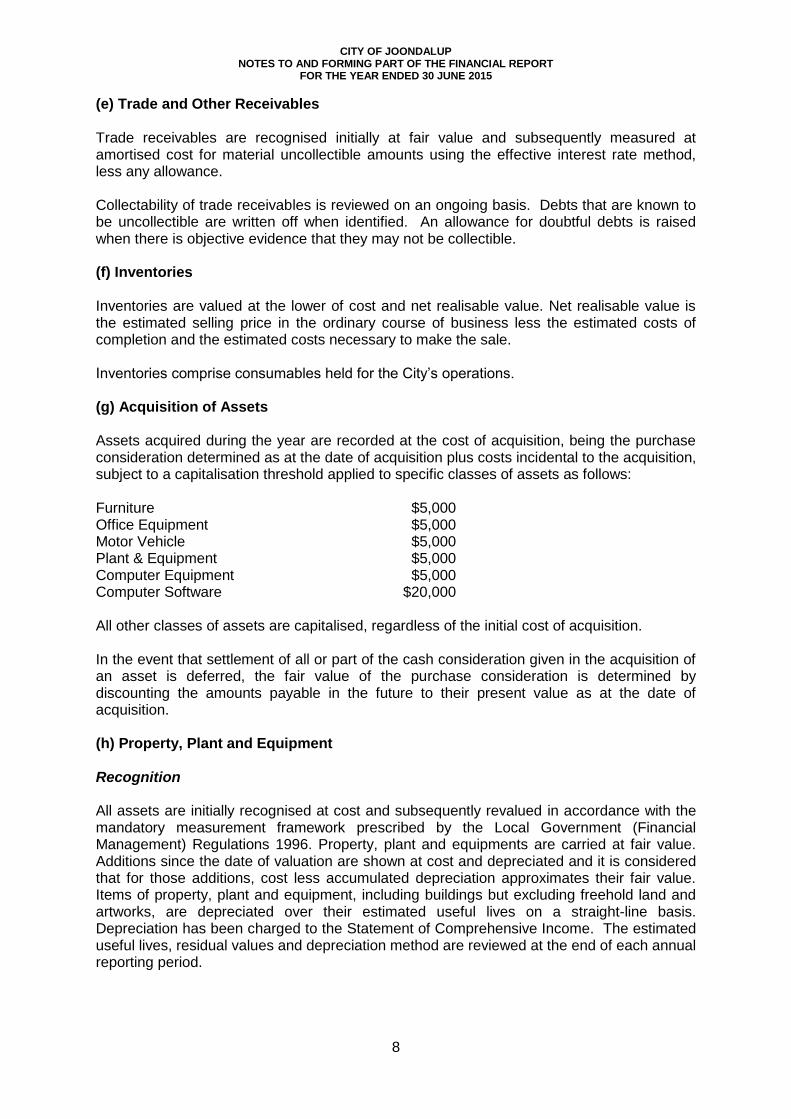
(e) Trade and Other Receivables Trade receivables are recognised initially at fair value and subsequently measured at amortised cost for material uncollectible amounts using the effective interest rate method, less any allowance. Collectability of trade receivables is reviewed on an ongoing basis. Debts that are known to be uncollectible are written off when identified. An allowance for doubtful debts is raised when there is objective evidence that they may not be collectible. (f) Inventories Inventories are valued at the lower of cost and net realisable value. Net realisable value is the estimated selling price in the ordinary course of business less the estimated costs of completion and the estimated costs necessary to make the sale. Inventories comprise consumables held for the City’s operations. (g) Acquisition of Assets Assets acquired during the year are recorded at the cost of acquisition, being the purchase consideration determined as at the date of acquisition plus costs incidental to the acquisition, subject to a capitalisation threshold applied to specific classes of assets as follows: Furniture $5,000 Office Equipment $5,000 Motor Vehicle $5,000 Plant & Equipment $5,000 Computer Equipment $5,000 Computer Software $20,000 All other classes of assets are capitalised, regardless of the initial cost of acquisition. In the event that settlement of all or part of the cash consideration given in the acquisition of an asset is deferred, the fair value of the purchase consideration is determined by discounting the amounts payable in the future to their present value as at the date of acquisition. (h) Property, Plant and Equipment Recognition All assets are initially recognised at cost and subsequently revalued in accordance with the mandatory measurement framework prescribed by the Local Government (Financial Management) Regulations 1996. Property, plant and equipments are carried at fair value. Additions since the date of valuation are shown at cost and depreciated and it is considered that for those additions, cost less accumulated depreciation approximates their fair value. Items of property, plant and equipment, including buildings but excluding freehold land and artworks, are depreciated over their estimated useful lives on a straight-line basis. Depreciation has been charged to the Statement of Comprehensive Income. The estimated useful lives, residual values and depreciation method are reviewed at the end of each annual reporting period.
CITY OF JOONDALUP NOTES TO AND FORMING PART OF THE FINANCIAL REPORT
FOR THE YEAR ENDED 30 JUNE 2015
9
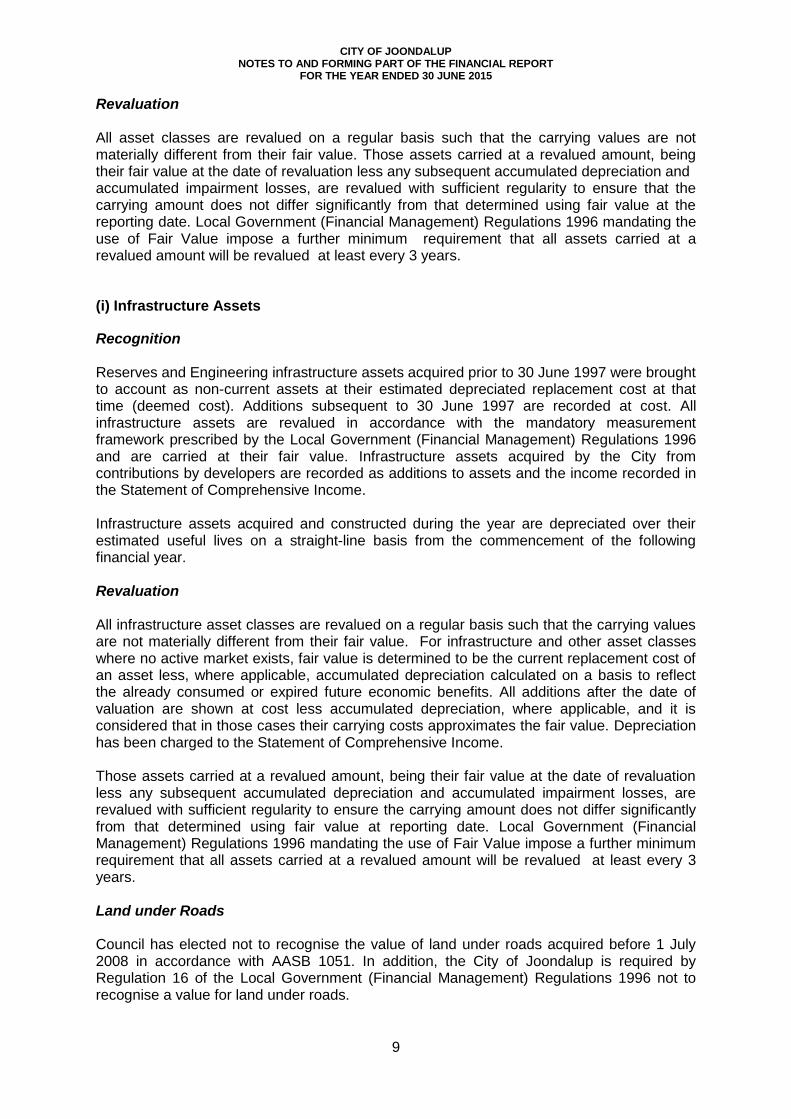
Revaluation All asset classes are revalued on a regular basis such that the carrying values are not materially different from their fair value. Those assets carried at a revalued amount, being their fair value at the date of revaluation less any subsequent accumulated depreciation and accumulated impairment losses, are revalued with sufficient regularity to ensure that the carrying amount does not differ significantly from that determined using fair value at the reporting date. Local Government (Financial Management) Regulations 1996 mandating the use of Fair Value impose a further minimum requirement that all assets carried at a revalued amount will be revalued at least every 3 years. (i) Infrastructure Assets
Recognition Reserves and Engineering infrastructure assets acquired prior to 30 June 1997 were brought to account as non-current assets at their estimated depreciated replacement cost at that time (deemed cost). Additions subsequent to 30 June 1997 are recorded at cost. All infrastructure assets are revalued in accordance with the mandatory measurement framework prescribed by the Local Government (Financial Management) Regulations 1996 and are carried at their fair value. Infrastructure assets acquired by the City from contributions by developers are recorded as additions to assets and the income recorded in the Statement of Comprehensive Income. Infrastructure assets acquired and constructed during the year are depreciated over their estimated useful lives on a straight-line basis from the commencement of the following financial year. Revaluation All infrastructure asset classes are revalued on a regular basis such that the carrying values are not materially different from their fair value. For infrastructure and other asset classes where no active market exists, fair value is determined to be the current replacement cost of an asset less, where applicable, accumulated depreciation calculated on a basis to reflect the already consumed or expired future economic benefits. All additions after the date of valuation are shown at cost less accumulated depreciation, where applicable, and it is considered that in those cases their carrying costs approximates the fair value. Depreciation has been charged to the Statement of Comprehensive Income. Those assets carried at a revalued amount, being their fair value at the date of revaluation less any subsequent accumulated depreciation and accumulated impairment losses, are revalued with sufficient regularity to ensure the carrying amount does not differ significantly from that determined using fair value at reporting date. Local Government (Financial Management) Regulations 1996 mandating the use of Fair Value impose a further minimum requirement that all assets carried at a revalued amount will be revalued at least every 3 years. Land under Roads Council has elected not to recognise the value of land under roads acquired before 1 July 2008 in accordance with AASB 1051. In addition, the City of Joondalup is required by Regulation 16 of the Local Government (Financial Management) Regulations 1996 not to recognise a value for land under roads.
CITY OF JOONDALUP NOTES TO AND FORMING PART OF THE FINANCIAL REPORT
FOR THE YEAR ENDED 30 JUNE 2015
10
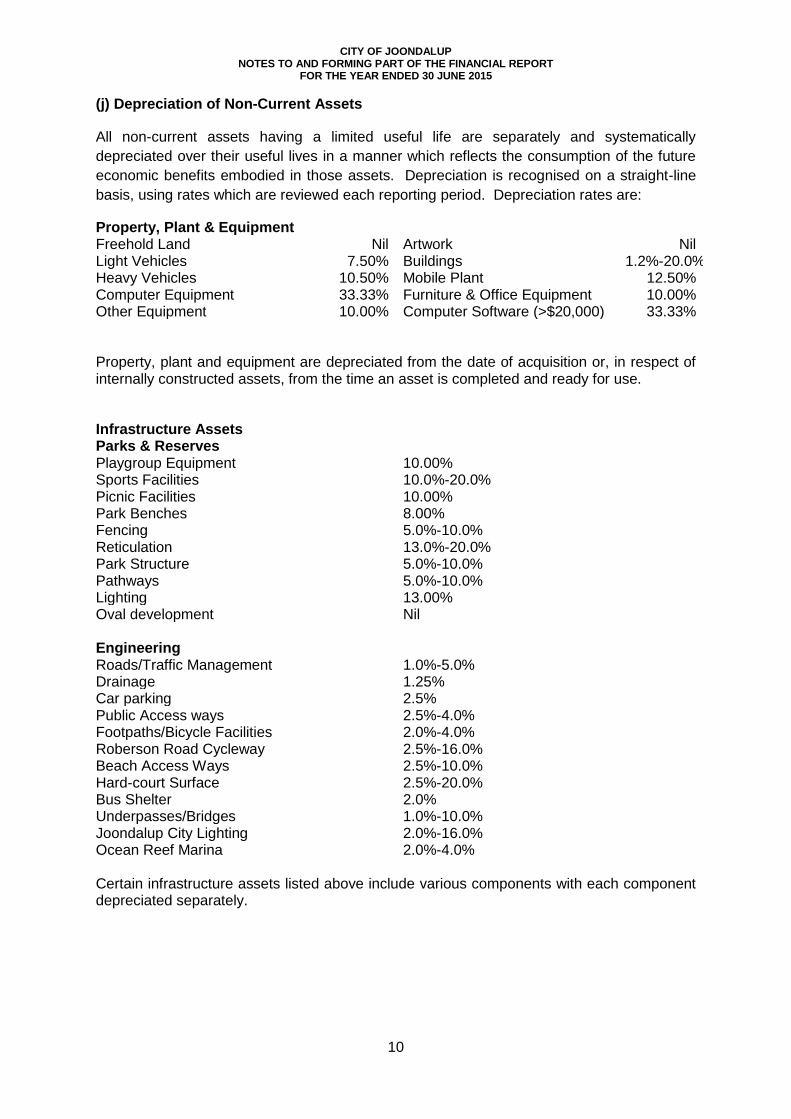
(j) Depreciation of Non-Current Assets
All non-current assets having a limited useful life are separately and systematically
depreciated over their useful lives in a manner which reflects the consumption of the future
economic benefits embodied in those assets. Depreciation is recognised on a straight-line
basis, using rates which are reviewed each reporting period. Depreciation rates are:
Property, Plant & Equipment Freehold Land Nil Artwork Nil Light Vehicles 7.50% Buildings 1.2%-20.0% Heavy Vehicles 10.50% Mobile Plant 12.50% Computer Equipment 33.33% Furniture & Office Equipment 10.00% Other Equipment 10.00% Computer Software (>$20,000) 33.33% Property, plant and equipment are depreciated from the date of acquisition or, in respect of internally constructed assets, from the time an asset is completed and ready for use. Infrastructure Assets Parks & Reserves Playgroup Equipment 10.00% Sports Facilities 10.0%-20.0% Picnic Facilities 10.00% Park Benches 8.00% Fencing 5.0%-10.0% Reticulation 13.0%-20.0% Park Structure 5.0%-10.0% Pathways 5.0%-10.0% Lighting 13.00% Oval development Nil
Engineering Roads/Traffic Management 1.0%-5.0% Drainage 1.25% Car parking 2.5% Public Access ways 2.5%-4.0% Footpaths/Bicycle Facilities 2.0%-4.0% Roberson Road Cycleway 2.5%-16.0% Beach Access Ways 2.5%-10.0% Hard-court Surface 2.5%-20.0% Bus Shelter 2.0% Underpasses/Bridges 1.0%-10.0% Joondalup City Lighting 2.0%-16.0% Ocean Reef Marina 2.0%-4.0% Certain infrastructure assets listed above include various components with each component depreciated separately.

CITY OF JOONDALUP NOTES TO AND FORMING PART OF THE FINANCIAL REPORT
FOR THE YEAR ENDED 30 JUNE 2015
11
(k) Financial Assets Classification The City classifies its financial assets in the categories 'Loans and Receivables', as defined in AASB 139 Financial Instruments Recognition and Measurement, and 'Cash and Cash Equivalents'. The classification reflects the purpose for which the assets were acquired. Management determines the classification of its financial assets at initial recognition. Receivables Receivables are non-derivative financial assets with fixed or determinable payments that are not quoted in an active market. They are included in current assets, except for those with maturities greater than 12 months after the balance sheet date which are classified as non-current assets. Receivables are included in trade and other receivables in the balance sheet. Recognition and derecognition
The City recognises its financial assets on the date that the City's right to receive cash flows from these assets has been established. Financial assets are derecognised when the rights to receive cash flows from the financial assets have expired or have been transferred and the City has transferred substantially all the risks and rewards of ownership.
(l) Estimation of Fair Value
The fair value of financial assets and financial liabilities is estimated for recognition and measurement. The nominal value less estimated credit adjustments of trade receivables and payables are assumed to approximate their fair values.
The fair value of financial liabilities for disclosure purposes is estimated by discounting the future contractual cash flows at the current market interest rate that is available to the City for similar financial instruments.
(m) Impairment
In accordance with Australian Accounting Standards the City's assets, other than inventories, are assessed at each reporting date to determine whether there is any indication they may be impaired. Where such an indication exists, an estimate of the recoverable amount of the asset is made in accordance with AASB 136 'Impairment of Assets' and appropriate adjustments made.
An impairment loss is recognised whenever the carrying amount of an asset or its cash-generating unit exceeds its recoverable amount. Impairment losses are recognised in the Statement of Comprehensive Income.
For non-cash generating assets such as roads, drains, public buildings and the like, value in use is represented by the depreciated replacement cost of the asset.
(n) Trade and Other Payables
Trade and other payables are recognised when the City becomes obliged to make future payments resulting from the purchase of goods and services. The amounts are unsecured and are generally settled within 30 days of recognition.
CITY OF JOONDALUP NOTES TO AND FORMING PART OF THE FINANCIAL REPORT
FOR THE YEAR ENDED 30 JUNE 2015
12
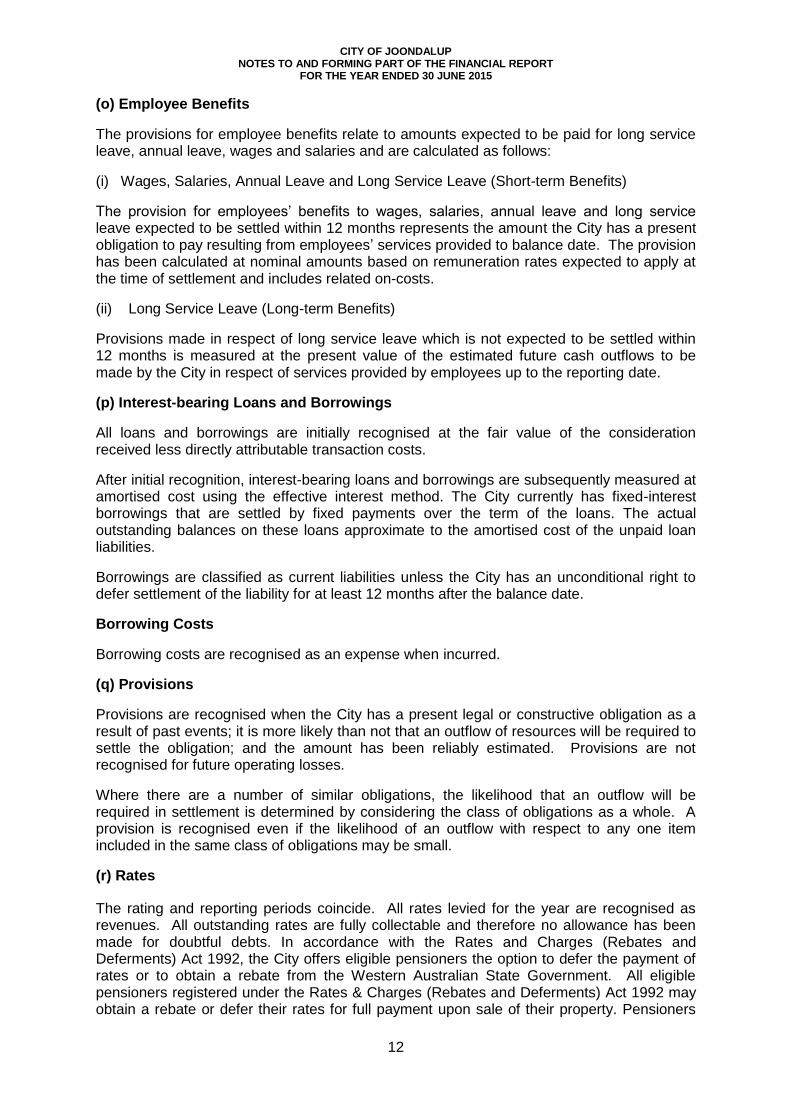
(o) Employee Benefits
The provisions for employee benefits relate to amounts expected to be paid for long service leave, annual leave, wages and salaries and are calculated as follows:
(i) Wages, Salaries, Annual Leave and Long Service Leave (Short-term Benefits)
The provision for employees’ benefits to wages, salaries, annual leave and long service leave expected to be settled within 12 months represents the amount the City has a present obligation to pay resulting from employees’ services provided to balance date. The provision has been calculated at nominal amounts based on remuneration rates expected to apply at the time of settlement and includes related on-costs.
(ii) Long Service Leave (Long-term Benefits)
Provisions made in respect of long service leave which is not expected to be settled within 12 months is measured at the present value of the estimated future cash outflows to be made by the City in respect of services provided by employees up to the reporting date.
(p) Interest-bearing Loans and Borrowings
All loans and borrowings are initially recognised at the fair value of the consideration received less directly attributable transaction costs.
After initial recognition, interest-bearing loans and borrowings are subsequently measured at amortised cost using the effective interest method. The City currently has fixed-interest borrowings that are settled by fixed payments over the term of the loans. The actual outstanding balances on these loans approximate to the amortised cost of the unpaid loan liabilities.
Borrowings are classified as current liabilities unless the City has an unconditional right to defer settlement of the liability for at least 12 months after the balance date.
Borrowing Costs
Borrowing costs are recognised as an expense when incurred.
(q) Provisions
Provisions are recognised when the City has a present legal or constructive obligation as a result of past events; it is more likely than not that an outflow of resources will be required to settle the obligation; and the amount has been reliably estimated. Provisions are not recognised for future operating losses.
Where there are a number of similar obligations, the likelihood that an outflow will be required in settlement is determined by considering the class of obligations as a whole. A provision is recognised even if the likelihood of an outflow with respect to any one item included in the same class of obligations may be small.
(r) Rates
The rating and reporting periods coincide. All rates levied for the year are recognised as revenues. All outstanding rates are fully collectable and therefore no allowance has been made for doubtful debts. In accordance with the Rates and Charges (Rebates and Deferments) Act 1992, the City offers eligible pensioners the option to defer the payment of rates or to obtain a rebate from the Western Australian State Government. All eligible pensioners registered under the Rates & Charges (Rebates and Deferments) Act 1992 may obtain a rebate or defer their rates for full payment upon sale of their property. Pensioners
CITY OF JOONDALUP NOTES TO AND FORMING PART OF THE FINANCIAL REPORT
FOR THE YEAR ENDED 30 JUNE 2015
13
who hold a Commonwealth Concession Card and a Pensioner Health Benefit Card, a State Concession Card, Seniors Card or a Commonwealth Seniors Health Card can apply to be eligible for this State scheme. There is no cost to the City under this scheme as interest is received from the State Government for pensioner deferred rates.
(s) Grants, Donations and Other Contributions
All grants, donations and other contributions in respect of which the City is not required to make a reciprocal transfer of economic benefits are recognised as revenue when the City obtains control over the assets comprising the contribution.
After being recognised as revenue, conditional grants and contributions are recognised as an expense and liability when the City fails to meet the specific conditions attached to a grant or contribution and becomes liable for its re-payment or refund.
Capital grants unspent are treated as restricted assets and are deducted from the available funds in the determination of the Opening and Closing Funds for the purpose of the Rate Setting Statement.
(t) Superannuation
The City of Joondalup makes statutory contributions to the WA Local Government Superannuation Plan and other Funds as nominated by its employees. The expense related to these contributions is recognised in the Statement of Comprehensive Income.
(u) Works in Progress
Major buildings, reserves and infrastructure or other assets which have not been completed at the reporting date have been recorded as works in progress.
(v) Rounding Off Figures
All figures shown in this annual financial report, other than a rate in the dollar, are rounded to the nearest dollar.
(w) Comparative Figures
Where required, comparative figures have been adjusted to conform with changes in presentation for the current financial year.
(x) Current and Non-Current Classification
In the determination of whether an asset or liability is current or non-current, consideration is given to the time when each asset or liability is expected to be settled. The asset or liability is classified as current if it is expected to be settled within the next 12 months, being the City’s operational cycle. In the case of liabilities where City does not have the unconditional right to defer settlement beyond 12 months, such as vested long service leave, the liability is classified as current even if not expected to be settled within the next 12 months. Inventories held for trading are classified as current even if not expected to be realised in the next 12 months except for land held for resale where it is held as non-current based on City’s intentions to release for sale.
(y) Crown Land
In accordance with Regulation 16 of the Local Government (Financial Management) Regulations 1996 and current accounting standards Crown land set aside as a public road reserve or other public thoroughfare or under the control of a local government under Section 3.53 of the Local Government Act 1995 or vested Crown land under the control of a
CITY OF JOONDALUP NOTES TO AND FORMING PART OF THE FINANCIAL REPORT
FOR THE YEAR ENDED 30 JUNE 2015
14
local government by virtue of the operation of the Land Act or the Town Planning and Development Act has not been brought to account as an asset of the City. Improvements or structures placed upon such land have been accounted for as assets of the City.
(z) New Accounting Standards and Interpretations
At the date of authorisation of this financial report, there were a number of Standards and Interpretations that were issued but not yet effective. These have not been adopted for the reporting period ended 30 June 2015, and the City's assessment of these new standards and interpretations has been provided in the Addendum to the financial statements.
(za) Critical Accounting Estimates
The preparation of a financial report in conformity with Australian Accounting Standards requires management to make judgements, estimates and assumptions that effect the application of policies and reported amounts of assets and liabilities, income and expenses.
The estimates and associated assumptions are based on historical experience and various other factors that are believed to be reasonable under the circumstances. The results of this experience and other factors combine to form the basis of making judgements about carrying values of assets and liabilities not readily apparent from other sources. Actual results may differ from these estimates.
2. PROGRAM ACTIVITIES
Statements of Comprehensive Income have been provided by program and by nature. Broad definitions of each program are as follows: (a) Governance Governance relates to elected members costs and other costs that relate to the tasks of assisting elected members and ratepayers on matters which do not concern specific City services. (b) General Purpose Funding Rates income and expenditure, Grants Commission and pensioner deferred rates interest. (c) Law, Order and Public Safety Supervision and enforcement of various local laws relating to fire prevention, animal control and other aspects of public safety. (d) Health Prevention and treatment of human illnesses, including inspection of premises/food control, immunisation and child health services. (e) Education and Welfare Provision, management and support services for families, children and the aged and disabled within the community, including pre-school playgroups, day and after school care, assistance to schools and senior citizens support groups. Provision of aged persons units and resident funded units.
CITY OF JOONDALUP NOTES TO AND FORMING PART OF THE FINANCIAL REPORT
FOR THE YEAR ENDED 30 JUNE 2015
15
(f) Housing Provision of housing and leased accommodation where the City acts as landlord. (g) Community Amenities Town planning and development, rubbish collection services, stormwater drainage, the provision of public conveniences, bus shelters, roadside furniture and litter control. (h) Recreation and Culture Provision of facilities and support for organisations concerned with leisure time activities and sport, support for the performing and creative arts. This includes maintenance of halls, aquatic centres, recreation and community centres, parks, gardens, sports grounds and the operation of libraries. (i) Transport Construction, maintenance and cleaning of streets, roads, bridges, drainage works, footpaths, parking facilities, traffic signs and the City works operation centre, including development, plant purchase and maintenance. (j) Economic Services Rural services, pest control and the implementation of building controls. (k) Other Property and Services Public works overheads, plant/vehicle operations, sundry and other outlays that cannot be assigned to one of the preceding programs.
3. RATING AND VALUATIONS
(a) Gross Rental Values
The Western Australian Land Information Authority (Landgate) conducts a Triennial Valuation which provides the City with both Gross Rental Values (GRV) and Unimproved Values (UV) for the purpose of calculating Rates. For the vast majority of properties, the values supplied were effective from 1 July 2014 and will continue for 3 years from that date.
(b) Differential Rates
The City of Joondalup has applied differential rates as empowered under Section 6.33 of the Local Government Act 1995. The differential rates are levied on all rateable land within the City according to the predominant purpose for which the land is held or used. Should the predominant land use forming the basis for the imposition of the differential rates change during the year, the City is not required to amend the assessment of rates payable on that land on account of that change.
The rates are set at differential levels that provide, as far as is practically possible, a fair and equitable distribution of the rate burden to each category of land having regard to its demands on the City’s services.

CITY OF JOONDALUP NOTES TO AND FORMING PART OF THE FINANCIAL REPORT
FOR THE YEAR ENDED 30 JUNE 2015
16
None of the differential rates are more than twice the lowest differential rate as applied in the financial year ended 30 June 2015.
The objects and reasons for the imposition of each differential rate are:
Object
The rates-in-the-dollar ($) are calculated to provide the shortfall in income required to enable the City to provide necessary works and services in the 2014-15 financial year after taking into account all non-rate sources of income.
Reason – Gross Rental Value Based Differential Rates
Residential Improved – the rate in the dollar has been set to ensure that the proportion of total rate revenue derived from residential property remains consistent with previous years.
Residential Vacant - the rate in the dollar has been set to ensure that the proportion of total rate revenue derived from residential property remains consistent with previous years and is higher than residential improved property to recognise the different valuation method and in an effort to promote development of this category of property thereby stimulating growth and development in the community.
Commercial Improved – the rate in the dollar has been set to ensure that the proportion of total rate revenue derived from commercial property remains consistent with previous years and recognises the higher demand on City infrastructure and services from the activity on commercial property.
Commercial Vacant – the rate in the dollar has been set to ensure that the proportion of total rate revenue derived from commercial property remains consistent with previous years and is higher than commercial improved property in an effort to promote development of this category of property thereby stimulating growth and development in the community.
Industrial Improved – the rate in the dollar has been set to ensure that the proportion of total rate revenue derived from industrial property remains consistent with previous years and recognises the higher demand on City infrastructure and services from the activity on industrial property.
Industrial Vacant – the rate in the dollar has been set to ensure that the proportion of total rate revenue derived from industrial property remains consistent with previous years and is higher than industrial improved property in an effort to promote development of this category of property thereby stimulating growth and development in the community.
Reason – Unimproved Value Based Differential Rates
Residential – the rate in the dollar has been set to ensure that the proportion of total rate revenue derived from residential property remains consistent with previous years.
Rural – the rate in the dollar has been set to ensure that the proportion of total rate revenue derived from rural property remains consistent with previous years.
(c) Minimum Payments
A minimum payment of $797 is applied to GRV residential improved and not improved and UV residential and rural rate categories in recognition that every property receives some minimum level of benefit from works and services provided.
A minimum payment of $814 is applied to GRV commercial and industrial both improved and not improved rate categories in recognition that every property receives some minimum level
CITY OF JOONDALUP NOTES TO AND FORMING PART OF THE FINANCIAL REPORT
FOR THE YEAR ENDED 30 JUNE 2015
17
of benefit from works and services provided and the higher minimum compared to other rate categories recognises the higher demand on City infrastructure and services from the activity on commercial and industrial property.
(d) Concessions and waivers
No concessions were provided for in the 2014-15 financial year.
(e) Rates Early Payment Incentive Scheme
Council, in accordance with the provisions of Section 6.46 of the Local Government Act 1995, offered the following early payment incentives for the payment of rates and charges:
Full payment of all current and arrears of rates (including specified area rates), Emergency Services Levy, domestic refuse charge and private swimming pool inspection fees within 28 days of the issue date on the annual rate notice:
Eligibility to enter the early payment incentive draw which included a range of prizes sponsored by a number of organisations and thus at no cost to the City, as well as a vehicle purchased by the City.
A pool of prize winners was chosen by a computerised random selection process, the integrity of which has been authenticated by the City’s auditor. The winners were invited to attend a prize draw function during which the prizes were allocated in a secondary draw process.
The total cost of the rates early payment incentives was as follows:
2015 2015 2014
Actual Budget Actual
$ $ $
Rates - Early Payment Incentives & Prizes 31,194 40,000 67,919
31,194 40,000 67,919
(f) Rates Payment Options
The City, in accordance with the provisions of Section 6.45 of the Local Government Act 1995, offered the following payment options for the payment of rates (including specified area rates), Emergency Services Levy, domestic refuse charges, private swimming pool inspection fees and property surveillance & security charge.
One Instalment
Payment in full within 28 days of the issue date of the annual rate notice and eligibility to enter the rates incentive scheme for prizes.
Payment in full within 35 days of the issue date of the annual rate notice.
Two Instalments
The first instalment of 50% of the total current rates (including specified area rates), domestic refuse charge, private swimming pool inspection fee, instalment charge, plus the total outstanding arrears payable within 35 days of date of issue of the annual rate notice.
CITY OF JOONDALUP NOTES TO AND FORMING PART OF THE FINANCIAL REPORT
FOR THE YEAR ENDED 30 JUNE 2015
18
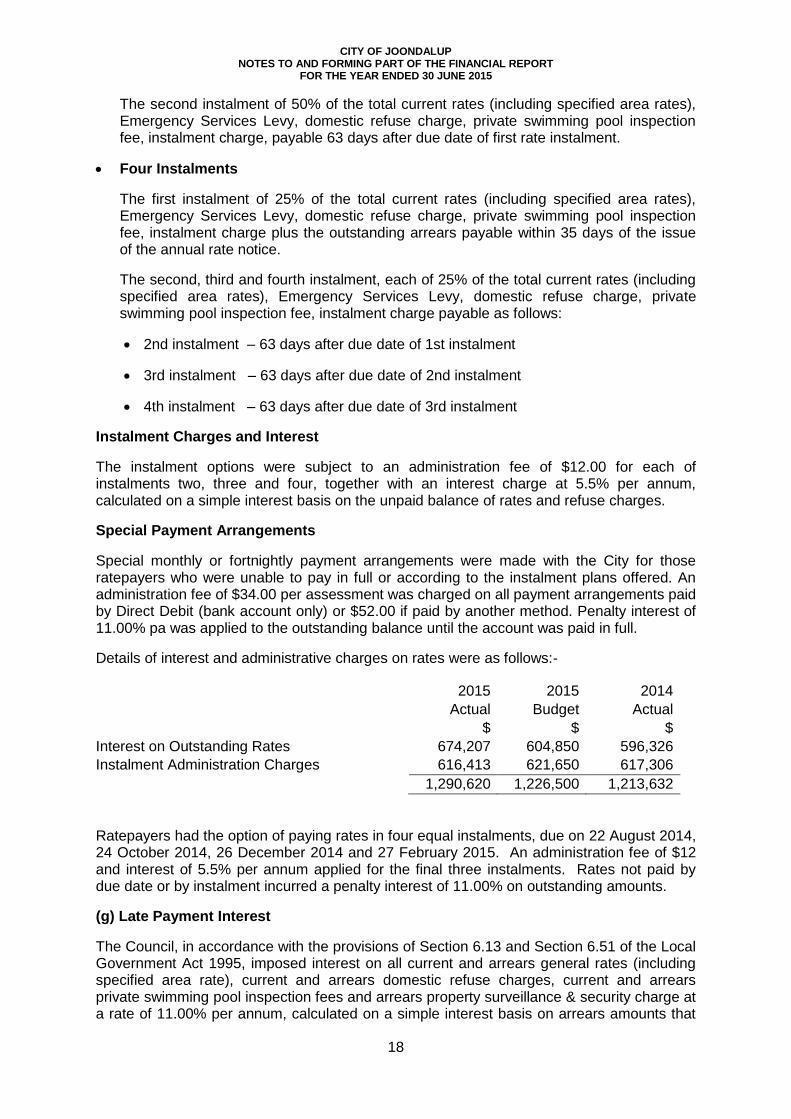
The second instalment of 50% of the total current rates (including specified area rates), Emergency Services Levy, domestic refuse charge, private swimming pool inspection fee, instalment charge, payable 63 days after due date of first rate instalment.
Four Instalments
The first instalment of 25% of the total current rates (including specified area rates), Emergency Services Levy, domestic refuse charge, private swimming pool inspection fee, instalment charge plus the outstanding arrears payable within 35 days of the issue of the annual rate notice.
The second, third and fourth instalment, each of 25% of the total current rates (including specified area rates), Emergency Services Levy, domestic refuse charge, private swimming pool inspection fee, instalment charge payable as follows:
2nd instalment – 63 days after due date of 1st instalment
3rd instalment – 63 days after due date of 2nd instalment
4th instalment – 63 days after due date of 3rd instalment
Instalment Charges and Interest
The instalment options were subject to an administration fee of $12.00 for each of instalments two, three and four, together with an interest charge at 5.5% per annum, calculated on a simple interest basis on the unpaid balance of rates and refuse charges.
Special Payment Arrangements
Special monthly or fortnightly payment arrangements were made with the City for those ratepayers who were unable to pay in full or according to the instalment plans offered. An administration fee of $34.00 per assessment was charged on all payment arrangements paid by Direct Debit (bank account only) or $52.00 if paid by another method. Penalty interest of 11.00% pa was applied to the outstanding balance until the account was paid in full.
Details of interest and administrative charges on rates were as follows:-
2015 2015 2014
Actual Budget Actual
$ $ $
Interest on Outstanding Rates 674,207 604,850 596,326
Instalment Administration Charges 616,413 621,650 617,306
1,290,620 1,226,500 1,213,632
Ratepayers had the option of paying rates in four equal instalments, due on 22 August 2014, 24 October 2014, 26 December 2014 and 27 February 2015. An administration fee of $12 and interest of 5.5% per annum applied for the final three instalments. Rates not paid by due date or by instalment incurred a penalty interest of 11.00% on outstanding amounts.
(g) Late Payment Interest
The Council, in accordance with the provisions of Section 6.13 and Section 6.51 of the Local Government Act 1995, imposed interest on all current and arrears general rates (including specified area rate), current and arrears domestic refuse charges, current and arrears private swimming pool inspection fees and arrears property surveillance & security charge at a rate of 11.00% per annum, calculated on a simple interest basis on arrears amounts that
CITY OF JOONDALUP NOTES TO AND FORMING PART OF THE FINANCIAL REPORT
FOR THE YEAR ENDED 30 JUNE 2015
19
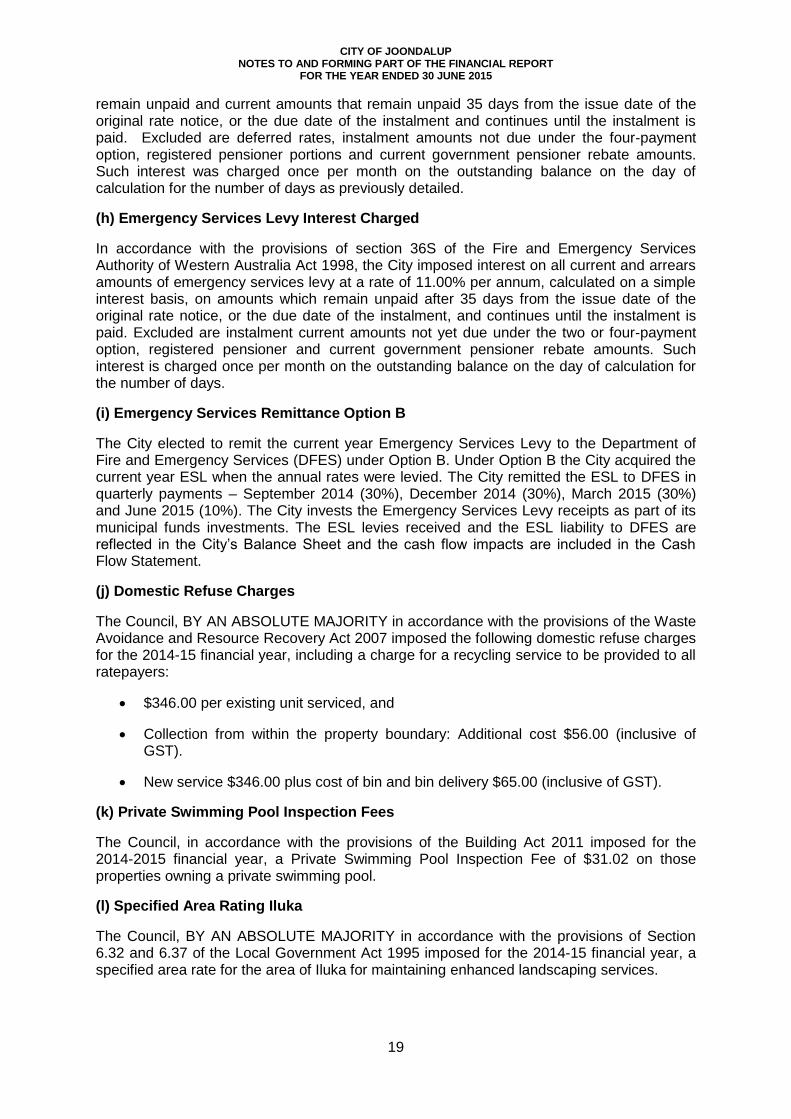
remain unpaid and current amounts that remain unpaid 35 days from the issue date of the original rate notice, or the due date of the instalment and continues until the instalment is paid. Excluded are deferred rates, instalment amounts not due under the four-payment option, registered pensioner portions and current government pensioner rebate amounts. Such interest was charged once per month on the outstanding balance on the day of calculation for the number of days as previously detailed.
(h) Emergency Services Levy Interest Charged
In accordance with the provisions of section 36S of the Fire and Emergency Services Authority of Western Australia Act 1998, the City imposed interest on all current and arrears amounts of emergency services levy at a rate of 11.00% per annum, calculated on a simple interest basis, on amounts which remain unpaid after 35 days from the issue date of the original rate notice, or the due date of the instalment, and continues until the instalment is paid. Excluded are instalment current amounts not yet due under the two or four-payment option, registered pensioner and current government pensioner rebate amounts. Such interest is charged once per month on the outstanding balance on the day of calculation for the number of days.
(i) Emergency Services Remittance Option B
The City elected to remit the current year Emergency Services Levy to the Department of Fire and Emergency Services (DFES) under Option B. Under Option B the City acquired the current year ESL when the annual rates were levied. The City remitted the ESL to DFES in quarterly payments – September 2014 (30%), December 2014 (30%), March 2015 (30%) and June 2015 (10%). The City invests the Emergency Services Levy receipts as part of its municipal funds investments. The ESL levies received and the ESL liability to DFES are reflected in the City’s Balance Sheet and the cash flow impacts are included in the Cash Flow Statement.
(j) Domestic Refuse Charges
The Council, BY AN ABSOLUTE MAJORITY in accordance with the provisions of the Waste Avoidance and Resource Recovery Act 2007 imposed the following domestic refuse charges for the 2014-15 financial year, including a charge for a recycling service to be provided to all ratepayers:
$346.00 per existing unit serviced, and
Collection from within the property boundary: Additional cost $56.00 (inclusive of GST).
New service $346.00 plus cost of bin and bin delivery $65.00 (inclusive of GST).
(k) Private Swimming Pool Inspection Fees
The Council, in accordance with the provisions of the Building Act 2011 imposed for the 2014-2015 financial year, a Private Swimming Pool Inspection Fee of $31.02 on those properties owning a private swimming pool.
(l) Specified Area Rating Iluka
The Council, BY AN ABSOLUTE MAJORITY in accordance with the provisions of Section 6.32 and 6.37 of the Local Government Act 1995 imposed for the 2014-15 financial year, a specified area rate for the area of Iluka for maintaining enhanced landscaping services.
CITY OF JOONDALUP NOTES TO AND FORMING PART OF THE FINANCIAL REPORT
FOR THE YEAR ENDED 30 JUNE 2015
20
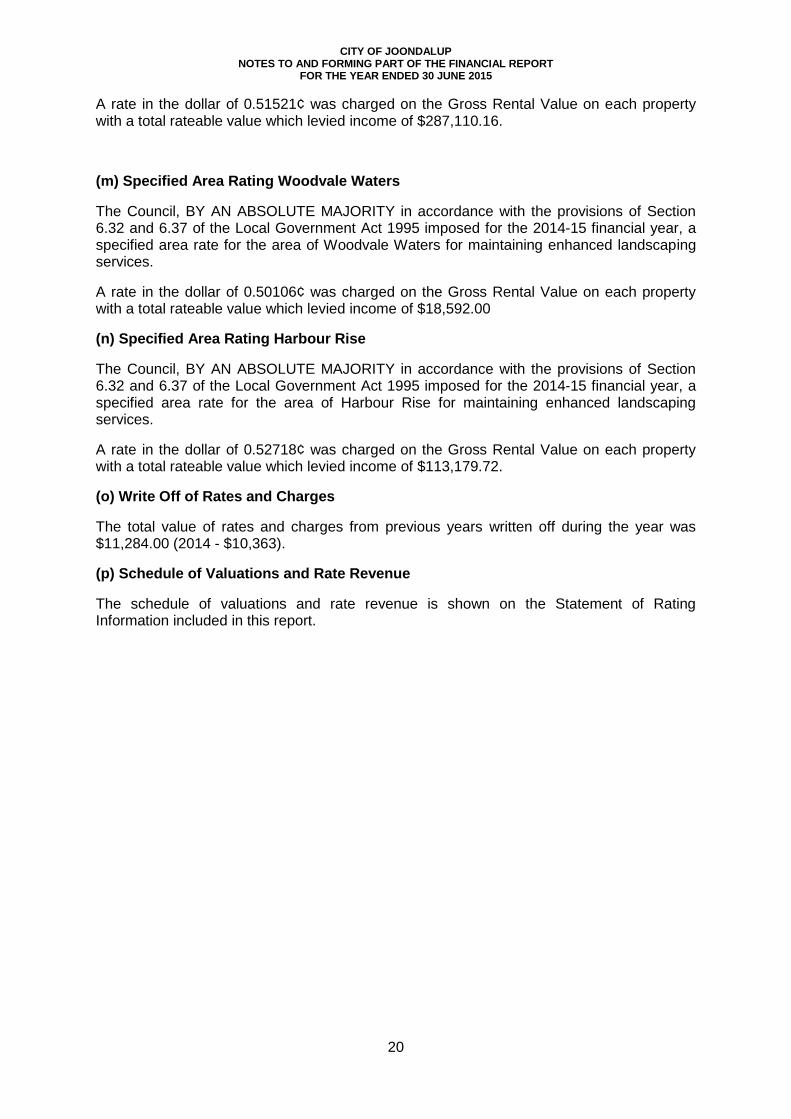
A rate in the dollar of 0.51521¢ was charged on the Gross Rental Value on each property with a total rateable value which levied income of $287,110.16.
(m) Specified Area Rating Woodvale Waters
The Council, BY AN ABSOLUTE MAJORITY in accordance with the provisions of Section 6.32 and 6.37 of the Local Government Act 1995 imposed for the 2014-15 financial year, a specified area rate for the area of Woodvale Waters for maintaining enhanced landscaping services.
A rate in the dollar of 0.50106¢ was charged on the Gross Rental Value on each property with a total rateable value which levied income of $18,592.00
(n) Specified Area Rating Harbour Rise
The Council, BY AN ABSOLUTE MAJORITY in accordance with the provisions of Section 6.32 and 6.37 of the Local Government Act 1995 imposed for the 2014-15 financial year, a specified area rate for the area of Harbour Rise for maintaining enhanced landscaping services.
A rate in the dollar of 0.52718¢ was charged on the Gross Rental Value on each property with a total rateable value which levied income of $113,179.72.
(o) Write Off of Rates and Charges
The total value of rates and charges from previous years written off during the year was $11,284.00 (2014 - $10,363).
(p) Schedule of Valuations and Rate Revenue
The schedule of valuations and rate revenue is shown on the Statement of Rating Information included in this report.

CITY OF JOONDALUP NOTES TO AND FORMING PART OF THE FINANCIAL REPORT
FOR THE YEAR ENDED 30 JUNE 2015
21
(q) STATEMENT OF RATING INFORMATION
Ratable Value
$
No of
Properties
Rate
Cents in $
Rate Yield
$
Ratable Value
$
No of
Properties
Minimum
Payment
Rate Yield
$
Ratable Value No of
Properties
Rate Yield
$
General Rate - GRV
Residential Improved 1,244,632,448 52,889 4.9903 62,110,896 81,582,300 5,512 797 4,393,064 1,326,214,748 58,401 66,503,962
Residential Vacant 19,778,700 908 7.0548 1,395,348 2,436,470 260 797 207,220 22,215,170 1,168 1,602,568
Commercial Improved 264,130,940 900 6.1062 16,128,363 310,404 32 814 26,048 264,441,344 932 16,154,413
Commercial Vacant 906,500 13 9.9806 90,474 - - 814 - 906,500 13 90,474
Industrial Improved 25,670,340 374 5.5857 1,433,868 49,948 4 814 3,256 25,720,288 378 1,437,124
Industrial Vacant 345,000 7 9.9806 34,433 - - 783 - 345,000 7 34,433
1,555,463,928 55,091 81,193,383 84,379,122 5,808 4,629,588 1,639,843,050 60,899 85,822,974
General Rate - UV
Residential 1,580,000 1 0.9078 14,343 - - - - 1,580,000 1 14,343
Rural 1,730,000 2 0.9034 15,629 - - - - 1,730,000 2 15,629
Total UV 3,310,000 3 29,972 - - - - 3,310,000 3 29,972
Interim Rates 972,739
Total Rate Levy 1,558,773,928 55,094 81,223,355 84,379,122 5,808 4,629,588 1,643,153,050 60,902 86,825,685
Early Payment Prizes (Note 3(e)) (31,194)
Net General Rates 86,794,491
Specified Area Rates - GRV
Iluka 53,170,590 1,730 0.51521 273,940 - - - - 53,170,590 1,730 273,940
Illuka - Iterim Adjustments - - 13,170 - - - - - 13,170
Woodvale Waters 3,708,900 138 0.50106 18,584 - - - - 3,708,900 138 18,584
Woodvale Waters - Interim Adjustments 8 8
Harbour Rise 21,208,880 499 0.52718 111,809 - - - - 21,208,880 499 111,809
Harbour Rise-Interim Adjustments - - 1,371 - - - - - - 1,371
Total Specified Area Rates 78,088,370 2,367 418,882 - - - - 78,088,370 2,367 418,882
Total Rates Revenue 87,213,374
General Rates Minimum Payments Total

CITY OF JOONDALUP NOTES TO AND FORMING PART OF THE FINANCIAL REPORT
FOR THE YEAR ENDED 30 JUNE 2015
22
4. REVENUE AND EXPENSES Note 2015 2015 2014
Actual Budget Actual
$ $ $
Result from Ordinary Activities
Contributions, Reimbursements and Donations
Contributions and Donations 293,947 211,665 212,689
Reimbursements and Recoveries 1,125,840 1,266,137 1,860,550
1,419,787 1,477,802 2,073,239
Audit Expenses
Statutory Audit 34,500 34,000 32,000
Other Expenses 330 - 678
34,830 34,000 32,678
Buildings 5,041,283 4,820,180 4,896,938
Furniture and Equipment 383,299 792,512 821,269
Plant and Equipment 1,267,040 1,099,646 1,107,361
Parks and Reserves 3,627,984 1,700,000 2,040,378
Roads 11,582,713 7,200,000 11,353,622
Footpaths 1,871,316 550,000 1,855,264
Drainage 4,151,645 2,320,000 4,144,084
Bridges and Passes 346,515 - 346,516
Other Infrastructure 1,308,603 849,150 750,190
Impairment/Revaluation Decrement 1,885 - 161,053
29,582,283 19,331,487 27,476,675
5. Acquired Infrastructure Assets
Roads - 300,000 -
Footpaths - 50,000 -
Drainage - 150,000 -
- 500,000 -
Contributions to Infrastructure Assets from developers recognised as revenue and
included in the Income Statement under Contributions, Reimbursements and Donations
are as follows:
Depreciation, Impairment &
Revaluation Decrement

CITY OF JOONDALUP NOTES TO AND FORMING PART OF THE FINANCIAL REPORT
FOR THE YEAR ENDED 30 JUNE 2015
23
6. FEES & CHARGES 2015 2015 2014
Actual Budget Actual
$ $ $
By Nature
Rubbish Collection Fees 20,073,556 19,950,200 19,227,386
Membership Fees 2,163,516 2,475,502 2,316,368
Admission Fees 1,845,391 2,056,473 1,859,717
Building Licence Fees 763,149 800,000 751,542
Learn to Swim Program Fees 2,252,318 2,214,481 2,140,762
Court Sport Revenue 594,126 630,892 588,273
Facilities Hire 888,175 769,859 808,329
Development Application Fees 827,512 900,000 1,009,971
Property Rental 756,129 662,857 672,301
Inspection Fees 835,516 771,202 605,982
Land Purchase Enquiries Fees 257,086 217,200 265,006
Parking Infringements 1,091,212 1,130,000 1,154,448
Other infringements and fines 309,795 362,080 318,201
Commission 188,621 183,950 158,766
On-Street Parking Fee 973,648 1,219,000 1,016,017
Off Street Parking Fees 998,267 986,512 1,036,231
Term Programme Activities Fees 296,552 368,829 342,111
Dog Registration Fees 527,448 407,093 401,227
Cat Registration Fee 69,284 196,910 209,720
Eating House Licences & Registrations 82,264 47,000 61,462
Environmental Health Services - Immunisation 104,451 84,000 117,898
Merchandise Sales & Other Sales 442,732 470,439 493,533
Rates Instalment Administration Charges 616,413 621,650 617,306
Other Miscellaneous Charges 1,569,275 1,576,911 1,570,865
38,526,436 39,103,040 37,743,422
By Program
General Purpose Funding 984,412 963,246 987,536
Law, Order & Public Safety 802,626 896,052 860,610
Health 394,067 312,500 349,034
Education & Welfare 175,116 174,139 169,421
Community Amenities 22,937,388 22,784,555 22,089,990
Recreation & Culture 8,920,927 9,583,668 8,921,469
Transport 3,832,813 3,995,654 3,966,879
Other Property and Services 479,086 393,226 398,483
38,526,436 39,103,040 37,743,422
CITY OF JOONDALUP NOTES TO AND FORMING PART OF THE FINANCIAL REPORT
FOR THE YEAR ENDED 30 JUNE 2015
24
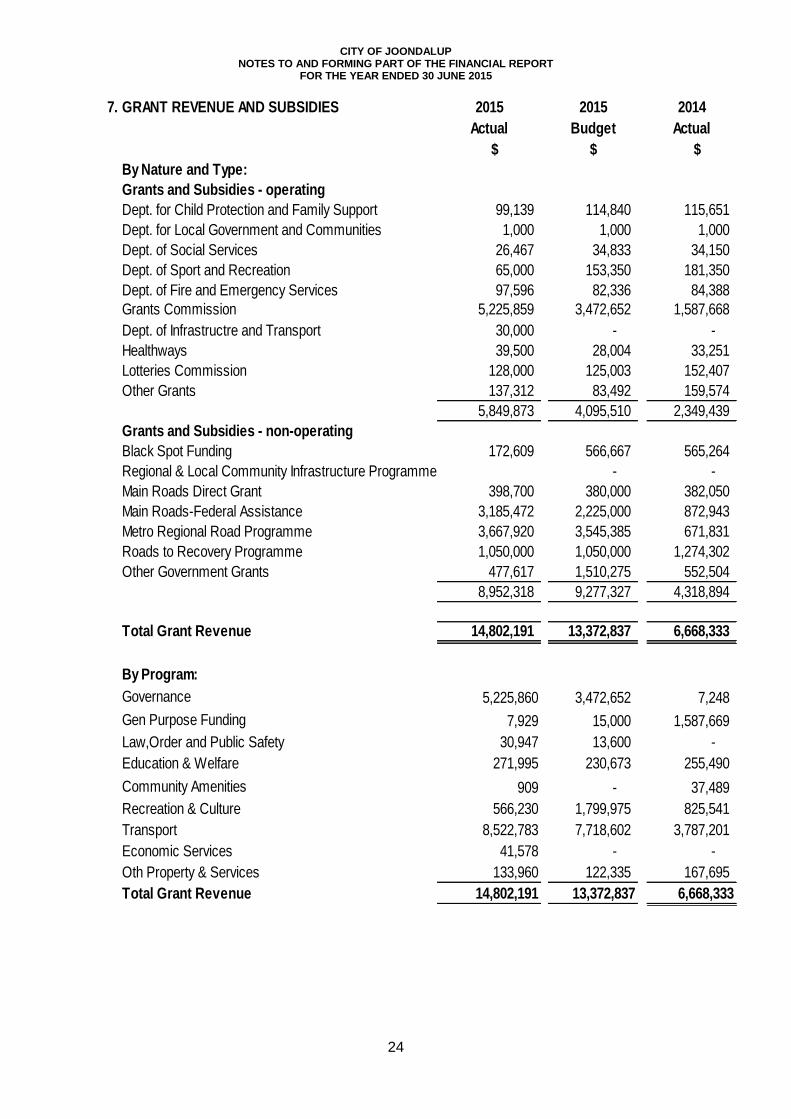
7. 2015 2015 2014
Actual Budget Actual
$ $ $
99,139 114,840 115,651
1,000 1,000 1,000
26,467 34,833 34,150
65,000 153,350 181,350
Dept. of Fire and Emergency Services 97,596 82,336 84,388
5,225,859 3,472,652 1,587,668
30,000 - -
39,500 28,004 33,251
128,000 125,003 152,407
137,312 83,492 159,574
5,849,873 4,095,510 2,349,439
172,609 566,667 565,264
- -
398,700 380,000 382,050
3,185,472 2,225,000 872,943
3,667,920 3,545,385 671,831
1,050,000 1,050,000 1,274,302
477,617 1,510,275 552,504
8,952,318 9,277,327 4,318,894
Total Grant Revenue 14,802,191 13,372,837 6,668,333
Governance 5,225,860 3,472,652 7,248
Gen Purpose Funding 7,929 15,000 1,587,669
Law,Order and Public Safety 30,947 13,600 -
Education & Welfare 271,995 230,673 255,490
Community Amenities 909 - 37,489
Recreation & Culture 566,230 1,799,975 825,541
Transport 8,522,783 7,718,602 3,787,201
Economic Services 41,578 - -
Oth Property & Services 133,960 122,335 167,695
Total Grant Revenue 14,802,191 13,372,837 6,668,333
Other Government Grants
Main Roads Direct Grant
Main Roads-Federal Assistance
Metro Regional Road Programme
Roads to Recovery Programme
Grants and Subsidies - non-operating
Black Spot Funding
Regional & Local Community Infrastructure Programme
Other Grants
By Program:
Healthways
Lotteries Commission
Grants Commission
Dept. of Infrastructre and Transport
GRANT REVENUE AND SUBSIDIES
By Nature and Type:
Grants and Subsidies - operating
Dept. for Child Protection and Family Support
Dept. for Local Government and Communities
Dept. of Social Services
Dept. of Sport and Recreation
CITY OF JOONDALUP NOTES TO AND FORMING PART OF THE FINANCIAL REPORT
FOR THE YEAR ENDED 30 JUNE 2015
25
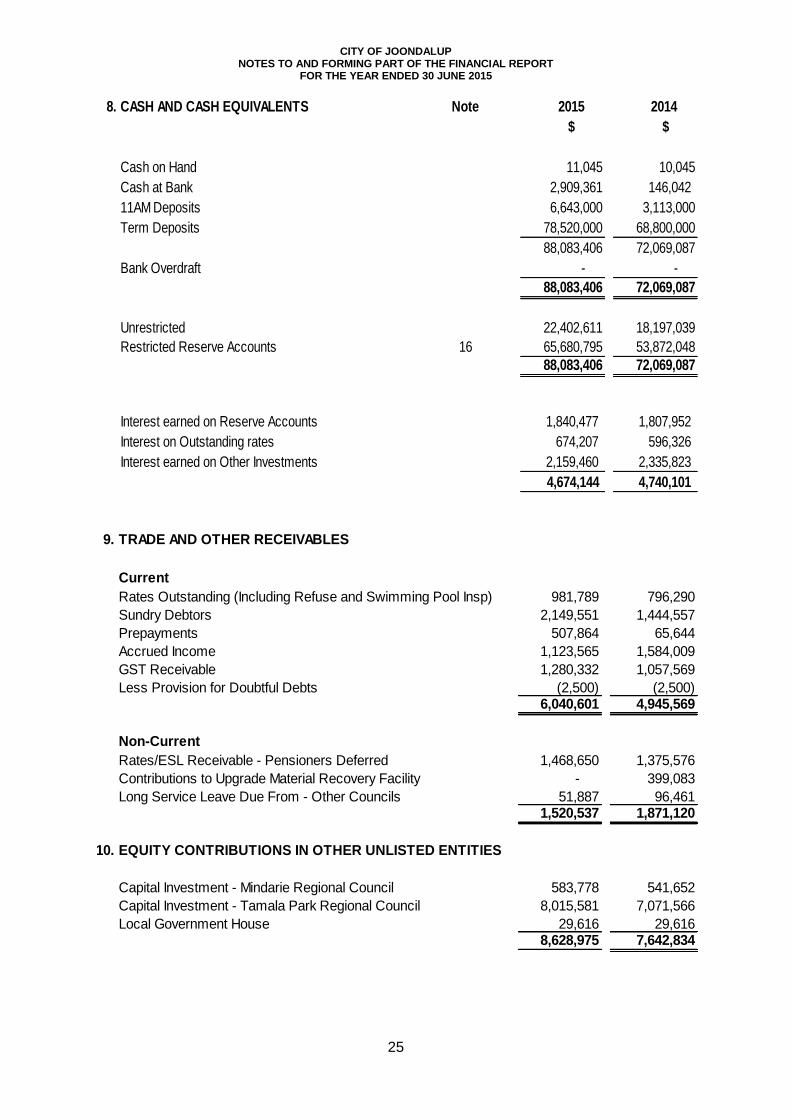
8. CASH AND CASH EQUIVALENTS Note 2015 2014
$ $
Cash on Hand 11,045 10,045
Cash at Bank 2,909,361 146,042
11AM Deposits 6,643,000 3,113,000
Term Deposits 78,520,000 68,800,000
88,083,406 72,069,087
Bank Overdraft - -
88,083,406 72,069,087
Unrestricted 22,402,611 18,197,039
Restricted Reserve Accounts 16 65,680,795 53,872,048
88,083,406 72,069,087
Interest earned on Reserve Accounts 1,840,477 1,807,952
Interest on Outstanding rates 674,207 596,326
Interest earned on Other Investments 2,159,460 2,335,823
4,674,144 4,740,101
9. TRADE AND OTHER RECEIVABLES
Current
Rates Outstanding (Including Refuse and Swimming Pool Insp) 981,789 796,290
Sundry Debtors 2,149,551 1,444,557
Prepayments 507,864 65,644
Accrued Income 1,123,565 1,584,009
GST Receivable 1,280,332 1,057,569
Less Provision for Doubtful Debts (2,500) (2,500)6,040,601 4,945,569
Non-Current
Rates/ESL Receivable - Pensioners Deferred 1,468,650 1,375,576
Contributions to Upgrade Material Recovery Facility - 399,083
Long Service Leave Due From - Other Councils 51,887 96,4611,520,537 1,871,120
10. EQUITY CONTRIBUTIONS IN OTHER UNLISTED ENTITIES
Capital Investment - Mindarie Regional Council 583,778 541,652
Capital Investment - Tamala Park Regional Council 8,015,581 7,071,566
Local Government House 29,616 29,6168,628,975 7,642,834
CITY OF JOONDALUP NOTES TO AND FORMING PART OF THE FINANCIAL REPORT
FOR THE YEAR ENDED 30 JUNE 2015
26
The Mindarie Regional Council (MRC), of which the City is an equity holder, has developed a Resource Recovery Facility (RRF). In this process, the MRC borrowed $3.5m to acquire the land on which the RRF will be developed. Due to the time lag between the loan repayment and the RRF operation and charges, the MRC Council approved that its equity holders be charged for the repayment obligations under the land purchase loan. The methodology adopted for this charge was to treat the interest component of the repayment amount as an additional expense in substitution of an increase in the gate fee chargeable and to treat the principal repayment component as an additional equity contribution to the capital of the MRC.
The Tamala Park Regional Council (TPRC) was established in January 2006 for the purpose of the development of the Tamala Park land jointly owned by seven local governments, including the City of Joondalup, which has one-sixth equity in the land. The West Australia Planning Commission (WAPC) requested that a portion of this land be retained as "Bush Forever", which the Commission was prepared to acquire and pay for. The "Bush Forever" land was disposed of by the joint owners to the WAPC in November 2006. The City of Joondalup's share of the proceeds of disposal was $2,703,573 which was subsequently contributed to the TPRC as equity investment to be used for TPRC purposes.
The current fair value of equity is estimated at $8,015,581. TPRC had subdivided and sold 215 lots measuring an area of 74,655m2 of land during the year with a total sales value of $60,073,460. The City’s share of sales proceeds after deducting development and selling costs was $5,438,620. The City made a profit of $4,564,145 from the sale of land.
City has received the audited financial statements of Tamala Park Regional Council for the year ended 30 June 2015. The City’s share of Net Result of operations of Tamala Park Regional Council was $84,279. This amount was credited to the Statement of Comprehensive Income in accordance with the equity method of accounting.
The City’s interest in other unlisted entities has been recognised in the financial statements at cost of contributed equity.
CITY OF JOONDALUP NOTES TO AND FORMING PART OF THE FINANCIAL REPORT
FOR THE YEAR ENDED 30 JUNE 2015
27
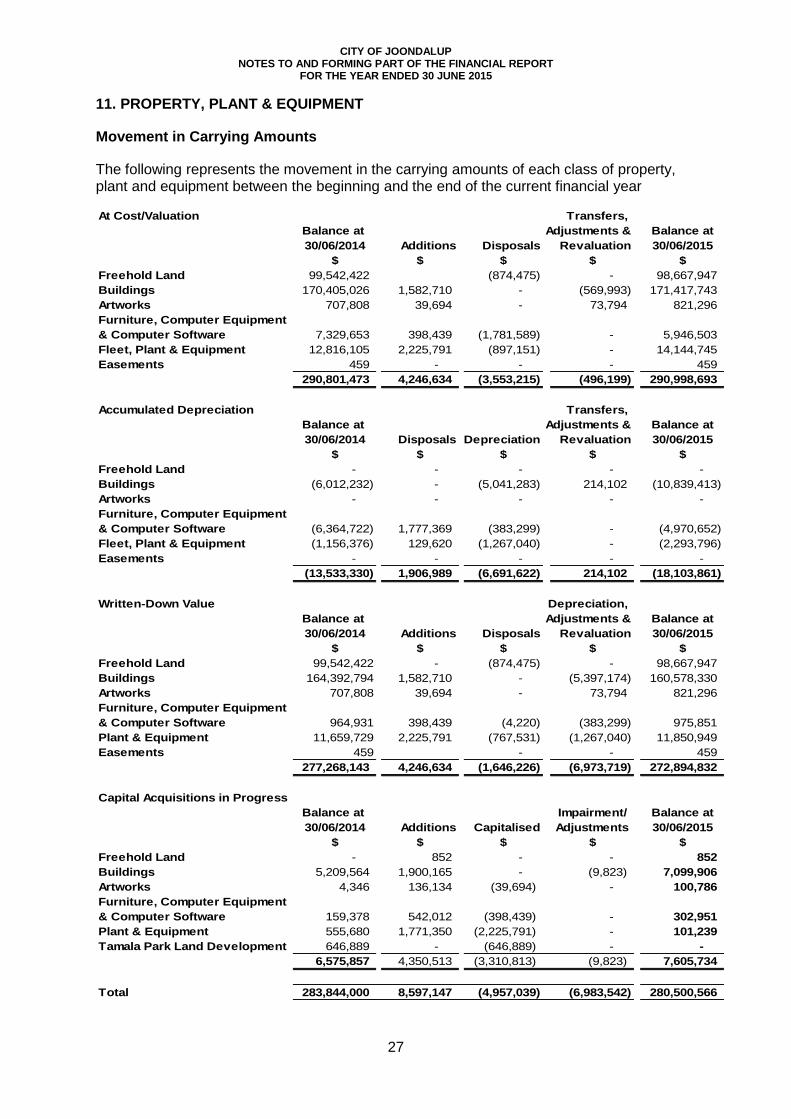
11. PROPERTY, PLANT & EQUIPMENT
Movement in Carrying Amounts
The following represents the movement in the carrying amounts of each class of property, plant and equipment between the beginning and the end of the current financial year
At Cost/Valuation Transfers,
Balance at Adjustments & Balance at
30/06/2014 Additions Disposals Revaluation 30/06/2015
$ $ $ $ $
Freehold Land 99,542,422 (874,475) - 98,667,947
Buildings 170,405,026 1,582,710 - (569,993) 171,417,743
Artworks 707,808 39,694 - 73,794 821,296
Furniture, Computer Equipment
& Computer Software 7,329,653 398,439 (1,781,589) - 5,946,503
Fleet, Plant & Equipment 12,816,105 2,225,791 (897,151) - 14,144,745
Easements 459 - - - 459
290,801,473 4,246,634 (3,553,215) (496,199) 290,998,693
Accumulated Depreciation Transfers,
Balance at Adjustments & Balance at
30/06/2014 Disposals Depreciation Revaluation 30/06/2015
$ $ $ $ $
Freehold Land - - - - -
Buildings (6,012,232) - (5,041,283) 214,102 (10,839,413)
Artworks - - - - -
Furniture, Computer Equipment
& Computer Software (6,364,722) 1,777,369 (383,299) - (4,970,652)
Fleet, Plant & Equipment (1,156,376) 129,620 (1,267,040) - (2,293,796)
Easements - - - - -
(13,533,330) 1,906,989 (6,691,622) 214,102 (18,103,861)
Written-Down Value Depreciation,
Balance at Adjustments & Balance at
30/06/2014 Additions Disposals Revaluation 30/06/2015
$ $ $ $ $
Freehold Land 99,542,422 - (874,475) - 98,667,947
Buildings 164,392,794 1,582,710 - (5,397,174) 160,578,330
Artworks 707,808 39,694 - 73,794 821,296
Furniture, Computer Equipment
& Computer Software 964,931 398,439 (4,220) (383,299) 975,851
Plant & Equipment 11,659,729 2,225,791 (767,531) (1,267,040) 11,850,949
Easements 459 - - 459
277,268,143 4,246,634 (1,646,226) (6,973,719) 272,894,832
Capital Acquisitions in Progress
Balance at Impairment/ Balance at
30/06/2014 Additions Capitalised Adjustments 30/06/2015
$ $ $ $ $
Freehold Land - 852 - - 852
Buildings 5,209,564 1,900,165 - (9,823) 7,099,906
Artworks 4,346 136,134 (39,694) - 100,786
Furniture, Computer Equipment
& Computer Software 159,378 542,012 (398,439) - 302,951
Plant & Equipment 555,680 1,771,350 (2,225,791) - 101,239
Tamala Park Land Development 646,889 - (646,889) - -
6,575,857 4,350,513 (3,310,813) (9,823) 7,605,734
Total 283,844,000 8,597,147 (4,957,039) (6,983,542) 280,500,566
CITY OF JOONDALUP NOTES TO AND FORMING PART OF THE FINANCIAL REPORT
FOR THE YEAR ENDED 30 JUNE 2015
28
Valuation of Property, Plant and Equipment:
As required by the Local Government (Financial Management) Regulation 1996, the City completed the first cycle of progressive revaluation of all property, plant and equipment to fair value during the reporting period.
AASB 13 Fair Value Measurement sets out the framework for measurement of fair value. This Standard requires fair value to be measured according to the following hierarchy.
Level 1: Quoted prices (unadjusted) in active markets for identical assets or liabilities
Level 2: Inputs other than quoted prices included within Level 1 that are observable for the asset or liability either directly or indirectly
Level 3: Inputs for the asset or liability that are not based on observable market data (unobservable inputs)
All of the City’s artworks were revalued during the reporting period. The valuation was done independently by a Government approved valuer following the industry standards for valuing artworks (using Level 2 or Level 3 inputs in the fair value measurement hierarchy). The valuation resulted in an increase of $73,794 which was transferred to the Artworks Revaluation Reserve.
During the reporting period, the City also revalued Furniture, Computer Equipment and Computer Software to fair value (using Level 3 inputs in the fair value measurement hierarchy). Fair value was determined to approximate depreciated historical cost (Written Down value) as there is no active market for these assets and the City utilises these asset types until they reach the end of their useful life and are then scrapped.
.
CITY OF JOONDALUP NOTES TO AND FORMING PART OF THE FINANCIAL REPORT
FOR THE YEAR ENDED 30 JUNE 2015
29
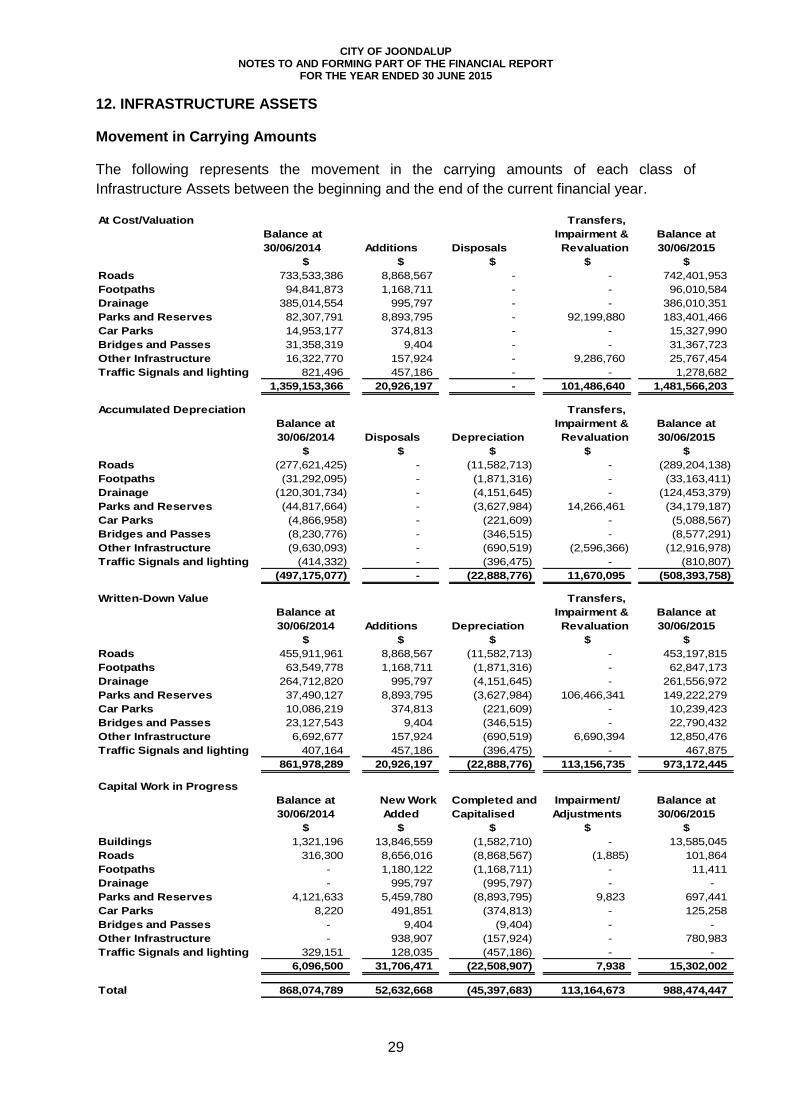
12. INFRASTRUCTURE ASSETS
Movement in Carrying Amounts
The following represents the movement in the carrying amounts of each class of
Infrastructure Assets between the beginning and the end of the current financial year.
At Cost/Valuation Transfers,
Balance at Impairment & Balance at
30/06/2014 Additions Disposals Revaluation 30/06/2015
$ $ $ $ $
Roads 733,533,386 8,868,567 - - 742,401,953
Footpaths 94,841,873 1,168,711 - - 96,010,584
Drainage 385,014,554 995,797 - - 386,010,351
Parks and Reserves 82,307,791 8,893,795 - 92,199,880 183,401,466
Car Parks 14,953,177 374,813 - - 15,327,990
Bridges and Passes 31,358,319 9,404 - - 31,367,723
Other Infrastructure 16,322,770 157,924 - 9,286,760 25,767,454
Traffic Signals and lighting 821,496 457,186 - - 1,278,682
1,359,153,366 20,926,197 - 101,486,640 1,481,566,203
Accumulated Depreciation Transfers,
Balance at Impairment & Balance at
30/06/2014 Disposals Depreciation Revaluation 30/06/2015
$ $ $ $ $
Roads (277,621,425) - (11,582,713) - (289,204,138)
Footpaths (31,292,095) - (1,871,316) - (33,163,411)
Drainage (120,301,734) - (4,151,645) - (124,453,379)
Parks and Reserves (44,817,664) - (3,627,984) 14,266,461 (34,179,187)
Car Parks (4,866,958) - (221,609) - (5,088,567)
Bridges and Passes (8,230,776) - (346,515) - (8,577,291)
Other Infrastructure (9,630,093) - (690,519) (2,596,366) (12,916,978)
Traffic Signals and lighting (414,332) - (396,475) - (810,807)
(497,175,077) - (22,888,776) 11,670,095 (508,393,758)
Written-Down Value Transfers,
Balance at Impairment & Balance at
30/06/2014 Additions Depreciation Revaluation 30/06/2015
$ $ $ $ $
Roads 455,911,961 8,868,567 (11,582,713) - 453,197,815
Footpaths 63,549,778 1,168,711 (1,871,316) - 62,847,173
Drainage 264,712,820 995,797 (4,151,645) - 261,556,972
Parks and Reserves 37,490,127 8,893,795 (3,627,984) 106,466,341 149,222,279
Car Parks 10,086,219 374,813 (221,609) - 10,239,423
Bridges and Passes 23,127,543 9,404 (346,515) - 22,790,432
Other Infrastructure 6,692,677 157,924 (690,519) 6,690,394 12,850,476
Traffic Signals and lighting 407,164 457,186 (396,475) - 467,875
861,978,289 20,926,197 (22,888,776) 113,156,735 973,172,445
Capital Work in Progress
Balance at New Work Completed and Impairment/ Balance at
30/06/2014 Added Capitalised Adjustments 30/06/2015
$ $ $ $ $
Buildings 1,321,196 13,846,559 (1,582,710) - 13,585,045
Roads 316,300 8,656,016 (8,868,567) (1,885) 101,864
Footpaths - 1,180,122 (1,168,711) - 11,411
Drainage - 995,797 (995,797) - -
Parks and Reserves 4,121,633 5,459,780 (8,893,795) 9,823 697,441
Car Parks 8,220 491,851 (374,813) - 125,258
Bridges and Passes - 9,404 (9,404) - -
Other Infrastructure - 938,907 (157,924) - 780,983
Traffic Signals and lighting 329,151 128,035 (457,186) - -
6,096,500 31,706,471 (22,508,907) 7,938 15,302,002
Total 868,074,789 52,632,668 (45,397,683) 113,164,673 988,474,447
CITY OF JOONDALUP NOTES TO AND FORMING PART OF THE FINANCIAL REPORT
FOR THE YEAR ENDED 30 JUNE 2015
30
Valuation of Infrastructure Assets:
As required by the Local Government (Financial Management) Regulations 1996, the City completed the first cycle of progressive revaluation of all its Infrastructure assets to fair value.
The City revalued its ‘Parks and Reserves’ and ‘Other Infrastructure’ assets during the reporting period. The revaluation of these infrastructure assets was conducted by Management using the technical expertise within the City’s Asset Management unit. No market based evidence was available for determining the fair value of these classes of assets because of their specialised nature. Fair value of these assets was arrived at based on their depreciated replacement cost. Management has used the unit rates of construction/replacement, age and condition of these assets as inputs (Level 2 and Level 3 in the fair value measurement hierarchy in Note 11) into its valuation methodology. The unit rates and valuation methodology were further reviewed independently by an external valuer to confirm that the unit rates and valuation methodology were appropriate and conformed to industry standards.
The revaluation resulted in an overall increase in net value of Parks and Reserves ($106,260,257), and Other Infrastructure assets ($6,540,587). The increase in net values has been credited directly to the Revaluation Reserve in Equity.
CITY OF JOONDALUP NOTES TO AND FORMING PART OF THE FINANCIAL REPORT
FOR THE YEAR ENDED 30 JUNE 2015
31
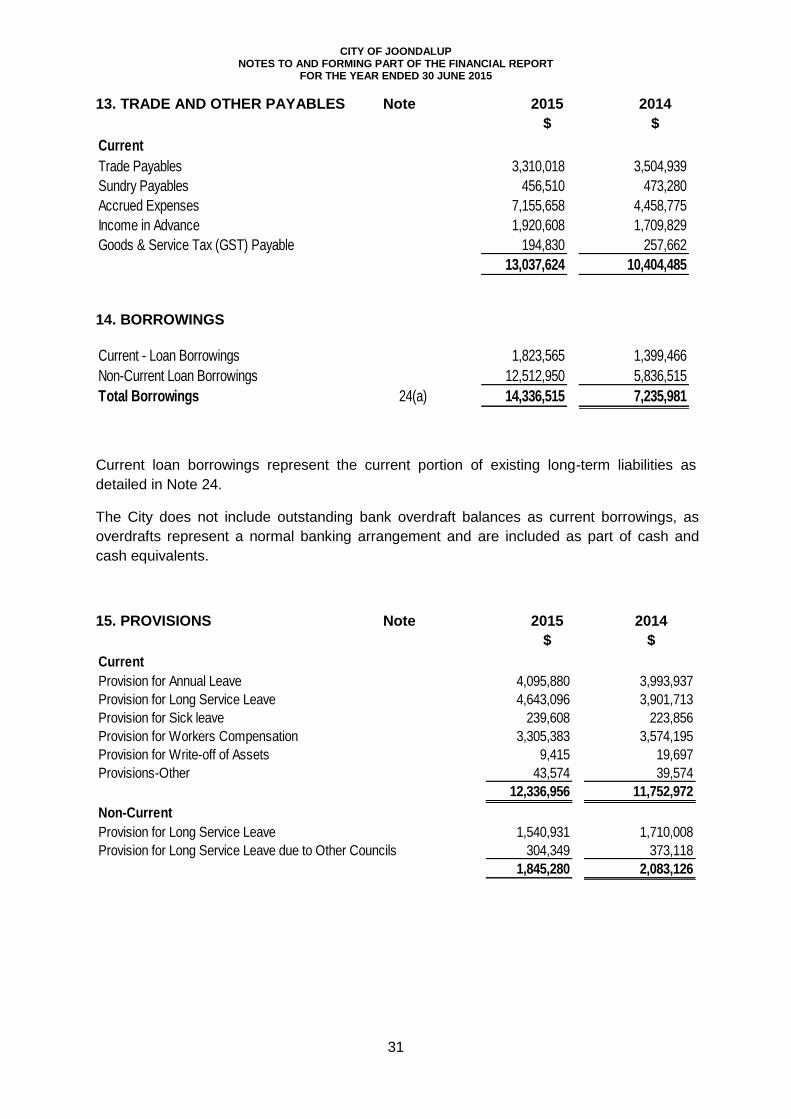
13. TRADE AND OTHER PAYABLES Note 2015 2014
$ $
Current
Trade Payables 3,310,018 3,504,939
Sundry Payables 456,510 473,280
Accrued Expenses 7,155,658 4,458,775
Income in Advance 1,920,608 1,709,829
Goods & Service Tax (GST) Payable 194,830 257,662
13,037,624 10,404,485
14. BORROWINGS
Current - Loan Borrowings 1,823,565 1,399,466
Non-Current Loan Borrowings 12,512,950 5,836,515
Total Borrowings 24(a) 14,336,515 7,235,981
Current loan borrowings represent the current portion of existing long-term liabilities as
detailed in Note 24.
The City does not include outstanding bank overdraft balances as current borrowings, as
overdrafts represent a normal banking arrangement and are included as part of cash and
cash equivalents.
15. PROVISIONS Note 2015 2014
$ $
Current
Provision for Annual Leave 4,095,880 3,993,937
Provision for Long Service Leave 4,643,096 3,901,713
Provision for Sick leave 239,608 223,856
Provision for Workers Compensation 3,305,383 3,574,195
Provision for Write-off of Assets 9,415 19,697
Provisions-Other 43,574 39,574
12,336,956 11,752,972
Non-Current
Provision for Long Service Leave 1,540,931 1,710,008
Provision for Long Service Leave due to Other Councils 304,349 373,118
1,845,280 2,083,126
CITY OF JOONDALUP NOTES TO AND FORMING PART OF THE FINANCIAL REPORT
FOR THE YEAR ENDED 30 JUNE 2015
32
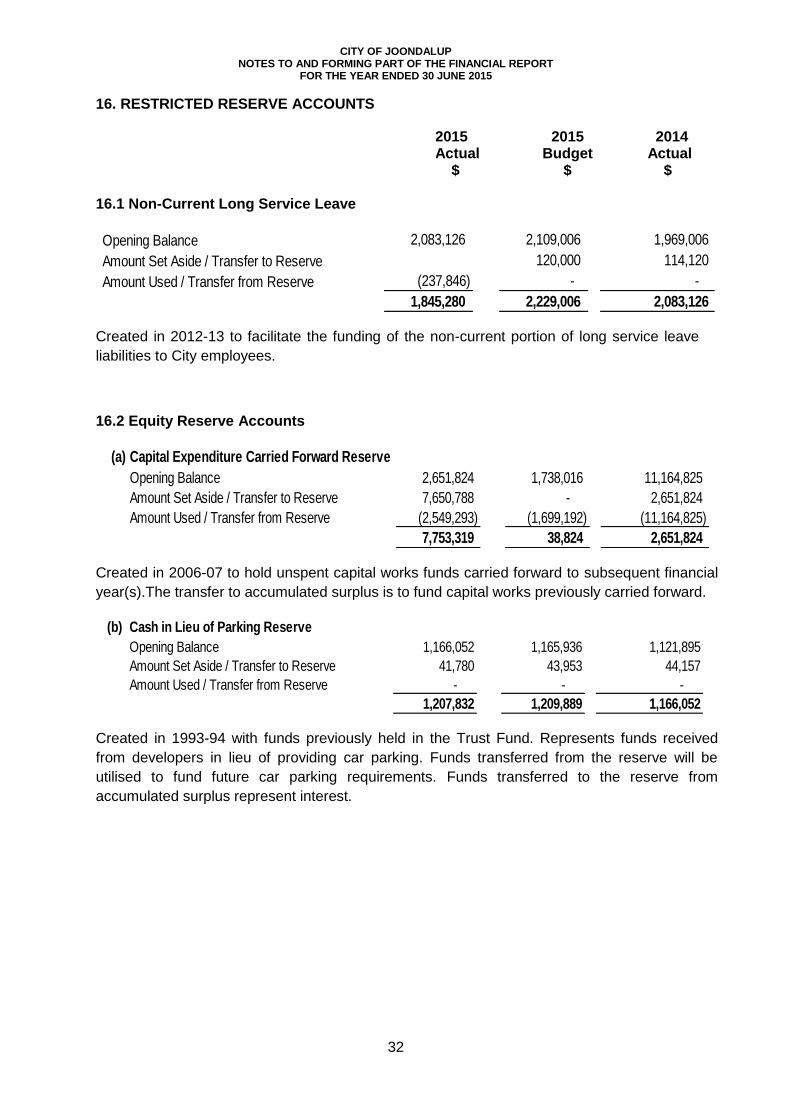
16. RESTRICTED RESERVE ACCOUNTS
2015 Actual $
2015 Budget
$
2014 Actual
$ 16.1 Non-Current Long Service Leave
Opening Balance 2,083,126 2,109,006 1,969,006
Amount Set Aside / Transfer to Reserve 120,000 114,120
Amount Used / Transfer from Reserve (237,846) - -
1,845,280 2,229,006 2,083,126
Created in 2012-13 to facilitate the funding of the non-current portion of long service leave
liabilities to City employees.
16.2 Equity Reserve Accounts
(a) Capital Expenditure Carried Forward Reserve
Opening Balance 2,651,824 1,738,016 11,164,825
Amount Set Aside / Transfer to Reserve 7,650,788 - 2,651,824
Amount Used / Transfer from Reserve (2,549,293) (1,699,192) (11,164,825)
7,753,319 38,824 2,651,824
Created in 2006-07 to hold unspent capital works funds carried forward to subsequent financial
year(s).The transfer to accumulated surplus is to fund capital works previously carried forward.
(b) Cash in Lieu of Parking Reserve
Opening Balance 1,166,052 1,165,936 1,121,895
Amount Set Aside / Transfer to Reserve 41,780 43,953 44,157
Amount Used / Transfer from Reserve - - -
1,207,832 1,209,889 1,166,052
Created in 1993-94 with funds previously held in the Trust Fund. Represents funds received
from developers in lieu of providing car parking. Funds transferred from the reserve will be
utilised to fund future car parking requirements. Funds transferred to the reserve from
accumulated surplus represent interest.

CITY OF JOONDALUP NOTES TO AND FORMING PART OF THE FINANCIAL REPORT
FOR THE YEAR ENDED 30 JUNE 2015
33
16. RESTRICTED RESERVE ACCOUNTS (Continued)
2015 Actual $
2015 Budget
$
2014 Actual
$
(c)
Opening Balance 646,740 646,676 622,249
Amount Set Aside / Transfer to Reserve - 24,377 24,491
Amount Used / Transfer from Reserve (646,740) - -
- 671,053 646,740
Cash in Lieu of City Centre Parking Reserve
Renamed in 2010-11 with an updated purpose. The reserve is to hold funds received from
developers as cash in lieu of providing car parking for developments within the Joondalup City
Centre, and is to be used to fund future car parking requirements in the City Centre. Transfer
to accumulated surplus is for funding the construction of Reid Promenade Car Park.
(d)
Opening Balance 11,084,101 11,045,138 10,776,224
Amount Set Aside / Transfer to Reserve 394,443 3,811,175 421,904
Amount Used / Transfer from Reserve (151,106) (905,485) (114,027)
11,327,438 13,950,828 11,084,101
Joondalup Performing Arts and Cultural Facility Reserve
Created in 2000-01 to assist with the design and development of a regional performing arts
facility in the Joondalup City Centre. The reserve was renamed in 2009-10 to more
appropriately reflect the intent of this project for a multi-purpose cultural facility. Transfer from
accumulated surplus represents interest.
(e) Marmion Car Park Reserve
Opening Balance 1,890,598 1,723,904 -
Amount Set Aside / Transfer to Reserve 65,645 46,138 1,890,598
Amount Used / Transfer from Reserve (117,038) (1,000,000) -
1,839,205 770,042 1,890,598
Created in 2013-14 to hold the State Government’s contribution and the unspent portion of City
of Joondalup funds for the future construction of a car park next to the Marmion Angling and
Aquatic Club. The transfer from accumulated surplus represents interest and the transfer to
accumulated surplus is to fund the car park construction project.
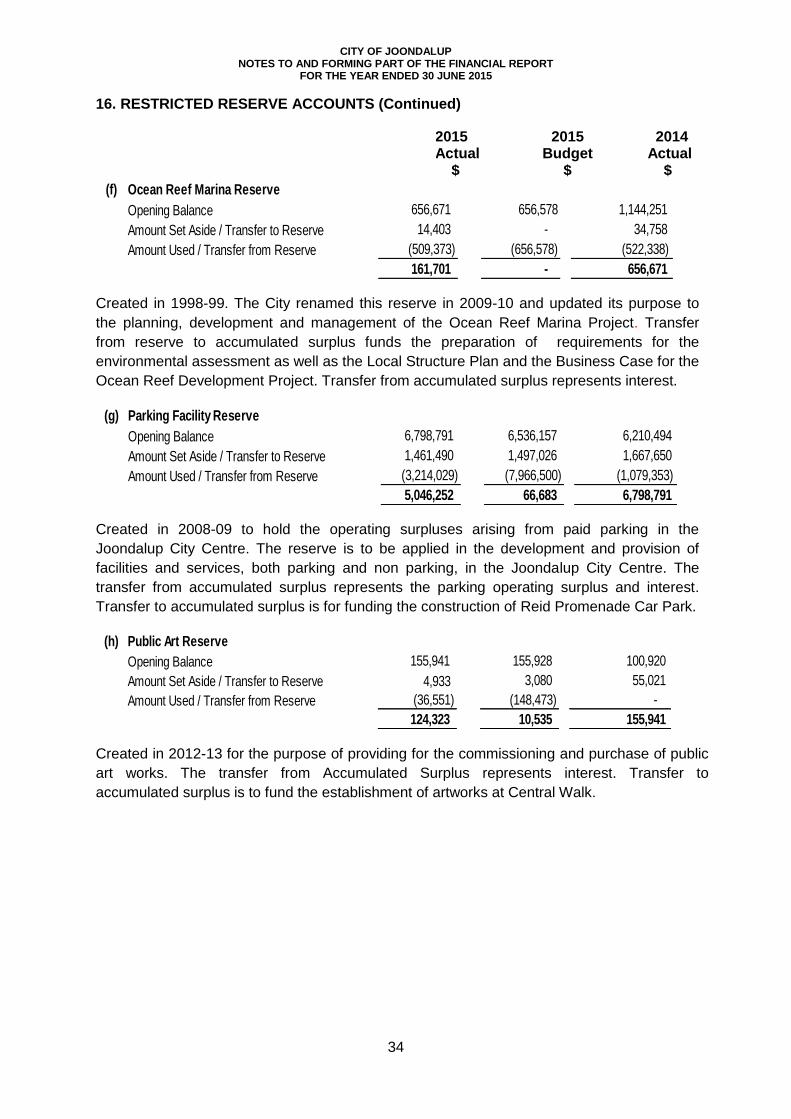
CITY OF JOONDALUP NOTES TO AND FORMING PART OF THE FINANCIAL REPORT
FOR THE YEAR ENDED 30 JUNE 2015
34
16. RESTRICTED RESERVE ACCOUNTS (Continued)
2015 Actual $
2015 Budget
$
2014 Actual
$
(f) Ocean Reef Marina Reserve
Opening Balance 656,671 656,578 1,144,251
Amount Set Aside / Transfer to Reserve 14,403 - 34,758
Amount Used / Transfer from Reserve (509,373) (656,578) (522,338)
161,701 - 656,671
Created in 1998-99. The City renamed this reserve in 2009-10 and updated its purpose to
the planning, development and management of the Ocean Reef Marina Project. Transfer
from reserve to accumulated surplus funds the preparation of requirements for the
environmental assessment as well as the Local Structure Plan and the Business Case for the
Ocean Reef Development Project. Transfer from accumulated surplus represents interest.
(g) Parking Facility Reserve
Opening Balance 6,798,791 6,536,157 6,210,494
Amount Set Aside / Transfer to Reserve 1,461,490 1,497,026 1,667,650
Amount Used / Transfer from Reserve (3,214,029) (7,966,500) (1,079,353)
5,046,252 66,683 6,798,791
Created in 2008-09 to hold the operating surpluses arising from paid parking in the
Joondalup City Centre. The reserve is to be applied in the development and provision of
facilities and services, both parking and non parking, in the Joondalup City Centre. The
transfer from accumulated surplus represents the parking operating surplus and interest.
Transfer to accumulated surplus is for funding the construction of Reid Promenade Car Park.
(h) Public Art Reserve
Opening Balance 155,941 155,928 100,920
Amount Set Aside / Transfer to Reserve 4,933 3,080 55,021
Amount Used / Transfer from Reserve (36,551) (148,473) -
124,323 10,535 155,941
Created in 2012-13 for the purpose of providing for the commissioning and purchase of public
art works. The transfer from Accumulated Surplus represents interest. Transfer to
accumulated surplus is to fund the establishment of artworks at Central Walk.
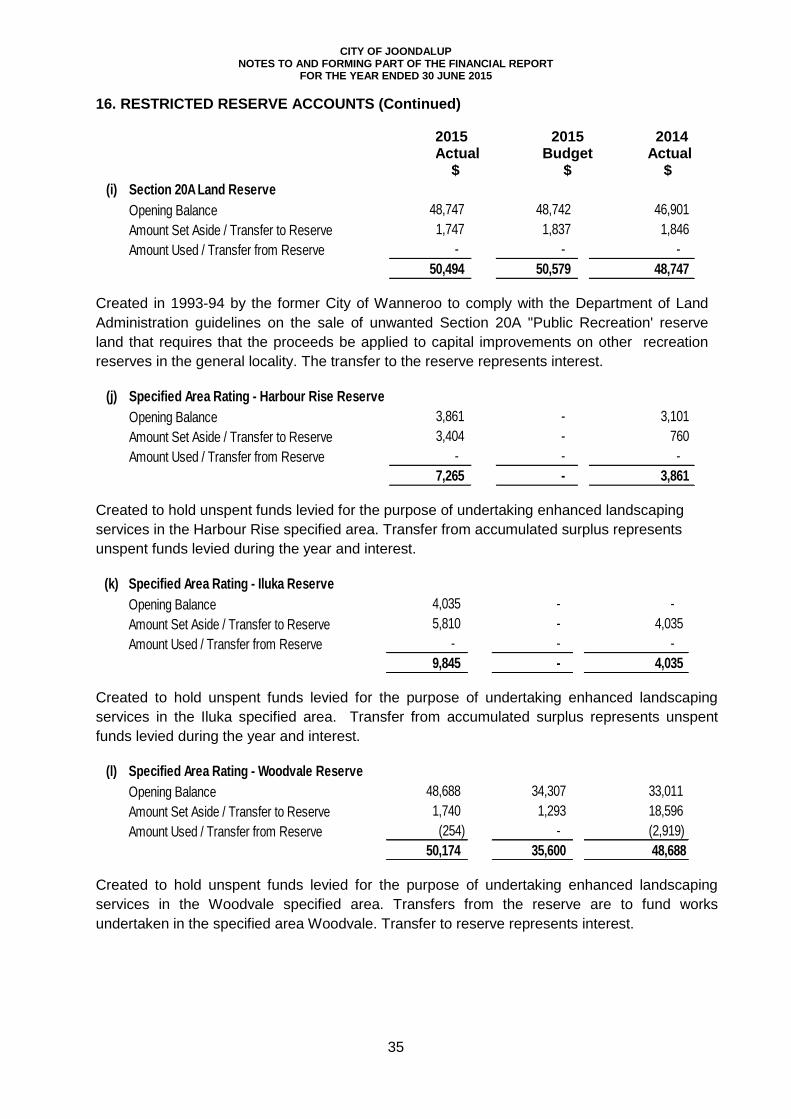
CITY OF JOONDALUP NOTES TO AND FORMING PART OF THE FINANCIAL REPORT
FOR THE YEAR ENDED 30 JUNE 2015
35
16. RESTRICTED RESERVE ACCOUNTS (Continued)
2015 Actual $
2015 Budget
$
2014 Actual
$
(i) Section 20A Land Reserve
Opening Balance 48,747 48,742 46,901
Amount Set Aside / Transfer to Reserve 1,747 1,837 1,846
Amount Used / Transfer from Reserve - - -
50,494 50,579 48,747
Created in 1993-94 by the former City of Wanneroo to comply with the Department of Land
Administration guidelines on the sale of unwanted Section 20A "Public Recreation' reserve
land that requires that the proceeds be applied to capital improvements on other recreation
reserves in the general locality. The transfer to the reserve represents interest.
(j) Specified Area Rating - Harbour Rise Reserve
Opening Balance 3,861 - 3,101
Amount Set Aside / Transfer to Reserve 3,404 - 760
Amount Used / Transfer from Reserve - - -
7,265 - 3,861
Created to hold unspent funds levied for the purpose of undertaking enhanced landscaping
services in the Harbour Rise specified area. Transfer from accumulated surplus represents
unspent funds levied during the year and interest.
(k) Specified Area Rating - Iluka Reserve
Opening Balance 4,035 - -
Amount Set Aside / Transfer to Reserve 5,810 - 4,035
Amount Used / Transfer from Reserve - - -
9,845 - 4,035
Created to hold unspent funds levied for the purpose of undertaking enhanced landscaping
services in the Iluka specified area. Transfer from accumulated surplus represents unspent
funds levied during the year and interest.
(l) Specified Area Rating - Woodvale Reserve
Opening Balance 48,688 34,307 33,011
Amount Set Aside / Transfer to Reserve 1,740 1,293 18,596
Amount Used / Transfer from Reserve (254) - (2,919)
50,174 35,600 48,688
Created to hold unspent funds levied for the purpose of undertaking enhanced landscaping
services in the Woodvale specified area. Transfers from the reserve are to fund works
undertaken in the specified area Woodvale. Transfer to reserve represents interest.
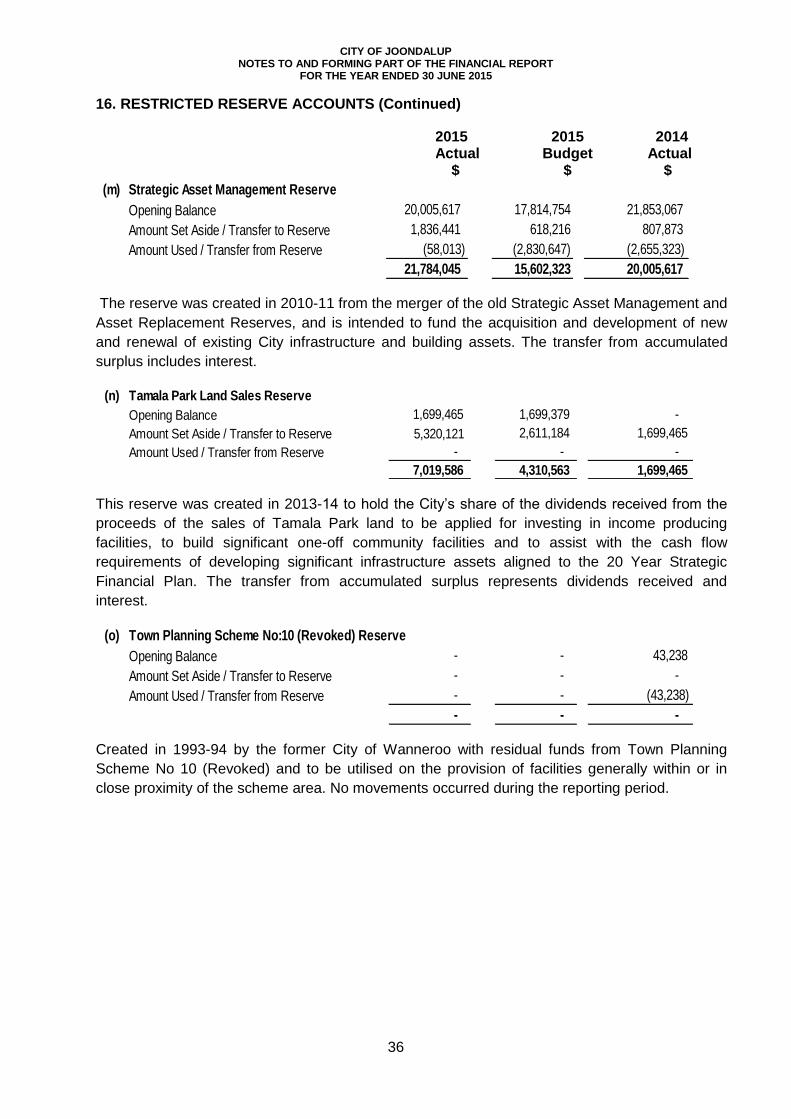
CITY OF JOONDALUP NOTES TO AND FORMING PART OF THE FINANCIAL REPORT
FOR THE YEAR ENDED 30 JUNE 2015
36
16. RESTRICTED RESERVE ACCOUNTS (Continued)
2015 Actual $
2015 Budget
$
2014 Actual
$
(m) Strategic Asset Management Reserve
Opening Balance 20,005,617 17,814,754 21,853,067
Amount Set Aside / Transfer to Reserve 1,836,441 618,216 807,873
Amount Used / Transfer from Reserve (58,013) (2,830,647) (2,655,323)
21,784,045 15,602,323 20,005,617
The reserve was created in 2010-11 from the merger of the old Strategic Asset Management and
Asset Replacement Reserves, and is intended to fund the acquisition and development of new
and renewal of existing City infrastructure and building assets. The transfer from accumulated
surplus includes interest.
(n) Tamala Park Land Sales Reserve
Opening Balance 1,699,465 1,699,379 -
Amount Set Aside / Transfer to Reserve 5,320,121 2,611,184 1,699,465
Amount Used / Transfer from Reserve - - -
7,019,586 4,310,563 1,699,465
This reserve was created in 2013-14 to hold the City’s share of the dividends received from the
proceeds of the sales of Tamala Park land to be applied for investing in income producing
facilities, to build significant one-off community facilities and to assist with the cash flow
requirements of developing significant infrastructure assets aligned to the 20 Year Strategic
Financial Plan. The transfer from accumulated surplus represents dividends received and
interest.
(o) Town Planning Scheme No:10 (Revoked) Reserve
Opening Balance - - 43,238
Amount Set Aside / Transfer to Reserve - - -
Amount Used / Transfer from Reserve - - (43,238)
- - -
Created in 1993-94 by the former City of Wanneroo with residual funds from Town Planning
Scheme No 10 (Revoked) and to be utilised on the provision of facilities generally within or in
close proximity of the scheme area. No movements occurred during the reporting period.
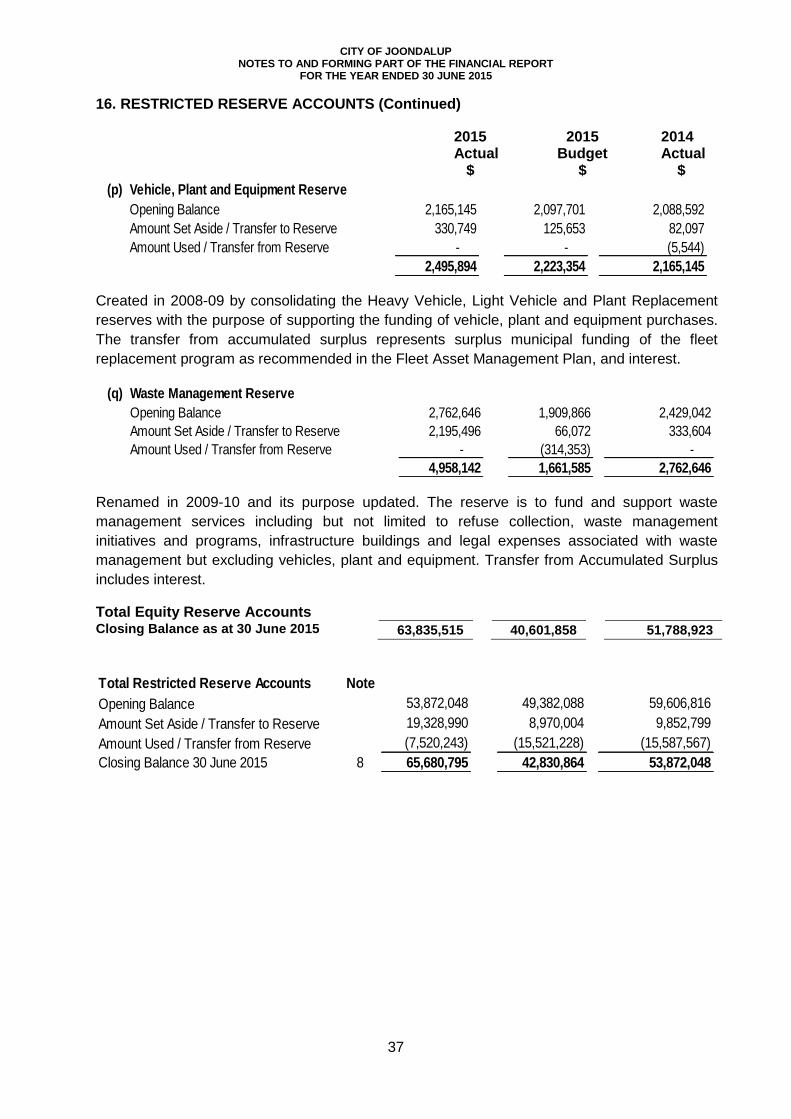
CITY OF JOONDALUP NOTES TO AND FORMING PART OF THE FINANCIAL REPORT
FOR THE YEAR ENDED 30 JUNE 2015
37
16. RESTRICTED RESERVE ACCOUNTS (Continued)
2015 Actual $
2015 Budget
$
2014 Actual
$
(p) Vehicle, Plant and Equipment Reserve
Opening Balance 2,165,145 2,097,701 2,088,592
Amount Set Aside / Transfer to Reserve 330,749 125,653 82,097
Amount Used / Transfer from Reserve - - (5,544)
2,495,894 2,223,354 2,165,145
Created in 2008-09 by consolidating the Heavy Vehicle, Light Vehicle and Plant Replacement
reserves with the purpose of supporting the funding of vehicle, plant and equipment purchases.
The transfer from accumulated surplus represents surplus municipal funding of the fleet
replacement program as recommended in the Fleet Asset Management Plan, and interest.
(q) Waste Management Reserve
Opening Balance 2,762,646 1,909,866 2,429,042
Amount Set Aside / Transfer to Reserve 2,195,496 66,072 333,604
Amount Used / Transfer from Reserve - (314,353) -
4,958,142 1,661,585 2,762,646
Renamed in 2009-10 and its purpose updated. The reserve is to fund and support waste
management services including but not limited to refuse collection, waste management
initiatives and programs, infrastructure buildings and legal expenses associated with waste
management but excluding vehicles, plant and equipment. Transfer from Accumulated Surplus
includes interest.
Total Equity Reserve Accounts Closing Balance as at 30 June 2015 63,835,515 40,601,858 51,788,923
Total Restricted Reserve Accounts Note
Opening Balance 53,872,048 49,382,088 59,606,816
Amount Set Aside / Transfer to Reserve 19,328,990 8,970,004 9,852,799
Amount Used / Transfer from Reserve (7,520,243) (15,521,228) (15,587,567)
Closing Balance 30 June 2015 8 65,680,795 42,830,864 53,872,048
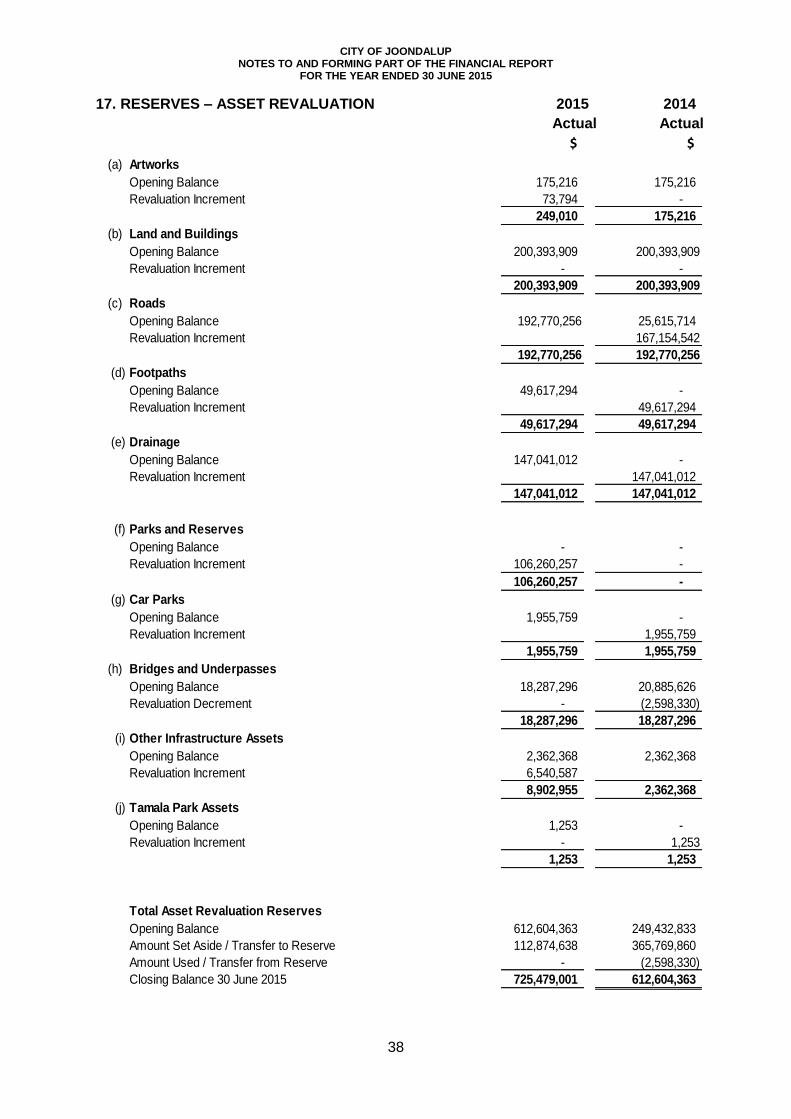
CITY OF JOONDALUP NOTES TO AND FORMING PART OF THE FINANCIAL REPORT
FOR THE YEAR ENDED 30 JUNE 2015
38
17. RESERVES – ASSET REVALUATION 2015 2014
Actual Actual
$ $
(a) Artworks
Opening Balance 175,216 175,216
Revaluation Increment 73,794 -
249,010 175,216
(b) Land and Buildings
Opening Balance 200,393,909 200,393,909
Revaluation Increment - -
200,393,909 200,393,909
(c) Roads
Opening Balance 192,770,256 25,615,714
Revaluation Increment 167,154,542
192,770,256 192,770,256
(d) Footpaths
Opening Balance 49,617,294 -
Revaluation Increment 49,617,294
49,617,294 49,617,294
(e) Drainage
Opening Balance 147,041,012 -
Revaluation Increment 147,041,012
147,041,012 147,041,012
(f) Parks and Reserves
Opening Balance - -
Revaluation Increment 106,260,257 -
106,260,257 -
(g) Car Parks
Opening Balance 1,955,759 -
Revaluation Increment 1,955,759
1,955,759 1,955,759
(h) Bridges and Underpasses
Opening Balance 18,287,296 20,885,626
Revaluation Decrement - (2,598,330)
18,287,296 18,287,296
(i) Other Infrastructure Assets
Opening Balance 2,362,368 2,362,368
Revaluation Increment 6,540,587
8,902,955 2,362,368
(j) Tamala Park Assets
Opening Balance 1,253 -
Revaluation Increment - 1,253
1,253 1,253
Total Asset Revaluation Reserves
Opening Balance 612,604,363 249,432,833
Amount Set Aside / Transfer to Reserve 112,874,638 365,769,860
Amount Used / Transfer from Reserve - (2,598,330)
Closing Balance 30 June 2015 725,479,001 612,604,363
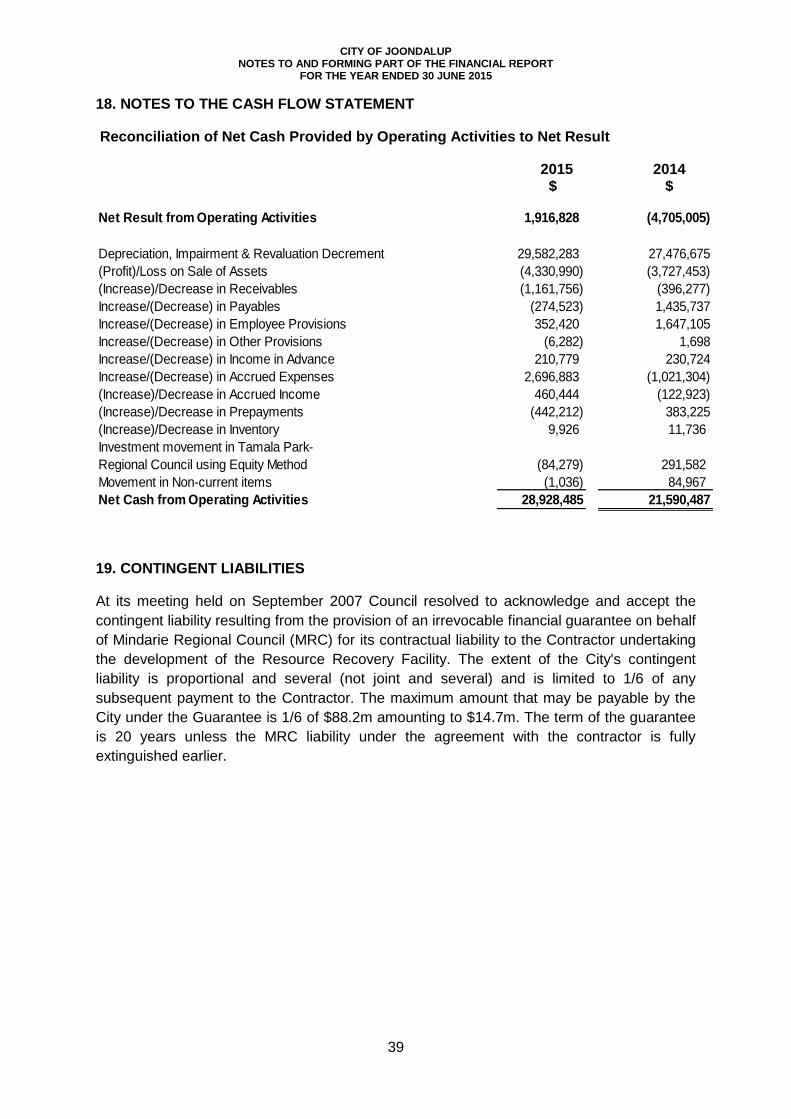
CITY OF JOONDALUP NOTES TO AND FORMING PART OF THE FINANCIAL REPORT
FOR THE YEAR ENDED 30 JUNE 2015
39
18. NOTES TO THE CASH FLOW STATEMENT
Reconciliation of Net Cash Provided by Operating Activities to Net Result
2015 $
2014 $
Net Result from Operating Activities 1,916,828 (4,705,005)
Depreciation, Impairment & Revaluation Decrement 29,582,283 27,476,675
(Profit)/Loss on Sale of Assets (4,330,990) (3,727,453)
(Increase)/Decrease in Receivables (1,161,756) (396,277)
Increase/(Decrease) in Payables (274,523) 1,435,737
Increase/(Decrease) in Employee Provisions 352,420 1,647,105
Increase/(Decrease) in Other Provisions (6,282) 1,698
Increase/(Decrease) in Income in Advance 210,779 230,724
Increase/(Decrease) in Accrued Expenses 2,696,883 (1,021,304)
(Increase)/Decrease in Accrued Income 460,444 (122,923)
(Increase)/Decrease in Prepayments (442,212) 383,225
(Increase)/Decrease in Inventory 9,926 11,736
(84,279) 291,582
Movement in Non-current items (1,036) 84,967
Net Cash from Operating Activities 28,928,485 21,590,487
Investment movement in Tamala Park-
Regional Council using Equity Method
19. CONTINGENT LIABILITIES
At its meeting held on September 2007 Council resolved to acknowledge and accept the
contingent liability resulting from the provision of an irrevocable financial guarantee on behalf
of Mindarie Regional Council (MRC) for its contractual liability to the Contractor undertaking
the development of the Resource Recovery Facility. The extent of the City's contingent
liability is proportional and several (not joint and several) and is limited to 1/6 of any
subsequent payment to the Contractor. The maximum amount that may be payable by the
City under the Guarantee is 1/6 of $88.2m amounting to $14.7m. The term of the guarantee
is 20 years unless the MRC liability under the agreement with the contractor is fully
extinguished earlier.
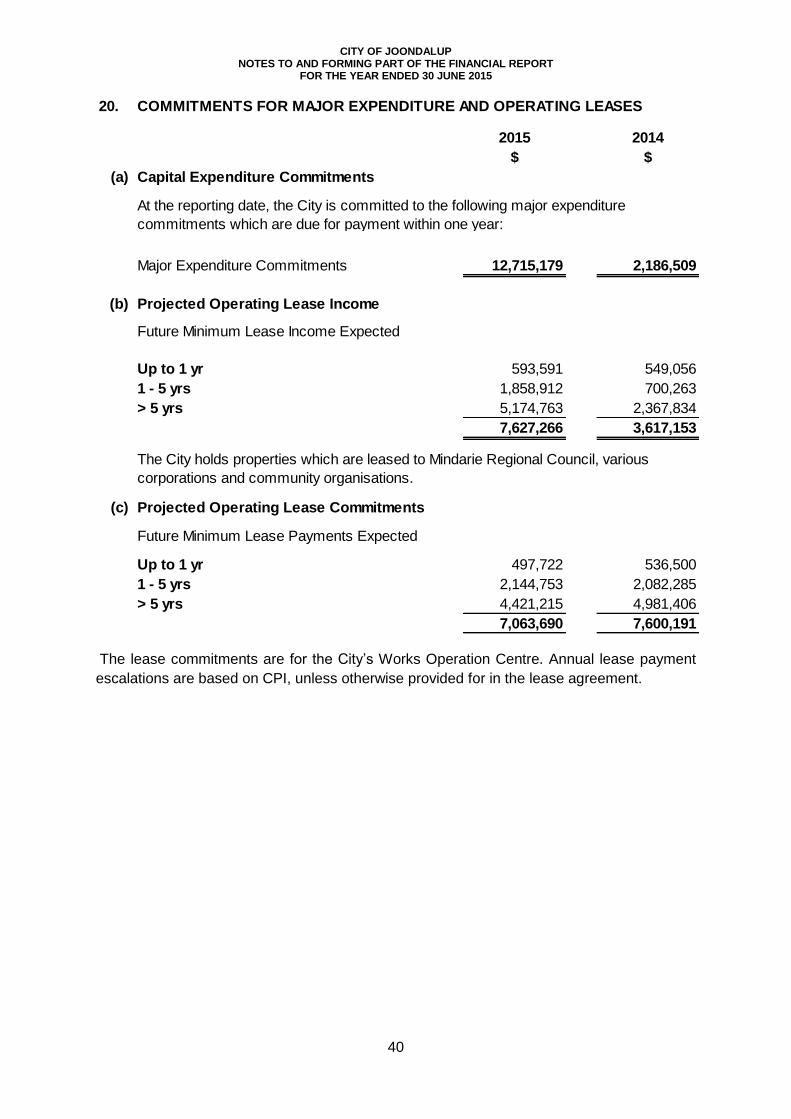
CITY OF JOONDALUP NOTES TO AND FORMING PART OF THE FINANCIAL REPORT
FOR THE YEAR ENDED 30 JUNE 2015
40
20. COMMITMENTS FOR MAJOR EXPENDITURE AND OPERATING LEASES
2015 2014
$ $
(a) Capital Expenditure Commitments
Major Expenditure Commitments 12,715,179 2,186,509
(b) Projected Operating Lease Income
Future Minimum Lease Income Expected
Up to 1 yr 593,591 549,056
1 - 5 yrs 1,858,912 700,263
> 5 yrs 5,174,763 2,367,834
7,627,266 3,617,153
(c) Projected Operating Lease Commitments
Future Minimum Lease Payments Expected
Up to 1 yr 497,722 536,500
1 - 5 yrs 2,144,753 2,082,285
> 5 yrs 4,421,215 4,981,406
7,063,690 7,600,191
At the reporting date, the City is committed to the following major expenditure
commitments which are due for payment within one year:
The City holds properties which are leased to Mindarie Regional Council, various
corporations and community organisations.
The lease commitments are for the City’s Works Operation Centre. Annual lease payment
escalations are based on CPI, unless otherwise provided for in the lease agreement.
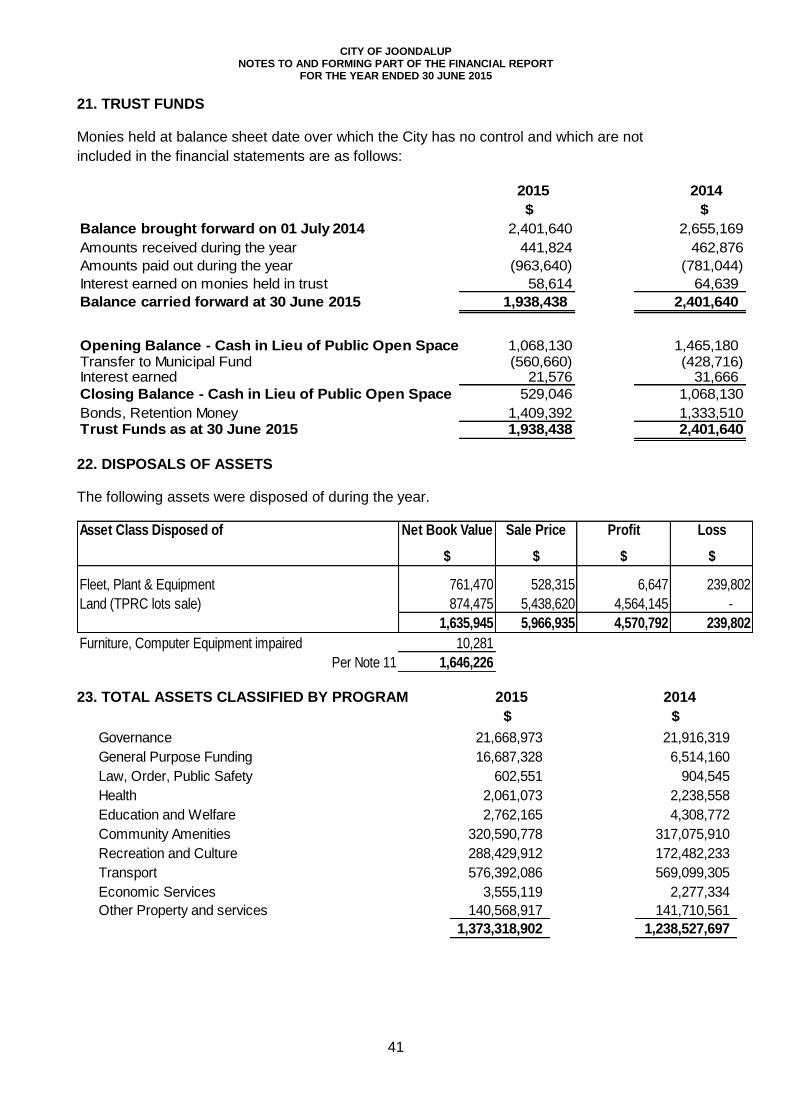
CITY OF JOONDALUP NOTES TO AND FORMING PART OF THE FINANCIAL REPORT
FOR THE YEAR ENDED 30 JUNE 2015
41
21. TRUST FUNDS
Monies held at balance sheet date over which the City has no control and which are not
included in the financial statements are as follows:
2015 2014
$ $
Balance brought forward on 01 July 2014 2,401,640 2,655,169
Amounts received during the year 441,824 462,876
Amounts paid out during the year (963,640) (781,044)
Interest earned on monies held in trust 58,614 64,639
Balance carried forward at 30 June 2015 1,938,438 2,401,640
Opening Balance - Cash in Lieu of Public Open Space 1,068,130 1,465,180 Transfer to Municipal Fund (560,660) (428,716) Interest earned 21,576 31,666
Closing Balance - Cash in Lieu of Public Open Space 529,046 1,068,130
Bonds, Retention Money 1,409,392 1,333,510Trust Funds as at 30 June 2015 1,938,438 2,401,640
22. DISPOSALS OF ASSETS
The following assets were disposed of during the year.
Net Book Value Sale Price Profit Loss
$ $ $ $
761,470 528,315 6,647 239,802
874,475 5,438,620 4,564,145 -
1,635,945 5,966,935 4,570,792 239,802
Furniture, Computer Equipment impaired 10,281
Per Note 11 1,646,226
Asset Class Disposed of
Fleet, Plant & Equipment
Land (TPRC lots sale)
23. TOTAL ASSETS CLASSIFIED BY PROGRAM 2015 2014
$ $
Governance 21,668,973 21,916,319
General Purpose Funding 16,687,328 6,514,160
Law, Order, Public Safety 602,551 904,545
Health 2,061,073 2,238,558
Education and Welfare 2,762,165 4,308,772
Community Amenities 320,590,778 317,075,910
Recreation and Culture 288,429,912 172,482,233
Transport 576,392,086 569,099,305
Economic Services 3,555,119 2,277,334
Other Property and services 140,568,917 141,710,561
1,373,318,902 1,238,527,697

CITY OF JOONDALUP NOTES TO AND FORMING PART OF THE FINANCIAL REPORT
FOR THE YEAR ENDED 30 JUNE 2015
42
24. INFORMATION ON BORROWINGS
(a) Loan Repayments
Balance Balance
1-Jul-14 30-Jun-15
Craigie Leisure Centre 2004-05 383,320 - 12,995 (383,320) -
Sorrento Beach 2005-06 224,818 - 10,033 (109,091) 115,727
Aquatic Facilities Upgrade 2009-10 3,875,050 - 216,334 (555,531) 3,319,519
Streetscape Enhancement –
West Coast Drive2009-10 591,279 - 32,806 (84,766) 506,513
Seacreast Sports Facility 2010-11 621,930 - 36,807 (76,754) 545,176
Forrest Park Sports Facility 2010-11 409,165 - 24,215 (50,496) 358,669
Fleur Frame Pavilion Upgrade 2010-11 1,130,419 - 66,900 (139,508) 990,911
Multi-storey Car Park 2014-15 - 8,500,000 55,238 - 8,500,000
Total 7,235,981 8,500,000 455,328 (1,399,466) 14,336,515
Purpose of LoanYear
Drawn
New Loans Interest
Expense
Principal
Repayment
(b) Overdraft 2015 2014
$ $
Bank Overdraft Facility Limit 500,000 500,000
Bank Overdraft at Reporting Date - -
Credit Amount Unused 500,000 500,000
The bank overdraft is disclosed as part of cash and cash equivalents as the overdraft facility forms
part of the City’s regular banking arrangements. The balances above represent the overdraft in the
City’s financial records and not the actual balance of funds held with the bank at the reporting date,
due to timing differences in payments and receipts recorded.
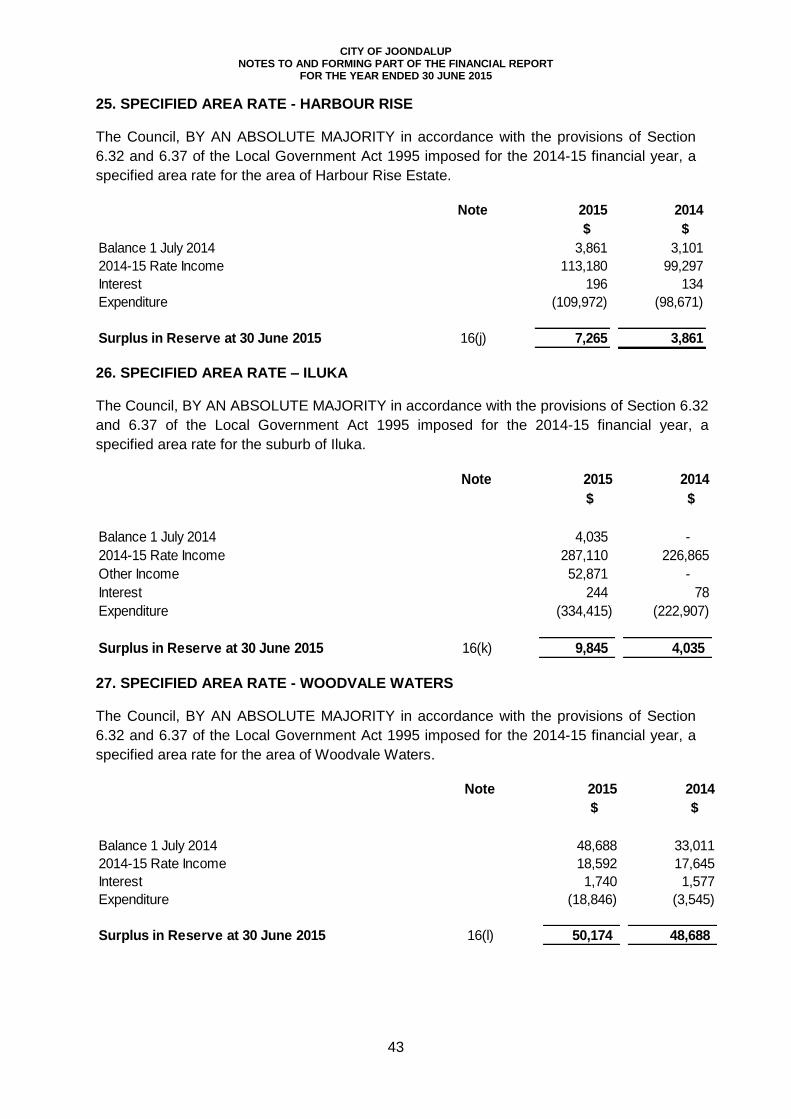
CITY OF JOONDALUP NOTES TO AND FORMING PART OF THE FINANCIAL REPORT
FOR THE YEAR ENDED 30 JUNE 2015
43
25. SPECIFIED AREA RATE - HARBOUR RISE
The Council, BY AN ABSOLUTE MAJORITY in accordance with the provisions of Section
6.32 and 6.37 of the Local Government Act 1995 imposed for the 2014-15 financial year, a
specified area rate for the area of Harbour Rise Estate.
Note 2015 2014
$ $
Balance 1 July 2014 3,861 3,101
2014-15 Rate Income 113,180 99,297
Interest 196 134
Expenditure (109,972) (98,671)
Surplus in Reserve at 30 June 2015 16(j) 7,265 3,861
26. SPECIFIED AREA RATE – ILUKA
The Council, BY AN ABSOLUTE MAJORITY in accordance with the provisions of Section 6.32
and 6.37 of the Local Government Act 1995 imposed for the 2014-15 financial year, a
specified area rate for the suburb of Iluka.
Note 2015 2014
$ $
Balance 1 July 2014 4,035 -
2014-15 Rate Income 287,110 226,865
Other Income 52,871 -
Interest 244 78
Expenditure (334,415) (222,907)
Surplus in Reserve at 30 June 2015 16(k) 9,845 4,035
27. SPECIFIED AREA RATE - WOODVALE WATERS
The Council, BY AN ABSOLUTE MAJORITY in accordance with the provisions of Section
6.32 and 6.37 of the Local Government Act 1995 imposed for the 2014-15 financial year, a
specified area rate for the area of Woodvale Waters.
Note 2015 2014
$ $
Balance 1 July 2014 48,688 33,011
2014-15 Rate Income 18,592 17,645
Interest 1,740 1,577
Expenditure (18,846) (3,545)
Surplus in Reserve at 30 June 2015 16(l) 50,174 48,688
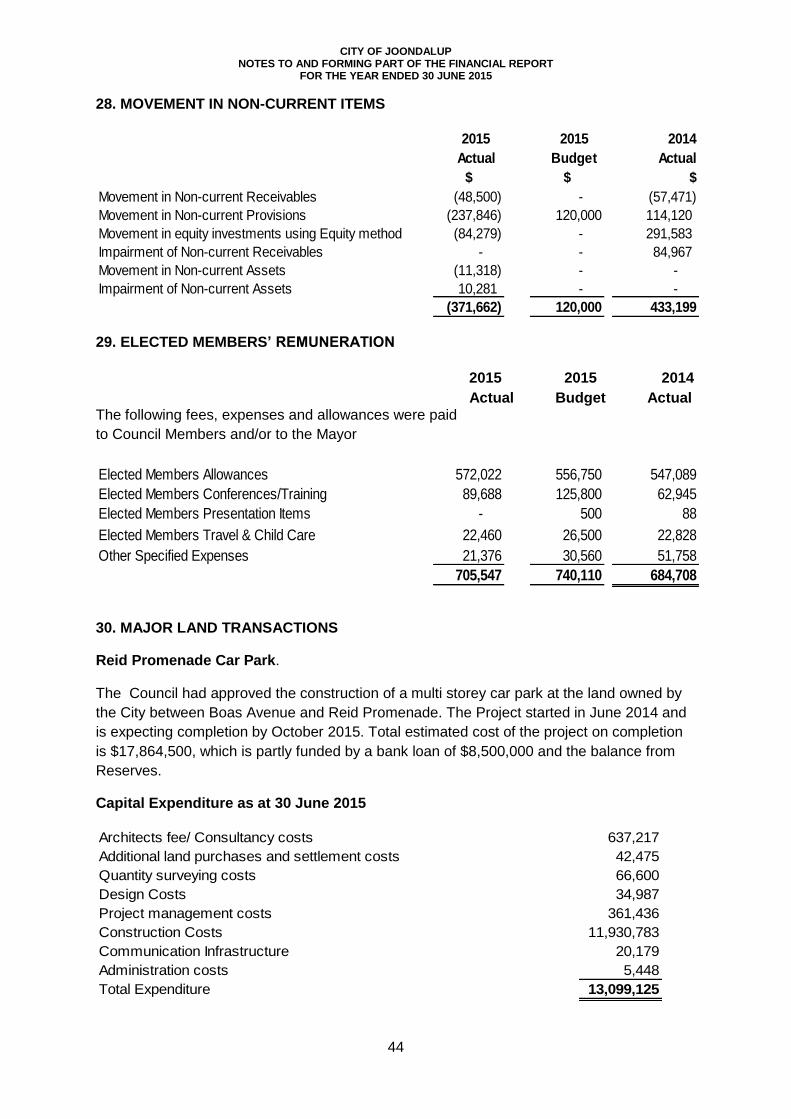
CITY OF JOONDALUP NOTES TO AND FORMING PART OF THE FINANCIAL REPORT
FOR THE YEAR ENDED 30 JUNE 2015
44
28. MOVEMENT IN NON-CURRENT ITEMS
2015 2015 2014
Actual Budget Actual
$ $ $
Movement in Non-current Receivables (48,500) - (57,471)
Movement in Non-current Provisions (237,846) 120,000 114,120
Movement in equity investments using Equity method (84,279) - 291,583
Impairment of Non-current Receivables - - 84,967
Movement in Non-current Assets (11,318) - -
Impairment of Non-current Assets 10,281 - -
(371,662) 120,000 433,199
29. ELECTED MEMBERS’ REMUNERATION
2015
2015
2014
Actual
Budget
Actual
The following fees, expenses and allowances were paid
to Council Members and/or to the Mayor
Elected Members Allowances 572,022 556,750 547,089
Elected Members Conferences/Training 89,688 125,800 62,945
Elected Members Presentation Items - 500 88
Elected Members Travel & Child Care 22,460 26,500 22,828
Other Specified Expenses 21,376 30,560 51,758
705,547 740,110 684,708
30. MAJOR LAND TRANSACTIONS
Reid Promenade Car Park.
The Council had approved the construction of a multi storey car park at the land owned by
the City between Boas Avenue and Reid Promenade. The Project started in June 2014 and
is expecting completion by October 2015. Total estimated cost of the project on completion
is $17,864,500, which is partly funded by a bank loan of $8,500,000 and the balance from
Reserves.
Capital Expenditure as at 30 June 2015
Architects fee/ Consultancy costs 637,217
Additional land purchases and settlement costs 42,475
Quantity surveying costs 66,600
Design Costs 34,987
Project management costs 361,436
Construction Costs 11,930,783
Communication Infrastructure 20,179
Administration costs 5,448
Total Expenditure 13,099,125
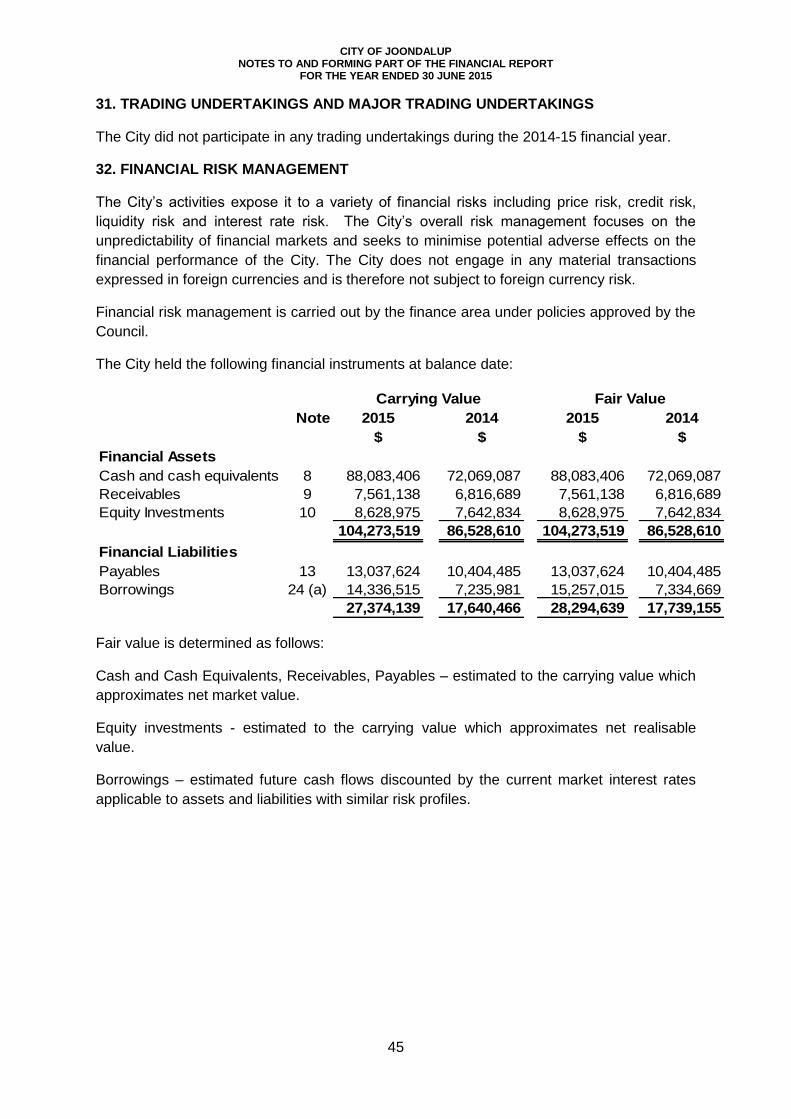
CITY OF JOONDALUP NOTES TO AND FORMING PART OF THE FINANCIAL REPORT
FOR THE YEAR ENDED 30 JUNE 2015
45
31. TRADING UNDERTAKINGS AND MAJOR TRADING UNDERTAKINGS
The City did not participate in any trading undertakings during the 2014-15 financial year.
32. FINANCIAL RISK MANAGEMENT
The City’s activities expose it to a variety of financial risks including price risk, credit risk,
liquidity risk and interest rate risk. The City’s overall risk management focuses on the
unpredictability of financial markets and seeks to minimise potential adverse effects on the
financial performance of the City. The City does not engage in any material transactions
expressed in foreign currencies and is therefore not subject to foreign currency risk.
Financial risk management is carried out by the finance area under policies approved by the
Council.
The City held the following financial instruments at balance date:
Carrying Value Fair Value
2015 2014 2015 2014
$ $ $ $
Financial Assets
Cash and cash equivalents 8 88,083,406 72,069,087 88,083,406 72,069,087
Receivables 9 7,561,138 6,816,689 7,561,138 6,816,689
Equity Investments 10 8,628,975 7,642,834 8,628,975 7,642,834
104,273,519 86,528,610 104,273,519 86,528,610
Financial Liabilities
Payables 13 13,037,624 10,404,485 13,037,624 10,404,485
Borrowings 24 (a) 14,336,515 7,235,981 15,257,015 7,334,669
27,374,139 17,640,466 28,294,639 17,739,155
Note
Fair value is determined as follows:
Cash and Cash Equivalents, Receivables, Payables – estimated to the carrying value which
approximates net market value.
Equity investments - estimated to the carrying value which approximates net realisable
value.
Borrowings – estimated future cash flows discounted by the current market interest rates
applicable to assets and liabilities with similar risk profiles.
CITY OF JOONDALUP NOTES TO AND FORMING PART OF THE FINANCIAL REPORT
FOR THE YEAR ENDED 30 JUNE 2015
46
32. FINANCIAL RISK MANAGEMENT (Continued)
(a) Cash and Cash Equivalents
The City’s objective is to maximise its return on cash and cash equivalents whilst
maintaining an adequate level of liquidity and preserving capital. The finance area manages
the cash and investments portfolio with the assistance of independent advisers (where
applicable). The City has an investment policy which is subject to review by Council. An
Investment Report is provided to Council on a monthly basis setting out the make-up and
performance of the portfolio.
Cash and investments are also subject to interest rate risk – the risk that movements in
interest rates could affect returns.
Another risk associated with cash and cash equivalents is credit risk – the risk that a
contracting entity will not complete its obligations under a financial instrument resulting in a
financial loss to the City.
The City manages these risks by diversifying its portfolio and only places surplus cash with
banking institutions with high credit ratings. The City may also seek advice from independent
advisers (where applicable) before placing any cash and investments.
(b) Receivables
The City’s major receivables comprise rates and annual charges and user charges and fees.
The major risk associated with these receivables is credit risk – the risk that the debts may
not be repaid. The City manages this risk by monitoring outstanding debt and employing
debt recovery policies. It also encourages ratepayers to pay rates by the due date through
various incentives.
Credit risk on rates and annual charges is minimised by the ability of the City to recover
these debts as a secured charge over the land – that is, the land can be sold to recover the
debt. The City is also able to charge interest on overdue rates and annual charges at higher
than market rates, which further encourages payment.
The level of outstanding receivables is reported to Council monthly and benchmarks are set
and monitored for acceptable collection performance.
The City makes suitable provision for doubtful receivables as required and carries out credit
checks on most non-rate debtors.
There are no material receivables that have been subject to a re-negotiation of repayment
terms.
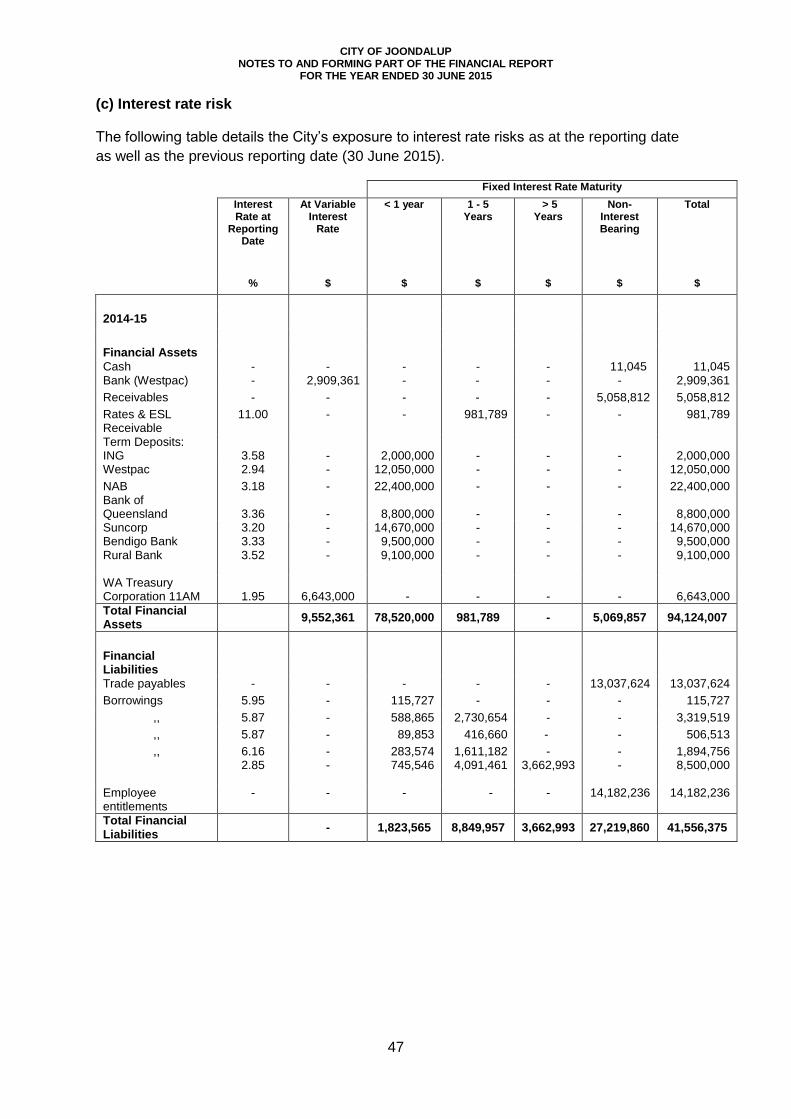
CITY OF JOONDALUP NOTES TO AND FORMING PART OF THE FINANCIAL REPORT
FOR THE YEAR ENDED 30 JUNE 2015
47
(c) Interest rate risk
The following table details the City’s exposure to interest rate risks as at the reporting date
as well as the previous reporting date (30 June 2015).
Fixed Interest Rate Maturity
Interest Rate at
Reporting Date
At Variable Interest
Rate
< 1 year 1 - 5 Years
> 5 Years
Non-Interest Bearing
Total
% $ $ $ $ $ $
2014-15
Financial Assets
Cash - - - - - 11,045
11,045 Bank (Westpac) - 2,909,361 - - - - 2,909,361
Receivables - - - - - 5,058,812 5,058,812
Rates & ESL Receivable
11.00
-
-
981,789
-
-
981,789
Term Deposits: ING
3.58
-
2,000,000
-
-
-
2,000,000
Westpac 2.94 - 12,050,000 - - - 12,050,000
NAB Bank of Queensland
3.18
3.36
- -
22,400,000
8,800,000
- -
- -
- -
22,400,000
8,800,000 Suncorp Bendigo Bank Rural Bank
3.20 3.33 3.52
- - -
14,670,000 9,500,000 9,100,000
- - -
- - -
- - -
14,670,000 9,500,000 9,100,000
WA Treasury Corporation 11AM
1.95
6,643,000
-
-
-
-
6,643,000
Total Financial Assets
9,552,361 78,520,000 981,789 - 5,069,857 94,124,007
Financial Liabilities
Trade payables - - - - - 13,037,624 13,037,624
Borrowings 5.95 - 115,727 - - - 115,727
,, 5.87 - 588,865 2,730,654 - - 3,319,519
,, 5.87 - 89,853 416,660 -- - 506,513
,,
6.16 2.85
- -
283,574 745,546
1,611,182 4,091,461
- 3,662,993
-
- -
1,894,756 8,500,000
Employee entitlements
- - - - - 14,182,236 14,182,236
Total Financial Liabilities
- 1,823,565 8,849,957 3,662,993 27,219,860 41,556,375

CITY OF JOONDALUP NOTES TO AND FORMING PART OF THE FINANCIAL REPORT
FOR THE YEAR ENDED 30 JUNE 2015
48
Fixed Interest Rate Maturity
Interest Rate at
Reporting Date
At Variable Interest
Rate
< 1 year 1 - 5 Years
> 5 Years
Non-Interest Bearing
Total
% $ $ $ $ $ $
2013-14
Financial Assets
Cash - - - - - 10,045
10,045 Bank (Westpac) - 146,042 - - - - 146,042
Receivables - - - - - 4,149,279 4,149,279
Rates & ESL Receivable
11.00
-
-
796,290
-
-
796,290
Term Deposits: ING
3.78
-
9,000,000
-
-
-
9,000,000
Westpac 3.72 - 15,600,000 - - - 15,600,000
NAB Bank of Queensland
3.73
3.81
- -
13,500,000
8,000,000
- -
- -
- -
13,500,000
8,000,000 Suncorp Bendigo Bank Rural Bank St.George Bank
3.68 3.75 3.82 3.75
- - - -
1,000,000 6,700,000 11,000,000 4,000,000
- - - -
- - - -
- - - -
1,000,000 6,700,000
11,000,000 4,000,000
WA Treasury Corporation 11AM
2.45
3,113,000
-
-
-
-
3,113,000
Total Financial Assets
3,259,042 68,800,000 796,290 - 4,159,324 77,014,656
Financial Liabilities
Trade payables - - - - - 10,404,485 10,404,485
Borrowings 5.79 - 109,091 115,727 - - 224,818
,, 5.95 - 383,320 - - - 383,320
,, 5.87 - 555,531 2,576,077 743,442 - 3,875,050
,, 5.87 - 84,766 506,513 - - - 591,279
,, 6.16 - 266,758 1,608,257 286,499 -
- 2,161,514
Employee entitlements
- - - - - 13,836,098 13,836,098
Total Financial Liabilities
- 1,399,466 4,806,574 1,029,941 24,240,583 31,476,564
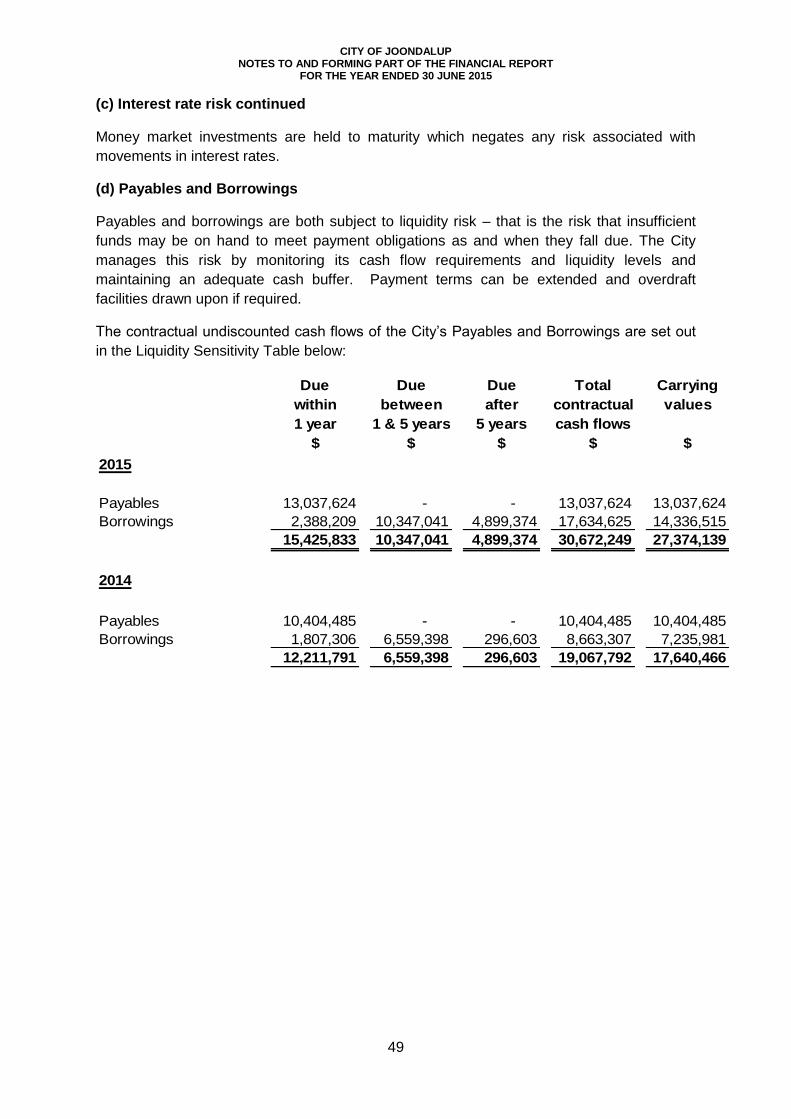
CITY OF JOONDALUP NOTES TO AND FORMING PART OF THE FINANCIAL REPORT
FOR THE YEAR ENDED 30 JUNE 2015
49
(c) Interest rate risk continued
Money market investments are held to maturity which negates any risk associated with
movements in interest rates.
(d) Payables and Borrowings
Payables and borrowings are both subject to liquidity risk – that is the risk that insufficient
funds may be on hand to meet payment obligations as and when they fall due. The City
manages this risk by monitoring its cash flow requirements and liquidity levels and
maintaining an adequate cash buffer. Payment terms can be extended and overdraft
facilities drawn upon if required.
The contractual undiscounted cash flows of the City’s Payables and Borrowings are set out
in the Liquidity Sensitivity Table below:
Due Due Due Total Carrying
within between after contractual values
1 year 1 & 5 years 5 years cash flows
$ $ $ $ $
2015
Payables 13,037,624 - - 13,037,624 13,037,624
Borrowings 2,388,209 10,347,041 4,899,374 17,634,625 14,336,515
15,425,833 10,347,041 4,899,374 30,672,249 27,374,139
2014
Payables 10,404,485 - - 10,404,485 10,404,485
Borrowings 1,807,306 6,559,398 296,603 8,663,307 7,235,981
12,211,791 6,559,398 296,603 19,067,792 17,640,466
CITY OF JOONDALUP NOTES TO AND FORMING PART OF THE FINANCIAL REPORT
FOR THE YEAR ENDED 30 JUNE 2015
50
33. EVENTS AFTER THE REPORTING DATE
There were no material events after 30 June 2015 that require inclusion in the notes to the
financial statements.
34. TOWN PLANNING AND LAND DEVELOPMENT SCHEME – MINDARIE
In June 1978 Lot 17 Marmion Avenue, Mindarie, a 432 hectare property situated
approximately 2 kilometres north of Burns Beach and 30 kilometres north of the Perth City
Centre was purchased jointly by the former City of Wanneroo, the former City of Perth and
the City of Stirling as tenants in common in equal shares to provide for a future sanitary
disposal site.
Subsequently, the Mindarie Regional Council was established by the three Councils and in
1990 leased approximately 251 hectares for this purpose. The lease provides for an initial
term of 21 years, with an option for renewal for a further 21 years.
On 1 July 1998 the former City of Wanneroo’s one third share was split equally between the
City of Joondalup and the City of Wanneroo, in accordance with the Joondalup and
Wanneroo Order 1998, with the assets and liabilities allocated by determination of the Joint
Commissioners.
It is envisaged that the southern portion of Lot 17 encompassing the leased area will
eventually be used for regional open space/recreational purposes. The north and western
portions are being subdivided and developed for residential purposes by the Tamala Park
Regional Council (Note 10).
35. JOONDALUP NORMALISATION AGREEMENT
During 2004, the City of Joondalup and the Western Australia Land Authority (LandCorp)
entered into a Memorandum of Agreement to complete the normalisation of the City of
Joondalup. The Memorandum of Agreement (MOA) recognises the historical evolution and
contemporary position of Joondalup in terms of the Western Australia Land Authority Act
1992 (as amended) and the “Joondalup Centre Plan – Completion 2001 Modification”. The
process of “normalisation” is a transitional process through which the strategic regional
centre would become operationally and perceptionally transformed from a development
project to an established centre.
The Memorandum of Agreement (MOA) required LandCorp to make a contribution of
$5.24m to the City of Joondalup for works previously completed by the City and to be carried
out by the City in the future. The terms of settlement are not specified in the agreement
however the City received $1.9m in June 2004 and brought this revenue to account in 2003-
04. The City received $2.8m during 2005-06 as further settlement and this was recognised
as revenue during 2005-06. The final payment of $540,000 was conditional on LandCorp
receiving possession of Lot 701 at the corner of Collier Pass and Joondalup Drive, which
was leased to the City until December 2007. The lease has now expired and the City is still
in possession of the land on holdover provisions, subject to further negotiation and
agreement with LandCorp.
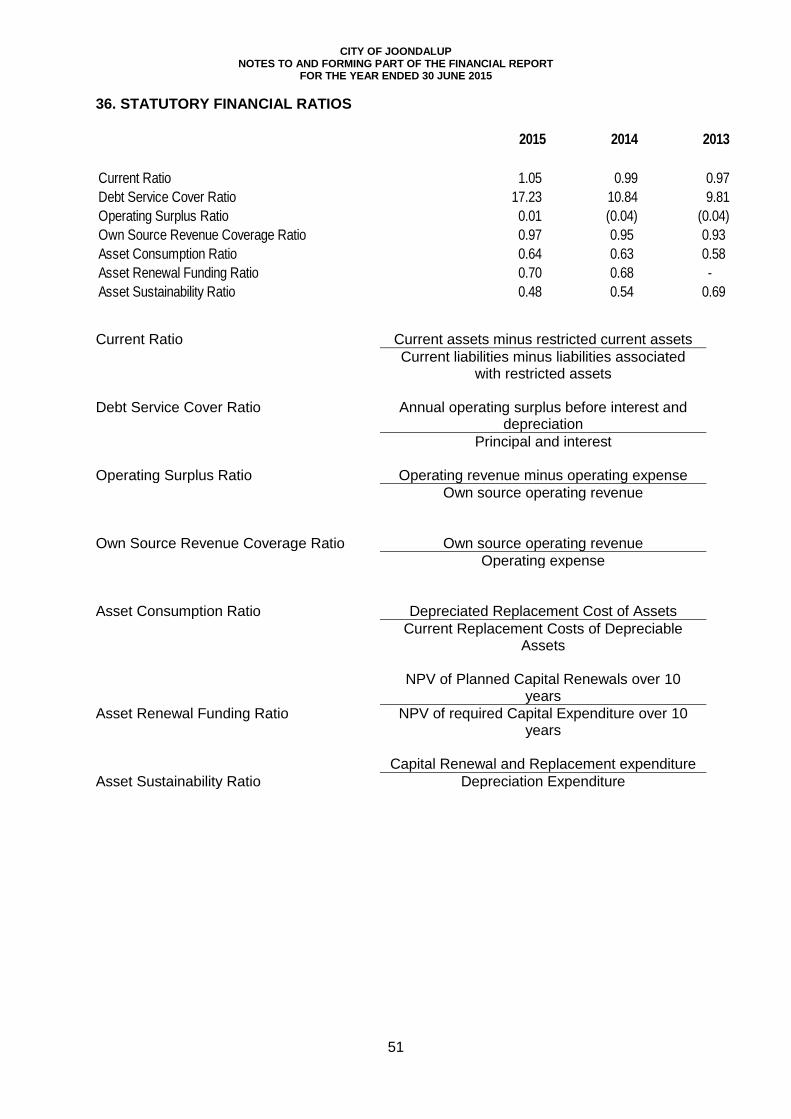
CITY OF JOONDALUP NOTES TO AND FORMING PART OF THE FINANCIAL REPORT
FOR THE YEAR ENDED 30 JUNE 2015
51
36. STATUTORY FINANCIAL RATIOS
2015 2014 2013
Current Ratio 1.05 0.99 0.97
Debt Service Cover Ratio 17.23 10.84 9.81
Operating Surplus Ratio 0.01 (0.04) (0.04)
Own Source Revenue Coverage Ratio 0.97 0.95 0.93
Asset Consumption Ratio 0.64 0.63 0.58
Asset Renewal Funding Ratio 0.70 0.68 -
Asset Sustainability Ratio 0.48 0.54 0.69
Current Ratio Current assets minus restricted current assets
Current liabilities minus liabilities associated with restricted assets
Debt Service Cover Ratio Annual operating surplus before interest and
depreciation
Principal and interest Operating Surplus Ratio Operating revenue minus operating expense
Own source operating revenue Own Source Revenue Coverage Ratio Own source operating revenue
Operating expense Asset Consumption Ratio Depreciated Replacement Cost of Assets
Current Replacement Costs of Depreciable Assets
NPV of Planned Capital Renewals over 10
years
Asset Renewal Funding Ratio NPV of required Capital Expenditure over 10 years
Capital Renewal and Replacement expenditure
Asset Sustainability Ratio Depreciation Expenditure

52
1 SIGNIFICANT ACCOUNTING POLICIES (CONTINUED)
New Accounting Standards and Interpretations for Application in Future Periods
The AASB has issued a number of new and amended Accounting Standards and Interpretations that have mandatory application dates for future reporting periods, some of which are relevant to the Council.
Management’s assessment of the new and amended pronouncements that are relevant to the Council, applicable to future reporting periods and which have not yet been adopted are set out as follows.
Title Issued / Compiled
Applicable(1)
Impact
(i) AASB 9 – Financial Instruments
(incorporating AASB 2014-7 and AASB 2014-8)
December 2014
1 January 2018
Nil – The objective of this Standard is to improve and simplify the approach for classification and measurement of financial assets compared with the requirements of AASB 139. Given the nature of the financial assets of the Council, it is not anticipated the standard will have any material effect.
(ii) AASB 2010 – 7 Amendments to Australian Accounting Standards arising from AASB 9 (December 2010)
[AASB 1, 3, 4, 5, 7, 101, 102, 108, 112, 118, 120, 121, 127, 128, 131, 132, 136, 137, 139, 1023 & 1038 and Interpretations 2, 5, 10, 12, 19 & 127]
December 2013
1 January 2018
Nil – The revisions embodied in this standard give effect to the consequential changes arising from the issuance of AASB 9 which is not anticipated to have any material effect on the Council (refer (i) above).
(iii) AASB 15 Revenue from Contracts with customers
December 2014
1 January 2017
This Standard establishes principles for entities to apply to report useful information to users of financial statements about the nature, amount, timing and uncertainty of revenue and cash flows arising from a contract with a customer. The effect of this Standard will depend upon the nature of future transactions the City has with those third parties it has dealings with. It may or may not be significant.
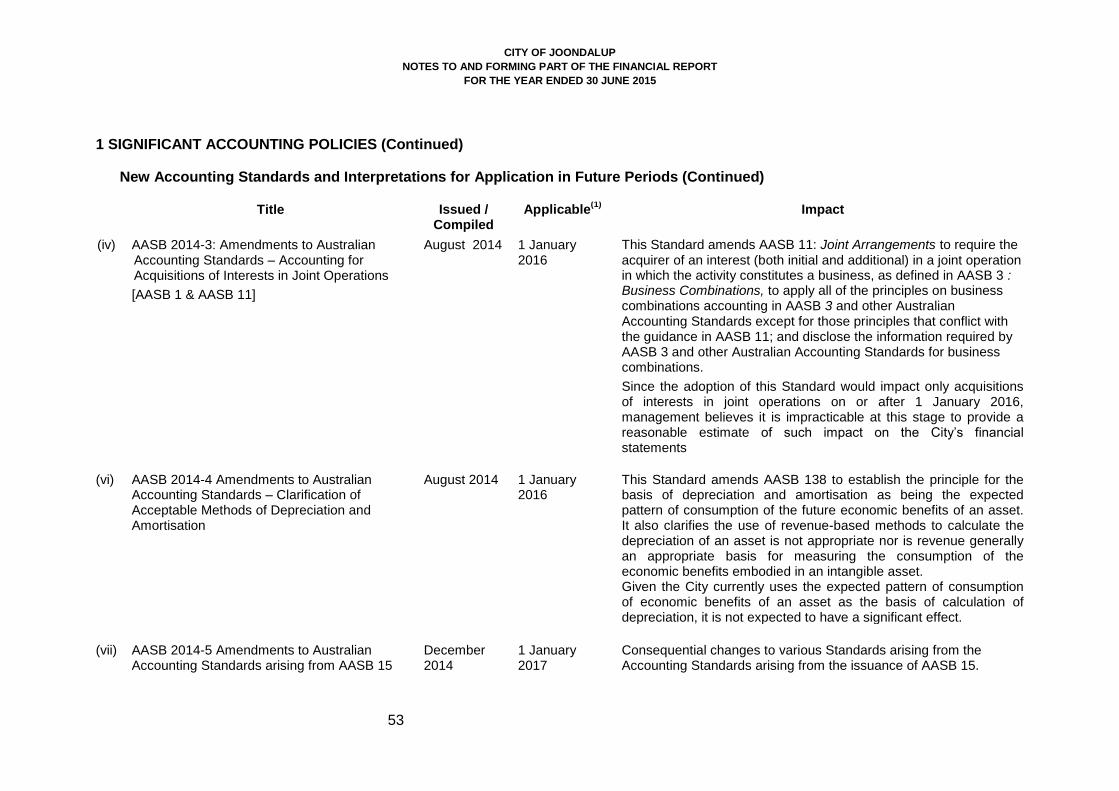
CITY OF JOONDALUP
NOTES TO AND FORMING PART OF THE FINANCIAL REPORT
FOR THE YEAR ENDED 30 JUNE 2015
53
1 SIGNIFICANT ACCOUNTING POLICIES (Continued)
New Accounting Standards and Interpretations for Application in Future Periods (Continued)
Title Issued / Compiled
Applicable(1)
Impact
(iv) AASB 2014-3: Amendments to Australian Accounting Standards – Accounting for Acquisitions of Interests in Joint Operations
[AASB 1 & AASB 11]
August 2014 1 January 2016
This Standard amends AASB 11: Joint Arrangements to require the acquirer of an interest (both initial and additional) in a joint operation in which the activity constitutes a business, as defined in AASB 3 : Business Combinations, to apply all of the principles on business combinations accounting in AASB 3 and other Australian Accounting Standards except for those principles that conflict with the guidance in AASB 11; and disclose the information required by AASB 3 and other Australian Accounting Standards for business combinations.
Since the adoption of this Standard would impact only acquisitions of interests in joint operations on or after 1 January 2016, management believes it is impracticable at this stage to provide a reasonable estimate of such impact on the City’s financial statements
(vi) AASB 2014-4 Amendments to Australian Accounting Standards – Clarification of Acceptable Methods of Depreciation and Amortisation
August 2014 1 January 2016
This Standard amends AASB 138 to establish the principle for the basis of depreciation and amortisation as being the expected pattern of consumption of the future economic benefits of an asset. It also clarifies the use of revenue-based methods to calculate the depreciation of an asset is not appropriate nor is revenue generally an appropriate basis for measuring the consumption of the economic benefits embodied in an intangible asset. Given the City currently uses the expected pattern of consumption of economic benefits of an asset as the basis of calculation of depreciation, it is not expected to have a significant effect.
(vii) AASB 2014-5 Amendments to Australian Accounting Standards arising from AASB 15
December 2014
1 January 2017
Consequential changes to various Standards arising from the Accounting Standards arising from the issuance of AASB 15.
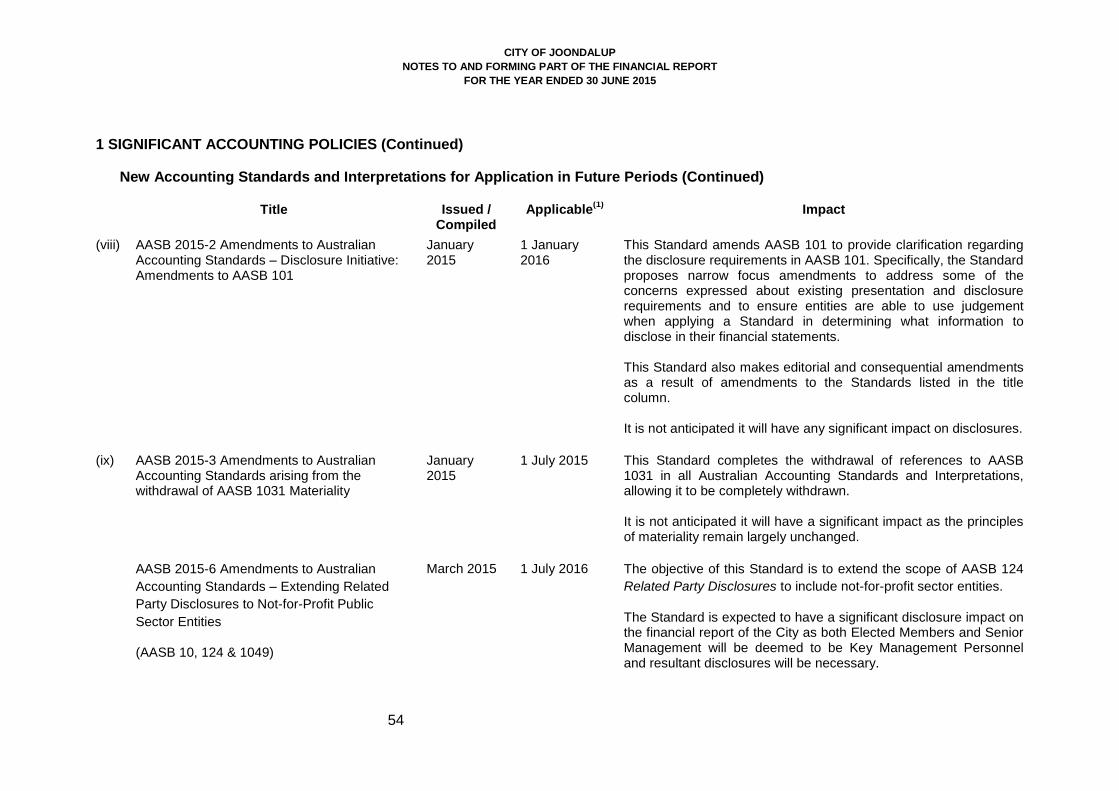
CITY OF JOONDALUP
NOTES TO AND FORMING PART OF THE FINANCIAL REPORT
FOR THE YEAR ENDED 30 JUNE 2015
54
1 SIGNIFICANT ACCOUNTING POLICIES (Continued)
New Accounting Standards and Interpretations for Application in Future Periods (Continued)
Title Issued / Compiled
Applicable(1)
Impact
(viii) AASB 2015-2 Amendments to Australian Accounting Standards – Disclosure Initiative: Amendments to AASB 101
January 2015
1 January 2016
This Standard amends AASB 101 to provide clarification regarding the disclosure requirements in AASB 101. Specifically, the Standard proposes narrow focus amendments to address some of the concerns expressed about existing presentation and disclosure requirements and to ensure entities are able to use judgement when applying a Standard in determining what information to disclose in their financial statements. This Standard also makes editorial and consequential amendments as a result of amendments to the Standards listed in the title column. It is not anticipated it will have any significant impact on disclosures.
(ix) AASB 2015-3 Amendments to Australian Accounting Standards arising from the withdrawal of AASB 1031 Materiality
January 2015
1 July 2015 This Standard completes the withdrawal of references to AASB 1031 in all Australian Accounting Standards and Interpretations, allowing it to be completely withdrawn. It is not anticipated it will have a significant impact as the principles of materiality remain largely unchanged.
AASB 2015-6 Amendments to Australian
Accounting Standards – Extending Related
Party Disclosures to Not-for-Profit Public
Sector Entities
(AASB 10, 124 & 1049)
March 2015
1 July 2016 The objective of this Standard is to extend the scope of AASB 124
Related Party Disclosures to include not-for-profit sector entities.
The Standard is expected to have a significant disclosure impact on the financial report of the City as both Elected Members and Senior Management will be deemed to be Key Management Personnel and resultant disclosures will be necessary.

CITY OF JOONDALUP
NOTES TO AND FORMING PART OF THE FINANCIAL REPORT
FOR THE YEAR ENDED 30 JUNE 2015
55
1 SIGNIFICANT ACCOUNTING POLICIES (Continued)
New Accounting Standards and Interpretations for Application in Future Periods (Continued)
Notes: (1) Applicable to reporting periods commencing on or after the given date.
Adoption of New and Revised Accounting Standards
During the current year, the Council adopted all of the new and revised Australian Accounting Standards and Interpretations which were compiled, became mandatory and which were applicable to its operations.
These new and revised standards were:
AASB 2011-7
AASB 2012-3
AASB 2013-3
AASB 2013-8
AASB 2013-9 Parts A & B
Most of the standards adopted had a minimal effect on the accounting and reporting practices of the Council as they did not have a significant impact on the accounting or reporting practices or were either not applicable, largely editorial in nature, were revisions to help ensure consistency with presentation, recognition and measurement criteria of IFRSs or related to topics not relevant to operations.